
Real-Time Measurement of Atmospheric CO2, CH4 and N2O above Rice Fields Based on Laser Heterodyne Radiometers (LHR)
 ,
,  and
and 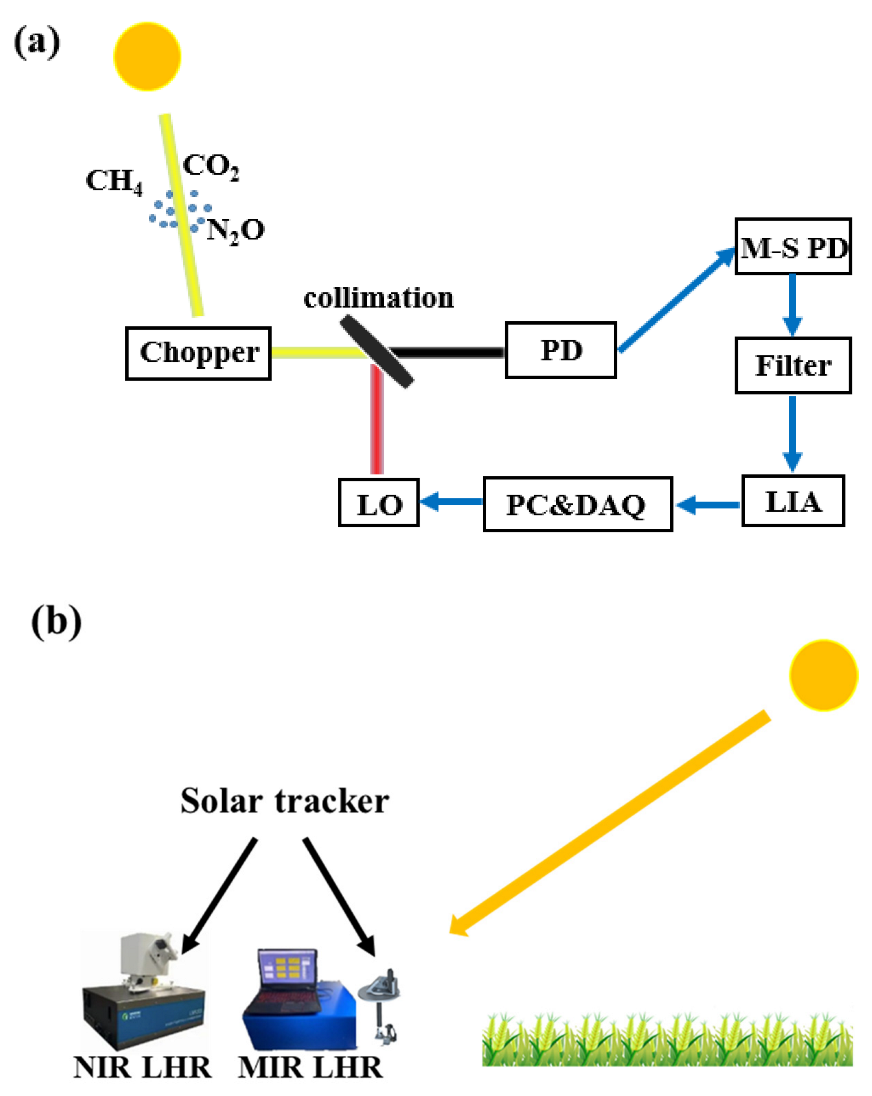
Abstract
:1. Introduction
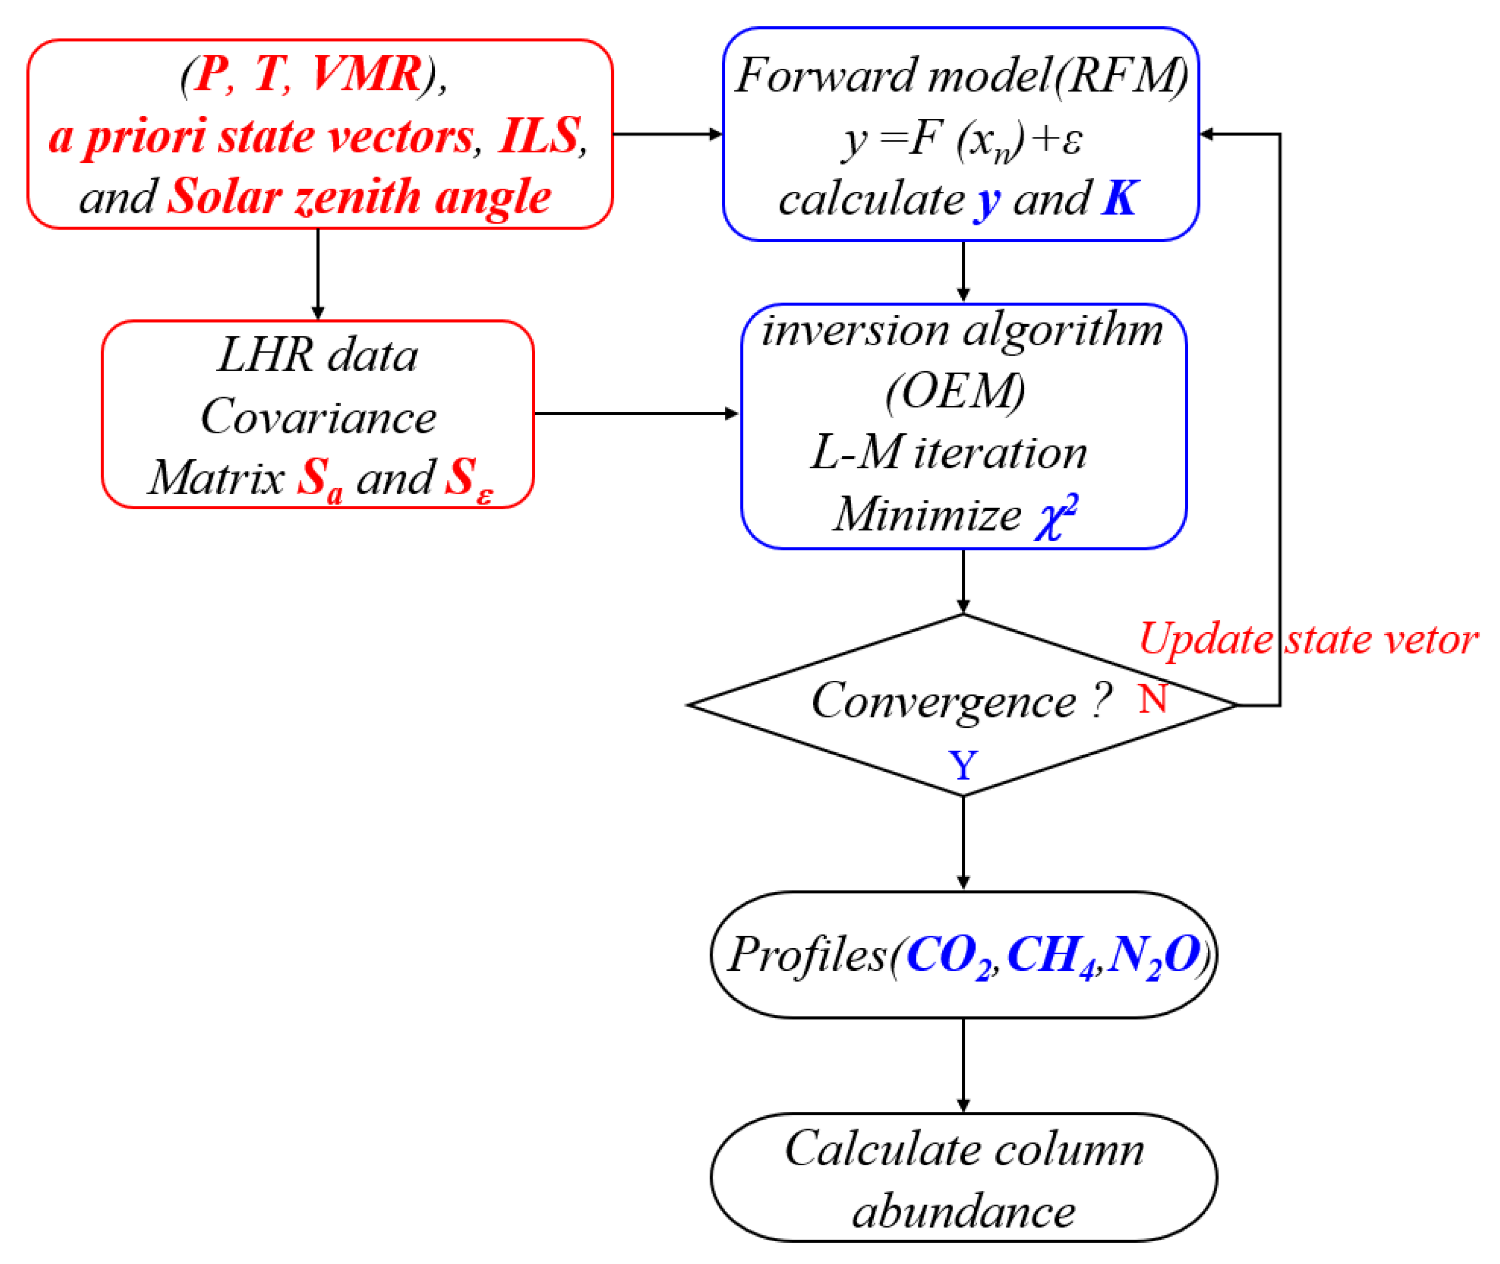
2. Materials and Methods
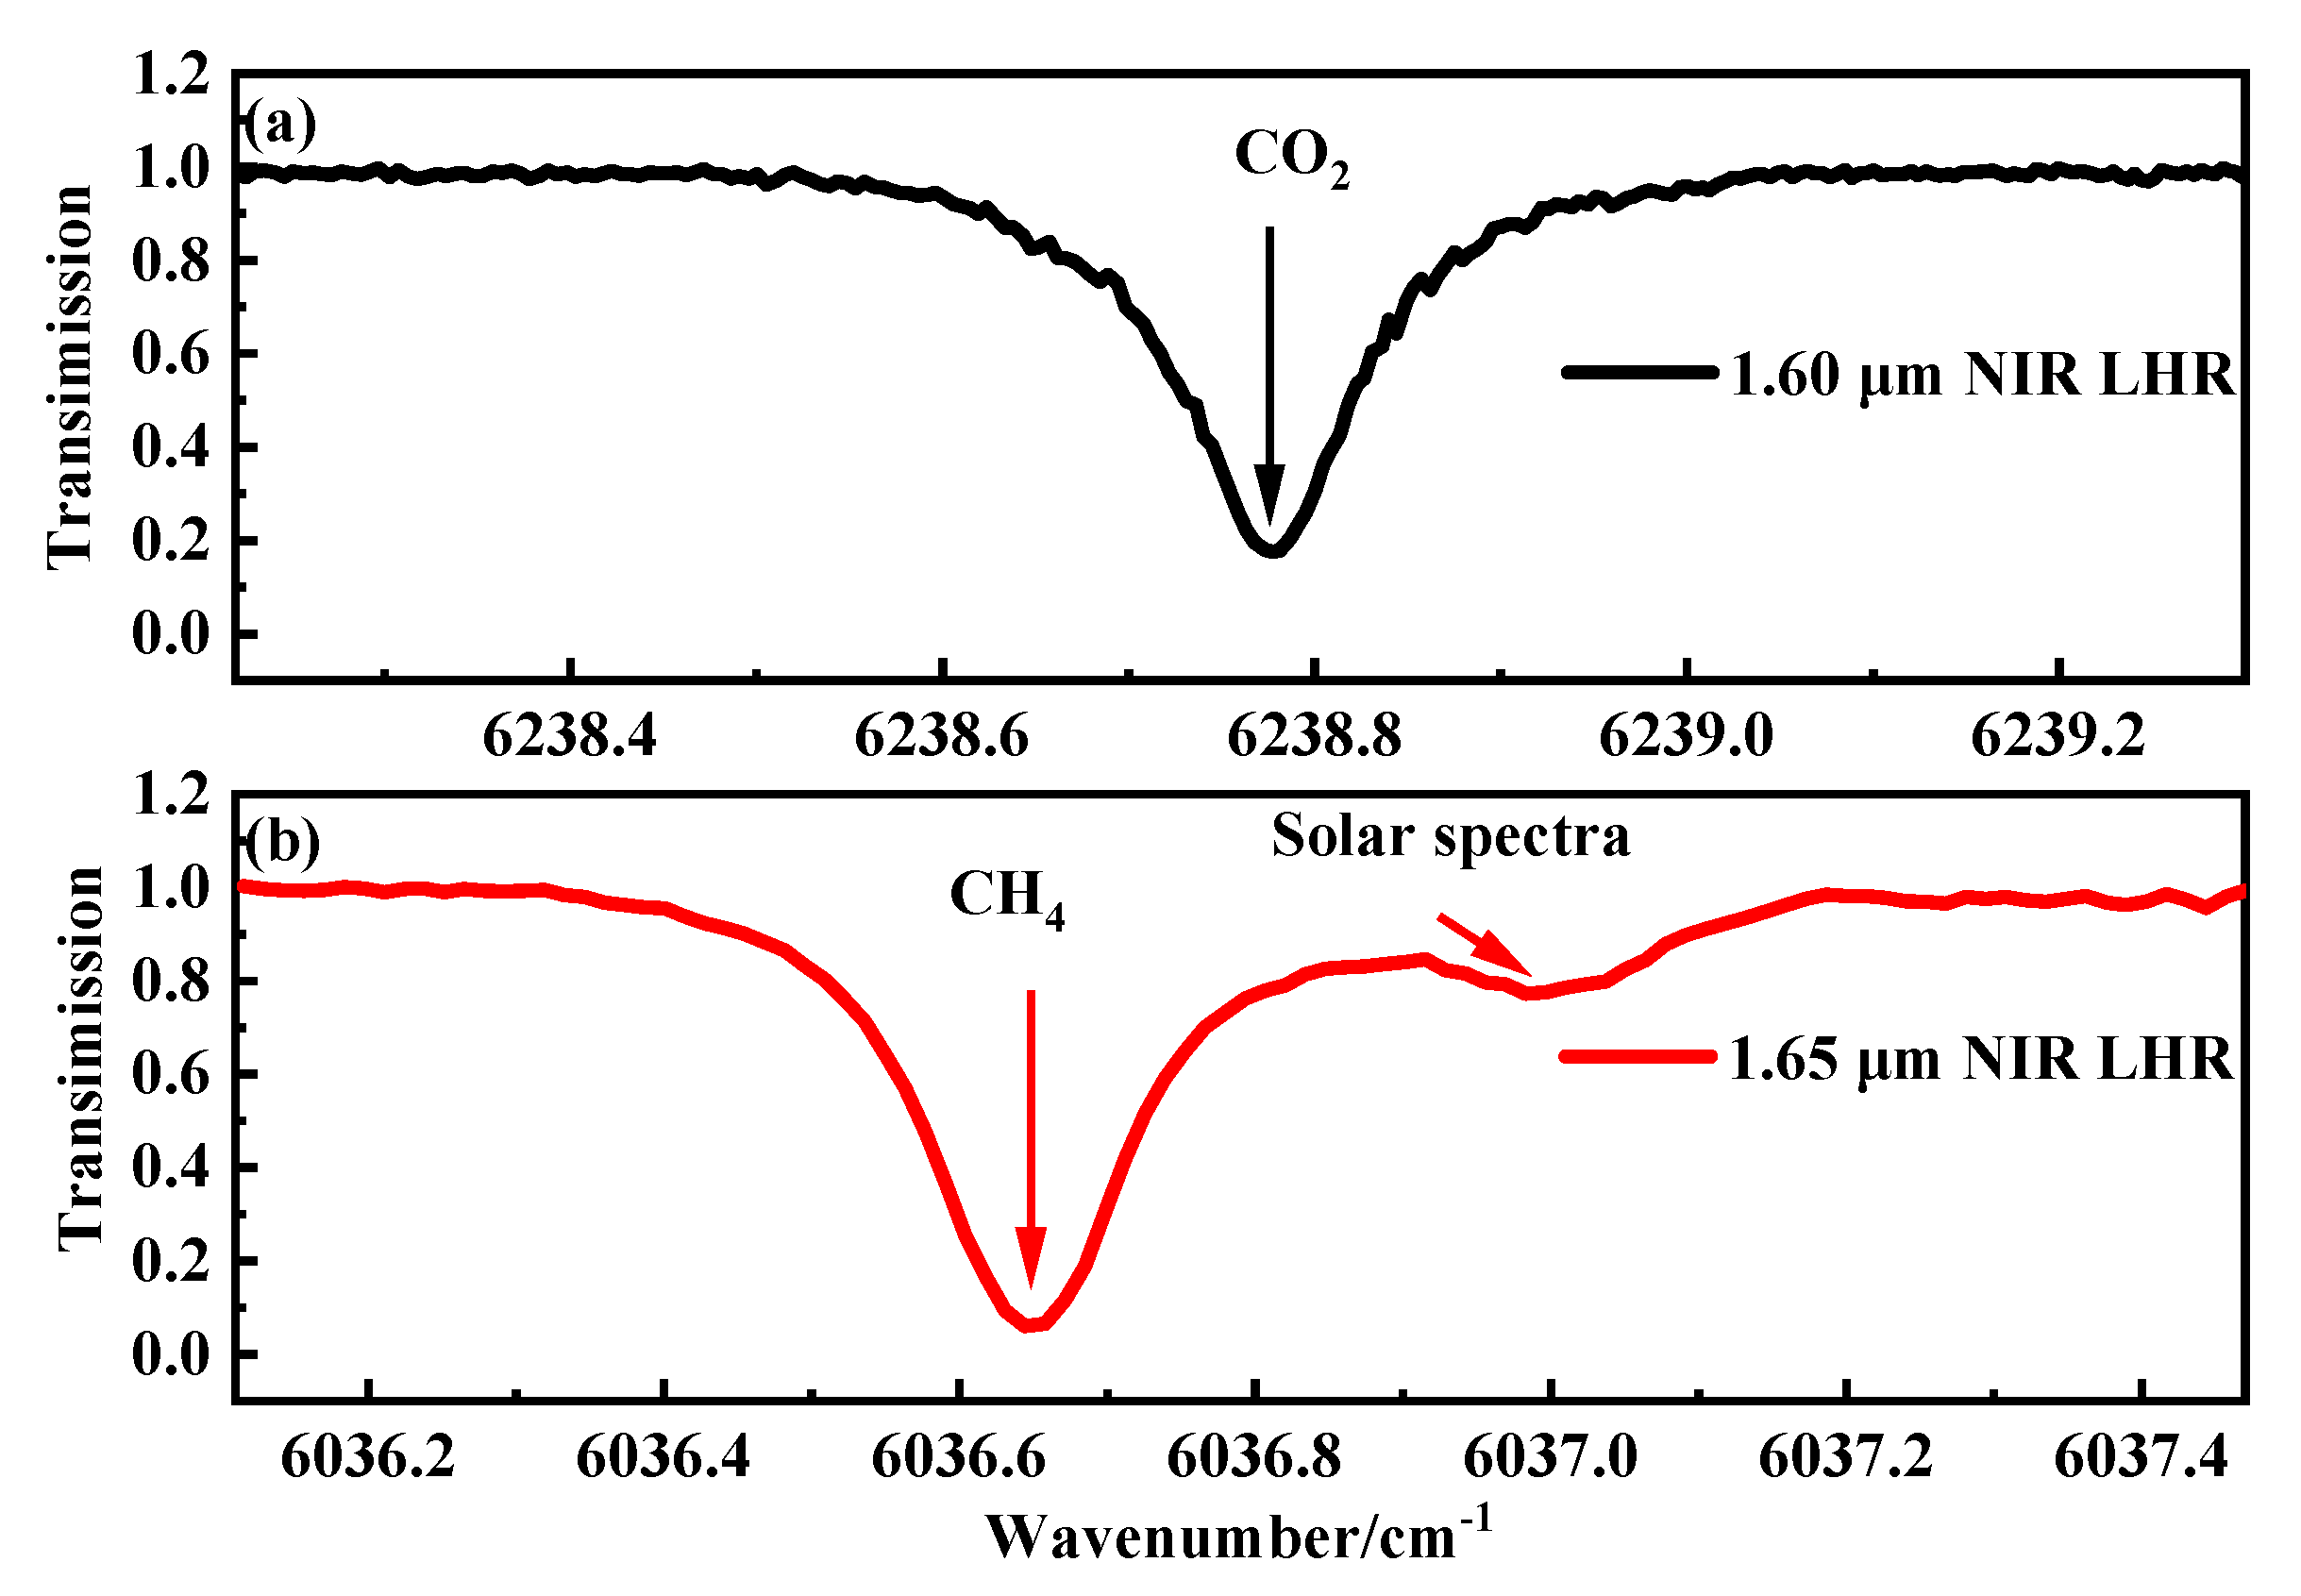
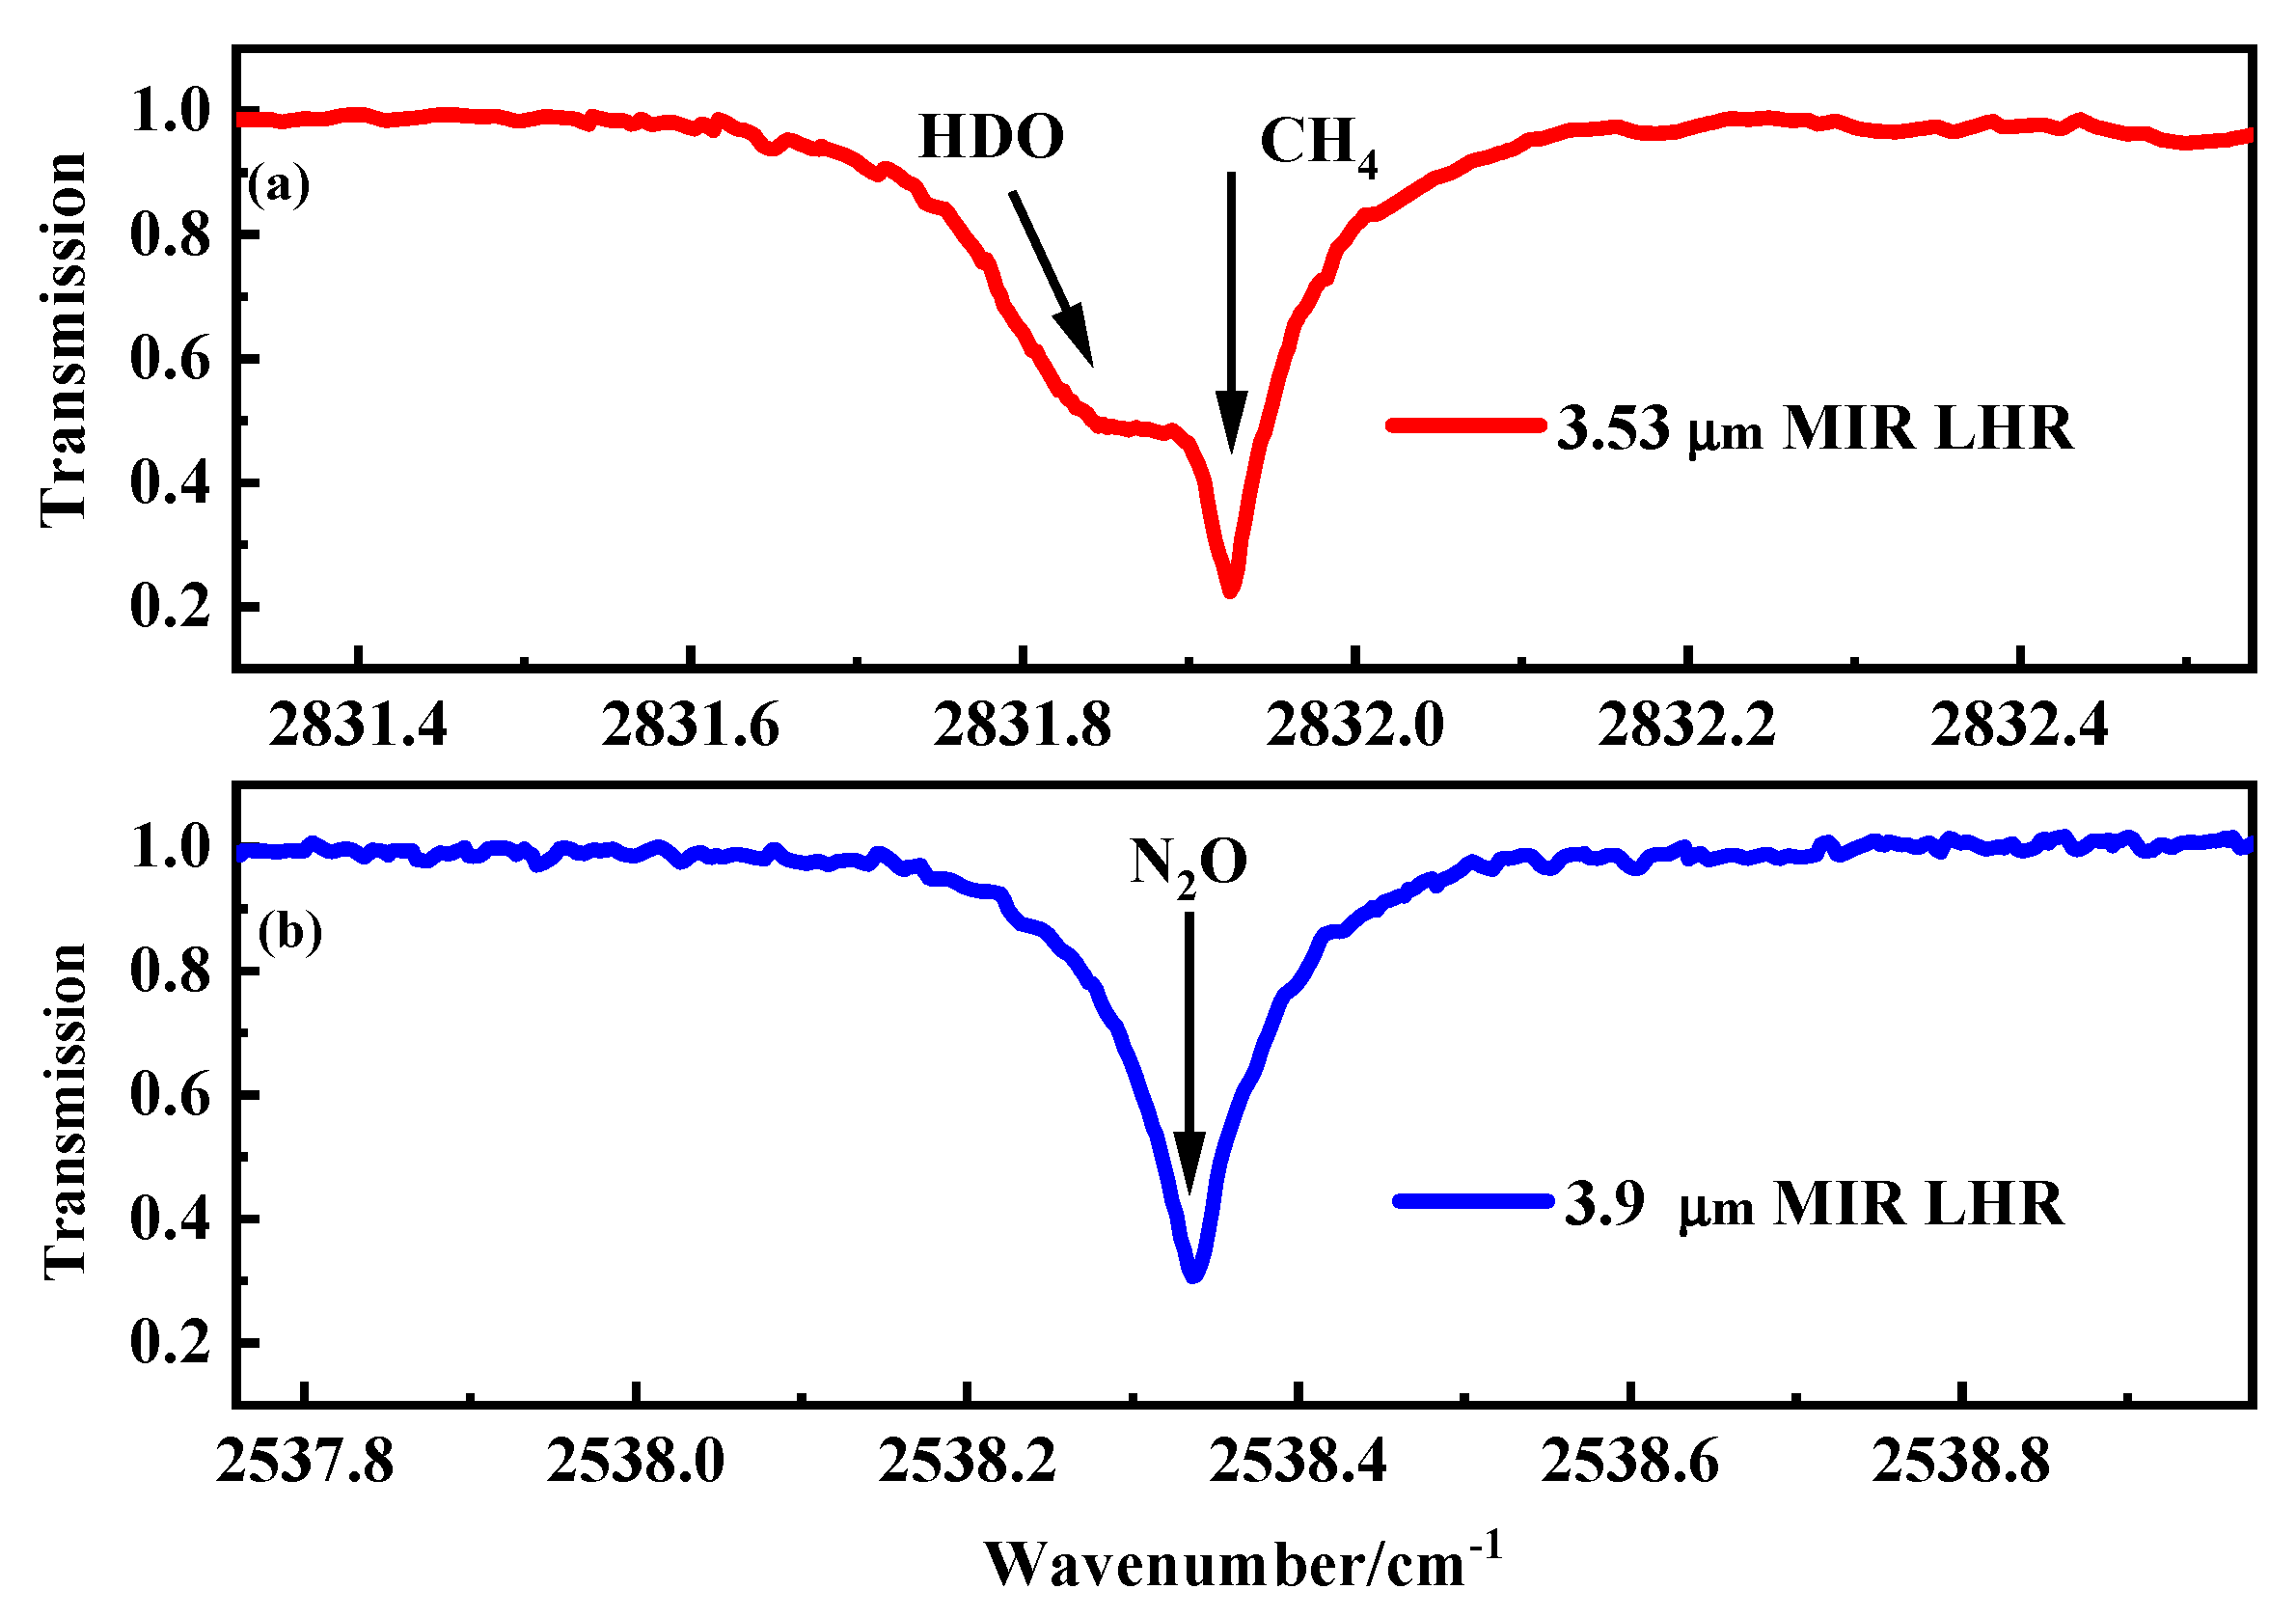
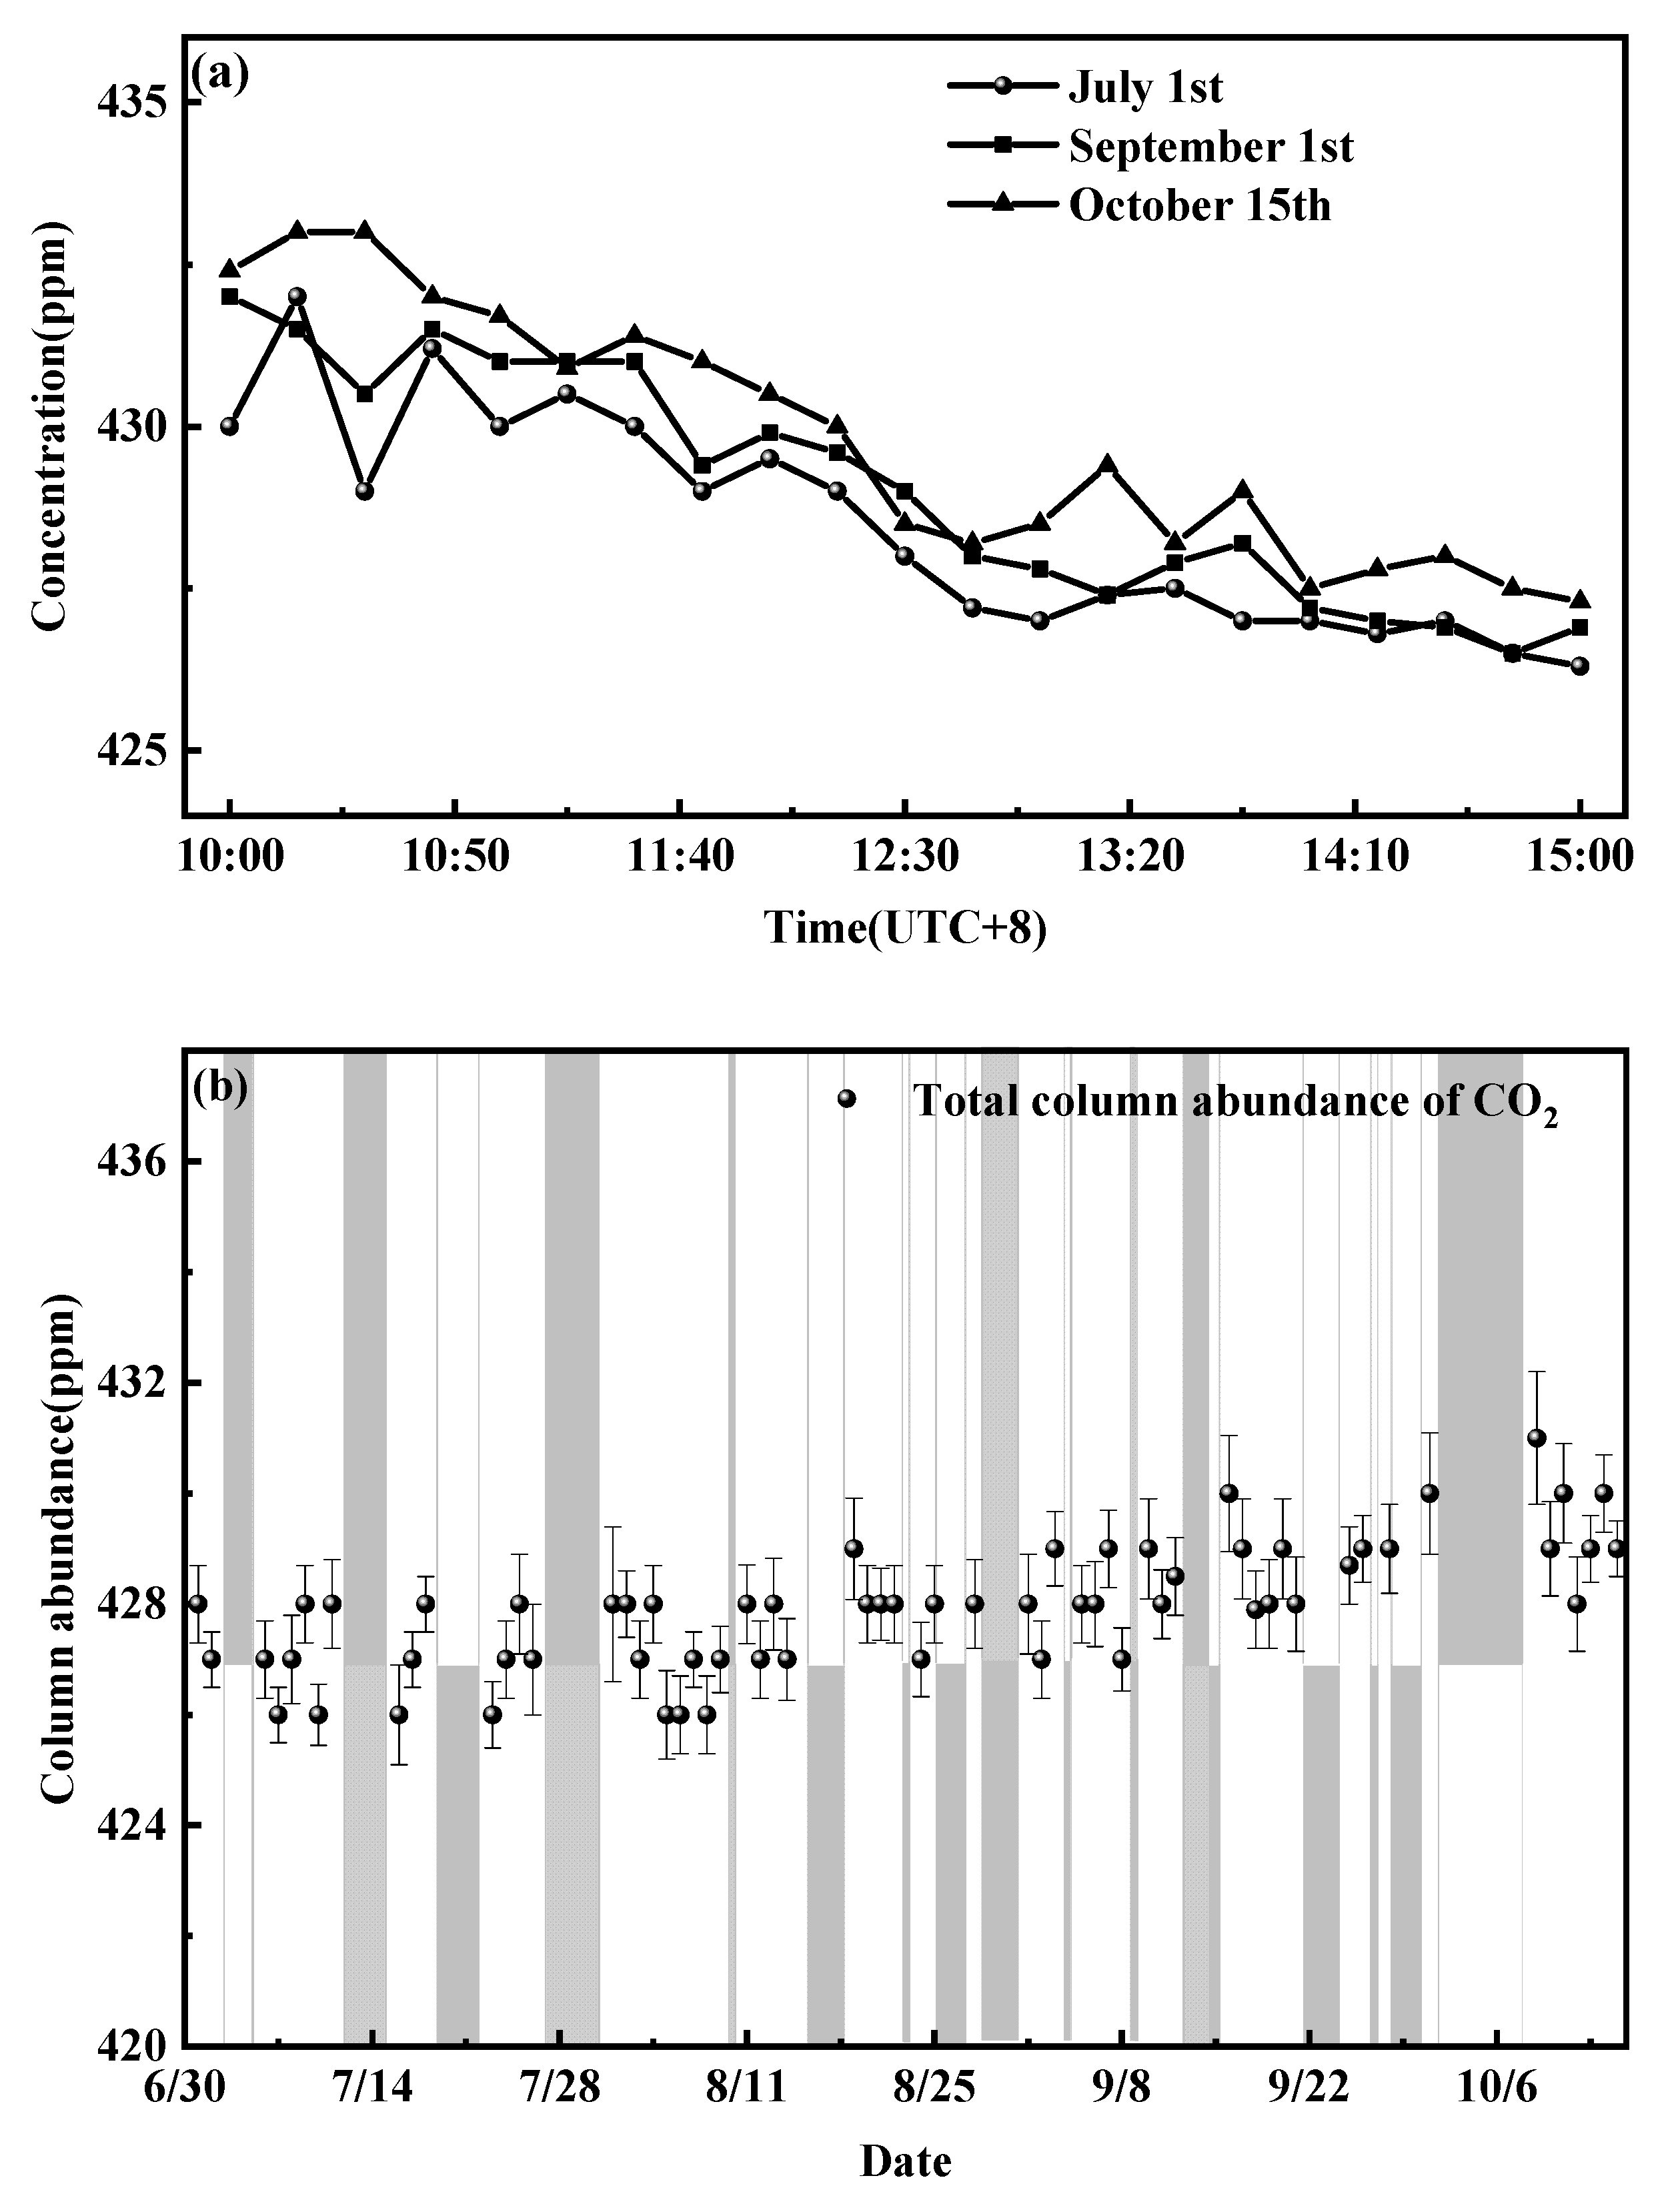
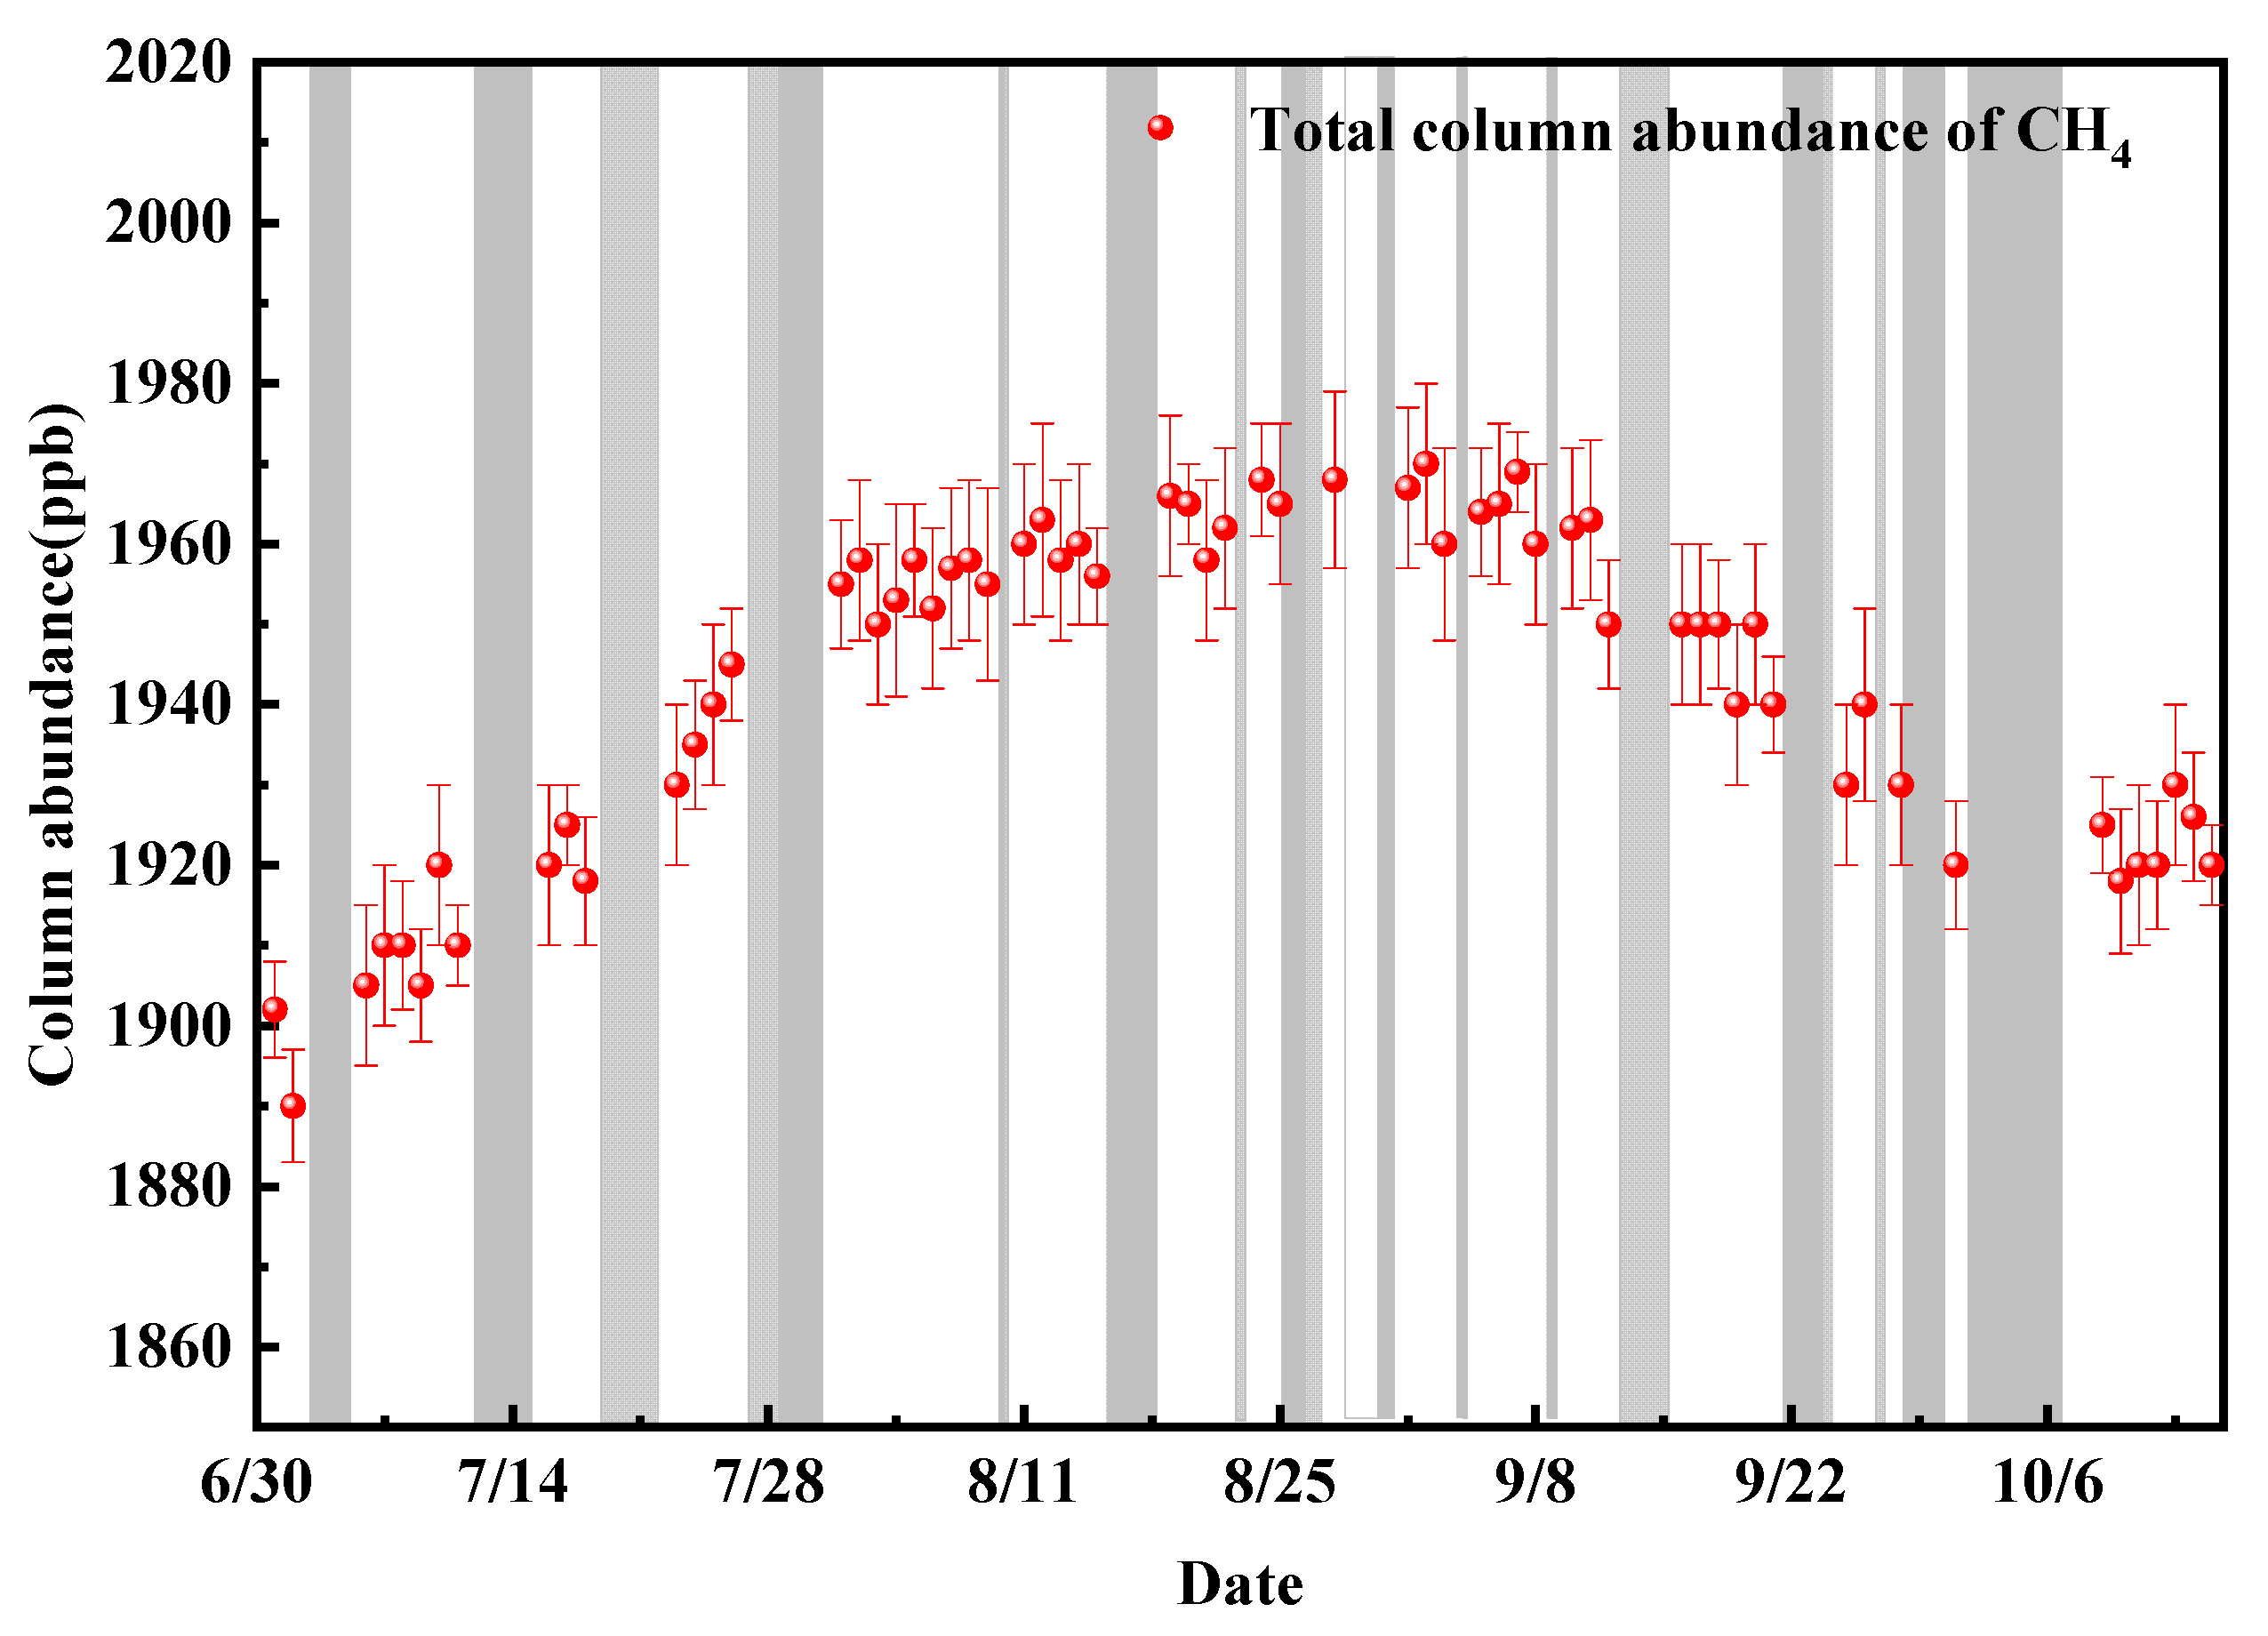
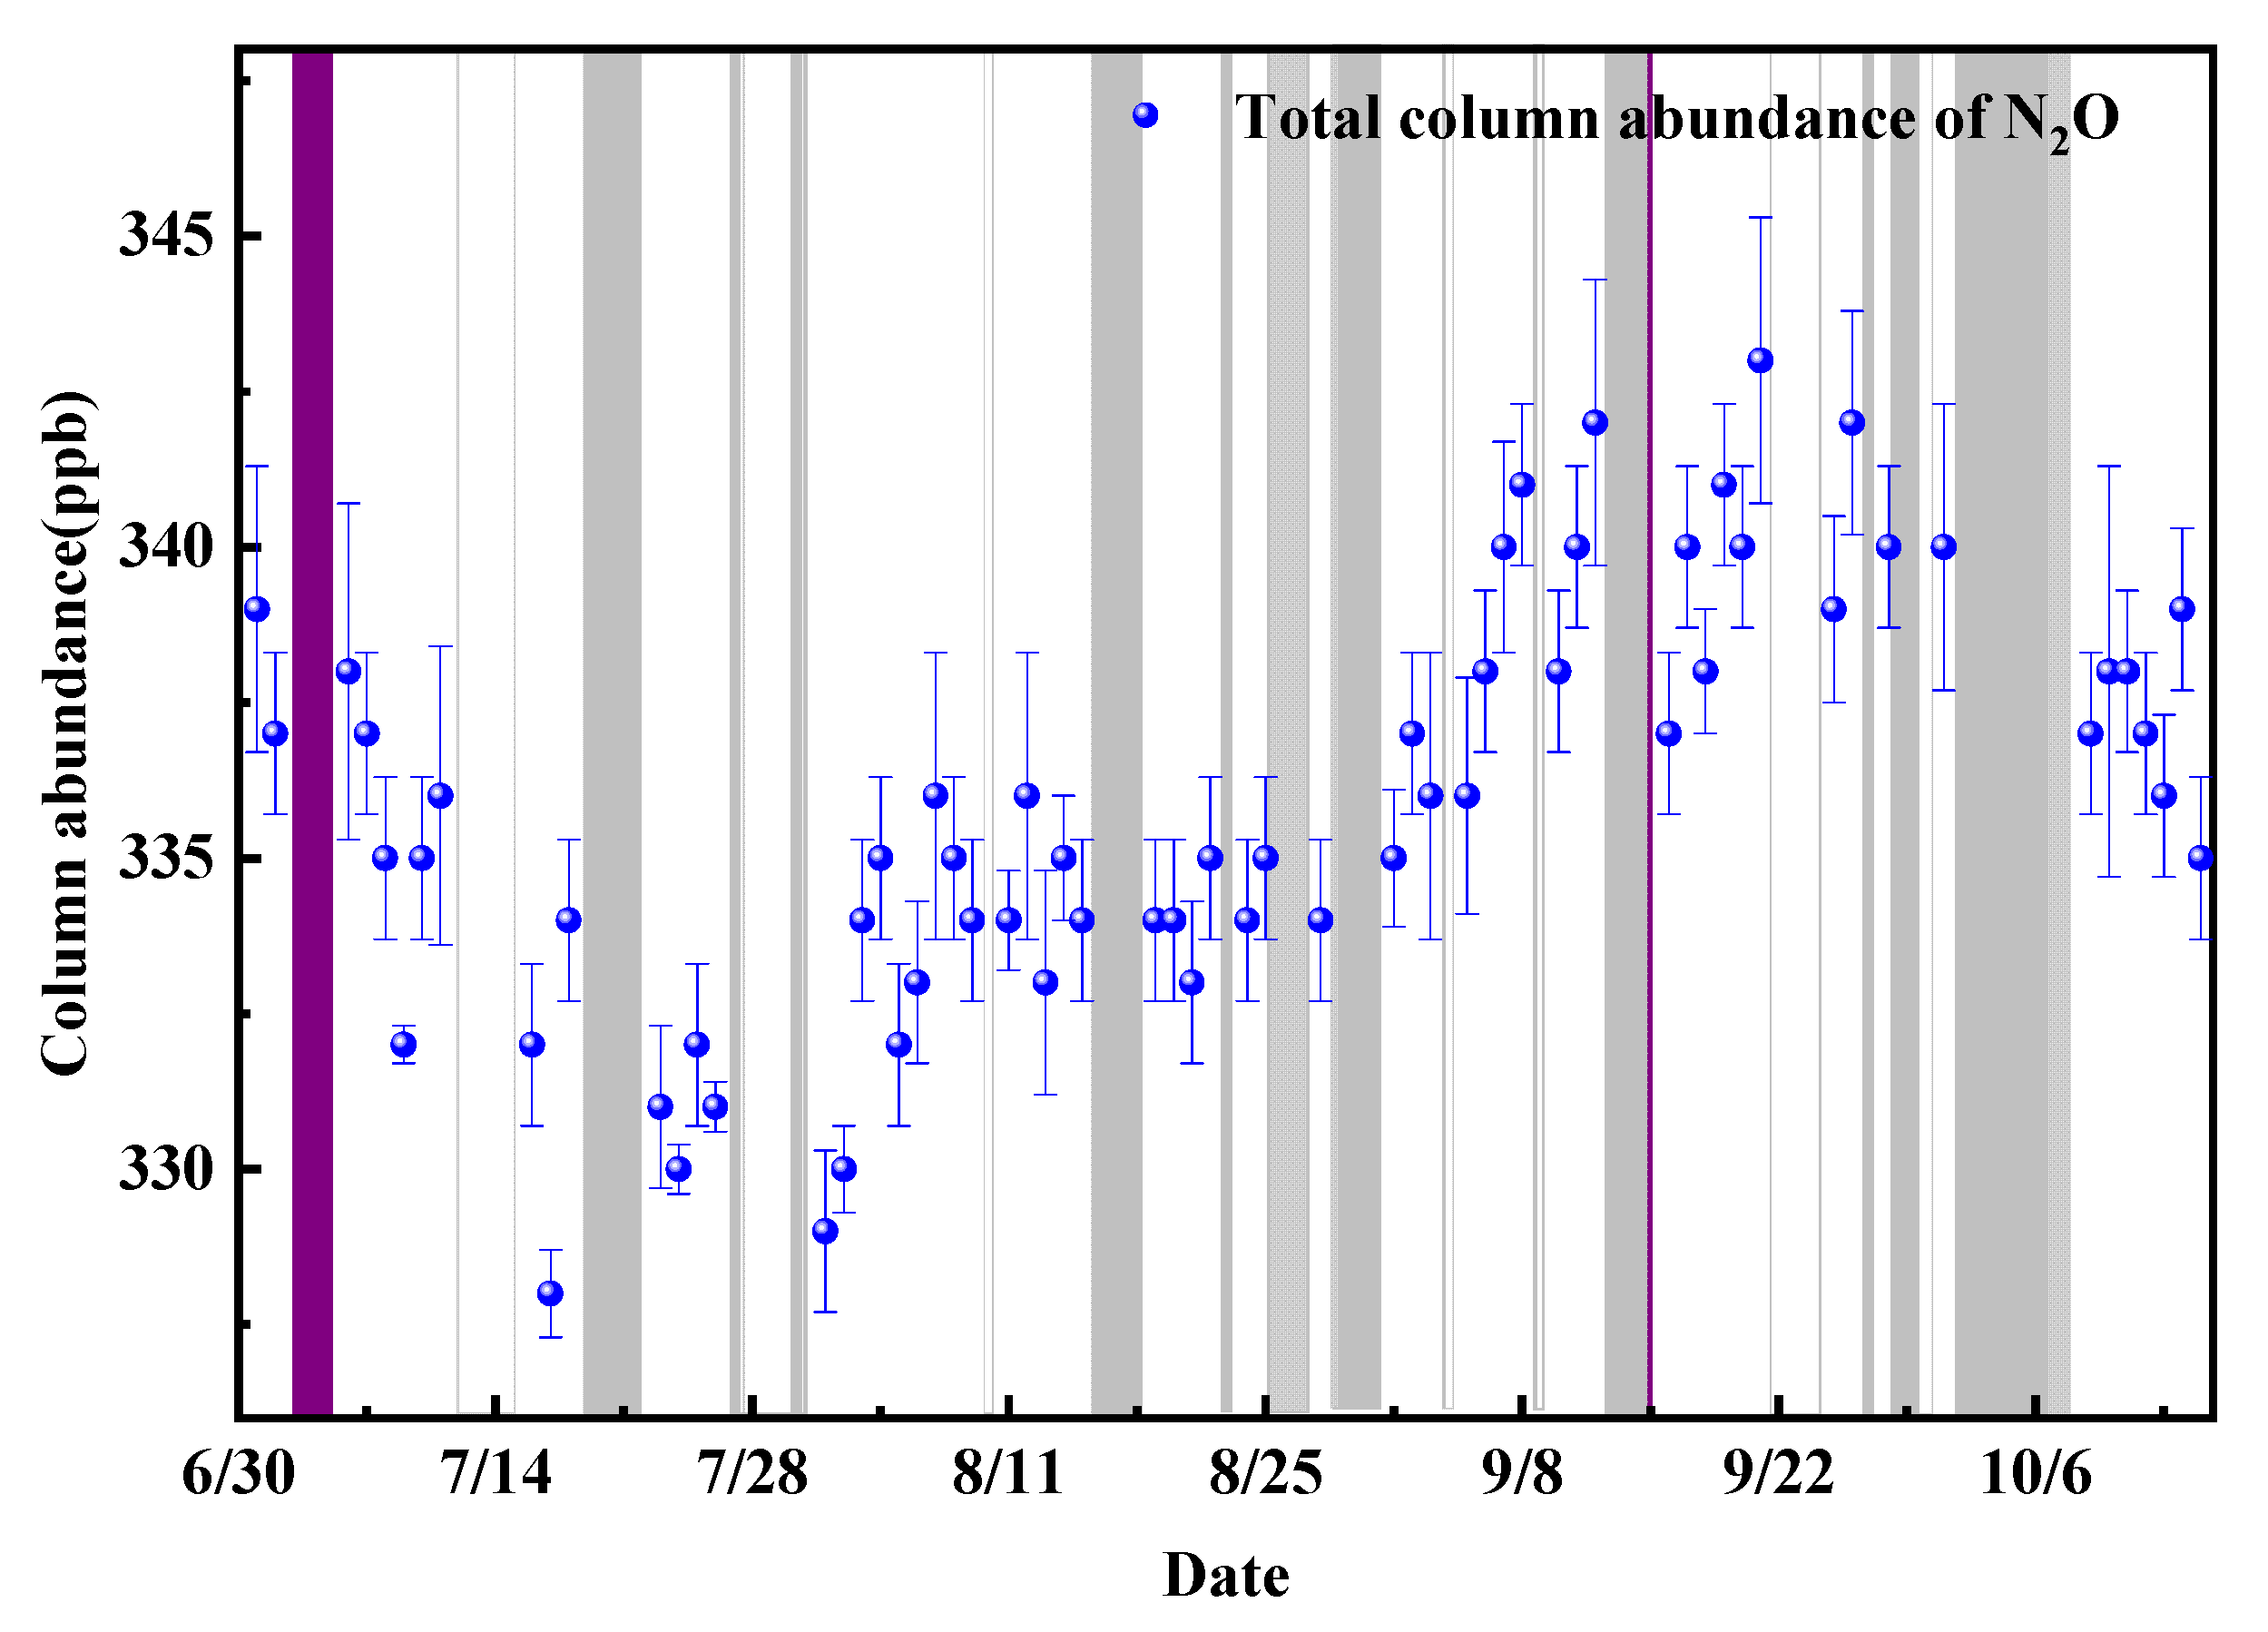
3. Results
4. Discussion
4.1. Atmospheric CO2
4.2. Atmospheric CH4
4.3. Atmospheric N2O
5. Conclusions
Author Contributions
Funding
Data Availability Statement
Conflicts of Interest
References
- Fan, K.; Yan, Y.; Xu, D.; Li, S.; Zhao, Y.; Wang, X.; Xin, X. Methane and Nitrous Oxide Fluxes with Different Land Uses in the Temperate Meadow Steppe of Inner Mongolia, China. Agronomy 2022, 12, 2810. [Google Scholar] [CrossRef]
- McGill, B.M.; Hamilton, S.K.; Millar, N.; Robertson, G.P. The Greenhouse Gas Cost of Agricultural Intensification with Groundwater Irrigation in a Midwest U.S. Row Cropping System. Glob. Chang. Biol. 2018, 24, 5948–5960. [Google Scholar] [CrossRef] [PubMed] [Green Version]
- Duval, B.D.; Martin, J.; Marsalis, M.A. The Effect of Variable Fertilizer and Irrigation Treatments on Greenhouse Gas Fluxes from Aridland Sorghum. Agronomy 2022, 12, 3109. [Google Scholar] [CrossRef]
- Knorr, W. Is the airborne fraction of anthropogenic CO2 emissions increasing? Geophys. Res. Lett. 2009, 36, L21710. [Google Scholar] [CrossRef]
- Wang, G.; Liang, Y.; Zhang, Q.; Jha, S.K.; Gao, Y.; Shen, X.; Sun, J.; Duan, A. Mitigated CH4 and N2O Emissions and Improved Irrigation Water Use Efficiency in Winter Wheat Field with Surface Drip Irrigation in the North China Plain. Agric. Water Manag. 2016, 163, 403–407. [Google Scholar] [CrossRef]
- Pereira, J.L.S.; Perdigão, A.; Marques, F.; Wessel, D.F.; Trindade, H.; Fangueiro, D. Mitigating Ammonia and Greenhouse Gas Emissions from Stored Pig Slurry Using Chemical Additives and Biochars. Agronomy 2022, 12, 2744. [Google Scholar] [CrossRef]
- IPCC. Available online: https://www.ipcc.ch/report/sixth-assessment-report-cycle/ (accessed on 10 November 2022).
- Zhu, X.; Burger, M.; Doane, T.A.; Horwath, W.P. Ammonia oxidation pathways and nitrifier denitrification are significant sources of N2O and NO under low oxygen availability. Proc. Natl. Acad. Sci. USA 2013, 110, 6328–6333. [Google Scholar] [CrossRef] [Green Version]
- Levy, P.; Drewer, J.; Jammet, M.; Leeson, S.; Friborg, T.; Skiba, U.; Oijen, M. Inference of spatial heterogeneity in surface fluxes from eddy covariance data: A case study from a subarctic mire ecosystem. Agric. For. Meteorol. 2020, 280, 107783. [Google Scholar] [CrossRef]
- Gu, M.; Chen, J.; Mei, J.; Tan, T.; Wang, G.; Liu, K.; Liu, G.; Liu, X. Open-path anti-pollution multi-pass cell-based TDLAS sensor for the online measurement of atmospheric H2O and CO2 fluxes. Opt. Express 2022, 30, 43961–43972. [Google Scholar] [CrossRef]
- Feng, M.Y.; Zhang, G.; Xia, L.J.; Xiong, X.; Li, B.Z.; Kong, P.; Zhan, M.J.; Zhang, Y.X. Spatial and temporal distribution of atmospheric methane in middle-low reaches of Yangtze River based on satellite observations. Geochimica 2021, 50, 121–132. [Google Scholar]
- Wilson, E.L.; DiGregorio, A.J.; Riot, V.J.; Ammons, M.S.; Bruner, W.W.; Carter, D.; Mao, J.; Ramanathan, A.; Strahan, S.E.; Oman, L.D.; et al. A 4 U laser heterodyne radiometer for methane (CH4) and carbon dioxide (CO2) measurements from an occultation-viewing CubeSat. Meas. Sci. Technol. 2017, 28, 035902. [Google Scholar] [CrossRef]
- Zenevich, S.; Gazizov, I.; Churbanov, D.; Plyashkov, Y.; Spiridonov, M.; Talipov, R.; Rodin, A. A Concept of 2U Spaceborne Multichannel Heterodyne Spectroradiometer for Greenhouse Gases Remote Sensing. Remote Sens. 2021, 13, 2235. [Google Scholar] [CrossRef]
- Shen, F.; Wang, G.; Wang, J.; Tan, T.; Wang, G.; Jeseck, P.; Te, Y.V.; Gao, X.; Chen, W. Transportable mid-infrared laser heterodyne radiometer operating in the shot-noise dominated regime. Opt. Lett. 2021, 46, 3171. [Google Scholar] [CrossRef] [PubMed]
- Wilson, E.L.; DiGregorio, A.J.; Villanueva, G.; Grunberg, C.E.; Souders, Z.; Miletti, K.M.; Menendez, A.; Grunberg, M.H.; Floyd, M.A.M.; Bleacher, J.E.; et al. A portable miniaturized laser heterodyne radiometer (mini-LHR) for remote measurements of column CH4 and CO2. Appl. Phys. B-Lasers Opt. 2019, 125, 211. [Google Scholar] [CrossRef]
- Wang, J.; Sun, C.; Wang, G.; Zou, M.; Tan, T.; Liu, K.; Chen, W.; Gao, X. A fibered near-infrared laser heterodyne radiometer for simultaneous remote sensing of atmospheric CO2 and CH4. Opt. Lasers Eng. 2020, 129, 106083. [Google Scholar] [CrossRef]
- Robinson, I.; Butcher, H.L.; Macleod, N.A.; Weidmann, D. Hollow waveguide-miniaturized quantum cascade laser heterodyne spectro-radiometer. Opt. Express 2021, 29, 2299–2308. [Google Scholar] [CrossRef] [PubMed]
- Weidmann, D.; Perrett, B.J.; Macleod, N.A.; Jenkins, R.M. Hollow waveguide photomixing for quantum cascade laser heterodyne spectro-radiometry. Opt. Express 2011, 19, 9074–9085. [Google Scholar] [CrossRef] [PubMed]
- Xue, Z.Y.; Shen, F.J.; Li, J.; Liu, X.H.; Wang, G.S.; Liu, K.; Gao, X.M.; Chen, W.D.; Tan, T. MEMS Modulator-Based Mid-Infrared Laser Heterodyne Radiometer for Atmospheric Remote Sensing. Front. Phys. 2022, 10, 945995. [Google Scholar] [CrossRef]
- Xue, Z.; Shen, F.; Li, J.; Liu, X.; Wang, J.; Wang, G.; Liu, K.; Chen, W.; Gao, X.; Tan, T. A MEMS modulator-based dual-channel mid-infrared laser heterodyne radiometer for simultaneous remote sensing of atmospheric CH4, H2O and N2O. Opt. Express 2022, 30, 31828–31838. [Google Scholar] [CrossRef]
- Sun, C.; Wang, G.; Zhu, G.; Tan, T.; Liu, K.; Gao, X. Atmospheric CO2 column concentration retrieval based on high resolution laser heterodyne spectra and evaluation method of system measuring error. Acta Phys. Sin. 2020, 69, 144201. [Google Scholar] [CrossRef]
- Clarke, G.B.; Wilson, E.L.; Miller, J.H.; Melroy, H.R. Uncertainty analysis for the miniaturized laser heterodyne radiometer (mini-LHR) for the measurement of carbon dioxide in the atmospheric column. Meas. Sci. Technol. 2014, 25, 055204. [Google Scholar] [CrossRef]
- Shen, F.; Wang, G.; Xue, Z.; Tan, T.; Cao, Z.; Gao, X.; Chen, W. Impact of Lock-In Time Constant on Remote Monitoring of Trace Gas in the Atmospheric Column Using Laser Heterodyne Radiometer (LHR). Remote Sens. 2022, 14, 2923. [Google Scholar] [CrossRef]
- Weidmann, D.; Reburn, W.J.; Smith, K.M. Retrieval of atmospheric ozone profiles from an infrared quantum cascade laser heterodyne radiometer: Results and analysis. Appl. Opt. 2007, 46, 7162–7171. [Google Scholar] [CrossRef] [PubMed]
- Dudhia, A. The reference forward model (RFM). J. Quant. Spectrosc. Radiat. Transf. 2017, 186, 243–253. [Google Scholar] [CrossRef] [Green Version]
- Zou, J.; Liu, S.; Qin, Y.; Pan, G.; Zhu, D. Sewage irrigation increased methane and nitrous oxide emissions from rice paddies in southeast China. Agric. Ecosyst. Environ. 2009, 129, 516–522. [Google Scholar] [CrossRef]


Disclaimer/Publisher’s Note: The statements, opinions and data contained in all publications are solely those of the individual author(s) and contributor(s) and not of MDPI and/or the editor(s). MDPI and/or the editor(s) disclaim responsibility for any injury to people or property resulting from any ideas, methods, instructions or products referred to in the content. |
© 2023 by the authors. Licensee MDPI, Basel, Switzerland. This article is an open access article distributed under the terms and conditions of the Creative Commons Attribution (CC BY) license (https://creativecommons.org/licenses/by/4.0/).
Share and Cite
Li, J.; Xue, Z.; Li, Y.; Bo, G.; Shen, F.; Gao, X.; Zhang, J.; Tan, T. Real-Time Measurement of Atmospheric CO2, CH4 and N2O above Rice Fields Based on Laser Heterodyne Radiometers (LHR). Agronomy 2023, 13, 373. https://doi.org/10.3390/agronomy13020373
Li J, Xue Z, Li Y, Bo G, Shen F, Gao X, Zhang J, Tan T. Real-Time Measurement of Atmospheric CO2, CH4 and N2O above Rice Fields Based on Laser Heterodyne Radiometers (LHR). Agronomy. 2023; 13(2):373. https://doi.org/10.3390/agronomy13020373
Chicago/Turabian StyleLi, Jun, Zhengyue Xue, Yue Li, Guangyu Bo, Fengjiao Shen, Xiaoming Gao, Jian Zhang, and Tu Tan. 2023. "Real-Time Measurement of Atmospheric CO2, CH4 and N2O above Rice Fields Based on Laser Heterodyne Radiometers (LHR)" Agronomy 13, no. 2: 373. https://doi.org/10.3390/agronomy13020373