Article

Drought and Waterlogging Status and Dominant Meteorological Factors Affecting Maize (Zea mays L.) in Different Growth and Development Stages in Northeast China

1
Institute of Environment and Sustainable Development in Agriculture, Chinese Academy of Agricultural Sciences, Beijing 100081, China
2
Agronomy College of Shenyang Agricultural University, Shenyang 110866, China
3
College of Resources and Environment, Northeast Agriculture University, Harbin 150030, China
*
Author to whom correspondence should be addressed.
Agronomy 2023, 13(2), 374; https://doi.org/10.3390/agronomy13020374
Submission received: 29 December 2022 / Revised: 25 January 2023 / Accepted: 25 January 2023 / Published: 27 January 2023
(This article belongs to the Special Issue Geoinformatics Application in Agriculture)

Abstract

:
Drought and floods affect the growth and yield of maize, affecting food security. Therefore, it is crucial to assess maize’s drought and waterlogging status in various growth stages. We used phenological and daily meteorological data and spatial analysis to identify the drought and waterlogging conditions of spring maize in Northeast China in eight growth stages. We calculated the crop water surplus/deficit index and used the national standard for maize drought and waterlogging. The results indicate a significant decreasing trend of effective precipitation in Northeast China. The maize’s water requirements changed during the growing period. The ranking of the daily water requirements of maize from high to low in the different growth stages was the flowering stage to the silking stage (6.9 mm/d), the tasseling stage to the flowering stage (6.1 mm/d), the jointing stage to the tasseling stage (4.9 mm/d), the seven-leaf stage to the jointing stage (3.4 mm/d), the silking stage to the harvesting stage (2.0 mm/d), the emergence stage to the three-leaf stage (1.4 mm/d), the three-leaf stage to the seven-leaf stage (1.3 mm/d), and the sowing stage to the emergence stage (1.2 mm/d). Drought occurred primarily in the early growth and development stage, and the most severe drought conditions were observed in the sowing to emergence stages and the emergence to the three-leaf stages in most areas in Northeast China. Waterlogging occurred predominantly in the flowering to the silking stages and the silking to the maturity stages in southeast Liaoning and parts of Jilin. Inner Mongolia had the lowest soil moisture conditions and was unsuitable for maize growth, followed by Heilongjiang, Jilin, and Liaoning. The dominant meteorological factors affecting the drought and waterlogging status of maize in different growth stages were precipitation and wind speed, followed by the minimum temperature, relative humidity, sunshine hours, and maximum temperature. The average temperature did not influence the drought and waterlogging status. The results provide a basis for selecting drought-resistant varieties and preventing waterlogging.

1. Introduction

Maize (Zea mays L.) is a member of the grass family (Poaceae) and a cereal crop and staple food grown worldwide [1]. It is commonly used to produce edible oil, glucose, and many other products [2]. The Northeast region in China is a crucial area for maize and commodity grain production and relies on rain-fed agriculture. The precipitation is variable in different regions; thus, the area is prone to droughts and waterlogging. Many scholars have analyzed the annual, monthly, and growing-season precipitation changes in Northeast China in recent decades. Studies have shown a decrease in annual precipitation in northeastern China, particularly after the late 1990s [3,4]. A slight increase in spring precipitation and a decreasing precipitation trend during the crop-growing season have been observed [5]. In addition, high precipitation is common in northeastern China, and the risk of drought and waterlogging has increased [6].
Precipitation anomalies are the primary cause of agricultural droughts and waterlogging disasters. The meteorological drought, soil moisture, and water requirements of crops should be considered. Various precipitation indicators, such as the standardized precipitation index [7], are typically used to evaluate drought and waterlogging severity. Current research on drought and waterlogging in maize has primarily focused on the impact of drought and waterlogging during different phenological stages or on predicting the frequency of drought and waterlogging events. For example, Tian et al. [8] showed that the effect of flooding on maize growth and yield was most significant in the V3 stage, followed by the V6 and VT stages. Huang et al. [9] found that waterlogging during the V6-VT stages had the most significant effect on the cob yield and seed quality of glutinous maize. They experimentally demonstrated that maize yield decreased by nearly 50% in the V3 and VT stages and by more than 20% in the R3 stage after 10 d of inundation. Han et al. [10] observed that the area, severity, and frequency of droughts in China have increased due to climate warming and that the most extensive and longest-lasting droughts occurred in the Yellow River basin and the Yangtze River basin. Wang et al. [11] found that the average increase in sudden droughts in China from 1979 to 2010 was 109% and occurred due to climate warming. Human activities in the coming decades might exacerbate future drought conditions in China. These findings indicate that the frequency of droughts and waterlogging in China has increased in recent decades. These events significantly impact maize yield; thus, it is necessary to evaluate the water status of maize in different growth stages. However, few studies performed detailed evaluations of the drought and waterlogging status of maize at different phenological stages in Northeast China.
This paper analyzes the effective precipitation trend and the spatial distribution of water requirements in different growth stages of maize in Northeast China to determine the water supply and demand patterns. The water surplus/deficit index and phenological data of maize in different reproductive stages are used to determine the moisture status. Furthermore, the drought and flood conditions are evaluated in each growth stage to provide a scientific basis for water allocation and drought and flood prevention in Northeast China.

2. Materials and Methods
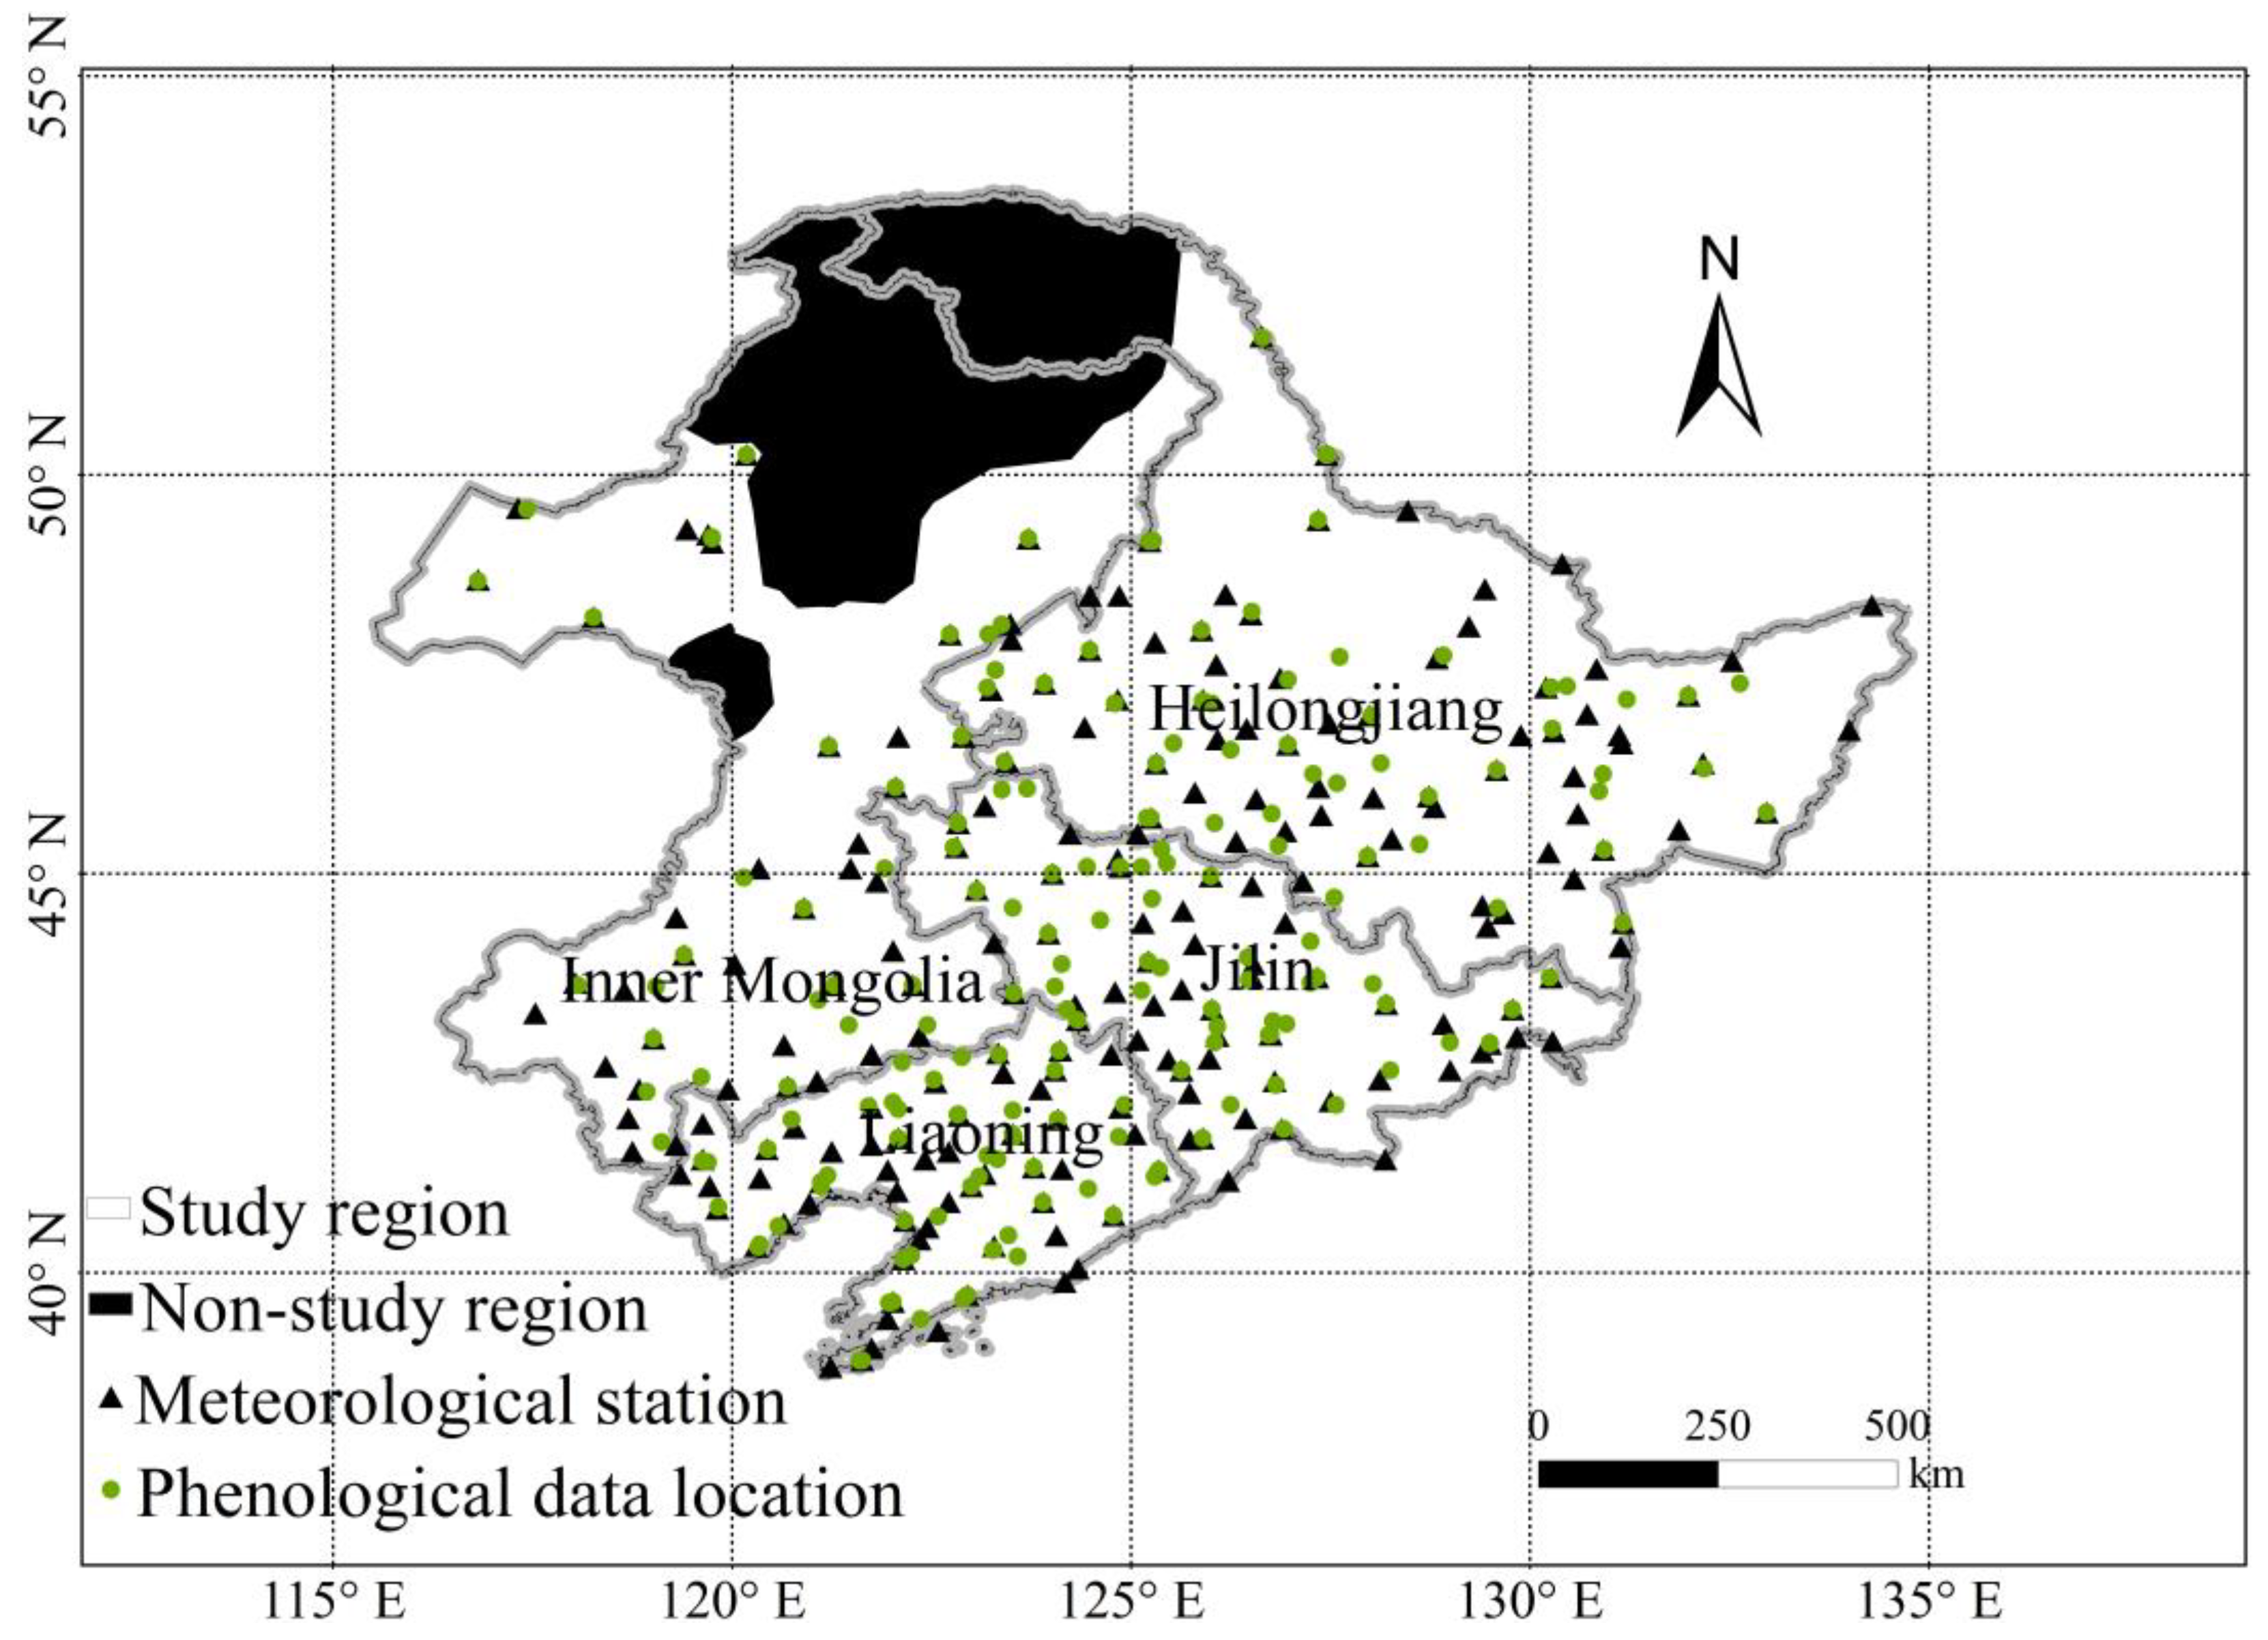
2.1. Study Region

The Northeast region of China includes the areas of Heilongjiang, Jilin, Liaoning, and the eastern four prefectures of Inner Mongolia. The area has a temperate continental monsoon climate, with rainy summers, cold winters, and uneven distribution of annual precipitation, making it prone to drought, waterlogging, and other agro-meteorological disasters [12]. The Northeast region is vast and spans several latitudes and longitudes, resulting in large differences in temperature conditions in different areas. Maize could only grow in areas with active accumulated temperature (>10 °C) higher than 2300 °C [13]. Therefore, an active cumulative temperature of 2300 °C was used to divide the Northeast region into the study area and the non-study area (Figure 1).

2.2. Data

2.2.1. Meteorological Data

The meteorological data were obtained from the China National Meteorological Science Data Center (http://data.cma.cn (accessed on 15 November 2022)), consisting of daily meteorological data from 246 meteorological stations from 1981–2015, including daily average temperature, maximum temperature, minimum temperature, precipitation, sunshine hours, and relative humidity. The spatial distribution of the meteorological stations in the study area is shown in Figure 1.

2.2.2. Maize Phenological Data

The maize phenological data were derived from the authors’ previous research. [14] The phenological stages include the sowing stage (SW), emergence stage (VE), three-leaf stage (V3), seven-leaf stage (V7), jointing stage (JT), tasseling stage (VT), flowering stage (FR), silking stage (R1), and harvesting stage (R6) for 192 locations in Northeast China (Figure 1). Previous studies have shown that the ranges of the maize phenological periods in the Northeast are as follows: start of sowing stage of 110–149 d (days after start of the year), start of emergence stage of 126–159 d, start of three-leaf stage of 133–169 d, start of seven-leaf stage of 146–182 d, start of jointing stage of 168–197 d, start of tasseling stage of 189–216 d, start of flowering stage of 192–219 d, start of silking stage of 194–221 d, and start of harvesting stage of 245–285 d. The days of each developmental stage in Northeast China were obtained by averaging the number of days of two adjacent phenological stages (Table 1).

2.3. Methods

2.3.1. Crop Water Surplus/Deficit Index

We calculated the crop water surplus/deficit index (CWSDI) [15] based on the potential evapotranspiration to determine the water requirements and the water supply status in the different growth stages of maize.
C W S D I i = P e i E T c i E T c i × 100 %  
where i (i = 1, 2, 3, 4, 5, 6, 7, and 8) represents the growth stage, i.e., SW-VE, VE-V3, V3-V7, V7-JT, JT-VT, VT-FR, FR-R1, and R1-R6; ETci is the water requirement in growth stage i, mm; Pei is the effective precipitation, mm; CWSDIi is the crop water surplus/deficit index. Calculations were undertaken using Pei and ETci averaged across the years of observation (1981–2015) for each growth stage.

2.3.2. Effective Rainfall

Effective rainfall refers to the proportion of total rainfall remaining in the crop root layer or the difference between total rainfall and evapotranspiration [16]. It does not include surface runoff and infiltration below the crop root layer. It is calculated as follows:
P e j = α j P j
where Pej is the effective precipitation; Pj is the total amount of precipitation of j precipitation events, mm; αj is the effective utilization coefficient. In general, the following values of α are used: when Pj ≤ 5 mm, αj = 0; when 5 mm < Pj ≤ 50 mm, αj = 0.9; when Pj > 50 mm, αj = 0.75.
The effective precipitation of multiple precipitation events in the growth stage i is calculated to obtain the effective precipitation in growth stage Pei:
P e j = j = 1 n P e j , i
where Pei is the effective precipitation in growth stage i, mm; j (j = 1, 2,..., n) indicates the number of precipitation events in the growth stage; Pej,i is the j th effective precipitation event in growth stage i, mm.

2.3.3. Water Requirements in the Growth Stage

The water requirement in the growth stage is obtained by calculating the cumulative daily water requirements during the growth stage. The daily water requirement is calculated using the FAO-recommended crop coefficient method [17,18,19]. The theoretical water requirement is calculated as:
E T c = K c E T 0
where ETc is the daily crop water requirement, mm; ET0 is the daily evapotranspiration of the crop, mm; Kc is the crop coefficient.
The daily evapotranspiration of the crop (ET0) in the growth stage is calculated using the FAO-recommended Penman–Monteith formula:
E T 0 = 0.408 Δ R n G + γ 900 T mean   + 273 U 2 e s e a Δ + γ 1 + 0.34 U 2
where ET0 is the daily evapotranspiration of the crop, mm; Rn is the net radiation at the canopy surface, MJ/(m2.d); G is the soil heat flux, MJ/(m2·d). Tmean is the daily average temperature, °C; es is the daily average saturated vapor pressure, kPa; ea is the actual vapor pressure, kPa; Δ is the slope of the relationship curve between the saturated water vapor pressure and psychrometric constant, kPa/ °C. γ is the dry- and wet-bulb temperature, kPa/ °C; U2 is the wind speed at the height of 2 m, m/s. Since Rn was not available from the long-term weather stations, Rn was estimated from sunshine hours according to equations recommended by FAO [20].
The crop coefficient is the standard crop coefficient recommended by the FAO. The crop coefficients in the different growth stages of maize are listed in Table 2.

2.3.4. Establishment of Drought and Waterlogging Standard

We used data from the Chinese Meteorological Standardization Network to assess the drought level of spring maize in northern China (QX/T 259-2015, http://www.cmastd.cn/(accessed on 15 November 2022)). We classified the drought and waterlogging levels according to the magnitude of the cumulative values of the CWSDI (Table 3).

2.3.5. Multiple Stepwise Linear Regression

Droughts or floods may be caused by various meteorological factors with different degrees of influence. Multiple stepwise regression analysis can be used to select independent variables that contribute the most to the dependent variable to obtain the optimal regression equation. We used this method in SPSS software to introduce or eliminate meteorological factors in each maize growth stage to derive the best regression model between CWSDI and the meteorological factors and reveal the effects of these factors on drought or flood and their magnitude.

3. Results

3.1. Effective Precipitation Trend in the Maize Growing Season

The effective precipitation during the growing season (May-September) of maize in Northeast China from 1981 to 2015 is shown in Figure 2. The average effective precipitation during the growing season was 359.8 mm. Significant differences in the effective precipitation were observed in different years. The lowest effective precipitation of 265.2 mm occurred in 1999, and the highest effective precipitation of 493.8 mm was observed in 1994. The effective precipitation showed a significantly decreasing trend from 1981 to 2015 (−11.4 mm/10 a, p < 0.001).

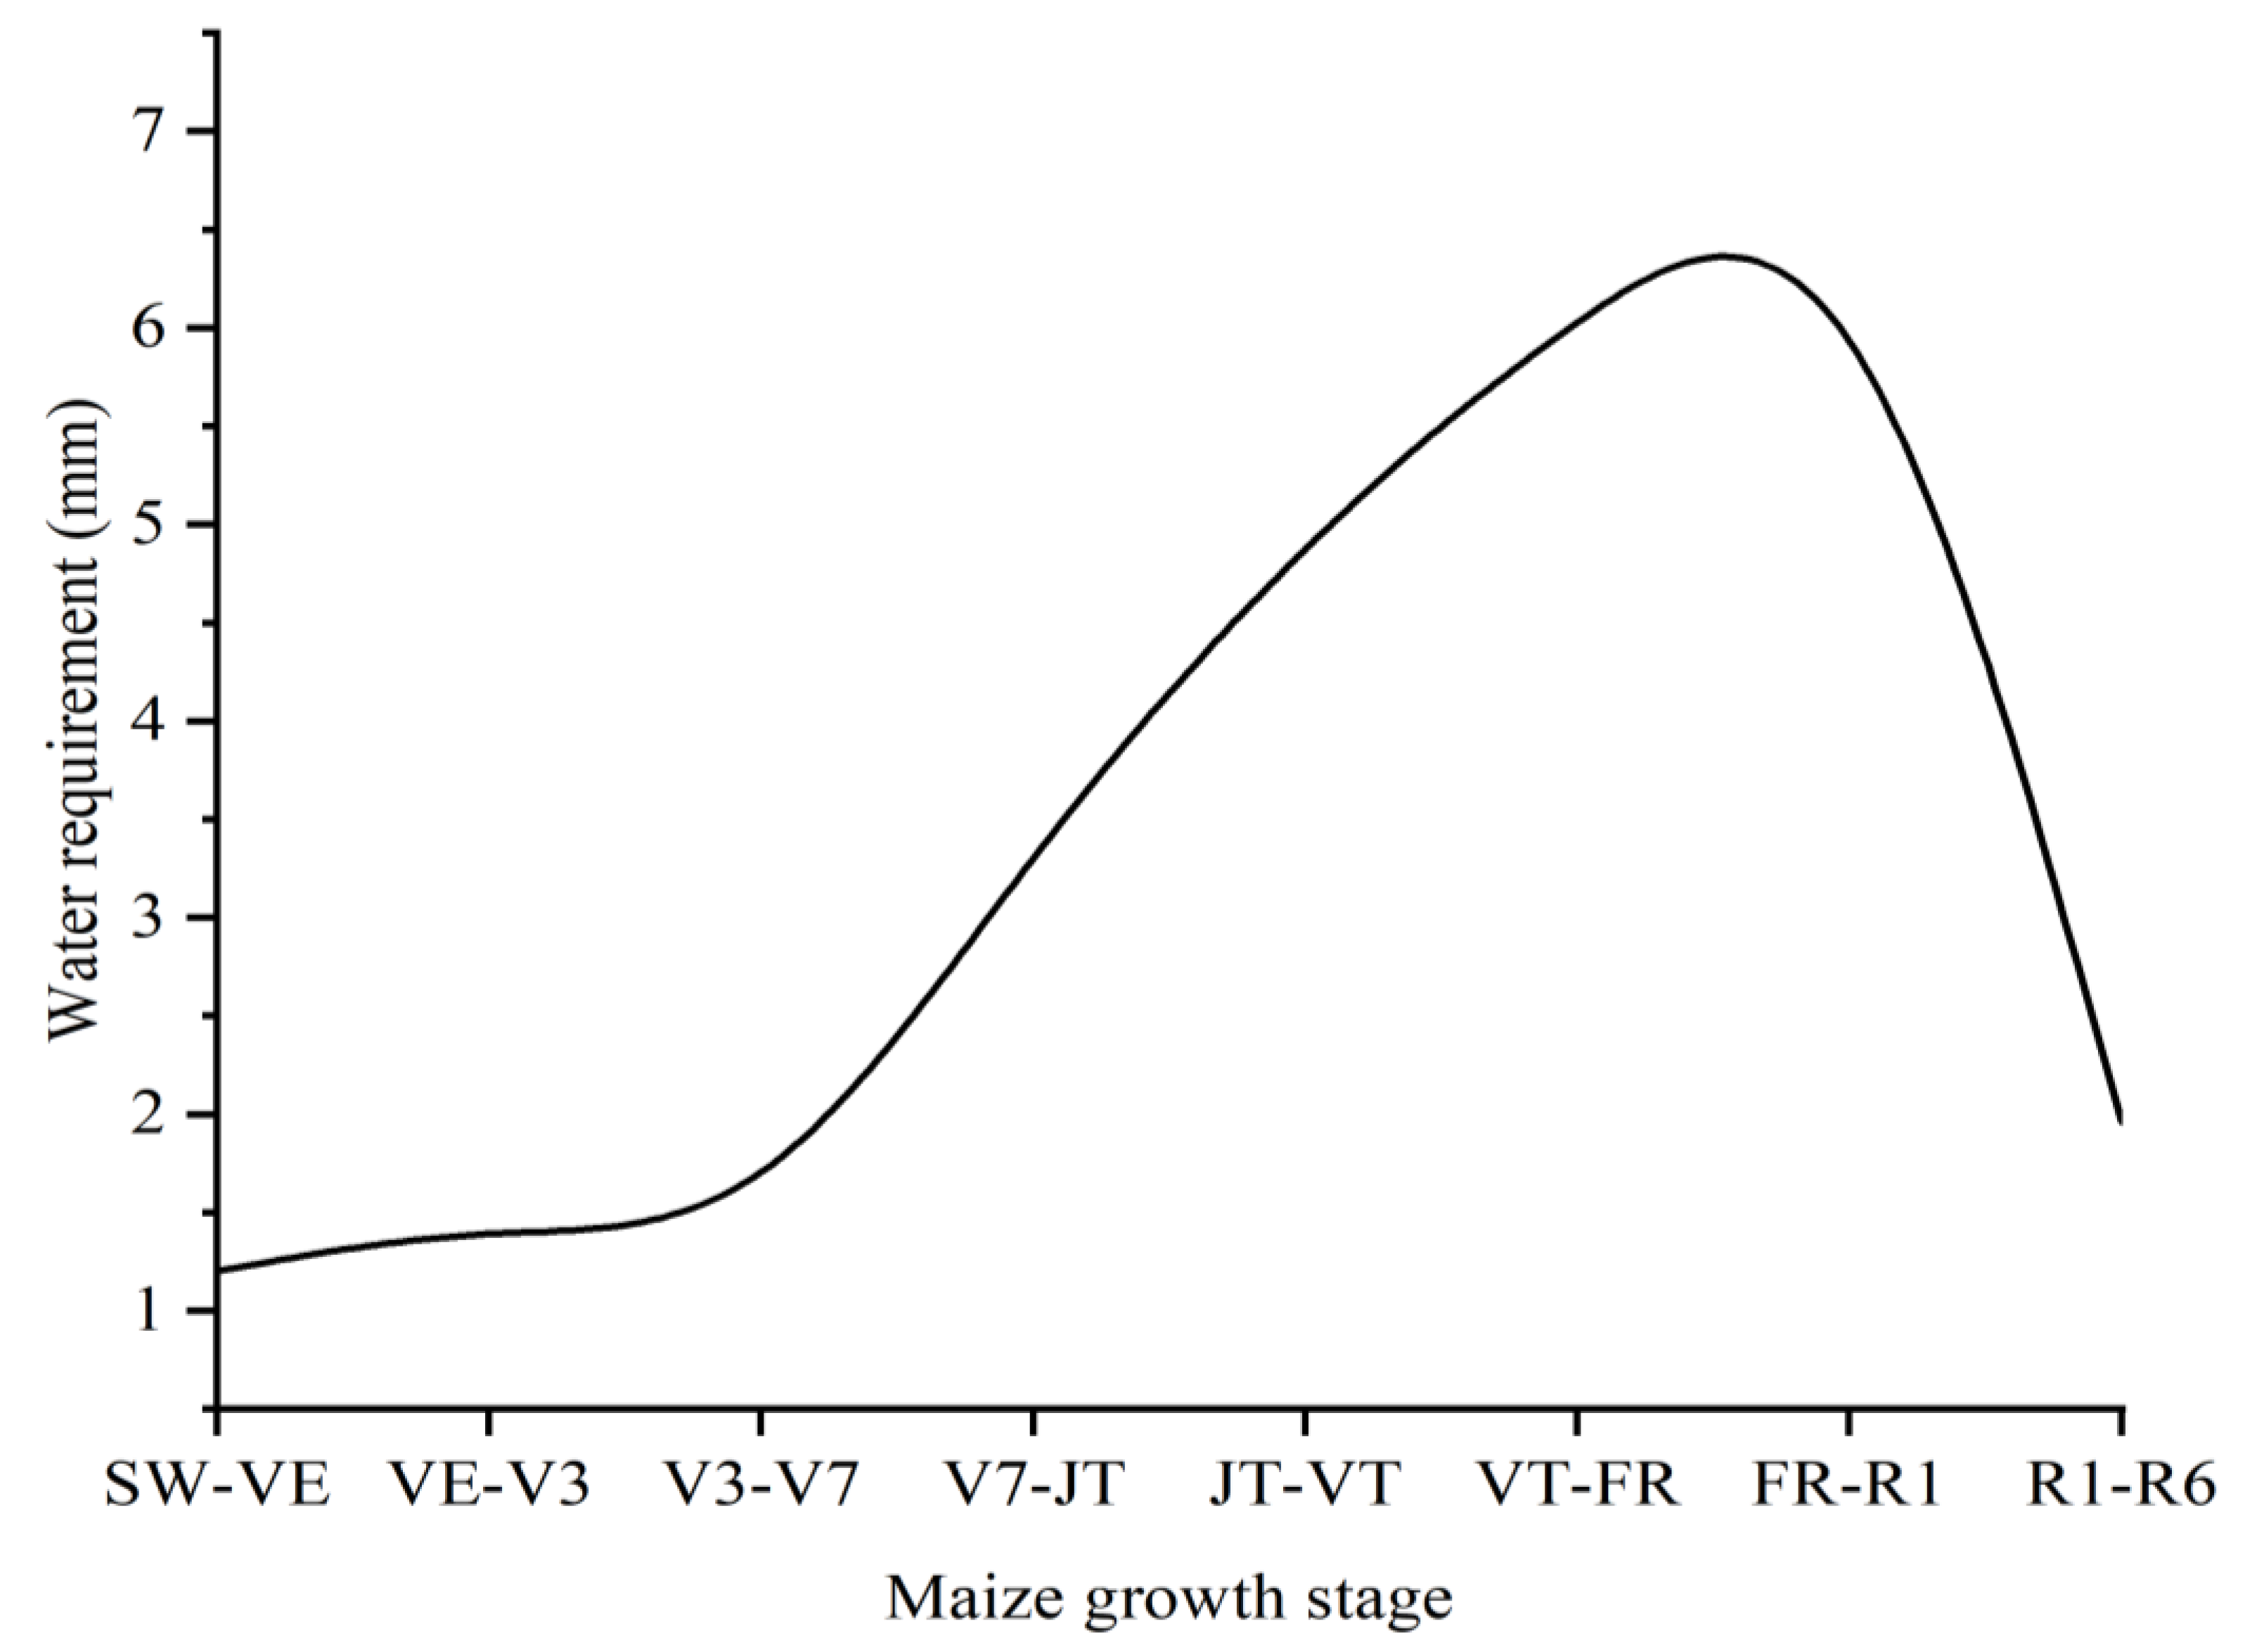
3.2. Average Daily Water Requirement in the Maize Growth Stages

The average daily water requirements of maize during the growth stages were obtained. Figure 3 shows that the daily water requirement is low in the SW to the V7 stages, averaging 1.3 mm/d. The daily water requirement increased rapidly from the V7 to the JT stages, reaching a maximum (6.9 mm/d) in the FR to R1 stages. The ranking of the daily water requirements in different growth stages from high to low was FR-R1, VT-FR, JT-VT, V7-JT, R1-R6, VE-V3, V3-V7, and SW-VE.

3.3. Spatial Distribution of Water Requirements in the Maize Growth Stages

Kriging interpolation and inverse distance interpolation are frequently used spatial interpolation methods. Precipitation interpolation results obtained from inverse distance interpolation have fewer errors and are more stable [21]. Therefore, we used this method to obtain maps of the average water demand of maize in the eight growth stages (Figure 4). The average water requirements in the different stages were 19.2 mm, 10.1 mm, 18.9 mm, 67.6 mm, 98.9 mm, 18.2 mm, 13.8 mm, and 113.6 mm. Low values occurred in the southeastern part of the study area, and high values were observed in the western and southwestern parts, with a decreasing trend from west to east.

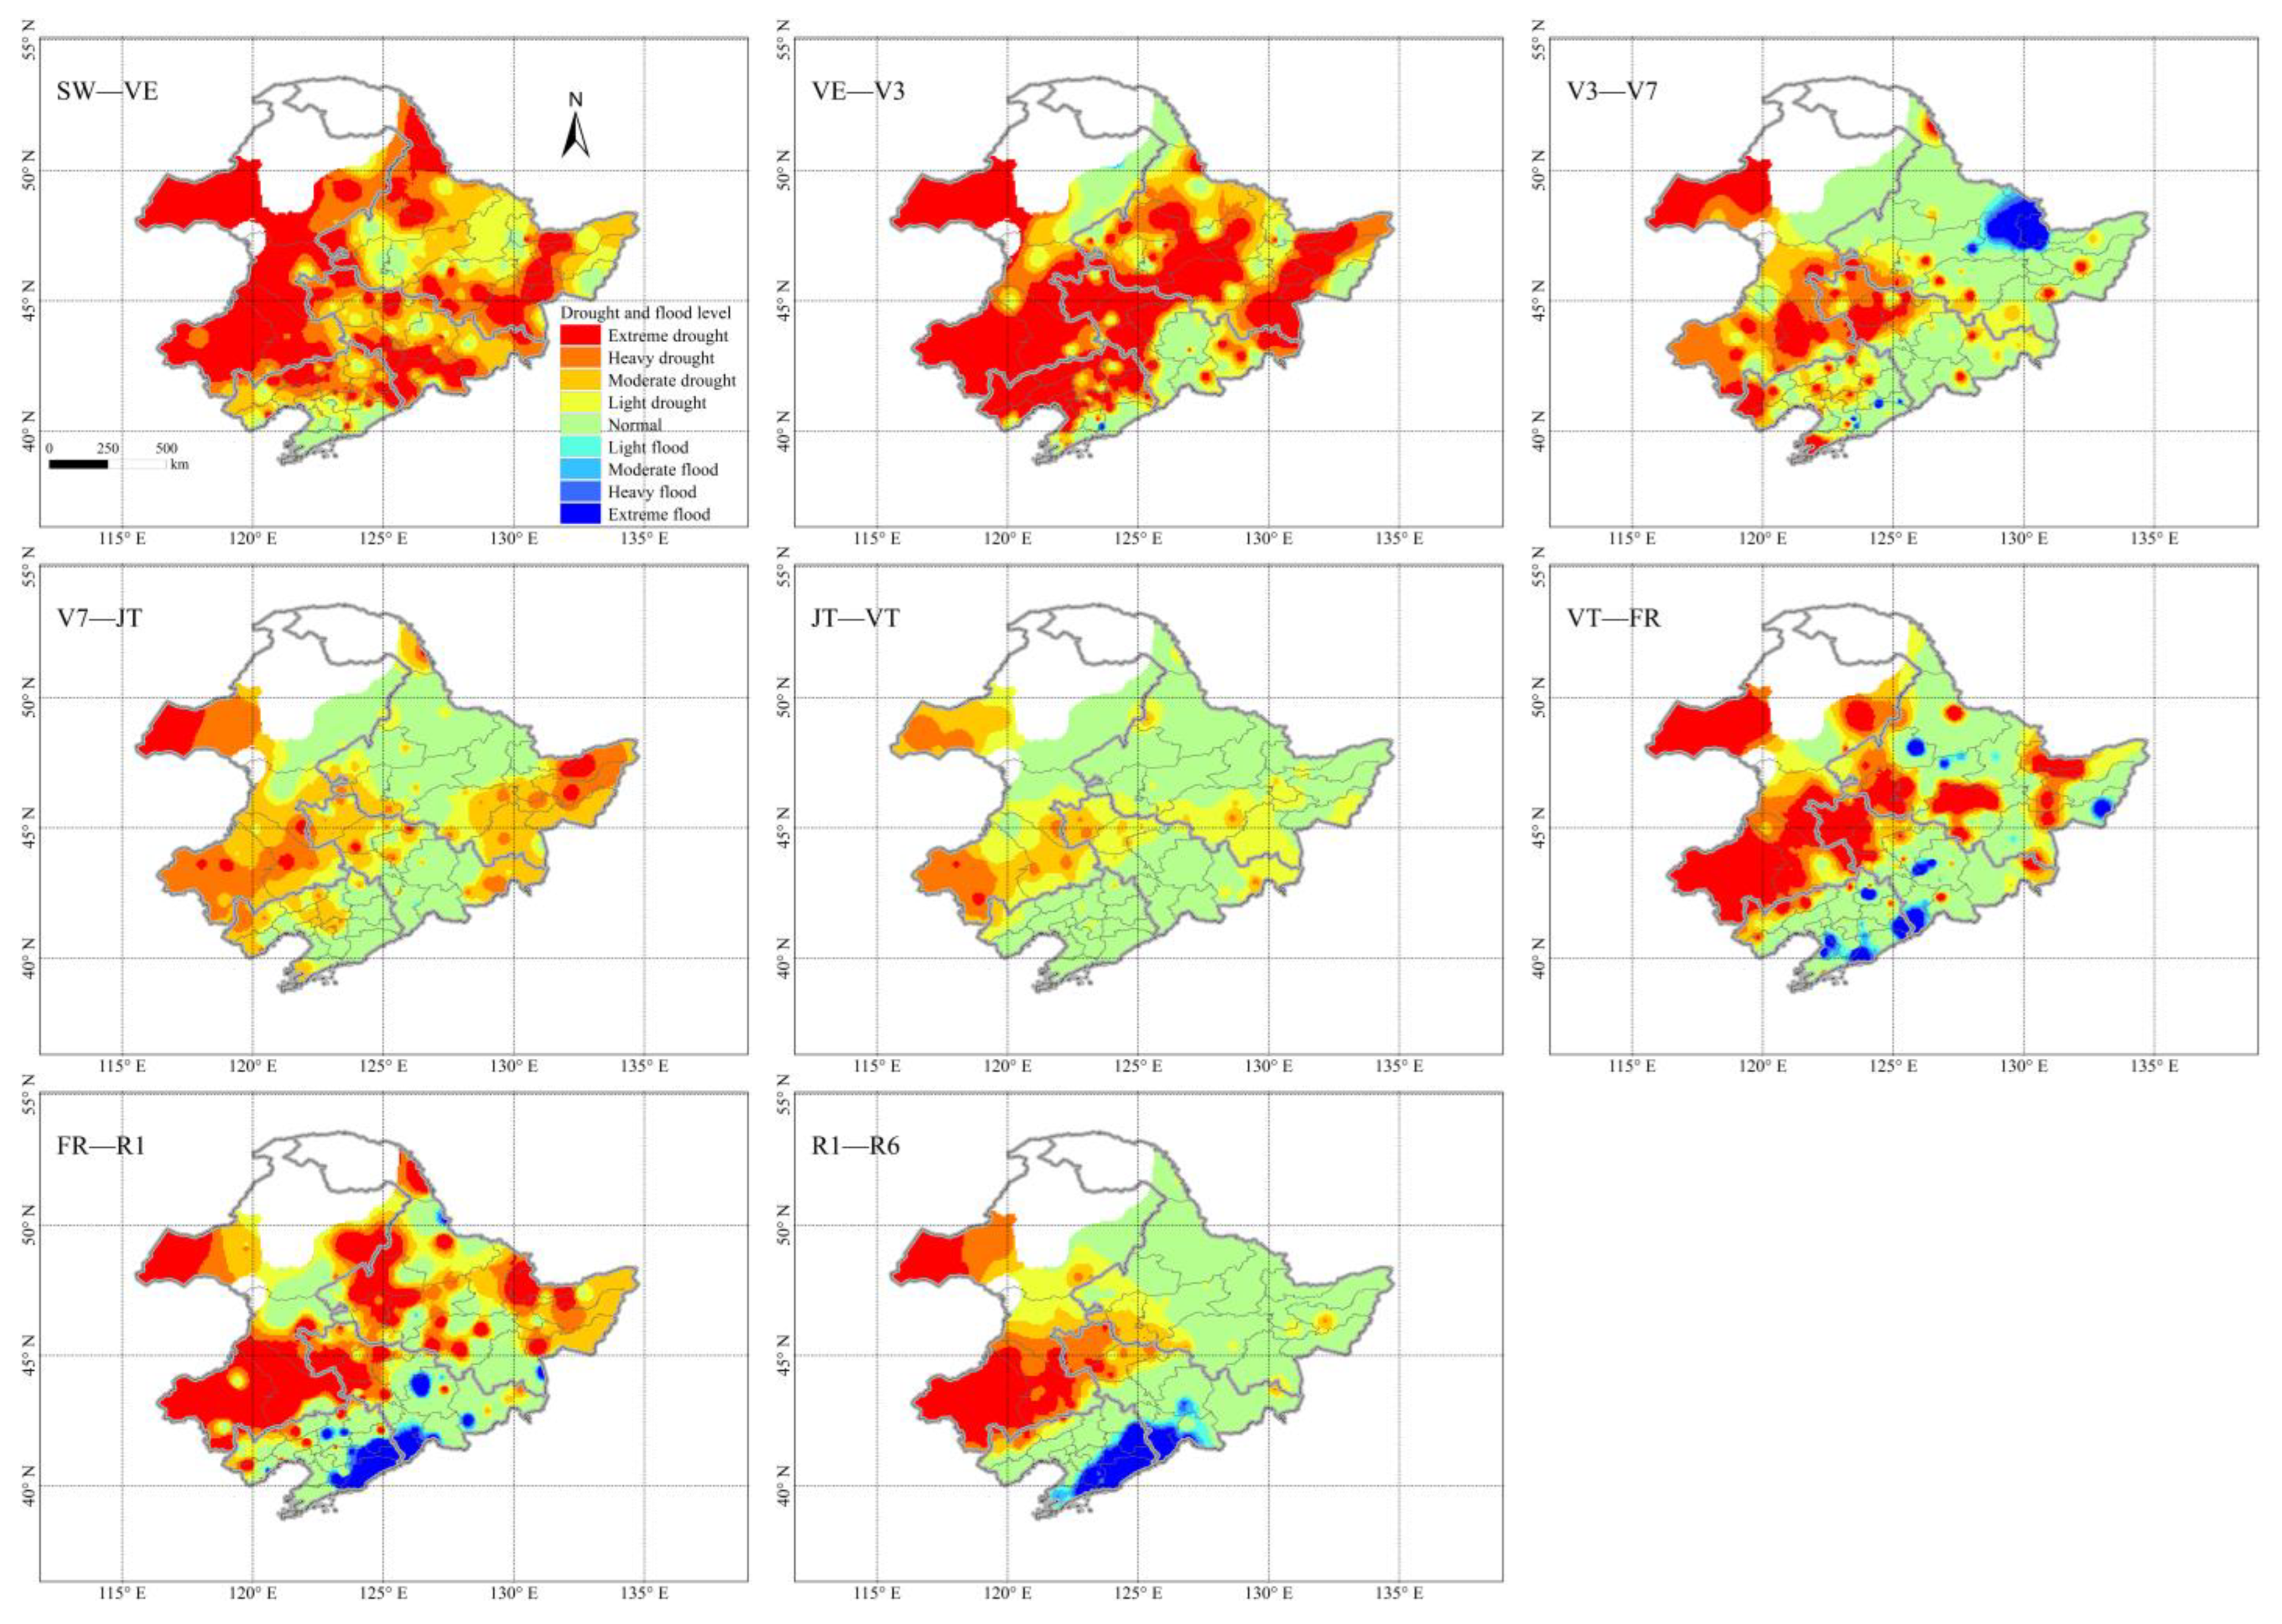
3.4. Spatial Distribution of Drought and Flood States in the Maize Growth Stages

The spatial distribution of the drought and flood levels in the eight growth stages was derived from the CWSDI and the drought and waterlogging level criteria. Figure 5 shows that the effective precipitation is insufficient in most areas of the Northeast region during the SW to VE stages. Since crop sowing and emergence periods would be dependent on irrigation or stored soil water from the winter fallow period, neither were included in the analysis. The drought area was smaller during the VE to V3 stages than in the previous growth stage. However, in areas with extreme drought, i.e., in southern Inner Mongolia, most of Liaoning, western Jilin, and central and eastern Heilongjiang, the drought during this period caused damage to the maize, such as slow growth, yellowing of leaves, and smaller stalks [22]. The drought level was lower in the Northeast region during the V3 to V7 stages. The highest drought levels occurred in western Jilin and Inner Mongolia, and Yichun in Heilongjiang experienced flooding. The V7 to the JT stages and the JT to the VT stages coincided with the rainy season in the northeast [23]. There was sufficient precipitation, which was favorable to maize development in the VT stage. The JT is a critical period when corn requires sufficient water and fertilizer to ensure adequate growth and cob development. The water requirement of corn increases rapidly during this period. Farmers should monitor the weather and use irrigation in time in dry areas to prevent inadequate cob development. Drought during the flowering period occurred in Inner Mongolia, western Jilin, and some parts of Heilongjiang. The drought areas increased during the flowering and silking periods, significantly reducing the corn yield. Southeastern Liaoning and some parts of Jilin are prone to flooding in this stage. The moisture conditions in most of the northeast during the silking to harvest stages were suitable for kernel development and maturation. However, insufficient soil moisture in southern Inner Mongolia and western Jilin affected the nutrient transfer and reduced dry matter accumulation, resulting in missing or underdeveloped kernels and lower yields. Some parts of southeastern Liaoning and southern Jilin areas are prone to flooding, which hampers corn harvest and storage.

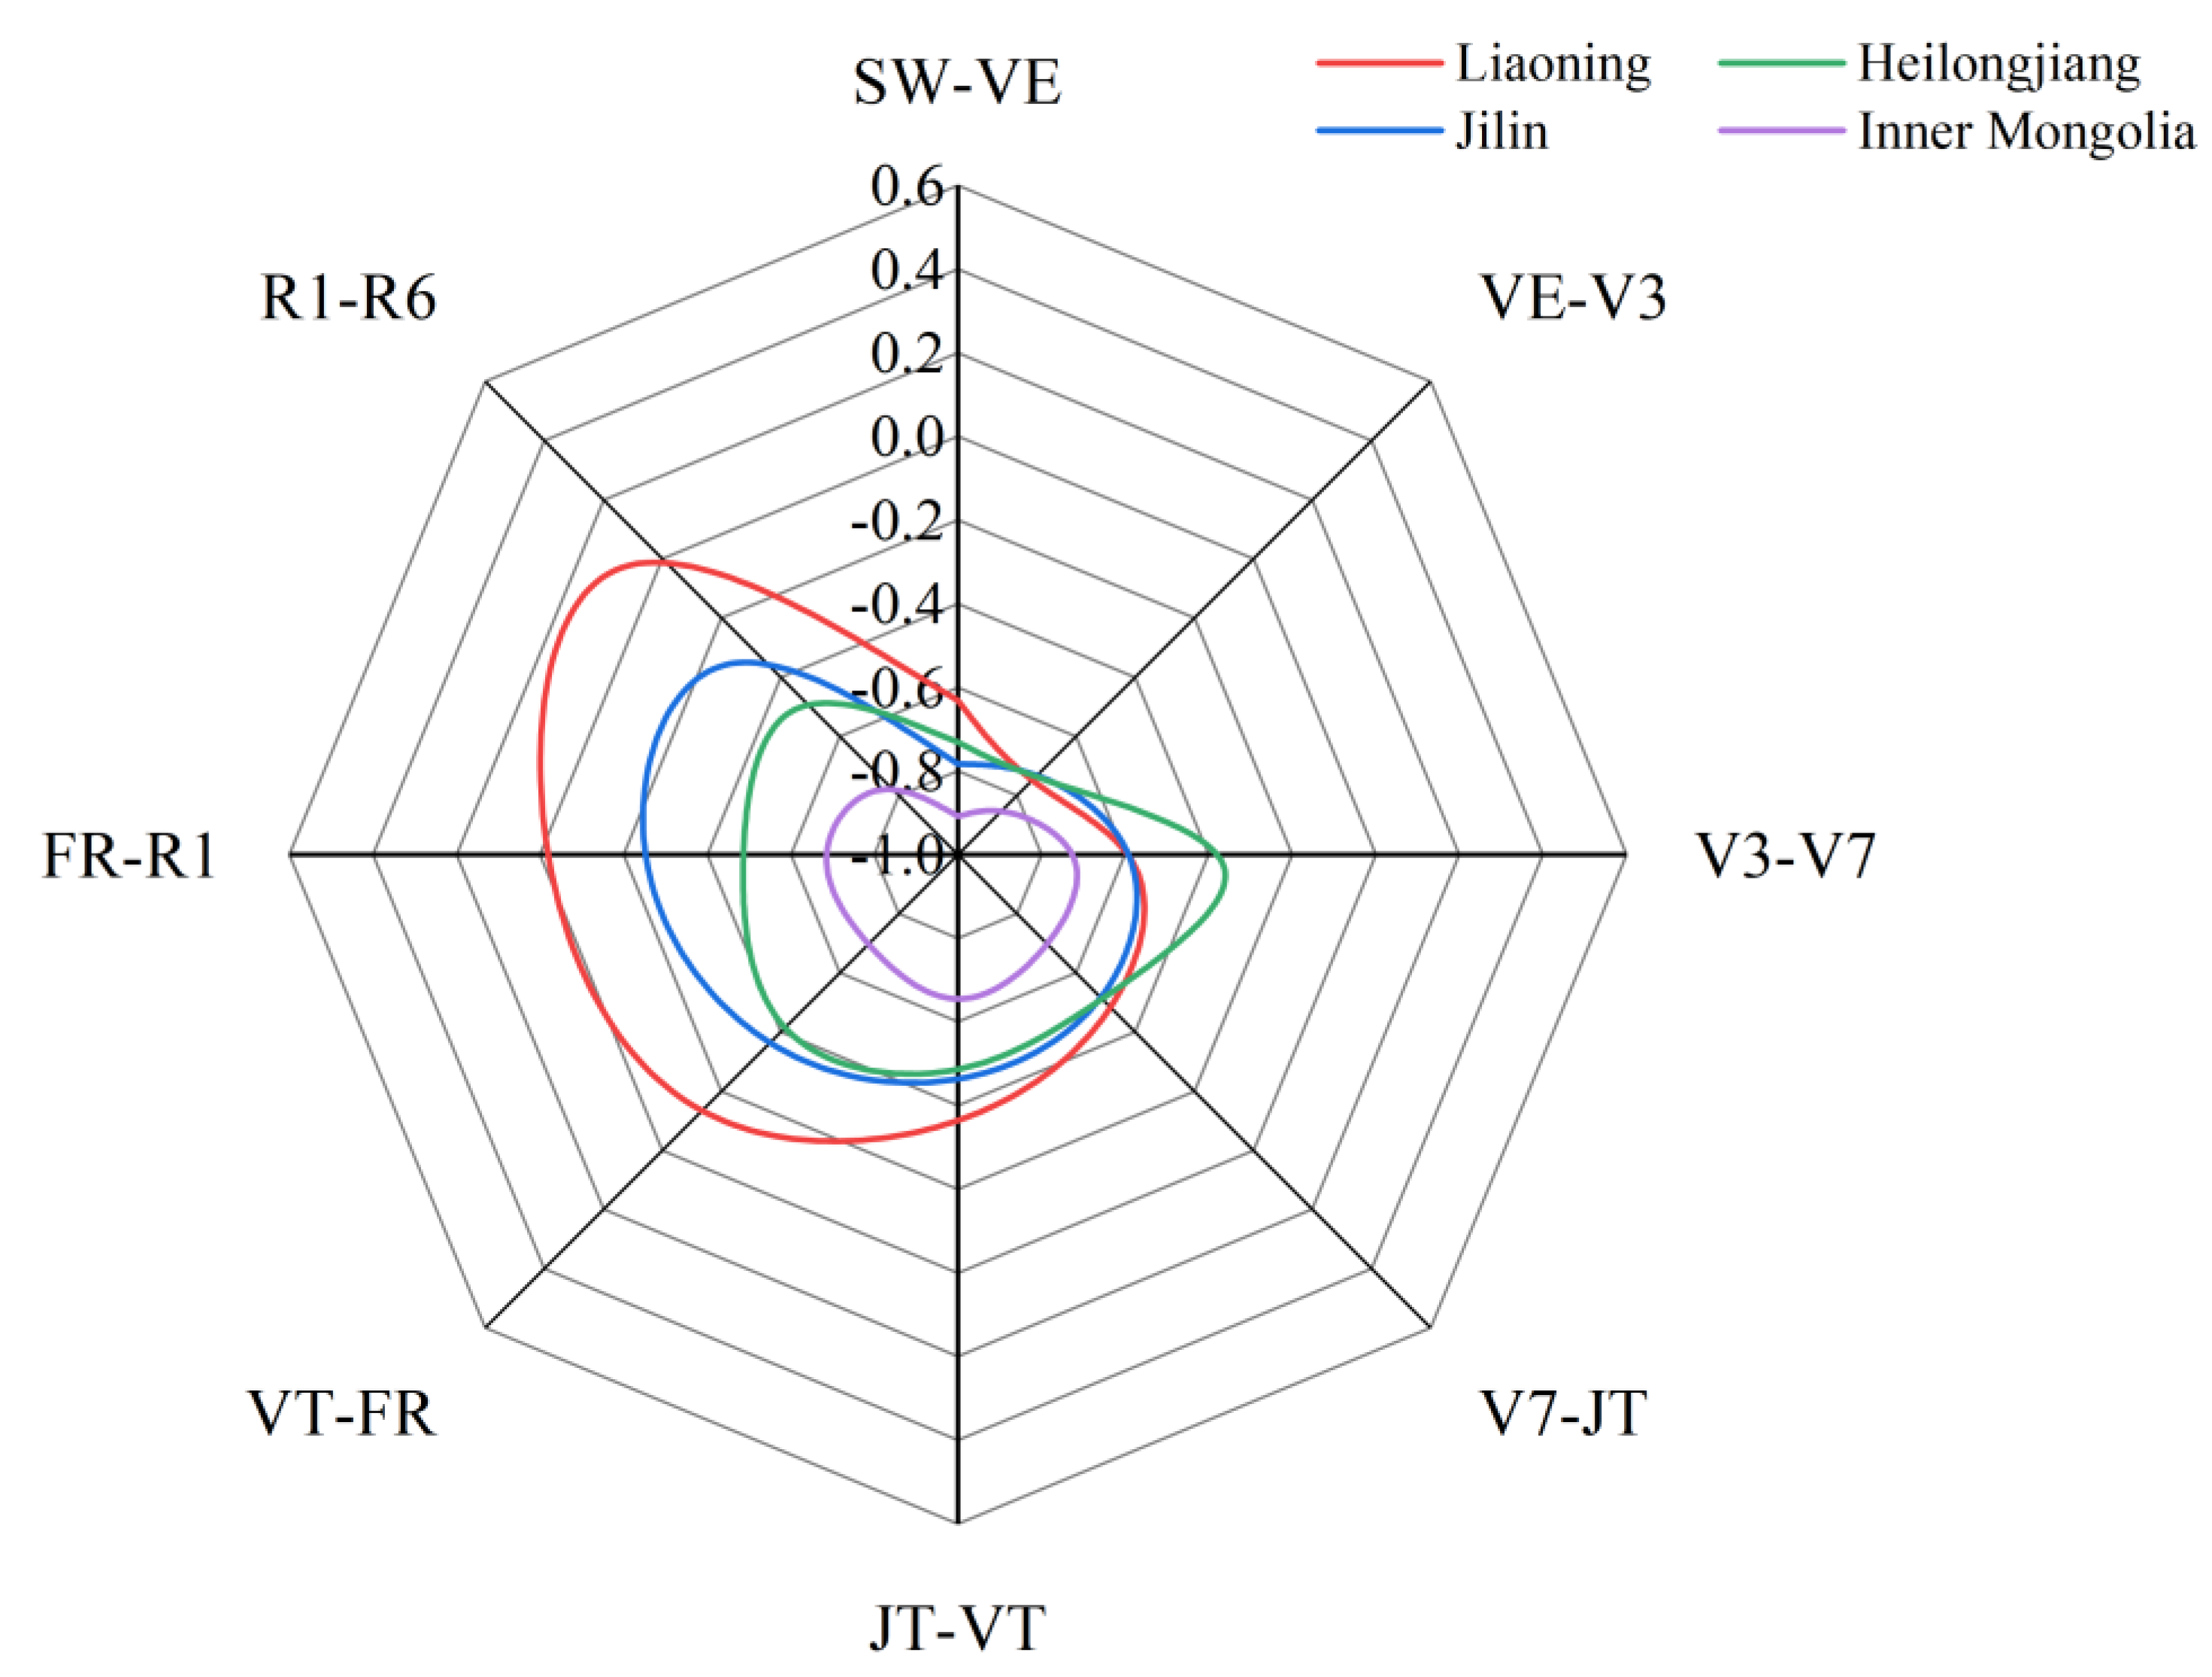
3.5. Water Surplus/Deficit Index in Different Maize Growth Stages in Northeast China

We used masking in ArcGIS to obtain the CWSDI in different maize growth stages in Northeast China (Figure 6). On the whole, all provinces had a low CWSDI in the early crop stages, and Liaoning and Jilin had the most favorable moisture conditions for grain fill later in the crop’s life. There were worse moisture conditions at the VE-V3 stages. However, since the VE-V3 stages have lower leaf surface area and transpiration is weaker, the water requirement is less compared to other growth stages, and less soil moisture in this stage helps root system development and enables the plant to make better use of soil moisture. Therefore, each region should focus on the VE-V3 stages of corn to ensure sufficient water levels.

3.6. Effect of the Dominant Meteorological Factors on the CWSDI

Table 4 shows the optimum multiple stepwise regression models describing the effects of meteorological factors on the CWSDI. The standardized coefficients show that the effects of each meteorological factor on the CWSDI in different growth stages are different. Precipitation has the largest effect on CWSDI in different growth stages, with standardized coefficients of 0.681, 0.564, 0.567, 0.646, 0.703, 0.703, 0.608, and 0.921, respectively. The effects of wind speed on the CWSDI are negative in different growth stages (−0.143, −0.138, −0.139, −0.111, −0.132, −0.179, −0.218, and −0.093, respectively). The minimum temperature affects CWSDI in four stages (SW-VE, JT-VT, VT-FR, and FR-R1), and the relative humidity influences it in three stages (V3-V7, V7-JT, and JT-VT). The sunshine hours and maximum temperature affect the CWSDI only in the SW-VE stage. The dominant meteorological factors affecting the drought and flooding status of maize in each growth stage are precipitation and wind speed, followed by minimum temperature, relative humidity, sunshine hours, and maximum temperature. The average temperature does not affect the drought and flooding status.

4. Discussion

Drought is a meteorological hazard with a significant impact on agriculture and a hot research topic. Effective precipitation showed a significantly decreasing trend. The downward trend in effective rainfall means that understanding the spatial and temporal occurrence of crop drought is becoming increasingly important in maintaining productivity. The drought index has been used to assess drought levels. Therefore, Chinese and international scientists have established drought indicators, including meteorological indicators [24], soil moisture indicators [25], crop physiological and ecological indicators [26], and other comprehensive monitoring indicators [27,28,29]. Commonly used drought indicators include the soil moisture content, crop water stress index, and Palmer drought index [30,31]. We used the CWSDI for drought and waterlogging classification. Crops experienced drought across most of the region in the SW and VE phases. The soil moisture is low, which is not conducive to corn emergence [32]. There was sustained drought through all growth stages in the western part of the region. An exceptional drought occurred in Inner Mongolia, southeastern Heilongjiang, and most parts of Jilin during this stage, substantially reducing the corn emergence rate. Therefore, these areas should use irrigation after sowing to replenish the soil moisture, monitor corn emergence, and replant areas with low emergence [33]. This study indicated that maize in Northeast China is most at risk of drought in its early growth stages, whereas the moisture was adequate in the other stages, which was generally consistent with the monthly distribution of annual rainfall in the northeast. A study showed that high emissions could increase the future risk of maize drought in China by 60–70% [34]. Inner Mongolia has the highest risk of drought in the agro-pastoral mosaic zone. Another study found that the drought risk was the highest in Heilongjiang and central Jilin, consistent with the results of this study. There is risk of waterlogging in the VT stage in the southern coastal part of the region. Rainfall was approximately equal to crop requirements during ripening, which has the potential to delay drying of the crop and harvest and cause flooding during harvest in the south. When a drought is accompanied by continuous high temperatures above 35 °C, the vitality of the pollen is adversely affected, leading to missing kernels [35]. An extended drought will delay the flowering time of corn. When the silking period is delayed, the number of cobs and empty cobs increases [36]. Therefore, farmers should select drought-resistant corn varieties and protect water resources to ensure sufficient water for corn. The moisture conditions were the best in the Liaoning region, especially in the late corn growth and development stage. There are some limitations in this research work due to data and methodology. We calculated the effective rainfall with an empirical equation, where α is the coefficient of precipitation. It depends on the precipitation characteristics [37], soil properties [38], crop growth [39], land cover [40], and other factors. It is typically derived from experiments and is based on local conditions. Due to our large study area, we could not obtain it from experiments, resulting in deviations between the calculation results and actual conditions. We did not cover stored water, particularly contributions from the winter fallow period that may support the crop in the SW and VE stages. The model does not consider drainage of excess water through the soil or down a slope in assessing the flooding risk. Therefore, in a follow-up study, we will establish an optimal model of the effective precipitation during the crop’s growing period and derive a multivariate geospatial model that considers latitude, longitude, and altitude to estimate effective precipitation in different regions. CWSDI considers the crop–soil–water system, and there is a simplicity in analyzing it by growth stage, as it is more useful than the P/E ratio by month and simpler than using a process-based model.
Due to climate warming, the temperatures are predicted to increase substantially in the middle- and high-latitude regions. For example, in Northeast China, the predicted temperature increase is 0.36 °C/10 a, which would increase the evaporation rate and reduce soil moisture and precipitation levels, further increasing the risk of drought disasters.
Significant changes in the northeastern climate in recent years have resulted in an insufficient agricultural water supply in the region. Many scholars investigated improvements in water use efficiency to reduce the influence of drought on corn production, such as combining mulch and furrow planting to minimize soil evaporation and increase production in China’s drought and low-rainfall areas [41]. The optimal fertilization depth was changed to improve the water utilization rate and increase maize yield [42]. Cover crops are beneficial because they reduce soil moisture and nutrient losses [43], especially during the vegetative growth phase of maize when the water supply is limited [44]. Irrigation in the west, alternative crops with lower water requirements, lower plant density, or winter crops could also be used. In the face of waterlogging risks, it may be possible to consider methods such as optimizing drainage facilities or changing the slope. Researchers should focus on the innate response of major food crops to droughts and floods to develop mitigation measures [45].

5. Conclusions

The effective precipitation in Northeast China showed a decreasing trend from 1981 to 2015. The drought risk increased, and the spatial distribution of the water requirements of maize in each growth stage showed a decreasing trend from west to east. The crop water requirement was lowest at the SW stage and increased gradually to a maximum at silking before declining during the harvesting stage. The ranking of the daily water requirements in different growth stages from high to low was FR-R1 (6.9 mm/d), VT-FR (6.1 mm/d), JT-VT (4.9 mm/d), V7-JT (3.4 mm/d), R1-R6 (2 mm/d), VE-V3 (1.4 mm/d), V3-V7 (1.3 mm/d), and SW-VE (1.2 mm/d).
Drought is a major meteorological disaster affecting maize growth in Northeast China. It occurred primarily in the early stage of maize growth and development, and the most risk was observed in the SW to VE stages and the SW to V3 stages. Waterlogging risk occurred mainly in the flowering to silking stages and the silking to maturity stages in southeastern Liaoning and some parts of Jilin. Inner Mongolia had the lowest moisture conditions and was not suitable for growing corn, followed by Heilongjiang, Jilin, and Liaoning. We used detailed corn growth period data and meteorological data and established a CWSDI model to assess the moisture condition of corn in different growth stages in Northeast China. The results provide information for selecting corn varieties and implementing water conservation measures. In addition, CWSDI analysis has identified drought as a limitation at the SW–VE stages across most of the region. Conservation of soil water from the winter fallow period is needed to provide a buffer to ensure the crop develops over this period. Drought is a limitation during all growth stages in the western part of the region, and this can only be relieved by irrigation. Flooding is only a risk in the southern coastal parts of the region during the tasseling and ripening stages. This may affect crop drying and harvest prior to winter.
In the context of climate warming, it is critical to utilize water resources wisely to ensure sufficient crop yields globally. This study provides insights into allocating limited water resources in different growth stages of maize. It is necessary to consider various factors and integrate new technologies due to the complexity of agricultural drought, which is also affected by the tillage system, human activities, crop varieties, and other factors. Drought indicators have limitations at temporal and spatial scales. Our results can be used to guide the development of water-saving agriculture and intelligent agriculture.

Author Contributions

X.W. analyzed the data and prepared the draft manuscript. H.Z. and C.S. provided comments and substantially revised the manuscript. S.Y. conceived the study, provided comments, and revised the manuscript. X.L., J.G. and W.S. revised the manuscript. All authors have read and agreed to the published version of the manuscript.

Funding

The Ministry of Science and Technology (MOST) of China supported this work (grant number: 2017YFD0300400).

Conflicts of Interest

The authors declare no conflict of interest.

References

  1. Akram, M.A.; Wahid, A.; Abrar, M.; Manan, A.; Naeem, S.; Zahid, M.A.; Gilani, M.M.; Paudyal, R.; Gong, H.Y.; Ran, J.Z.; et al. Comparative study of six maize (Zea mays L.) cultivars concerning cadmium uptake, partitioning and tolerance. Appl. Ecol. Environ. Res. 2021, 19, 2305–2331. [Google Scholar] [CrossRef]
  2. Rouf Shah, T.; Prasad, K.; Kumar, P. Maize—A potential source of human nutrition and health: A review. Cogent Food Agric. 2016, 2, 1166995. [Google Scholar] [CrossRef]
  3. Qin, F.-Y.; Jia, G.-S.; Yang, J.; Na, Y.-T.; Hou, M.-T. Narenmandula Spatiotemporal variability of precipitation during 1961–2014 across the Mongolian Plateau. J. Mt. Sci. 2018, 15, 992–1005. [Google Scholar] [CrossRef]
  4. Liang, L.; Li, L.; Liu, Q. Precipitation variability in Northeast China from 1961 to 2008. J. Hydrol. 2011, 404, 67–76. [Google Scholar] [CrossRef]
  5. Zhang, X.; Liu, X.; Wang, W.; Zhang, T.; Zeng, X.; Xu, G.; Wu, G.; Kang, H. Spatiotemporal variability of drought in the northern part of northeast China. Hydrol. Process. 2018, 32, 1449–1460. [Google Scholar] [CrossRef]
  6. Hui, P.; Wei, F.; Xiao, Y.; Yang, J.; Xu, J.; Tang, J. Future projection of extreme precipitation within CORDEX East Asia phase II: Multi-model ensemble. Theor. Appl. Climatol. 2022, 150, 1271–1293. [Google Scholar] [CrossRef]
  7. Rahman, M.R.; Lateh, H. Meteorological drought in Bangladesh: Assessing, analysing and hazard mapping using SPI, GIS and monthly rainfall data. Environ. Earth Sci. 2016, 75, 1026. [Google Scholar] [CrossRef]
  8. Tian, L.; Li, J.; Bi, W.; Zuo, S.; Li, L.; Li, W.; Sun, L. Effects of waterlogging stress at different growth stages on the photosynthetic characteristics and grain yield of spring maize (Zea mays L.) Under field conditions. Agric. Water Manag. 2019, 218, 250–258. [Google Scholar] [CrossRef]
  9. Huang, C.; Zhang, W.; Wang, H.; Gao, Y.; Ma, S.; Qin, A.; Liu, Z.; Zhao, B.; Ning, D.; Zheng, H.; et al. Effects of waterlogging at different stages on growth and ear quality of waxy maize. Agric. Water Manag. 2022, 266, 107603. [Google Scholar] [CrossRef]
  10. Han, L.; Zhang, Q.; Zhang, Z.; Jia, J.; Wang, Y.; Huang, T.; Cheng, Y. Drought area, intensity and frequency changes in China under climate warming, 1961–2014. J. Arid. Environ. 2021, 193, 104596. [Google Scholar] [CrossRef]
  11. Wang, L.; Yuan, X.; Xie, Z.; Wu, P.; Li, Y. Increasing flash droughts over China during the recent global warming hiatus. Sci. Rep. 2016, 6, 30571. [Google Scholar] [CrossRef] [Green Version]
  12. Shen, X.; Liu, B.; Xue, Z.; Jiang, M.; Lu, X.; Zhang, Q. Spatiotemporal variation in vegetation spring phenology and its response to climate change in freshwater marshes of Northeast China. Sci. Total Environ. 2019, 666, 1169–1177. [Google Scholar] [CrossRef]
  13. Yang, X.; Sun, J.; Gao, J.; Qiao, S.; Zhang, B.; Bao, H.; Feng, X.; Wang, S. Effects of Climate Change on Cultivation Patterns and Climate Suitability of Spring Maize in Inner Mongolia. Sustainability 2021, 13, 8072. [Google Scholar] [CrossRef]
  14. Wang, X.; Li, X.; Gu, J.; Shi, W.; Zhao, H.; Sun, C.; You, S. Mapping of Phenological Traits in Northeast China Maize (Zea mays L.). Agronomy 2022, 12, 2585. [Google Scholar] [CrossRef]
  15. Guo, Y.; Lu, X.; Zhang, J.; Li, K.; Wang, R.; Rong, G.; Liu, X.; Tong, Z. Joint analysis of drought and heat events during maize (Zea mays L.) growth periods using copula and cloud models: A case study of Songliao Plain. Agric. Water Manag. 2022, 259, 107238. [Google Scholar] [CrossRef]
  16. Luo, W.; Chen, M.; Kang, Y.; Li, W.; Li, D.; Cui, Y.; Khan, S.; Luo, Y. Analysis of crop water requirements and irrigation demands for rice: Implications for increasing effective rainfall. Agric. Water Manag. 2022, 260, 107285. [Google Scholar] [CrossRef]
  17. Han, X.; Zhou, Q.; Zhang, B.; Che, Z.; Wei, Z.; Qiu, R.; Chen, H.; Li, Y.; Du, T. Real-time methods for short and medium-term evapotranspiration forecasting using dynamic crop coefficient and historical threshold. J. Hydrol. 2022, 606, 127414. [Google Scholar] [CrossRef]
  18. Hou, X.; Fan, J.; Zhang, F.; Hu, W.; Yan, F.; Xiao, C.; Li, Y.; Cheng, H. Determining water use and crop coefficients of drip-irrigated cotton in south Xinjiang of China under various irrigation amounts. Ind. Crops Prod. 2022, 176, 114376. [Google Scholar] [CrossRef]
  19. Jafari, M.; Kamali, H.; Keshavarz, A.; Momeni, A. Estimation of evapotranspiration and crop coefficient of drip-irrigated orange trees under a semi-arid climate. Agric. Water Manag. 2021, 248, 106769. [Google Scholar] [CrossRef]
  20. Allen, R.G.; Pruitt, W.O.; Wright, J.L.; Howell, T.A.; Ventura, F.; Snyder, R.; Itenfisu, D.; Steduto, P.; Berengena, J.; Yrisarry, J.B.; et al. A recommendation on standardized surface resistance for hourly calculation of reference ETo by the FAO56 Penman-Monteith method. Agric. Water Manag. 2006, 81, 1–22. [Google Scholar] [CrossRef]
  21. Liu, Z.; Yan, T. Comparison of spatial interpolation methods based on ArcGIS. J. Phys. Conf. Ser. 2021, 1961, 012050. [Google Scholar] [CrossRef]
  22. Nwokoro, C.C.; Kreye, C.; Necpalova, M.; Adeyemi, O.; Barthel, M.; Pypers, P.; Hauser, S.; Six, J. Cassava-maize intercropping systems in southern Nigeria: Radiation use efficiency, soil moisture dynamics, and yields of component crops. Field Crops Res. 2022, 283, 108550. [Google Scholar] [CrossRef] [PubMed]
  23. Fang, Y.-H.; Chen, H.-S.; Teng, F.-D.; Wang, X.-J.; Wang, J.; Zhao, C.-Y. Changing contribution rate of heavy rainfall to the rainy season precipitation in Northeast China and its possible causes. Atmos. Res. 2017, 197, 437–445. [Google Scholar] [CrossRef]
  24. Bevacqua, A.G.; Chaffe, P.L.; Chagas, V.B.; AghaKouchak, A. Spatial and temporal patterns of propagation from meteorological to hydrological droughts in Brazil. J. Hydrol. 2021, 603, 126902. [Google Scholar] [CrossRef]
  25. Watson, A.; Miller, J.; Künne, A.; Kralisch, S. Using soil-moisture drought indices to evaluate key indicators of agricultural drought in semi-arid Mediterranean Southern Africa. Sci. Total. Environ. 2022, 812, 152464. [Google Scholar] [CrossRef]
  26. Nabati, J.; Nezami, A.; Neamatollahi, E.; Akbari, M. GIS-based agro-ecological zoning for crop suitability using fuzzy inference system in semi-arid regions. Ecol. Indic. 2020, 117, 106646. [Google Scholar] [CrossRef]
  27. Han, J.; Zhang, J.; Yang, S.; Cao, D.; Prodhan, F.A.; Sharma, T.P.P. A new composite index for global soil plant atmosphere continuum drought monitoring combing remote-sensing based terrestrial water storage and vapor pressure deficit anomalies. J. Hydrol. 2022, 615, 128622. [Google Scholar] [CrossRef]
  28. Kamalanandhini, M.; Annadurai, R. Assessment of five meteorological indices for monitoring the drought condition in Chengalpattu District, Tamilnadu, India. Mater. Today Proc. 2021, 46, 3699–3703. [Google Scholar] [CrossRef]
  29. Ali, Z.; Hussain, I.; Grzegorczyk, M.A.; Ni, G.; Faisal, M.; Qamar, S.; Shoukry, A.M.; Sharkawy, M.A.W.; Gani, S.; Al-Deek, F.F. Bayesian network based procedure for regional drought monitoring: The Seasonally Combinative Regional Drought Indicator. J. Environ. Manag. 2020, 276, 111296. [Google Scholar] [CrossRef]
  30. Wang, Z.; Yang, Y.; Zhang, C.; Guo, H.; Hou, Y. Historical and future Palmer Drought Severity Index with improved hydrological modeling. J. Hydrol. 2022, 610, 127941. [Google Scholar] [CrossRef]
  31. Zhou, Y.; Zhou, P.; Jin, J.; Wu, C.; Cui, Y.; Zhang, Y.; Tong, F. Drought identification based on Palmer drought severity index and return period analysis of drought characteristics in Huaibei Plain China. Environ. Res. 2022, 212, 113163. [Google Scholar] [CrossRef]
  32. Liu, X.; Wang, Y.; Yan, X.; Hou, H.; Liu, P.; Cai, T.; Zhang, P.; Jia, Z.; Ren, X.; Chen, X. Appropriate ridge-furrow ratio can enhance crop production and resource use efficiency by improving soil moisture and thermal condition in a semi-arid region. Agric. Water Manag. 2020, 240, 106289. [Google Scholar] [CrossRef]
  33. Harris, D. Development and Testing of “On-Farm” Seed Priming. Adv. Agron. 2006, 90, 129–178. [Google Scholar]
  34. Huang, M.; Wang, J.; Wang, B.; Liu, D.L.; Feng, P.; Yu, Q.; Pan, X.; Waters, C. Assessing maize potential to mitigate the adverse effects of future rising temperature and heat stress in China. Agric. For. Meteorol. 2021, 311, 108673. [Google Scholar] [CrossRef]
  35. Das, S.; Krishnan, P.; Nayak, M.; Ramakrishnan, B. High temperature stress effects on pollens of rice (Oryza sativa L.) genotypes. Environ. Exp. Bot. 2014, 101, 36–46. [Google Scholar] [CrossRef]
  36. Silva, P.C.; Sánchez, A.C.; Opazo, M.A.; Mardones, L.A.; Acevedo, E.A. Grain yield, anthesis-silking interval, and phenotypic plasticity in response to changing environments: Evaluation in temperate maize hybrids. Field Crops Res. 2022, 285, 108583. [Google Scholar] [CrossRef]
  37. Sharma, A.; Sharma, D.; Panda, S.K. Assessment of spatiotemporal trend of precipitation indices and meteorological drought characteristics in the Mahi River basin, India. J. Hydrol. 2022, 605, 127314. [Google Scholar] [CrossRef]
  38. Chen, J.; Luo, W.; Zeng, G.; Wang, Y.; Lyu, Y.; Cai, X.; Zhang, L.; Cheng, A.; Zhang, X.; Wang, S. Response of surface evaporation and subsurface leakage to precipitation for simulated epikarst with different rock–soil structures. J. Hydrol. 2022, 610, 127850. [Google Scholar] [CrossRef]
  39. Wang, X.; Cui, G.; Wu, F.; Li, C. Analysis of temporal-spatial precipitation variations during the crop growth period in the Lancang River basin, southwestern China. Ecol. Eng. 2015, 76, 47–56. [Google Scholar] [CrossRef]
  40. Chu, X.-L.; Lu, Z.; Wei, D.; Lei, G.-P. Effects of land use/cover change (LUCC) on the spatiotemporal variability of precipitation and temperature in the Songnen Plain, China. J. Integr. Agric. 2022, 21, 235–248. [Google Scholar] [CrossRef]
  41. Cai, W.; Gu, X.; Du, Y.; Chang, T.; Lu, S.; Zheng, X.; Bai, D.; Song, H.; Sun, S.; Cai, H. Effects of mulching on water saving, yield increase and emission reduction for maize in China. Agric. Water Manag. 2022, 274, 107954. [Google Scholar] [CrossRef]
  42. Wu, P.; Liu, F.; Wang, J.; Liu, Y.; Gao, Y.; Zhang, X.; Chen, G.; Huang, F.; Ahmad, S.; Zhang, P.; et al. Suitable fertilization depth can improve the water productivity and maize yield by regulating development of the root system. Agric. Water Manag. 2022, 271, 107784. [Google Scholar] [CrossRef]
  43. Leuthold, S.J.; Salmerón, M.; Wendroth, O.; Poffenbarger, H. Cover crops decrease maize yield variability in sloping landscapes through increased water during reproductive stages. Field Crops Res. 2021, 265, 108111. [Google Scholar] [CrossRef]
  44. Fang, Q.; Wang, Y.; Uwimpaye, F.; Yan, Z.; Li, L.; Liu, X.; Shao, L. Pre-sowing soil water conditions and water conservation measures affecting the yield and water productivity of summer maize. Agric. Water Manag. 2021, 245, 106628. [Google Scholar] [CrossRef]
  45. Ward, P.J.; de Ruiter, M.C.; Mård, J.; Schröter, K.; Van Loon, A.; Veldkamp, T.; von Uexkull, N.; Wanders, N.; AghaKouchak, A.; Arnbjerg-Nielsen, K.; et al. The need to integrate flood and drought disaster risk reduction strategies. Water Secur. 2020, 11, 100070. [Google Scholar] [CrossRef]
Figure 1. Spatial distribution of meteorological station and phenological data location in Northeast China.
Agronomy 13 00374 g001
Figure 2. Effective precipitation trend during the growing season of maize in Northeast China, 1981–2015.
Agronomy 13 00374 g002
Figure 3. Daily water requirement during the maize growing stage in Northeast China. NOTE: SW: sowing stage; VE: emergence stage; V3: three-leaf stage; V7: seven-leaf stage; JT: jointing stage; VT: tasseling stage; FR: flowering stage; R1: silking stage; R6: harvesting stage.
Agronomy 13 00374 g003
Figure 4. Spatial distribution of total water requirements in different growth stages of maize in Northeast China. NOTE: SW: sowing stage; VE: emergence stage; V3: three-leaf stage; V7: seven-leaf stage; JT: jointing stage; VT: tasseling stage; FR: flowering stage; R1: silking stage; R6: harvesting stage.
Agronomy 13 00374 g004aAgronomy 13 00374 g004b
Figure 5. Spatial distribution of drought and waterlogging levels in the maize growth stages in Northeast China. NOTE: SW: sowing stage; VE: emergence stage; V3: three-leaf stage; V7: seven-leaf stage; JT: jointing stage; VT: tasseling stage; FR: flowering stage; R1: silking stage; R6: harvesting stage.
Agronomy 13 00374 g005
Figure 6. Water surplus/deficit index in different maize growth stages in Northeast China.
Agronomy 13 00374 g006
Table 1. Duration of each stage of maize in Northeast China.
Growth StageSW-VEVE-V3V3-V7V7-JTJT-VTVT-FRFR-R1R1-R6
Duration (days)16 d7 d14 d20 d20 d3 d2 d58 d
NOTE: When the effective precipitation is calculated for two adjacent growth stages at a site, the time frame is the average number of days for the two phenological stages preceding the phenological stage of interest. For example, if the maize VE stage at site A is 130 d, and the interval between the SW and VE stages in the northeast is 16 d, the period for calculating the effective precipitation is 114–130 d.
Table 2. Crop coefficients in different growth stages of maize.
Growth StageSW-VEVE-V3V3-V7V7-JTJT-VTVT-FRFR-R1R1-R6
Crop coefficient0.30.30.30.751.21.21.20.6
Table 3. Range of CWSDI in each growth stage.
Level CWSDI in Different Growth Stages (%)
SW-VEVE-V3V3-V7V7-JTJT-VTVT-FRFR-R1R1-R6
Normal(−45,45](−50,50](−50,50](−50,50](−35,35](−35,35](−35,35](−50,50]
Light drought(−60,−45](−65,−50](−65,−50](−65,−50](−50,−35](−45,−35](−45,−35](−60,−50]
Moderate drought(−70,−60](−75,65](−75,65](−75,65](−60,−50](−55,−45](−55,−45](−70,60]
Heavy drought(−80,−70](−85,−75](−85,−75](−85,−75](−70,−60](−65,−55](−65,−55](−80,−70]
Extreme drought(−∞,−80](−∞,−85](−∞,−85](−∞,−85](−∞,−70](−∞,−65](−∞,−65](−∞,−80]
Light flood(45,60](50,65](50,65](50,65](35,50](35,45](35,45](50,60]
Moderate flood(60,70](65,75](65,75](65,75](50,60](45.55](45.55](60,70]
Heavy flood(70,80](75,85](75,85](75,85](60,70](55,65](55,65](70,80]
Extreme flood(80,∞](85,∞](85,∞](85,∞](70,∞](65,∞](65,∞](80,∞]
Table 4. Results of multiple stepwise regression models in different maize growth stages.
Developmental StagesModel
Variables
Unstandardized
Coefficient
Standardized CoefficientSig.
SW-VEMC
PRE
SSD
Tmax
Tmin
WV
−1.318
0.327
0.165
−0.075
0.045
−0.081

0.681
0.528
−0.485
0.333
−0.143
0.001
0.000
0.000
0.000
0.002
0.024
VE-V3MC
PRE
WV
−1.023
0.299
−0.101

0.564
−0.138
0.000
0.000
0.025
V3-V7MC
PRE
RHU
WV
−1.733
0.357
1.188
−0.141

0.567
0.166
−0.139
0.000
0.000
0.008
0.014
V7-JTMC
PRE
RHU
WV
−1.473
0.135
0.648
−0.048

0.646
0.219
−0.111
0.000
0.000
0.000
0.020
JT-VTMC
PRE
RHU
WV
Tmin
−1.819
0.160
0.697
−0.076
0.016

0.703
0.154
−0.132
0.108
0.000
0.000
0.001
0.003
0.009
VT-FRMC
PRE
Tmin
WV
−2.202
0.159
0.085
−0.265

0.703
0.223
−0.179
0.000
0.000
0.000
0.000
FR-R1MC
PRE
WV
Tmin
−1.573
0.136
−0.332
0.067

0.608
−0.218
0.178
0.000
0.000
0.000
0.001
R1-R6MC
PRE
WV
−1.278
0.408
−0.151

0.921
−0.093
0.000
0.000
0.000
NOTE: MC: Mathematical constant; PRE: Precipitation; Tmax: Maximum temperature; Tmin: Minimum temperature; SSD: Sunshine hours; WV: Wind speed; RHU: Relative humidity.
Disclaimer/Publisher’s Note: The statements, opinions and data contained in all publications are solely those of the individual author(s) and contributor(s) and not of MDPI and/or the editor(s). MDPI and/or the editor(s) disclaim responsibility for any injury to people or property resulting from any ideas, methods, instructions or products referred to in the content.

