
A Micro-Scale Approach for Cropland Suitability Assessment of Permanent Crops Using Machine Learning and a Low-Cost UAV


Abstract
:1. Introduction
2. Materials and Methods
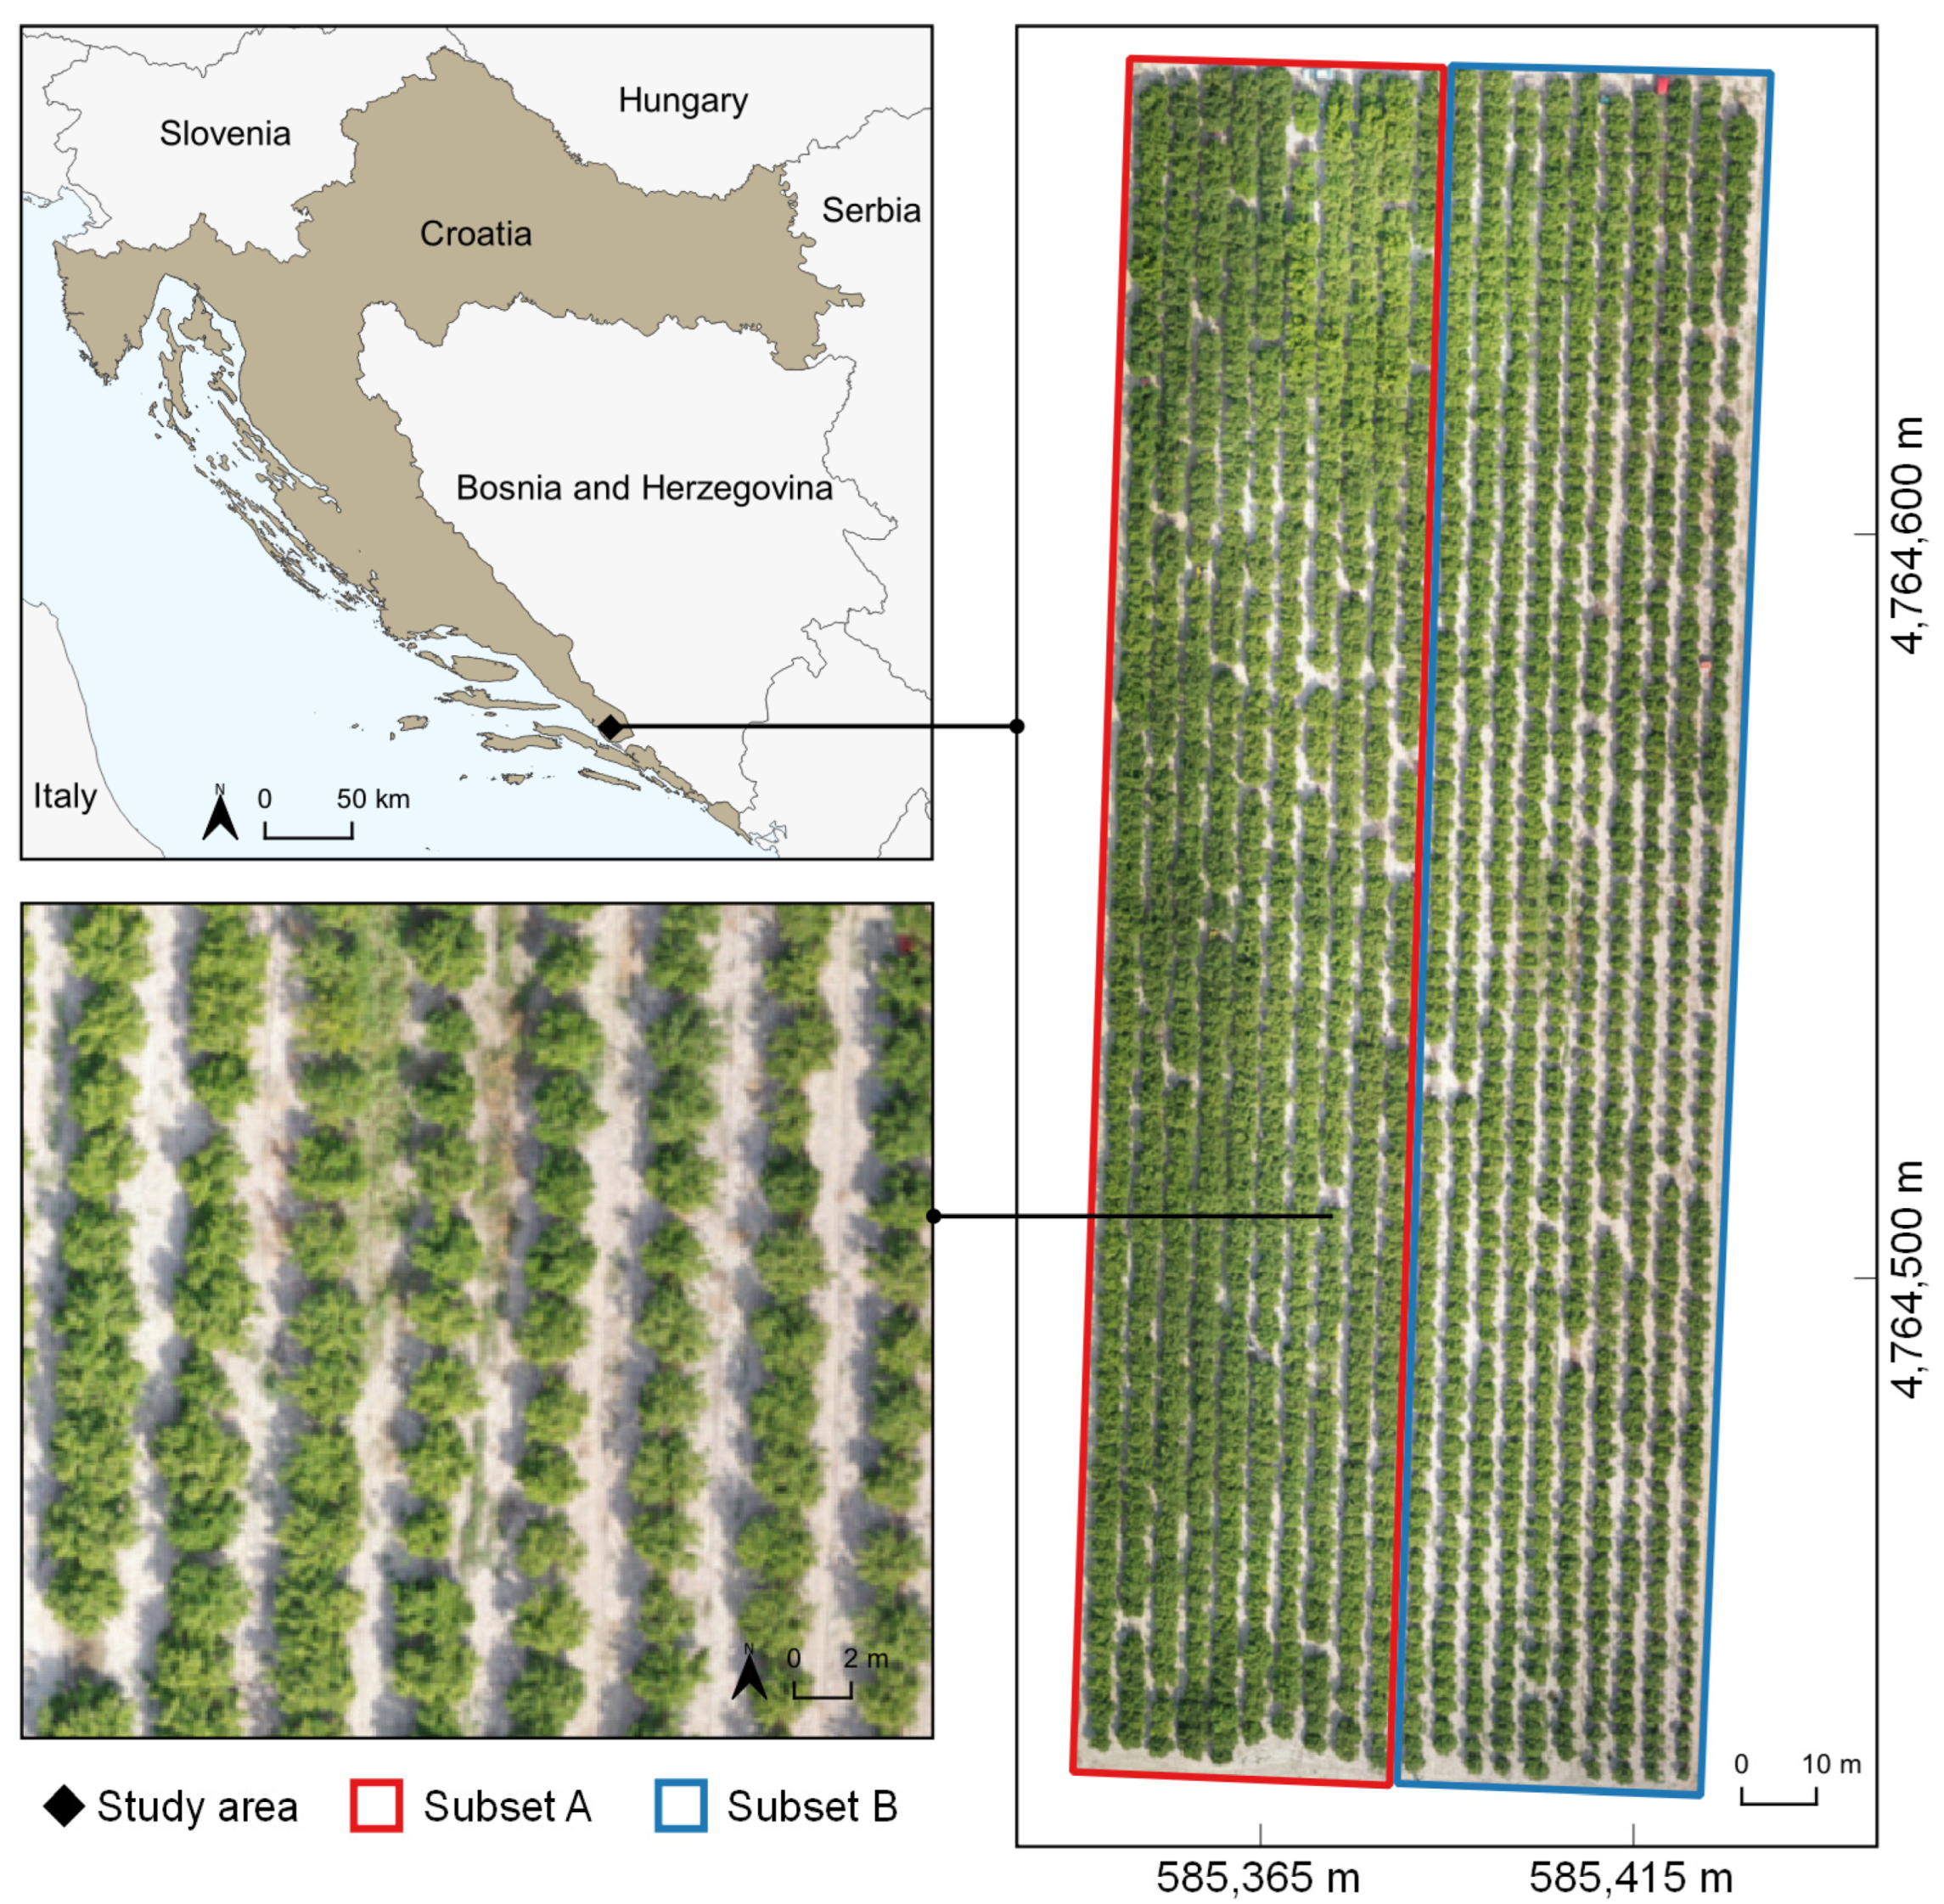
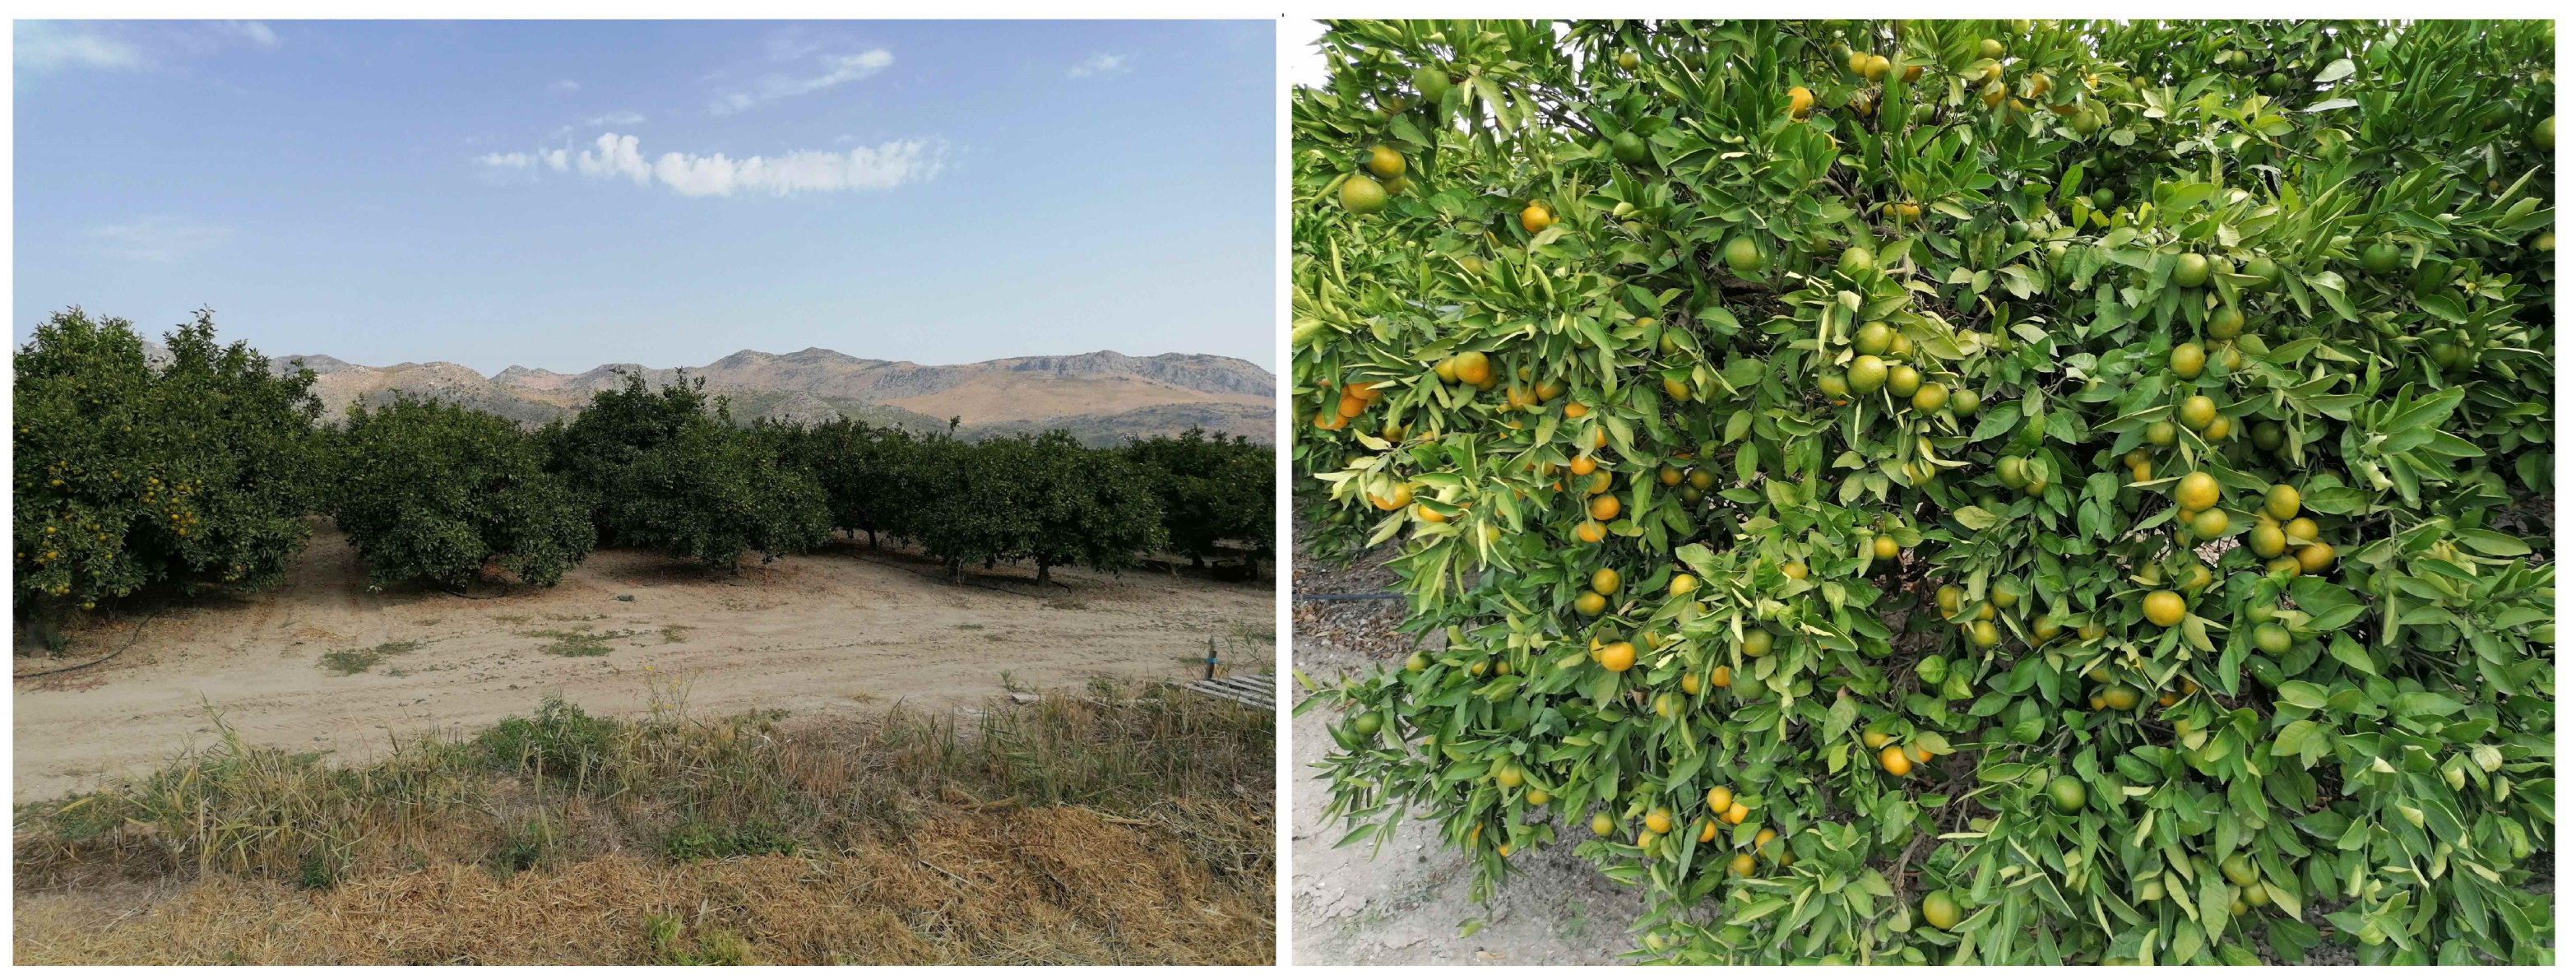
2.1. Study Area
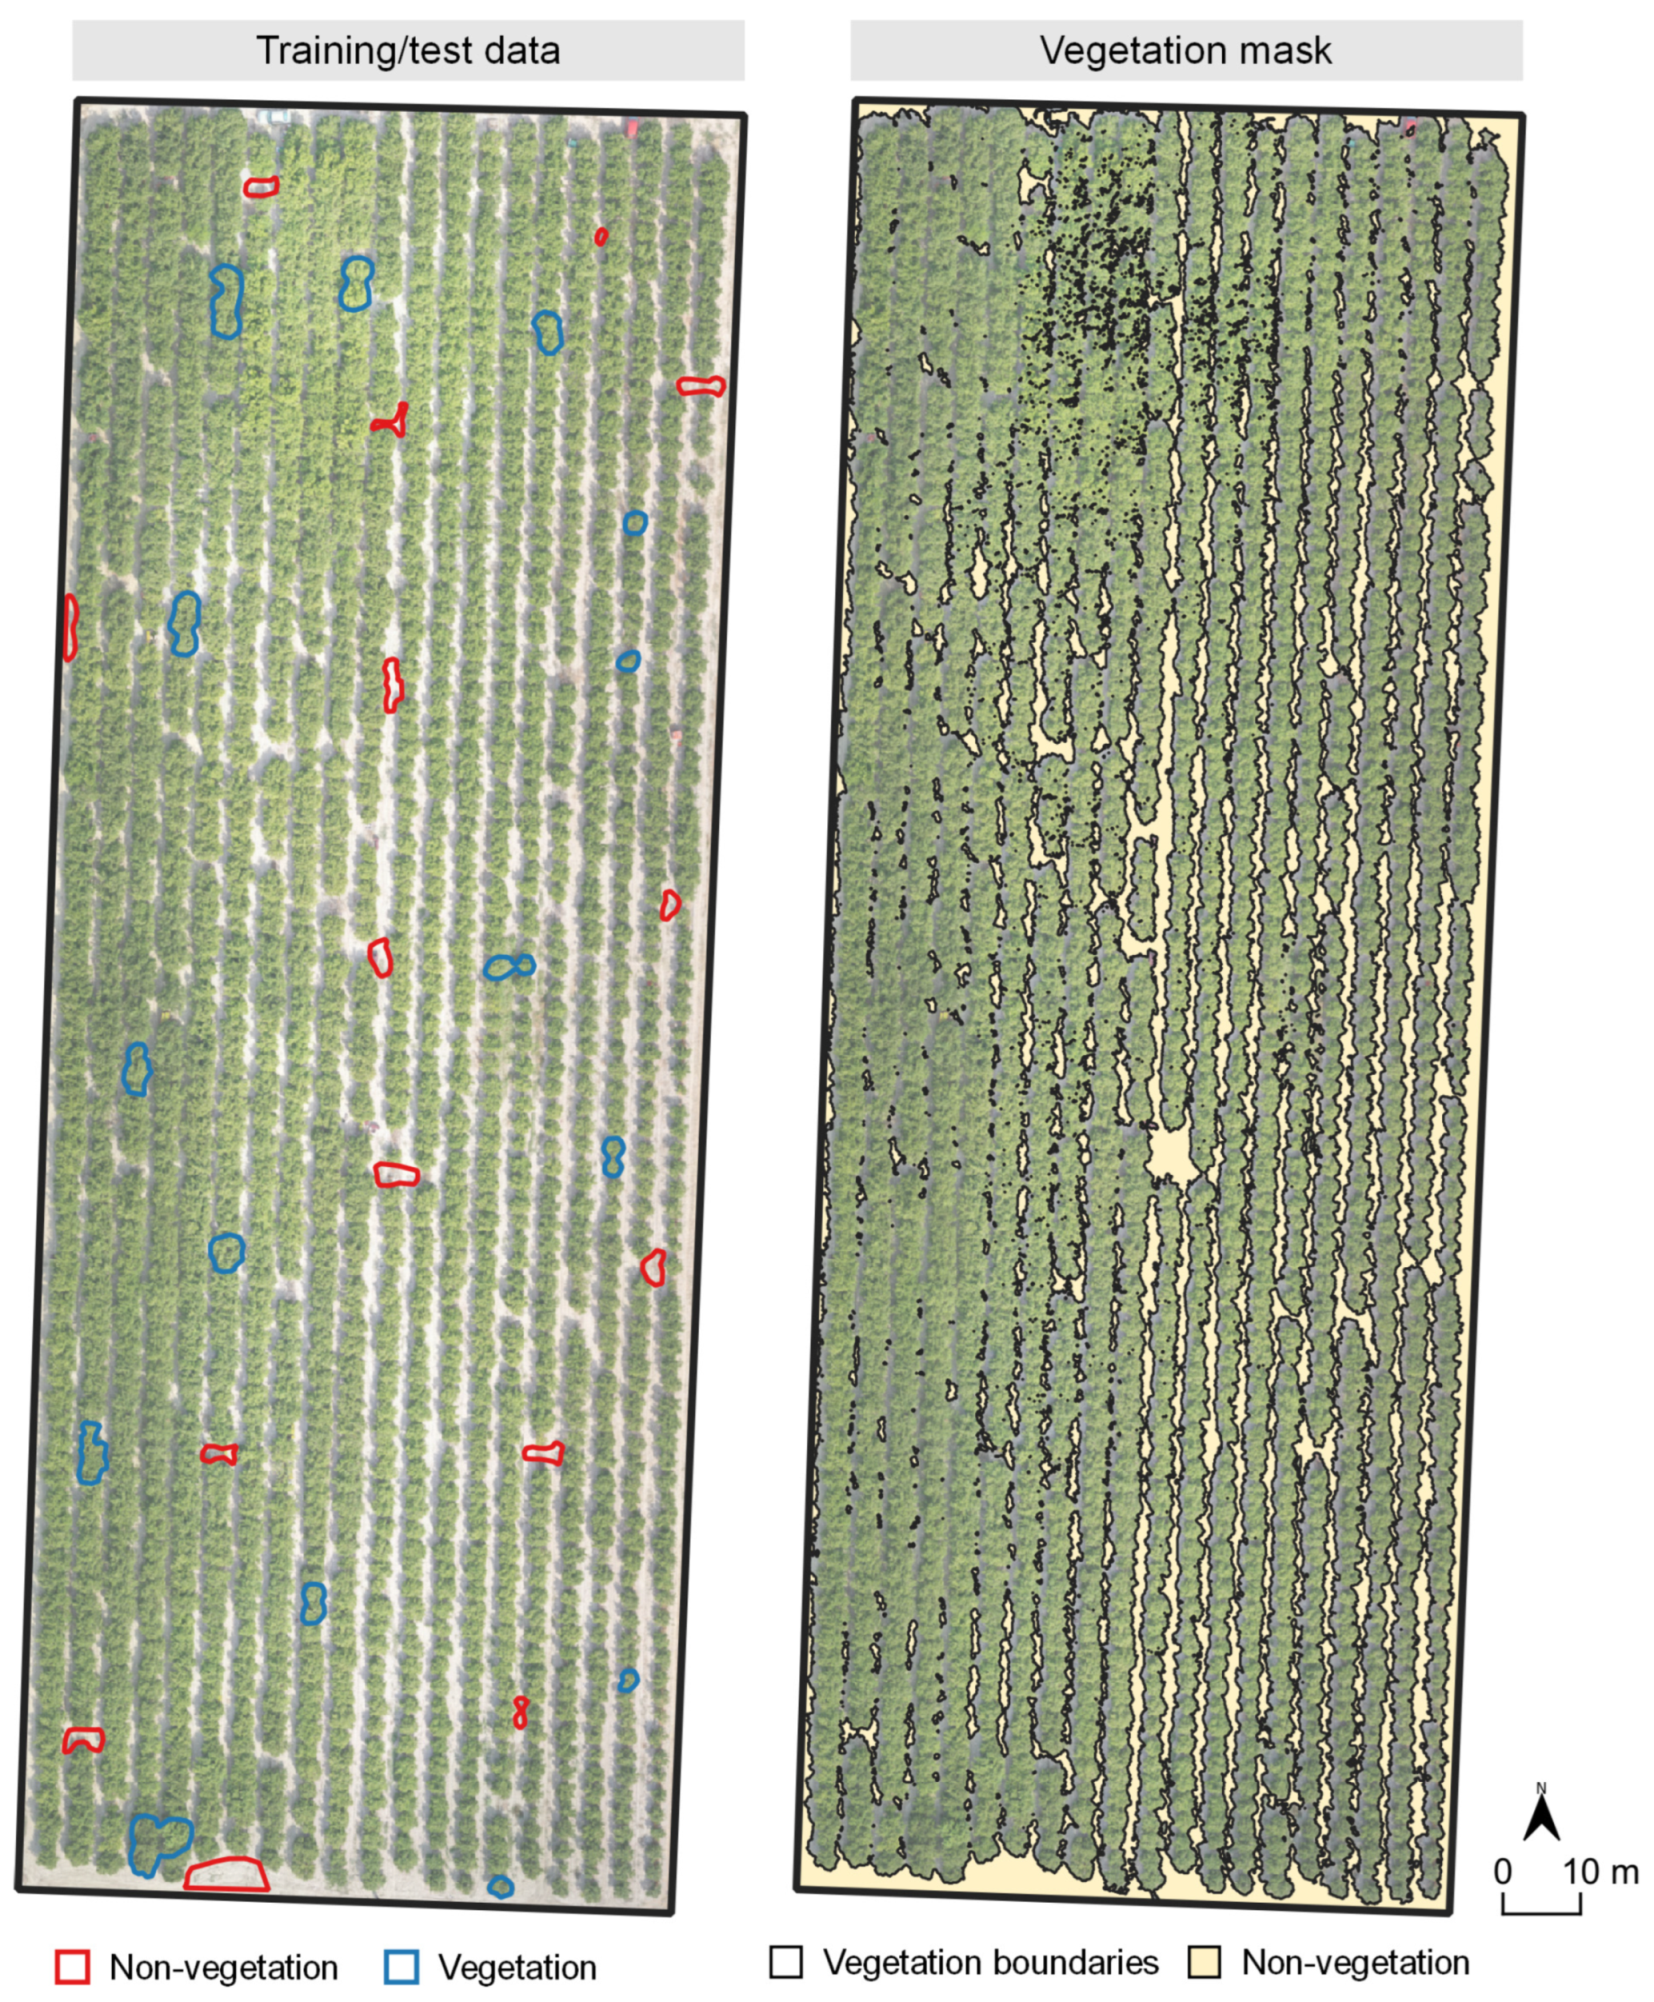
2.2. Fieldwork and Data Acquiring
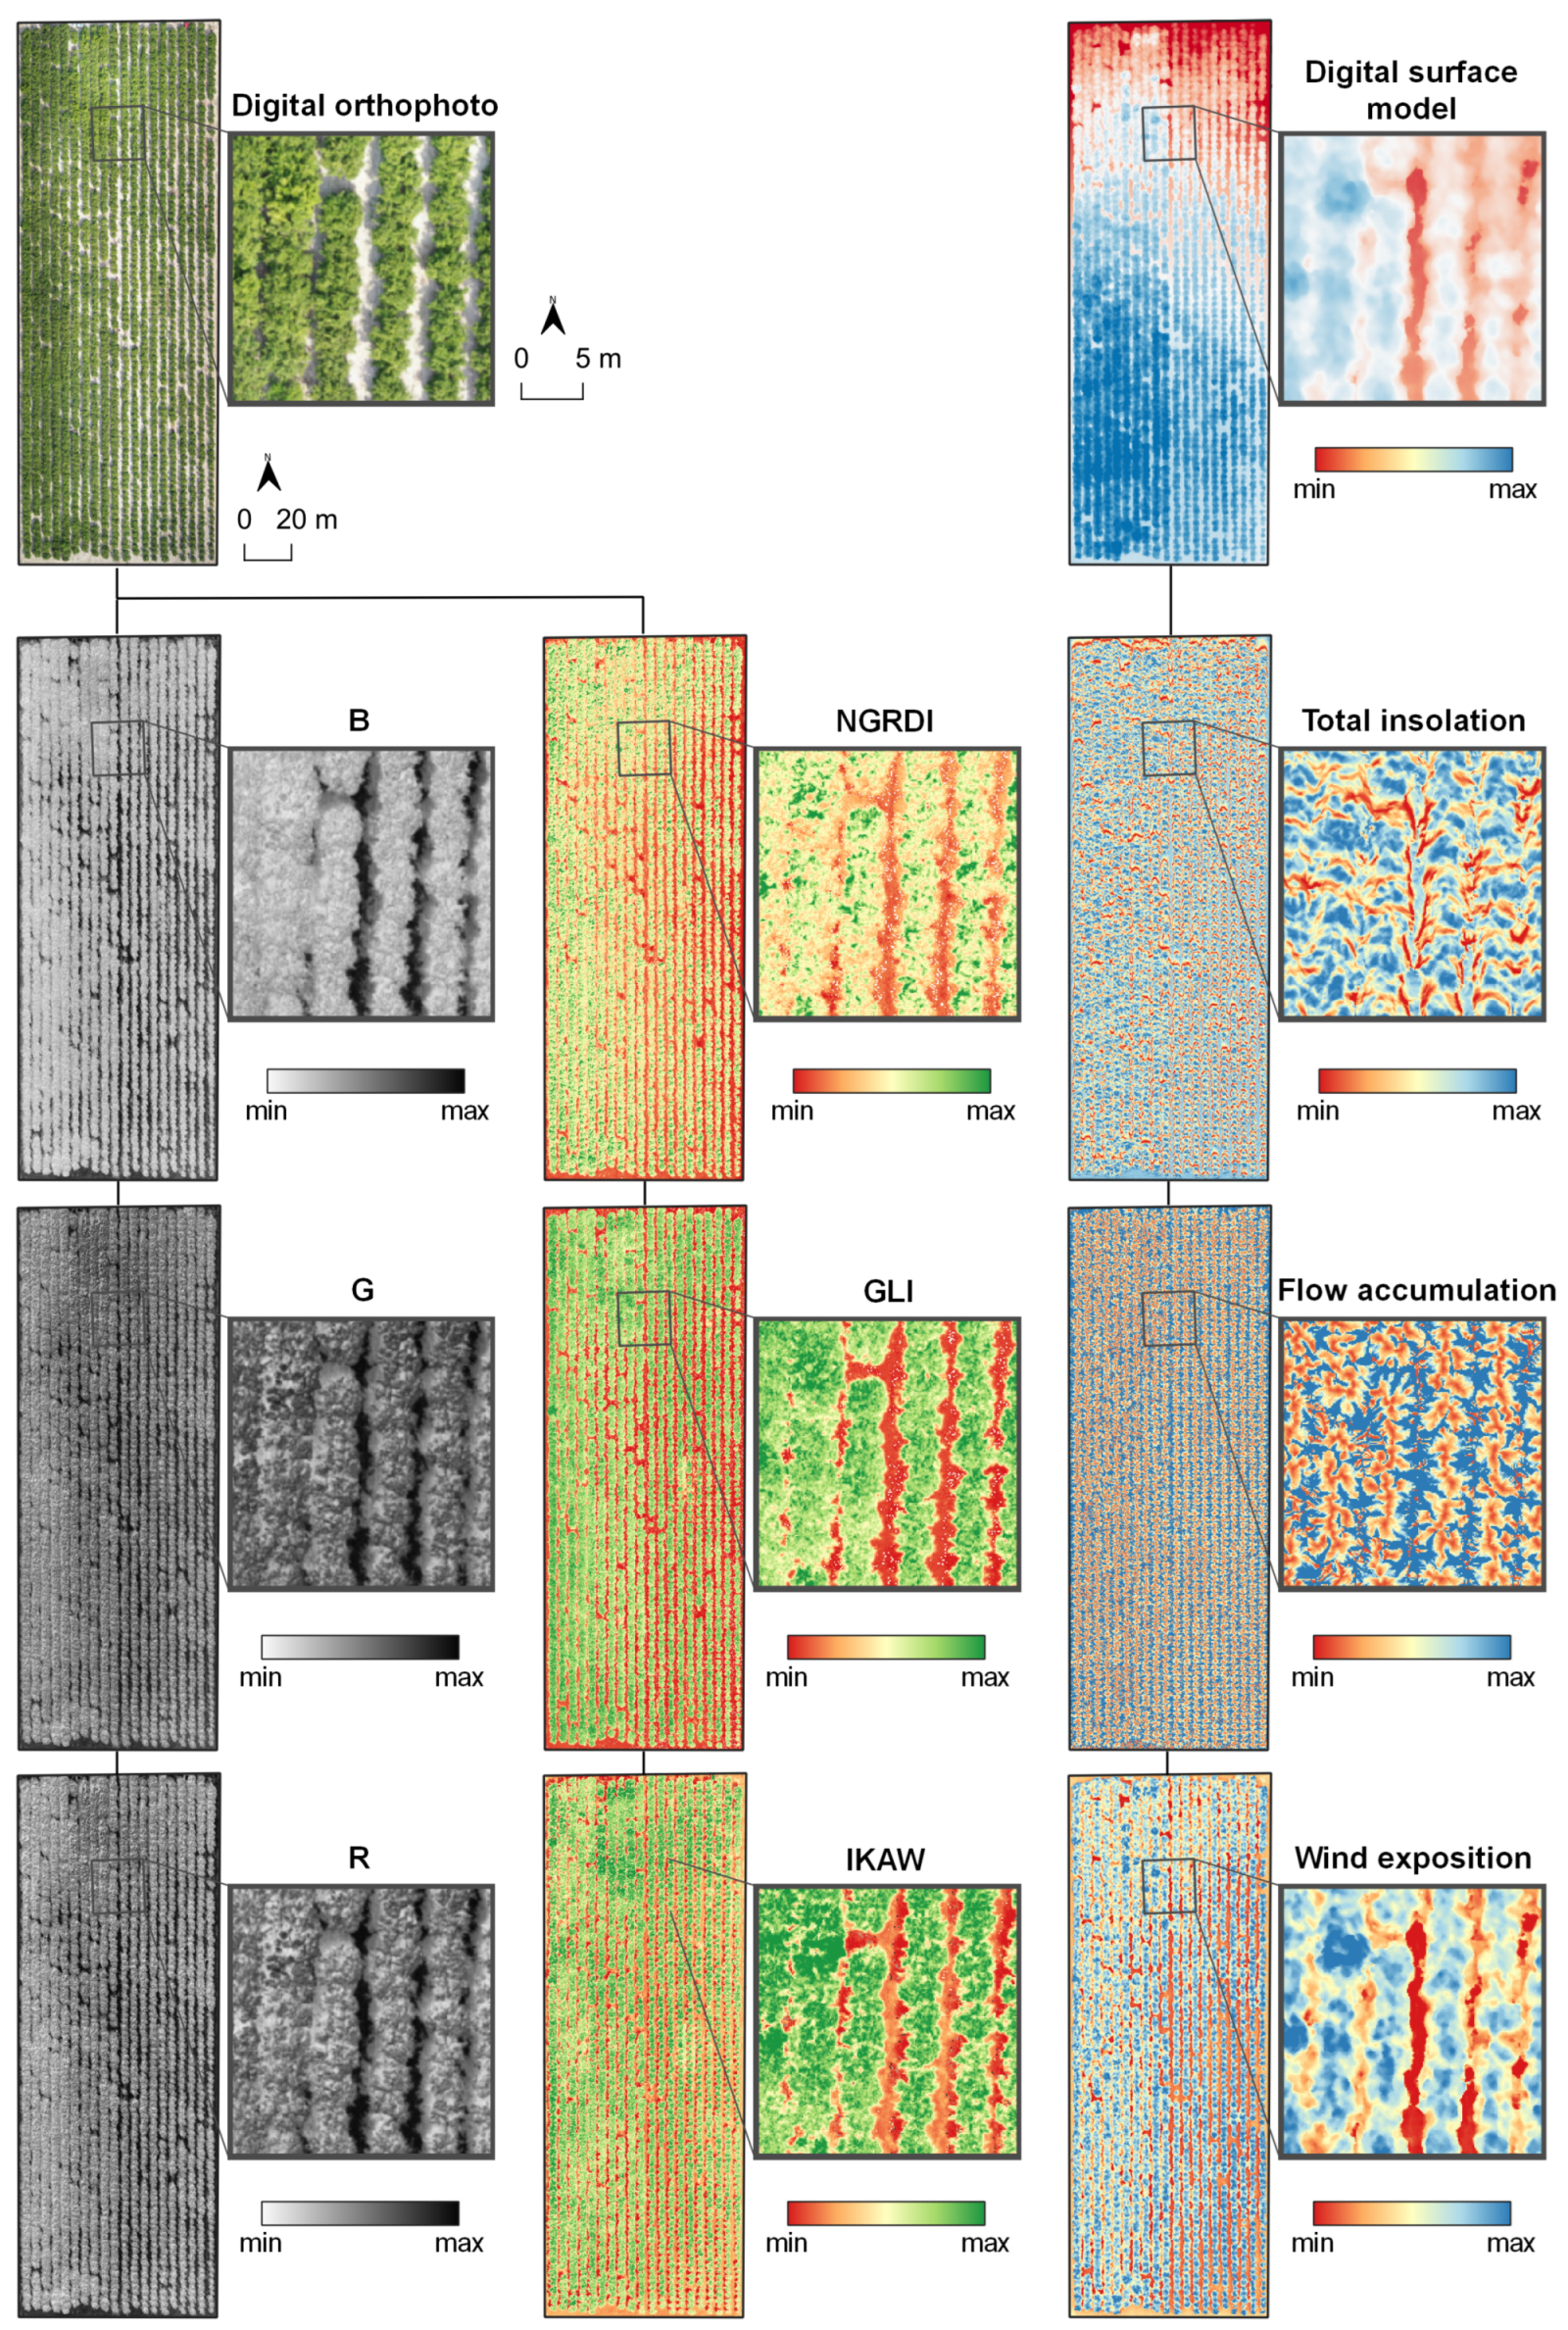
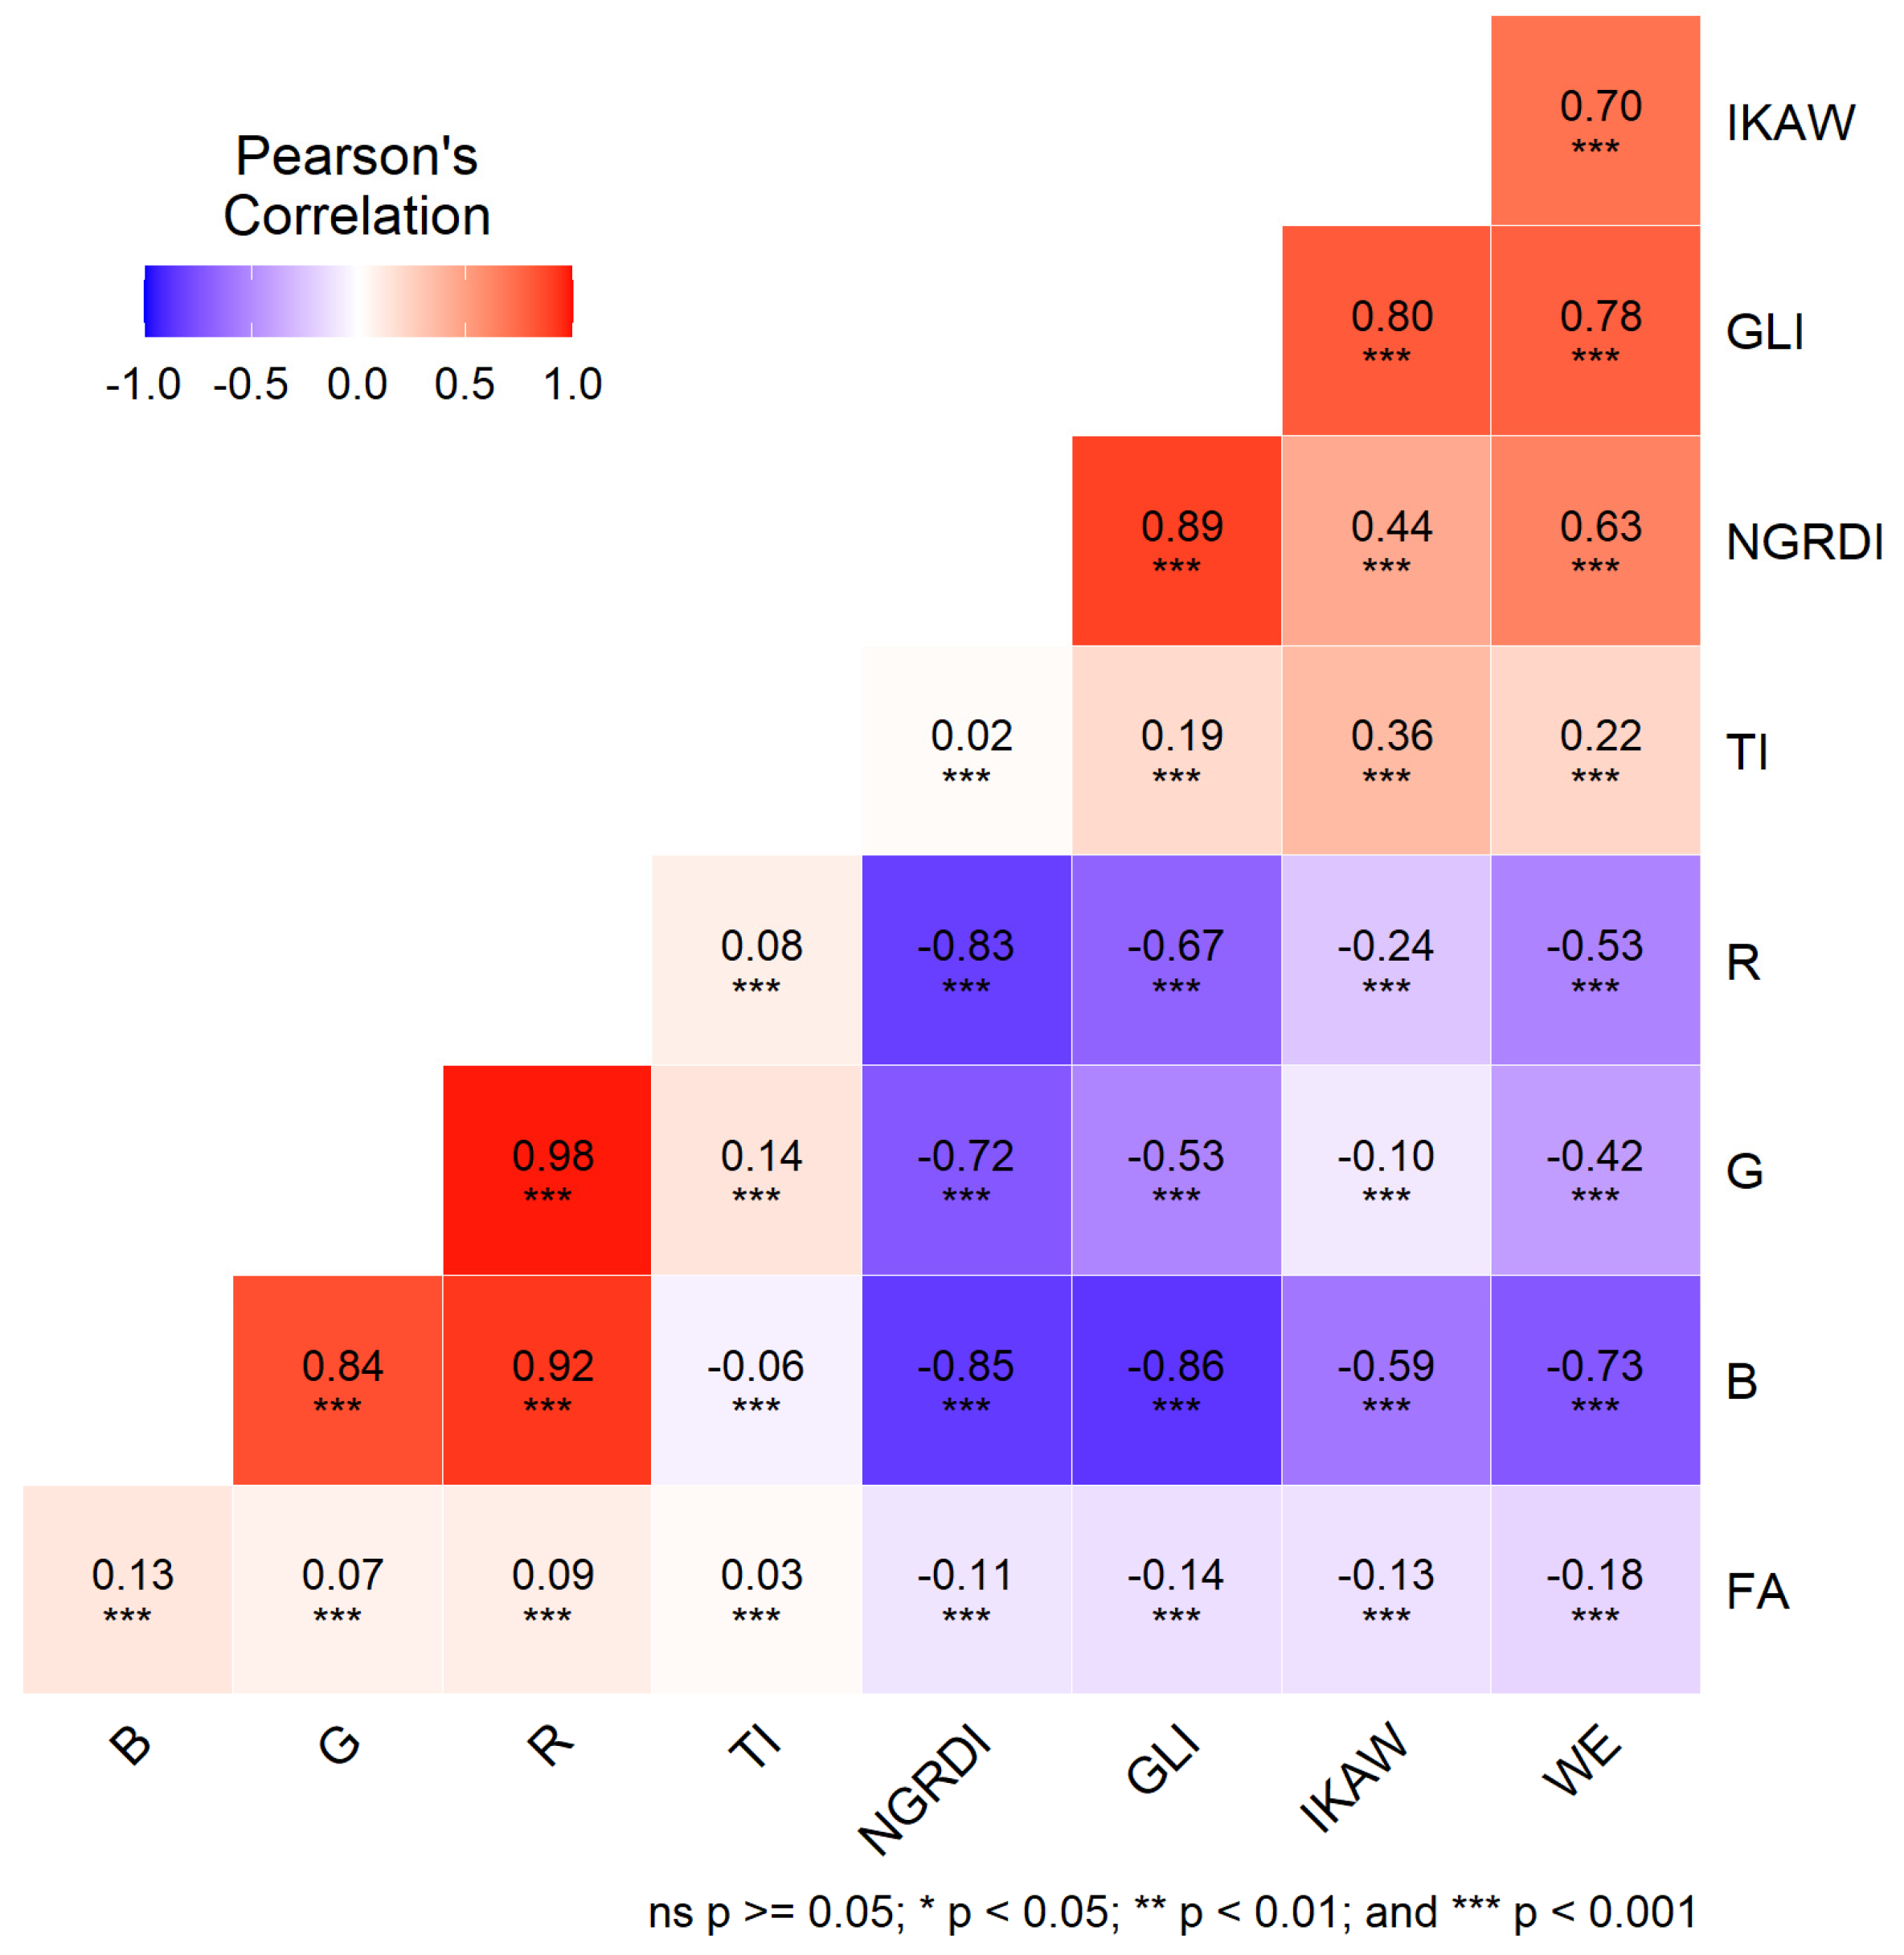
2.3. Input Data for Cropland Suitability Assessment
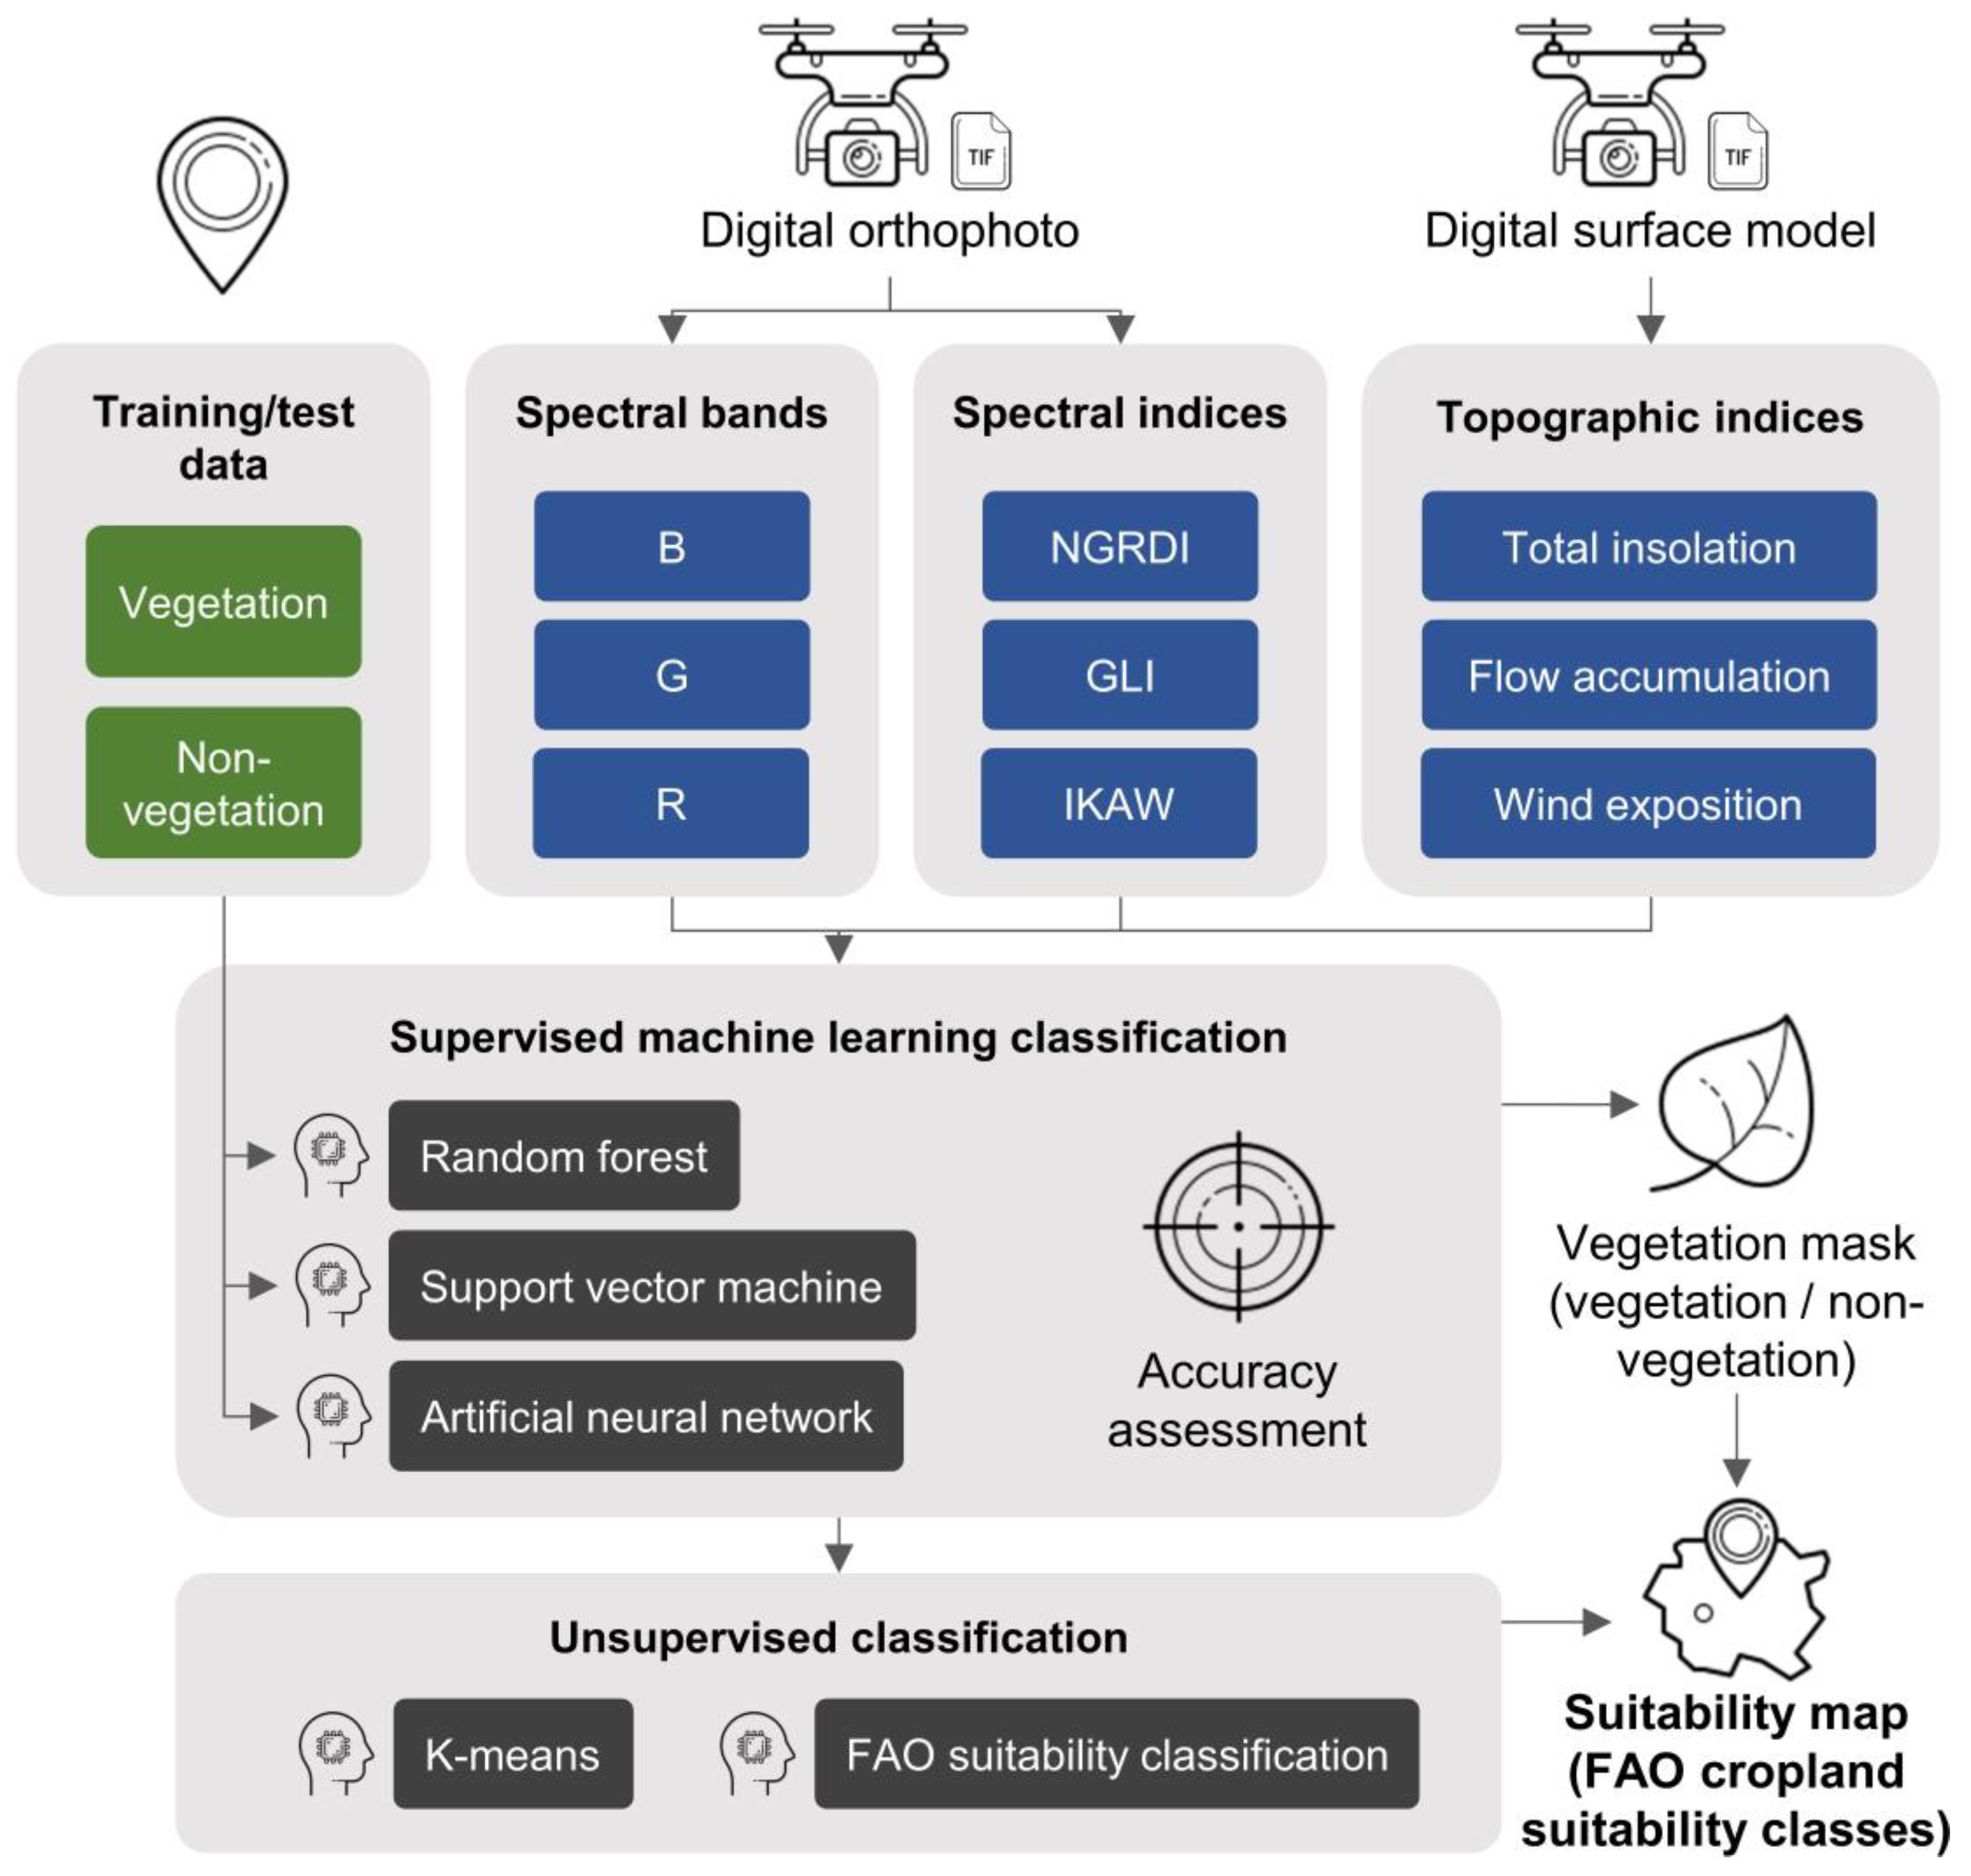
2.4. Cropland Suitability Assessment
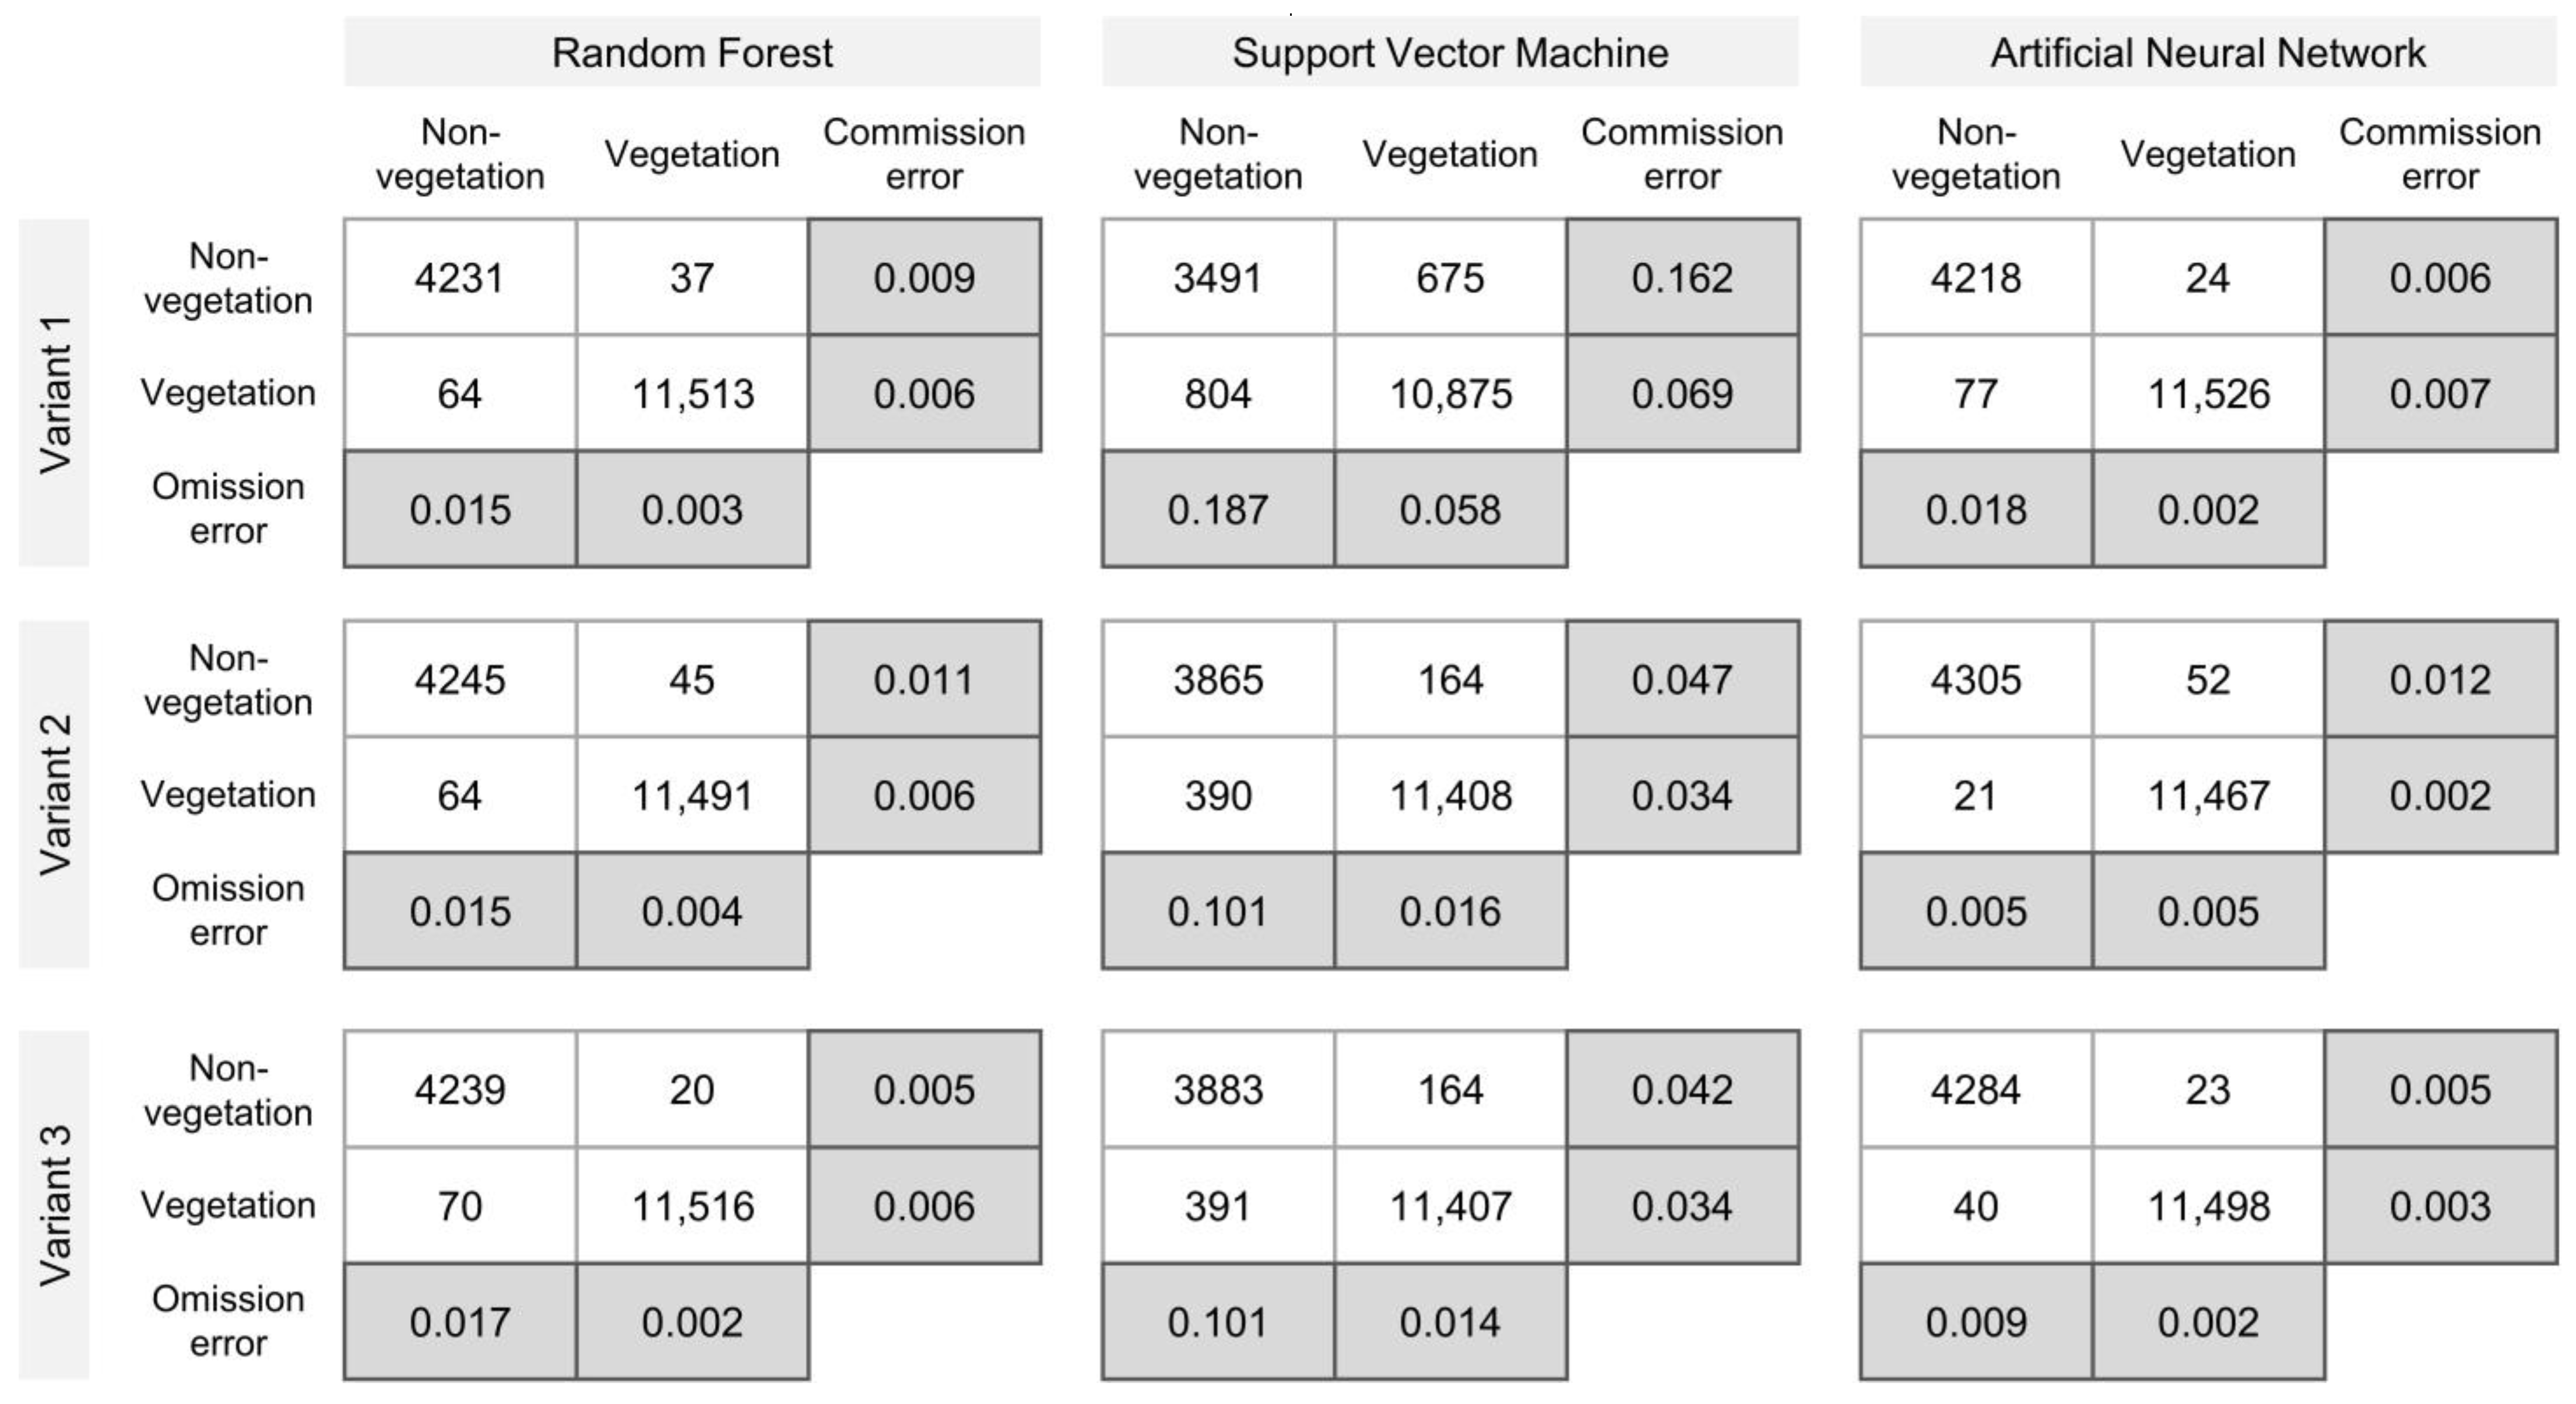
3. Results
4. Discussion
5. Conclusions
Author Contributions
Funding
Data Availability Statement
Acknowledgments
Conflicts of Interest
Appendix A

| Input Data Groups | Input Data | Mean Values per FAO Suitability Class | ||||
|---|---|---|---|---|---|---|
| S1 | S2 | S3 | N1 | N2 | ||
| Spectral bands | B | 72.267 | 75.612 | 78.451 | 75.953 | 90.690 |
| G | 139.740 | 123.815 | 131.218 | 116.605 | 116.053 | |
| R | 120.629 | 106.702 | 114.524 | 100.348 | 105.024 | |
| Spectral indices | NGRDI | 0.078 | 0.084 | 0.076 | 0.088 | 0.063 |
| GLI | 0.187 | 0.161 | 0.161 | 0.151 | 0.098 | |
| BI | 130.617 | 115.747 | 123.306 | 108.985 | 110.878 | |
| Topographic indices | Total insolation | 1858.409 | 1230.934 | 1555.098 | 874.781 | 452.934 |
| Flow accumulation | 3.234 | 4.904 | 7.209 | 4.071 | 5.759 | |
| Wind exposition | 1.066 | 1.030 | 1.034 | 1.023 | 0.989 | |
References
- Aldababseh, A.; Temimi, M.; Maghelal, P.; Branch, O.; Wulfmeyer, V. Multi-Criteria Evaluation of Irrigated Agriculture Suitability to Achieve Food Security in an Arid Environment. Sustainability 2018, 10, 803. [Google Scholar] [CrossRef] [Green Version]
- Kurowska, K.; Marks-Bielska, R.; Bielski, S.; Aleknavičius, A.; Kowalczyk, C. Geographic Information Systems and the Sustainable Development of Rural Areas. Land 2021, 10, 6. [Google Scholar] [CrossRef]
- Radočaj, D.; Jurišić, M.; Gašparović, M.; Plaščak, I.; Antonić, O. Cropland Suitability Assessment Using Satellite-Based Biophysical Vegetation Properties and Machine Learning. Agronomy 2021, 11, 1620. [Google Scholar] [CrossRef]
- Sasaki, K.; Hotes, S.; Ichinose, T.; Doko, T.; Wolters, V. Hotspots of Agricultural Ecosystem Services and Farmland Biodiversity Overlap with Areas at Risk of Land Abandonment in Japan. Land 2021, 10, 1031. [Google Scholar] [CrossRef]
- Kanjir, U.; Đurić, N.; Veljanovski, T. Sentinel-2 Based Temporal Detection of Agricultural Land Use Anomalies in Support of Common Agricultural Policy Monitoring. ISPRS Int. J. Geo-Inf. 2018, 7, 405. [Google Scholar] [CrossRef] [Green Version]
- Jurišić, M.; Plaščak, I.; Antonić, O.; Radočaj, D. Suitability Calculation for Red Spicy Pepper Cultivation (Capsicum annum L.) Using Hybrid GIS-Based Multicriteria Analysis. Agronomy 2020, 10, 3. [Google Scholar] [CrossRef] [Green Version]
- Binte Mostafiz, R.; Noguchi, R.; Ahamed, T. Agricultural Land Suitability Assessment Using Satellite Remote Sensing-Derived Soil-Vegetation Indices. Land 2021, 10, 223. [Google Scholar] [CrossRef]
- Radočaj, D.; Jurišić, M. GIS-Based Cropland Suitability Prediction Using Machine Learning: A Novel Approach to Sustainable Agricultural Production. Agronomy 2022, 12, 2210. [Google Scholar] [CrossRef]
- AbdelRahman, M.A.E.; Natarajan, A.; Hegde, R. Assessment of Land Suitability and Capability by Integrating Remote Sensing and GIS for Agriculture in Chamarajanagar District, Karnataka, India. Egypt. J. Remote Sens. Space Sci. 2016, 19, 125–141. [Google Scholar] [CrossRef] [Green Version]
- Abolina, E.; Luzadis, V.A. Abandoned Agricultural Land and Its Potential for Short Rotation Woody Crops in Latvia. Land Use Policy 2015, 49, 435–445. [Google Scholar] [CrossRef]
- Belward, A.S.; Skøien, J.O. Who Launched What, When and Why; Trends in Global Land-Cover Observation Capacity from Civilian Earth Observation Satellites. ISPRS J. Photogramm. Remote Sens. 2015, 103, 115–128. [Google Scholar] [CrossRef]
- Zheng, J.; Song, X.; Yang, G.; Du, X.; Mei, X.; Yang, X. Remote Sensing Monitoring of Rice and Wheat Canopy Nitrogen: A Review. Remote Sens. 2022, 14, 5712. [Google Scholar] [CrossRef]
- Radocaj, D.; Obhodas, J.; Jurisic, M.; Gasparovic, M. Global Open Data Remote Sensing Satellite Missions for Land Monitoring and Conservation: A Review. Land 2020, 9, 402. [Google Scholar] [CrossRef]
- Huang, C.; Chen, Y.; Zhang, S.; Wu, J. Detecting, Extracting, and Monitoring Surface Water From Space Using Optical Sensors: A Review. Rev. Geophys. 2018, 56, 333–360. [Google Scholar] [CrossRef]
- Pelletier, C.; Valero, S.; Inglada, J.; Champion, N.; Dedieu, G. Assessing the Robustness of Random Forests to Map Land Cover with High Resolution Satellite Image Time Series over Large Areas. Remote Sens. Environ. 2016, 187, 156–168. [Google Scholar] [CrossRef]
- Lopez, R.; Frohn, R. Remote Sensing for Landscape Ecology: New Metric Indicators, 2nd ed.; CRC Press: Boca Raton, FL, USA, 2017; ISBN 978-1-315-15271-4. [Google Scholar]
- Yao, H.; Qin, R.; Chen, X. Unmanned Aerial Vehicle for Remote Sensing Applications—A Review. Remote Sens. 2019, 11, 1443. [Google Scholar] [CrossRef] [Green Version]
- Pádua, L.; Vanko, J.; Hruška, J.; Adão, T.; Sousa, J.J.; Peres, E.; Morais, R. UAS, Sensors, and Data Processing in Agroforestry: A Review towards Practical Applications. Int. J. Remote Sens. 2017, 38, 2349–2391. [Google Scholar] [CrossRef]
- Ammoniaci, M.; Kartsiotis, S.-P.; Perria, R.; Storchi, P. State of the Art of Monitoring Technologies and Data Processing for Precision Viticulture. Agriculture 2021, 11, 201. [Google Scholar] [CrossRef]
- Shi, X.; Han, W.; Zhao, T.; Tang, J. Decision Support System for Variable Rate Irrigation Based on UAV Multispectral Remote Sensing. Sensors 2019, 19, 2880. [Google Scholar] [CrossRef] [Green Version]
- Reddy Maddikunta, P.K.; Hakak, S.; Alazab, M.; Bhattacharya, S.; Gadekallu, T.R.; Khan, W.Z.; Pham, Q.-V. Unmanned Aerial Vehicles in Smart Agriculture: Applications, Requirements, and Challenges. IEEE Sens. J. 2021, 21, 17608–17619. [Google Scholar] [CrossRef]
- Chen, S.; Lan, Y.; Zhou, Z.; Ouyang, F.; Wang, G.; Huang, X.; Deng, X.; Cheng, S. Effect of Droplet Size Parameters on Droplet Deposition and Drift of Aerial Spraying by Using Plant Protection UAV. Agronomy 2020, 10, 195. [Google Scholar] [CrossRef] [Green Version]
- Candiago, S.; Remondino, F.; De Giglio, M.; Dubbini, M.; Gattelli, M. Evaluating Multispectral Images and Vegetation Indices for Precision Farming Applications from UAV Images. Remote Sens. 2015, 7, 4026–4047. [Google Scholar] [CrossRef] [Green Version]
- Barrero, O.; Perdomo, S.A. RGB and Multispectral UAV Image Fusion for Gramineae Weed Detection in Rice Fields. Precis. Agric. 2018, 19, 809–822. [Google Scholar] [CrossRef]
- Blancon, J.; Dutartre, D.; Tixier, M.-H.; Weiss, M.; Comar, A.; Praud, S.; Baret, F. A High-Throughput Model-Assisted Method for Phenotyping Maize Green Leaf Area Index Dynamics Using Unmanned Aerial Vehicle Imagery. Front. Plant Sci. 2019, 10, 685. [Google Scholar] [CrossRef] [PubMed]
- Maimaitijiang, M.; Sagan, V.; Sidike, P.; Maimaitiyiming, M.; Hartling, S.; Peterson, K.T.; Maw, M.J.W.; Shakoor, N.; Mockler, T.; Fritschi, F.B. Vegetation Index Weighted Canopy Volume Model (CVMVI) for Soybean Biomass Estimation from Unmanned Aerial System-Based RGB Imagery. ISPRS J. Photogramm. Remote Sens. 2019, 151, 27–41. [Google Scholar] [CrossRef]
- Schirrmann, M.; Giebel, A.; Gleiniger, F.; Pflanz, M.; Lentschke, J.; Dammer, K.-H. Monitoring Agronomic Parameters of Winter Wheat Crops with Low-Cost UAV Imagery. Remote Sens. 2016, 8, 706. [Google Scholar] [CrossRef] [Green Version]
- Gašparović, M.; Zrinjski, M.; Barković, Đ.; Radočaj, D. An Automatic Method for Weed Mapping in Oat Fields Based on UAV Imagery. Comput. Electron. Agric. 2020, 173, 105385. [Google Scholar] [CrossRef]
- Cano, M.d.J.A.; Marulanda, E.E.C.; Henao-Céspedes, V.; Cardona-Morales, O.; Garcés-Gómez, Y.A. Quantification of Flowering in Coffee Growing with Low-Cost RGB Sensor UAV-Mounted. Sci. Hortic. 2023, 309, 111649. [Google Scholar] [CrossRef]
- Akpoti, K.; Kabo-bah, A.T.; Dossou-Yovo, E.R.; Groen, T.A.; Zwart, S.J. Mapping Suitability for Rice Production in Inland Valley Landscapes in Benin and Togo Using Environmental Niche Modeling. Sci. Total Environ. 2020, 709, 136165. [Google Scholar] [CrossRef]
- Iliquín Trigoso, D.; Salas López, R.; Rojas Briceño, N.B.; Silva López, J.O.; Gómez Fernández, D.; Oliva, M.; Quiñones Huatangari, L.; Terrones Murga, R.E.; Barboza Castillo, E.; Barrena Gurbillón, M.Á. Land Suitability Analysis for Potato Crop in the Jucusbamba and Tincas Microwatersheds (Amazonas, NW Peru): AHP and RS–GIS Approach. Agronomy 2020, 10, 1898. [Google Scholar] [CrossRef]
- Fareed, N.; Rehman, K. Integration of Remote Sensing and GIS to Extract Plantation Rows from A Drone-Based Image Point Cloud Digital Surface Model. ISPRS Int. J. Geo-Inf. 2020, 9, 151. [Google Scholar] [CrossRef] [Green Version]
- Croatian Meteorological and Hydrological Service, Climate Atlas of Croatia 1961–1990, 1971–2000. Available online: https://klima.hr/razno/publikacije/klimatski_atlas_hrvatske.pdf (accessed on 18 January 2023).
- Republic of Croatia, State Geodetic Administration CROPOS Users’ Manual 2011. Available online: https://www.cropos.hr/files/docs/cropos_users-manual.pdf (accessed on 22 November 2021).
- Vellemu, E.C.; Katonda, V.; Yapuwa, H.; Msuku, G.; Nkhoma, S.; Makwakwa, C.; Safuya, K.; Maluwa, A. Using the Mavic 2 Pro Drone for Basic Water Quality Assessment. Sci. Afr. 2021, 14, e00979. [Google Scholar] [CrossRef]
- Jiang, J.; Cai, W.; Zheng, H.; Cheng, T.; Tian, Y.; Zhu, Y.; Ehsani, R.; Hu, Y.; Niu, Q.; Gui, L.; et al. Using Digital Cameras on an Unmanned Aerial Vehicle to Derive Optimum Color Vegetation Indices for Leaf Nitrogen Concentration Monitoring in Winter Wheat. Remote Sens. 2019, 11, 2667. [Google Scholar] [CrossRef] [Green Version]
- Mao, P.; Qin, L.; Hao, M.; Zhao, W.; Luo, J.; Qiu, X.; Xu, L.; Xiong, Y.; Ran, Y.; Yan, C.; et al. An Improved Approach to Estimate Above-Ground Volume and Biomass of Desert Shrub Communities Based on UAV RGB Images. Ecol. Indic. 2021, 125, 107494. [Google Scholar] [CrossRef]
- Abrougui, K.; Boughattas, N.E.H.; Belhaj, M.; Buchaillot, M.L.; Segarra, J.; Dorbolo, S.; Amami, R.; Chehaibi, S.; Tarchoun, N.; Kefauver, S.C. Assessing Phytosanitary Application Efficiency of a Boom Sprayer Machine Using RGB Sensor in Grassy Fields. Sustainability 2022, 14, 3666. [Google Scholar] [CrossRef]
- Liu, X.; Wang, L. Feasibility of Using Consumer-Grade Unmanned Aerial Vehicles to Estimate Leaf Area Index in Mangrove Forest. Remote Sens. Lett. 2018, 9, 1040–1049. [Google Scholar] [CrossRef]
- Tucker, C.J. Red and Photographic Infrared Linear Combinations for Monitoring Vegetation. Remote Sens. Environ. 1979, 8, 127–150. [Google Scholar] [CrossRef] [Green Version]
- Louhaichi, M.; Borman, M.M.; Johnson, D.E. Spatially Located Platform and Aerial Photography for Documentation of Grazing Impacts on Wheat. Geocarto Int. 2001, 16, 65–70. [Google Scholar] [CrossRef]
- Kawashima, S.; Nakatani, M. An Algorithm for Estimating Chlorophyll Content in Leaves Using a Video Camera. Ann. Bot. 1998, 81, 49–54. [Google Scholar] [CrossRef] [Green Version]
- Böhner, J.; Antonić, O. Chapter 8 Land-Surface Parameters Specific to Topo-Climatology. In Developments in Soil Science; Hengl, T., Reuter, H.I., Eds.; Geomorphometry; Elsevier: Amsterdam, The Netherlands, 2009; Volume 33, pp. 195–226. [Google Scholar]
- Conrad, O.; Bechtel, B.; Bock, M.; Dietrich, H.; Fischer, E.; Gerlitz, L.; Wehberg, J.; Wichmann, V.; Boehner, J. System for Automated Geoscientific Analyses (SAGA) v. 2.1.4. Geosci. Model Dev. 2015, 8, 1991–2007. [Google Scholar] [CrossRef] [Green Version]
- Freeman, T.G. Calculating Catchment Area with Divergent Flow Based on a Regular Grid. Comput. Geosci. 1991, 17, 413–422. [Google Scholar] [CrossRef]
- Bagaram, M.B.; Giuliarelli, D.; Chirici, G.; Giannetti, F.; Barbati, A. UAV Remote Sensing for Biodiversity Monitoring: Are Forest Canopy Gaps Good Covariates? Remote Sens. 2018, 10, 1397. [Google Scholar] [CrossRef]
- FAO Chapter 3: Land Suitability Classifications 1976. Available online: https://www.fao.org/3/x5310e/x5310e04.htm#chapter%203:%20land%20suitability%20classifications (accessed on 13 July 2022).
- Radočaj, D.; Jurišić, M.; Gašparović, M. The Role of Remote Sensing Data and Methods in a Modern Approach to Fertilization in Precision Agriculture. Remote Sens. 2022, 14, 778. [Google Scholar] [CrossRef]
- Rodriguez-Galiano, V.F.; Chica-Rivas, M. Evaluation of Different Machine Learning Methods for Land Cover Mapping of a Mediterranean Area Using Multi-Seasonal Landsat Images and Digital Terrain Models. Int. J. Digit. Earth 2014, 7, 492–509. [Google Scholar] [CrossRef]
- Congalton, R.G.; Green, K. Assessing the Accuracy of Remotely Sensed Data: Principles and Practices, 3rd ed.; CRC Press: Boca Raton, FL, USA, 2019; ISBN 978-0-429-05272-9. [Google Scholar]
- FAO Chapter 1: The Nature and Principles of Land Evaluation 1976. Available online: https://www.fao.org/3/x5310e/x5310e02.htm#chapter%201:%20the%20nature%20and%20principles%20of%20land%20evaluation (accessed on 13 July 2022).
- Said Mohamed, E.; Belal, A.A.; Kotb Abd-Elmabod, S.; El-Shirbeny, M.A.; Gad, A.; Zahran, M.B. Smart Farming for Improving Agricultural Management. Egypt. J. Remote Sens. Space Sci. 2021, 24, 971–981. [Google Scholar] [CrossRef]
- Awais, M.; Li, W.; Cheema, M.J.M.; Zaman, Q.U.; Shaheen, A.; Aslam, B.; Zhu, W.; Ajmal, M.; Faheem, M.; Hussain, S.; et al. UAV-Based Remote Sensing in Plant Stress Imagine Using High-Resolution Thermal Sensor for Digital Agriculture Practices: A Meta-Review. Int. J. Environ. Sci. Technol. 2022, 20, 1135–1152. [Google Scholar] [CrossRef]
- Giovos, R.; Tassopoulos, D.; Kalivas, D.; Lougkos, N.; Priovolou, A. Remote Sensing Vegetation Indices in Viticulture: A Critical Review. Agriculture 2021, 11, 457. [Google Scholar] [CrossRef]
- Goddijn-Murphy, L.; O’Hanlon, N.J.; James, N.A.; Masden, E.A.; Bond, A.L. Earth Observation Data for Seabirds and Their Habitats: An Introduction. Remote Sens. Appl. Soc. Environ. 2021, 24, 100619. [Google Scholar] [CrossRef]
- Ji, S.; Gu, C.; Xi, X.; Zhang, Z.; Hong, Q.; Huo, Z.; Zhao, H.; Zhang, R.; Li, B.; Tan, C. Quantitative Monitoring of Leaf Area Index in Rice Based on Hyperspectral Feature Bands and Ridge Regression Algorithm. Remote Sens. 2022, 14, 2777. [Google Scholar] [CrossRef]
- Banerjee, A.; Roychoudhury, A. Role of Phenomics in Screening Abiotic Stress Tolerance in Plants; Apple Academic Press: Palm Bay, FL, USA, 2022; pp. 47–59. ISBN 978-1-00-318057-9. [Google Scholar]
- Hunt, E.R.; Cavigelli, M.; Daughtry, C.S.T.; Mcmurtrey, J.E.; Walthall, C.L. Evaluation of Digital Photography from Model Aircraft for Remote Sensing of Crop Biomass and Nitrogen Status. Precis. Agric. 2005, 6, 359–378. [Google Scholar] [CrossRef]
- Chaves, M.E.D.; Picoli, M.C.A.; Sanches, I.D. Recent Applications of Landsat 8/OLI and Sentinel-2/MSI for Land Use and Land Cover Mapping: A Systematic Review. Remote Sens. 2020, 12, 3062. [Google Scholar] [CrossRef]
- García-Martínez, H.; Flores-Magdaleno, H.; Ascencio-Hernández, R.; Khalil-Gardezi, A.; Tijerina-Chávez, L.; Mancilla-Villa, O.R.; Vázquez-Peña, M.A. Corn Grain Yield Estimation from Vegetation Indices, Canopy Cover, Plant Density, and a Neural Network Using Multispectral and RGB Images Acquired with Unmanned Aerial Vehicles. Agriculture 2020, 10, 277. [Google Scholar] [CrossRef]
- Hunt, E.R.; Doraiswamy, P.C.; McMurtrey, J.E.; Daughtry, C.S.T.; Perry, E.M.; Akhmedov, B. A Visible Band Index for Remote Sensing Leaf Chlorophyll Content at the Canopy Scale. Int. J. Appl. Earth Obs. Geoinf. 2013, 21, 103–112. [Google Scholar] [CrossRef] [Green Version]
- Mitchell, S.; Weersink, A.; Erickson, B. Adoption of Precision Agriculture Technologies in Ontario Crop Production. Can. J. Plant Sci. 2018, 98, 1384–1388. [Google Scholar] [CrossRef]
- Jurišić, M.; Radočaj, D.; Plaščak, I.; Galić Subašić, D.; Petrović, D. The evaluation of the RGB and multispectral camera on the unmanned aerial vehicle (UAV) for the machine learning classification of Maize. Poljoprivreda 2022, 28, 74–80. [Google Scholar] [CrossRef]
- Ye, H.; Huang, W.; Huang, S.; Cui, B.; Dong, Y.; Guo, A.; Ren, Y.; Jin, Y. Identification of Banana Fusarium Wilt Using Supervised Classification Algorithms with UAV-Based Multi-Spectral Imagery. Int. J. Agric. Biol. Eng. 2020, 13, 136–142. [Google Scholar] [CrossRef]
- Zha, H.; Miao, Y.; Wang, T.; Li, Y.; Zhang, J.; Sun, W.; Feng, Z.; Kusnierek, K. Improving Unmanned Aerial Vehicle Remote Sensing-Based Rice Nitrogen Nutrition Index Prediction with Machine Learning. Remote Sens. 2020, 12, 215. [Google Scholar] [CrossRef] [Green Version]
- Syazwani, R.W.N.; Asraf, M.H.; Amin, M.A.M.S.; Dalil, K.A.N. Automated Image Identification, Detection and Fruit Counting of Top-View Pineapple Crown Using Machine Learning. Alex. Eng. J. 2022, 61, 1265–1276. [Google Scholar] [CrossRef]
- Khan, N.; Kamaruddin, M.A.; Sheikh, U.U.; Yusup, Y.; Bakht, M.P. Oil Palm and Machine Learning: Reviewing One Decade of Ideas, Innovations, Applications, and Gaps. Agriculture 2021, 11, 832. [Google Scholar] [CrossRef]
- Padua, L.; Adao, T.; Hruska, J.; Guimaraes, N.; Marques, P.; Peres, E.; Sousa, J.J. Vineyard Classification Using Machine Learning Techniques Applied to Rgb-Uav Imagery. In Proceedings of the IGARSS 2020 IEEE International Geoscience and Remote Sensing Symposium, Waikoloa, HI, USA, 26 September–2 October 2020; IEEE: New York, NY, USA, 2020; pp. 6309–6312. [Google Scholar]
- Republic of Croatia, Ministry of Agriculture. Regulations on Methodology for Monitoring the Condition of Agricultural Land. Available online: https://narodne-novine.nn.hr/clanci/sluzbeni/full/2019_05_47_918.html (accessed on 19 January 2023).
- Gluhić, D. Supply level of nutrients in tangerine growing soils in the Neretva valley. Glas. Zašt. Bilja 2006, 29, 39–47. [Google Scholar]
- Milošević, T.; Milošević, N.; Mladenović, J. The Influence of Organic, Organo-Mineral and Mineral Fertilizers on Tree Growth, Yielding, Fruit Quality and Leaf Nutrient Composition of Apple Cv. ‘Golden Delicious Reinders. Sci. Hortic. 2022, 297, 110978. [Google Scholar] [CrossRef]
- Green, S.; Cawkwell, F.; Dwyer, E. A Time-Domain NDVI Anomaly Service for Intensively Managed Grassland Agriculture. Remote Sens. Appl. Soc. Environ. 2018, 11, 282–290. [Google Scholar] [CrossRef]
- Radočaj, D.; Jurišić, M.; Gašparović, M.; Plaščak, I. Optimal Soybean (Glycine Max L.) Land Suitability Using GIS-Based Multicriteria Analysis and Sentinel-2 Multitemporal Images. Remote Sens. 2020, 12, 1463. [Google Scholar] [CrossRef]
- Claverie, M.; Demarez, V.; Duchemin, B.; Hagolle, O.; Ducrot, D.; Marais-Sicre, C.; Dejoux, J.-F.; Huc, M.; Keravec, P.; Béziat, P.; et al. Maize and Sunflower Biomass Estimation in Southwest France Using High Spatial and Temporal Resolution Remote Sensing Data. Remote Sens. Environ. 2012, 124, 844–857. [Google Scholar] [CrossRef]
- Guan, K.; Wu, J.; Kimball, J.S.; Anderson, M.C.; Frolking, S.; Li, B.; Hain, C.R.; Lobell, D.B. The Shared and Unique Values of Optical, Fluorescence, Thermal and Microwave Satellite Data for Estimating Large-Scale Crop Yields. Remote Sens. Environ. 2017, 199, 333–349. [Google Scholar] [CrossRef] [Green Version]
- Zarco-Tejada, P.J.; González-Dugo, M.V.; Fereres, E. Seasonal Stability of Chlorophyll Fluorescence Quantified from Airborne Hyperspectral Imagery as an Indicator of Net Photosynthesis in the Context of Precision Agriculture. Remote Sens. Environ. 2016, 179, 89–103. [Google Scholar] [CrossRef]
- Wang, M.; Wander, M.; Mueller, S.; Martin, N.; Dunn, J.B. Evaluation of Survey and Remote Sensing Data Products Used to Estimate Land Use Change in the United States: Evolving Issues and Emerging Opportunities. Environ. Sci. Policy 2022, 129, 68–78. [Google Scholar] [CrossRef]


| Spectral Index | Abbreviation | Equation | References |
|---|---|---|---|
| Normalized Green Red Difference Index | NGRDI | [40] | |
| Green Leaf Index | GLI | [41] | |
| Kawashima index | IKAW | [42] |
| Classification Algorithm | Input Data | Overall Accuracy | Kappa |
|---|---|---|---|
| RF | Variant 1 | 0.994 | 0.984 |
| Variant 2 | 0.993 | 0.981 | |
| Variant 3 | 0.994 | 0.985 | |
| SVM | Variant 1 | 0.907 | 0.762 |
| Variant 2 | 0.964 | 0.903 | |
| Variant 3 | 0.965 | 0.911 | |
| ANN | Variant 1 | 0.993 | 0.983 |
| Variant 2 | 0.995 | 0.988 | |
| Variant 3 | 0.996 | 0.990 |
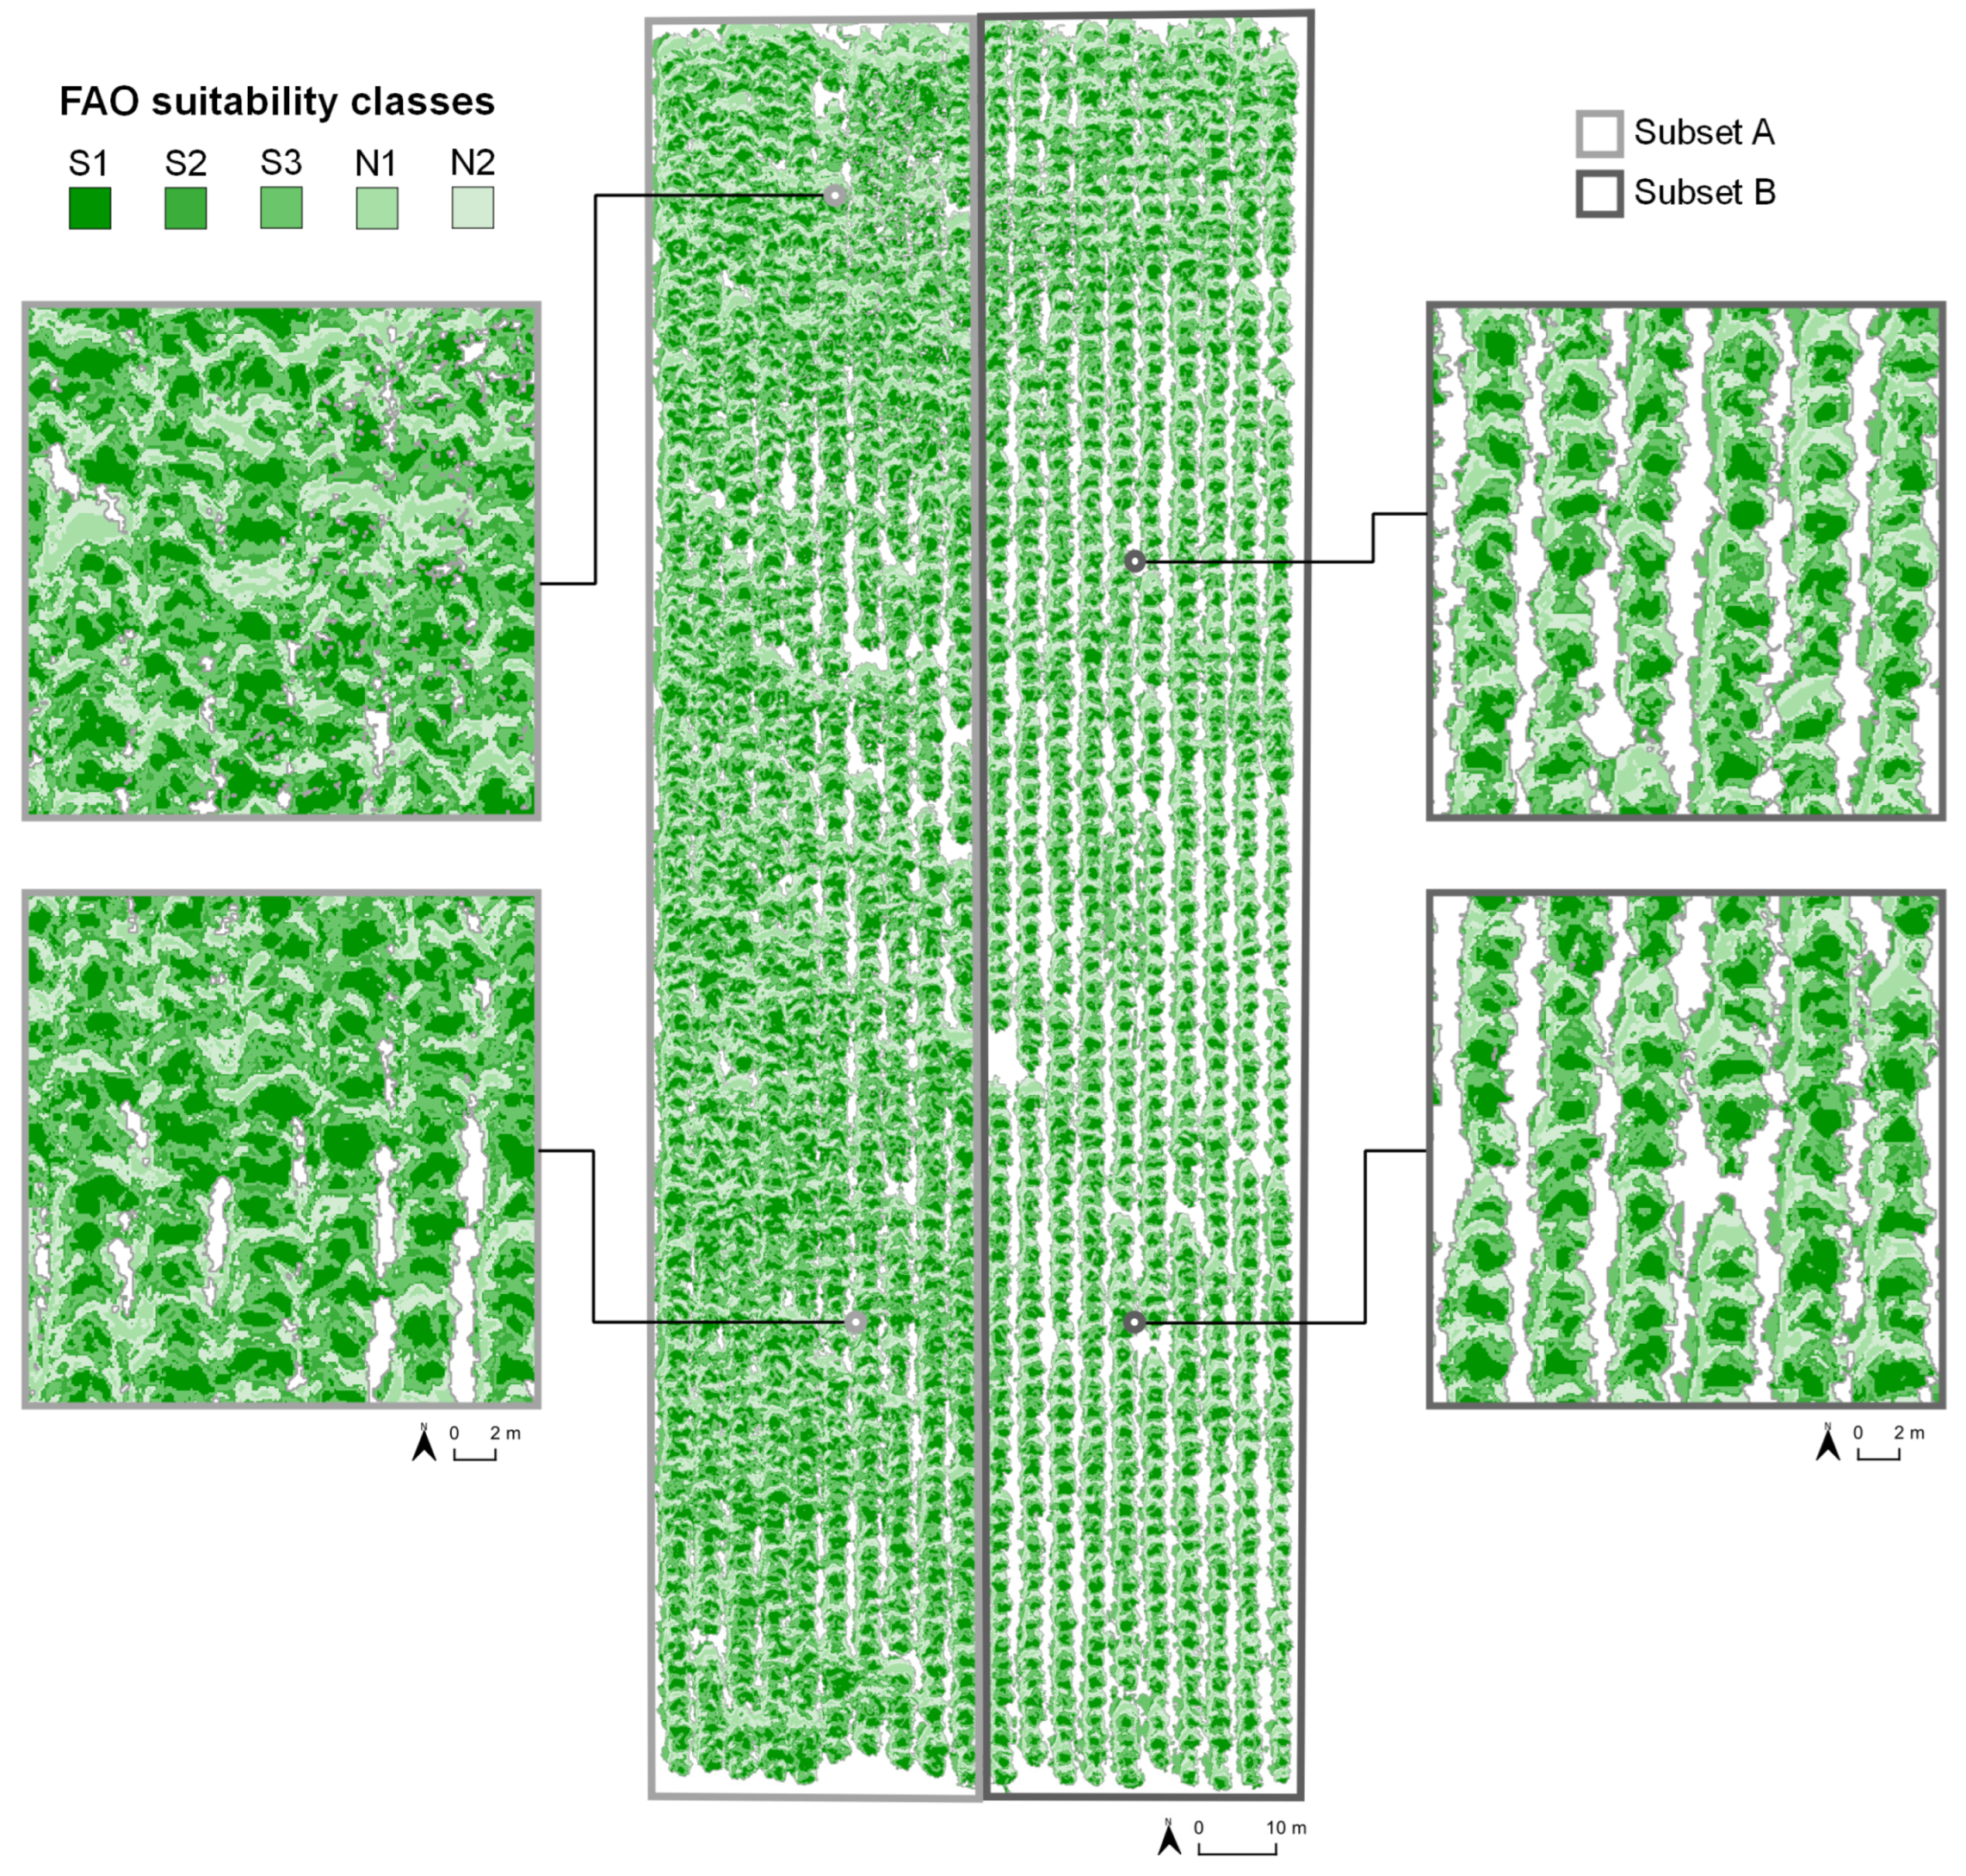
| Study Area Subset | Area per FAO Suitability Class | ||||
|---|---|---|---|---|---|
| S1 | S2 | S3 | N1 | N2 | |
| Subset A | 2493.7 m2 (28.5%) | 2060.8 m2 (23.1%) | 1020.8 m2 (11.5%) | 2698.5 m2 (30.7%) | 536.4 m2 (6.2%) |
| Subset B | 1787.0 m2 (24.3%) | 1621.3 m2 (22.0%) | 922.5 m2 (12.7%) | 2383.3 m2 (32.6%) | 645.7 m2 (8.4%) |
Disclaimer/Publisher’s Note: The statements, opinions and data contained in all publications are solely those of the individual author(s) and contributor(s) and not of MDPI and/or the editor(s). MDPI and/or the editor(s) disclaim responsibility for any injury to people or property resulting from any ideas, methods, instructions or products referred to in the content. |
© 2023 by the authors. Licensee MDPI, Basel, Switzerland. This article is an open access article distributed under the terms and conditions of the Creative Commons Attribution (CC BY) license (https://creativecommons.org/licenses/by/4.0/).
Share and Cite
Radočaj, D.; Šiljeg, A.; Plaščak, I.; Marić, I.; Jurišić, M. A Micro-Scale Approach for Cropland Suitability Assessment of Permanent Crops Using Machine Learning and a Low-Cost UAV. Agronomy 2023, 13, 362. https://doi.org/10.3390/agronomy13020362
Radočaj D, Šiljeg A, Plaščak I, Marić I, Jurišić M. A Micro-Scale Approach for Cropland Suitability Assessment of Permanent Crops Using Machine Learning and a Low-Cost UAV. Agronomy. 2023; 13(2):362. https://doi.org/10.3390/agronomy13020362
Chicago/Turabian StyleRadočaj, Dorijan, Ante Šiljeg, Ivan Plaščak, Ivan Marić, and Mladen Jurišić. 2023. "A Micro-Scale Approach for Cropland Suitability Assessment of Permanent Crops Using Machine Learning and a Low-Cost UAV" Agronomy 13, no. 2: 362. https://doi.org/10.3390/agronomy13020362