Article

Rapeseed Variety Recognition Based on Hyperspectral Feature Fusion

1
Hunan Provincial Key Laboratory of Dong Medicine, Hunan University of Medicine, Huaihua 418000, China
2
Key Laboratory of Intelligent Computing and Information Processing of Ministry of Education and Hunan Key Laboratory for Computation and Simulation in Science and Engineering, Xiangtan University, Xiangtan 411105, China
3
Southern Regional Collaborative Innovation Center for Grain and Oil Crops, Hunan Agricultural University, Changsha 410128, China
*
Author to whom correspondence should be addressed.
Agronomy 2022, 12(10), 2350; https://doi.org/10.3390/agronomy12102350
Submission received: 12 August 2022 / Revised: 25 September 2022 / Accepted: 26 September 2022 / Published: 29 September 2022

Abstract

:
As an important oil crop, rapeseed contributes to the food security of the world. In recent years, agronomists have cultivated many new varieties, which has increased human nutritional needs. Variety recognition is of great importance for yield improvement and quality breeding. In view of the low efficiency and damage of traditional methods, in this paper, we develop a noninvasive model for the recognition of rapeseed varieties based on hyperspectral feature fusion. Three types of hyperspectral image features, namely, the multifractal feature, color characteristics, and trilateral parameters, are fused together to identify 11 rapeseed species. An optimal feature is selected using a simple rule, and then the three kinds of features are fused. The support vector machine kernel method is employed as a classifier. The average recognition rate reaches 96.35% and 93.71% for distinguishing two species and 11 species, respectively. The abundance test model demonstrates that our model possesses robustness. The high recognition rate is almost independent of the number of modeling samples and classifiers. This result can provide some practical experience and method guidance for the rapid recognition of rapeseed varieties.

1. Introduction

It is generally known that crop’s seeds are important inputs in the process of agricultural production. The seeds’ purity is a key indicator to determine the crop yield and agricultural product’s quality. The recognition of seeds is a meaningful task to identify their purity and further protect crop yield and quality. At present, in the fields of crop seed classification, lots of interesting research is being conducted based on visible/near-infrared (NIR) spectroscopy (700~2500 nm) [1,2,3,4]. However, scholars have pointed out that long-wavelength near-infrared (LW-NIR, 1100~2500 nm) spectroscopy is vulnerable to interference from external factors such as moisture, which generates noise in the spectrum and thus hinders model performance [5,6,7,8,9,10]. Therefore, they suggested using bands of spectroscopy lower than 1000 nm to identify crop seeds. For example, Yang [10] sponsored research on the classification and recognition of corn varieties based on the spectral data with a range of 400~1000 nm.
Rapeseed is the largest source of vegetable oil in China, and it is an important source of animal feed protein across the world [11]. Different varieties of rapeseed are very similar in appearance, and so are difficult to distinguish; however, they may have very different qualities. There are three main approaches to distinguish rapeseed varieties at present, namely, morphological identification, biochemical identification, and molecular marker technology identification [12]. For example, Tang et al. [13] used ISSR molecular marker technology to identify white mustard and mustard-type rapeseeds and carry out a relationship analysis. Wang et al. [14] applied another molecular marker technology, i.e., RAPD, to recognized five rapeseeds (B. napus) varieties. However, on the one hand, this method is cumbersome and time-consuming, and thus it is difficult to apply for the purpose of rapid detection. A similar problem is found for biochemical technology [15]. In addition, both morphological and biochemical identifications can be used for damage detection. On the other hand, morphological dentification is a simple and rapid method, but it depends greatly on previous research and the identification accuracy is not satisfactory. In this sense, identifying rapeseed varieties with a high accuracy and in a rapid and nondestructive way is of great importance and meaningful for rapeseed breeding and planting.
With the development of chemometrics and computer technology, in recent years, a large number of new analytical techniques have been proposed. In the 1980s, hyperspectral remote sensing, a new photoelectric detection technology, has brought about a revolution in remote sensing [16]. Due to its powerful data acquisition and analysis capabilities, hyperspectral technology has been fruitfully applied for the nondestructive identification of seeds, including but not limited to rice [17,18], corn [19,20], and soybean [21,22,23,24]. In this technology, determining the extraction and selection characteristics of the special bands are a prerequisite for establishing an identification model. Kong et al. [18] develop a weighted regression coefficient of the partial least square’s discriminant analysis (PLS-DA) to select 12 hyperspectral characteristic bands, and then established an identification model for the recognition of rice seed varieties. Yang et al. [19] used a joint skewness-based selection algorithm (JSWSA) to select 19 characteristic hyperspectral wavelengths and established a corn seed variety identification model. Combined with transfer learning, Zhu et al. [21] applied the reflectance of hyperspectral images to establish an intelligent model for soybean seed variety identification. In most of these studies, however, only a single hyperspectral feature was considered, through which it is difficult to capture the spectral information comprehensively [23].
In practical terms, hyperspectral feature extraction is challenging for modelling in various scenarios. This is not only because the hyperspectral reflectance is generally a continuous sequence arranged by wavelength with high sampling density, but also because the reflectance sequence presents the properties of complex and composite features. In addition, the hyperspectral data collected in the field are easily affected by the collection mode and the environment. The external noise also increases the difficulty of extracting the real characteristics of hyperspectral reflectance. In this regard, multiple feature fusion is necessary since only in this way can we comprehensively and accurately reflect the real information of hyperspectral reflectance associated with different bands [25]. A lot of research on hyperspectral feature extraction suggests that the color and texture of hyperspectral images as well as the trilateral parameters of spectral reflectance are important for modelling rapeseed’s biomass and related nutritional indicators [20,21,23,25]. Therefore, in this work, we employed these two features as components of the fused feature. Additionally, here, we will use an alternative characteristic, namely, multifractal features, as the other component of the fused feature. Apparently, standard multifractal analysis [26] is not suitable for extracting hyperspectral features due to its nonstationarity. As a well-known technique for dealing with nonstationary objects, (multi-)fractal detrended fluctuation analysis ((MF-)DFA) [27,28], has been fruitfully applied in various fields [29,30,31,32,33,34,35,36,37,38], including hyperspectral analysis [34,35,36,37,38]. For example, Li et al. [34] designed a technological process to detect hyperspectral redundancy by using the local DFA. Jiang et al. [35] introduced a method to determine sensitive bands of the rapeseed hyperspectral by using multi-scale MF-DFA (MMA). Wang et al. [36] applied 12 multifractal parameters computed by the MF-DFA method to model rapeseed chlorophyll retrieval. The large number of successful applications suggests that these methods are good for characterizing the dynamic structure of an object in the real world.
In this paper, we fuse the above color and texture features obtained from a hyperspectral image, trilateral parameters and multifractal features extracting from hyperspectral reflectance first. Then, some optimal feature parameters are screened and used to establish an intelligent model for identifying 11 rapeseed varieties. The rest of the paper goes as follows: In Section 2, we firstly provide a brief account of the experimental materials (Section 2.1 and Section 2.2), and then we review the well-known feature extraction method and model evaluation methods (Section 2.3). In Section 3, we present a method to screen features firstly; then, we construct a model by using the selected characteristics based on the support vector machine kernel method to identify 11 rapeseed species. Finally, we present the conclusion and discussion in Section 4.

2. Materials and Methods
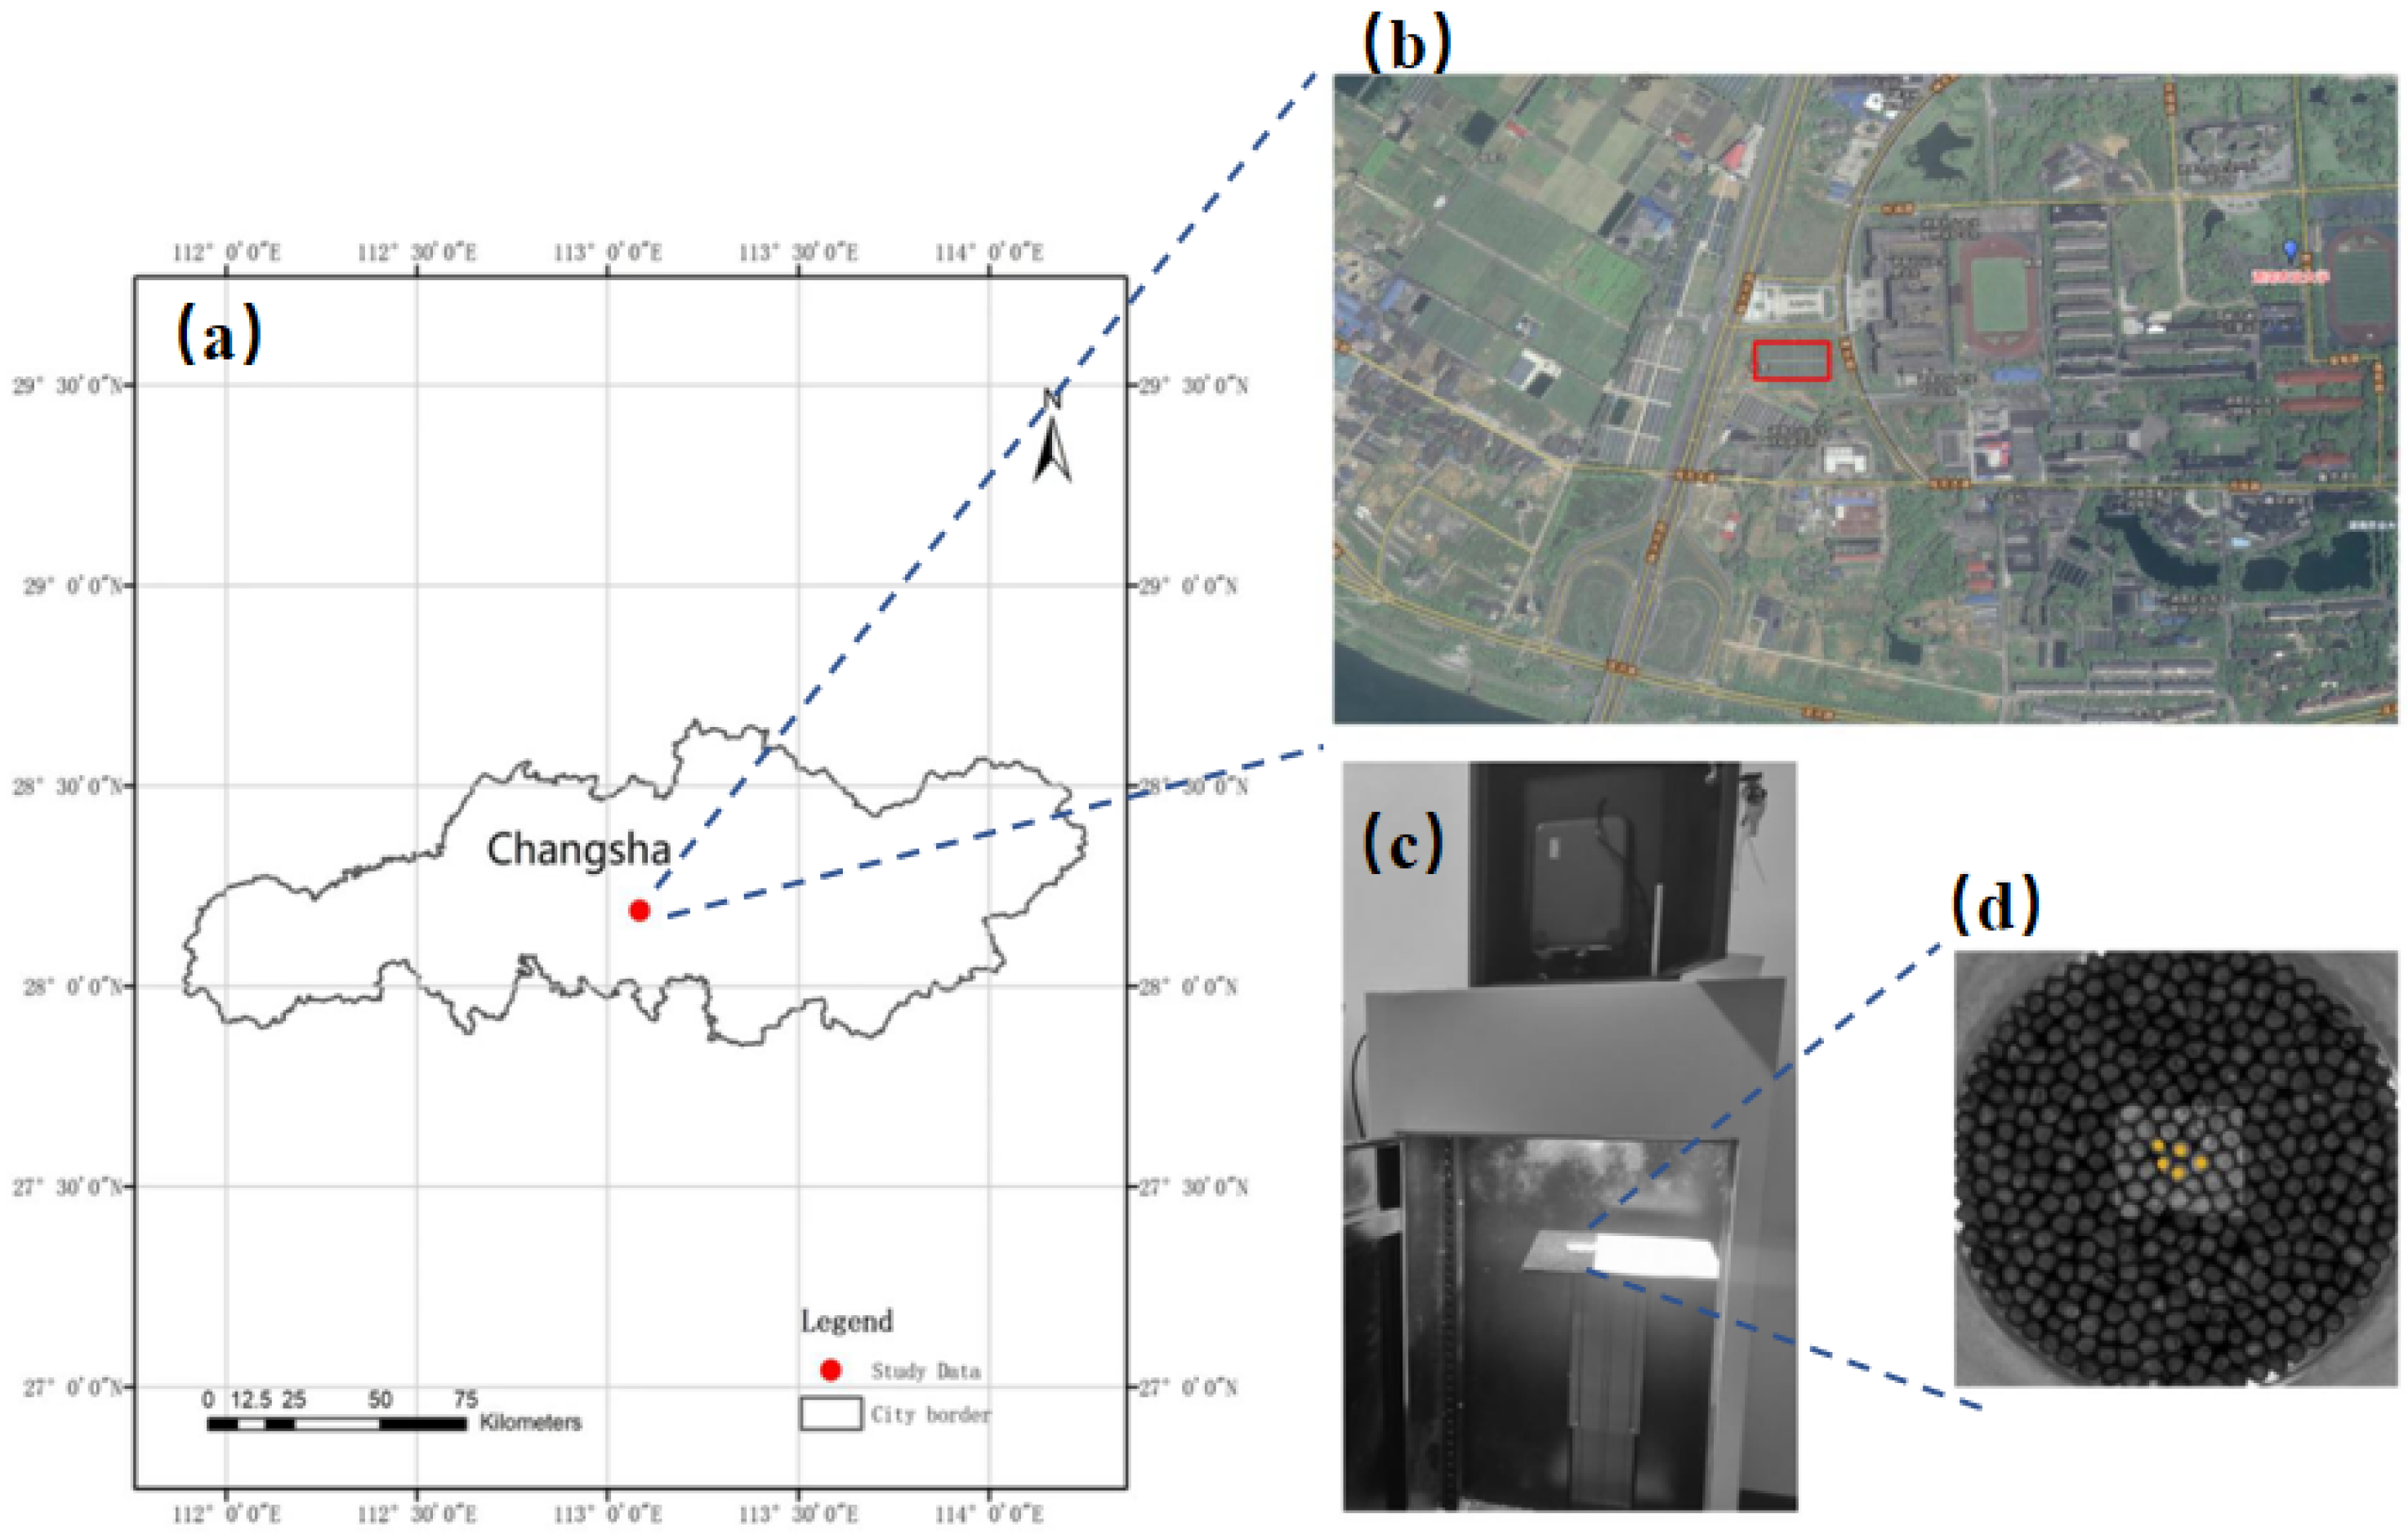
2.1. Materials

A total of 11 rapeseed varieties (Fenglv #1, Fenglv #2, Youtai #929, Xiangyou #708, High Oleic Acid #1, Nongda #1, Nongda #2, Youtai #1, Youtai #420, Xiangzayou #518, and Xiangzayou #787) were selected for analysis. The experimental samples were harvested at the Yunyuan (Figure 1b) Base of Hunan Agricultural University in Changsha of China (28.23° N, 112.93° E, see Figure 1a) in April 2020. The cropping system is a rotation of rice and rapeseed with black loam soil.

2.2. Data Collection

We used the SOC710 portable hyperspectral imager (wavelength range: 380~1091 nm; resolution: 4.9458 nm), produced by Surface Optics Corporation (11555 Rancho Bernardo Road San Diego, California 92127) of the United States, to collect the spectral data. The optical experimental obscura (task cabin) was placed under dark conditions. The size of the cabin is 50 × 60 × 120 cm, with a movable base and a cooling device, as shown in Figure 1c. The inside of the camera obscura is covered in a diffuse reflective coating. In the cabin, there were two task silos, large and small, a lifting table, and four groups of built-in 70 W halogen light sources, which can be adjusted arbitrarily. The spectrometer was placed on top of the small task silo. The instrument needs to be warmed up for 15 min before taking a measurement. The lens was facing the rapeseed sample vertically downward with an exposure distance of 370 mm. The 11 rapeseed varieties were placed in 66 discs in order, 6 discs per variety. In every disc, 5 nonoverlapping rectangular regions (see Figure 1d) were randomly selected as the regions of interest (ROIs). There are 330 ROIs in all. In each ROI, 5 points were selected randomly to collect their spectral reflectance and averaged as a sample. Meanwhile, image features were extracted from every ROI. Accordingly, there are 330 spectral reflectance data and the corresponding images were obtained for all, with each species having 30 samples.

2.3. Methods

2.3.1. Multifractal Detrended Fluctuation Analysis (MF-DFA)

Research showing successful applications in various fields shows that MF-DFA is a useful tool to cope with the nonstationary object. Here, we outline the MF-DFA briefly.
Assuming x i i = 1 N is a hyperspectral reflectance series with N sample bands, the profile of x i i = 1 N is calculated by X t = i = 1 t ( x i x ¯ ) , where x ¯ = 1 N i = 1 N x i . Then, the profile is divided into Ns ≡ [N/s] nonoverlapping segments with equal length s. As the N is not always an integral multiple of s, we repeat the dividing procedure starting from the opposite end of the profile. Thus, a total of 2Ns segments were obtained. We denote the v-th segment as [lv + 1, lv + s], where lv = (v−1)s for v = 1, 2, …, Ns and lv = N−(v-Ns)s for v = Ns + 1, Ns + 2, …, 2Ns.
In each segment, the local trend y ˜ v k was detrended, which is always determined by m order polynomial fitting (in this work, we took m = 1). Accordingly, y s k is the detrended series in v-th segment,
y s k = y k y ˜ v k ,   k = 1 , 2 , , N s
Next, the variance for every detrended series in segment v is calculated by
F 2 ( s , v ) = 1 s i = 1 s y s 2 [ ( v 1 ) s + i ] , v = 1 , 2 , , N s , 1 s i = 1 s y s 2 [ N ( v N s ) s + i ] , v = N s + 1 , N s + 2 , , 2 N s .
Then, the averaged q-order fluctuation function over the all the segment is
F q ( s ) = 1 2 N s v = 1 2 N s [ F 2 ( s , v ) ] q / 2 1 / q q 0 exp 1 4 N s v = 1 2 N s ln F 2 ( s , v ) q = 0
Finally, vary the scale s and repeat the above steps. For an assembly of s and the corresponding Fq(s), a power-law scaling behavior between them (see below) will be expected in the case of spectral reflectance with a fractal structure,
F q s s h q ,
where the index h q is the so-called generalized Hurst exponent, describing the long-term correlation of the original spectrum. Generally, h q > 0.5 expresses the persistence of the spectrum reflectance series, and the h q < 0.5 is the anti-persistent case. The multifractal nature is present when h q depends on q statistically. To measure the strength of the multifractality, Δ h is defined by Equation (5),
Δ h = h m a x q h m i n q ,
where h m a x q and h m i n q are the maximum and minimum of the h q for considering qs. In this work, we took q ∈ [–3, 3]. The larger Δ h q is, the stronger the multifractality is.
According to the paradigmatic multifractal analysis (MFA), the mass index τ q , expressing the multifractal nature, is related to h q as
τ q = q h q D f ,
where D f is the topological dimension of the object. For the spectral reflectance series, D f = 1 . The multifractality of the object can be observed if τ q depends on q nonlinearly.
Via the Legendre transformation, the Lipschitz–H o ¨ lder index α q and multifractal spectrum f α are determined by:
α q = τ q = h q + q h q f α = q α q τ q                                  
Δ f = f ( α m a x ) f ( α m i n ) ,     Δ α = α m a x q α m i n q
Δ α is the span of the multifractal spectrum, which portrays the local singularity of the object. In general, the larger Δ α is, the more uneven the reflectance distribution is, and the greater the fluctuation observed. Δ f is the so-called Hausdorff dimension, demonstrating the global singularity of the object. In this work, 12 multifractal parameters were employed as augments for the following model, namely, h( ± 3 ), h( ± 2 ), h( ± 1 ), h( 0 ),   Δ h , α m a x , a m i n , Δ α , and Δ f .

2.3.2. Color and Texture Feature

According to existing studies in the literature, image color is an effective feature to identify rapeseed varieties [39,40]. How to use the color information is the key to the identification of rapeseed varieties. The ten-color model [41,42] is an effective model to portray the image features, including HIS, HSV (HSB), HSL, L*a*b, HMMD, YCbC and other color models. In our work, the improved ten-color model [41] was used as the color feature space. The percentage of the ten-color feature of the target region in the entire region is regarded as the color feature. In practice, according to the ten-color method, 98 color features were obtained for the spectral images of ROIs, as shown in Table 1.
In addition, an image’s texture is a visual feature of the image, which characterizes the developmental rule of the image and the arrangement of the surface structure. Here, we used six texture features, mean smoothness, mean contrast, average brightness, entropy, inverse gap, and three matrices [43].

2.3.3. Trilateral Parametric
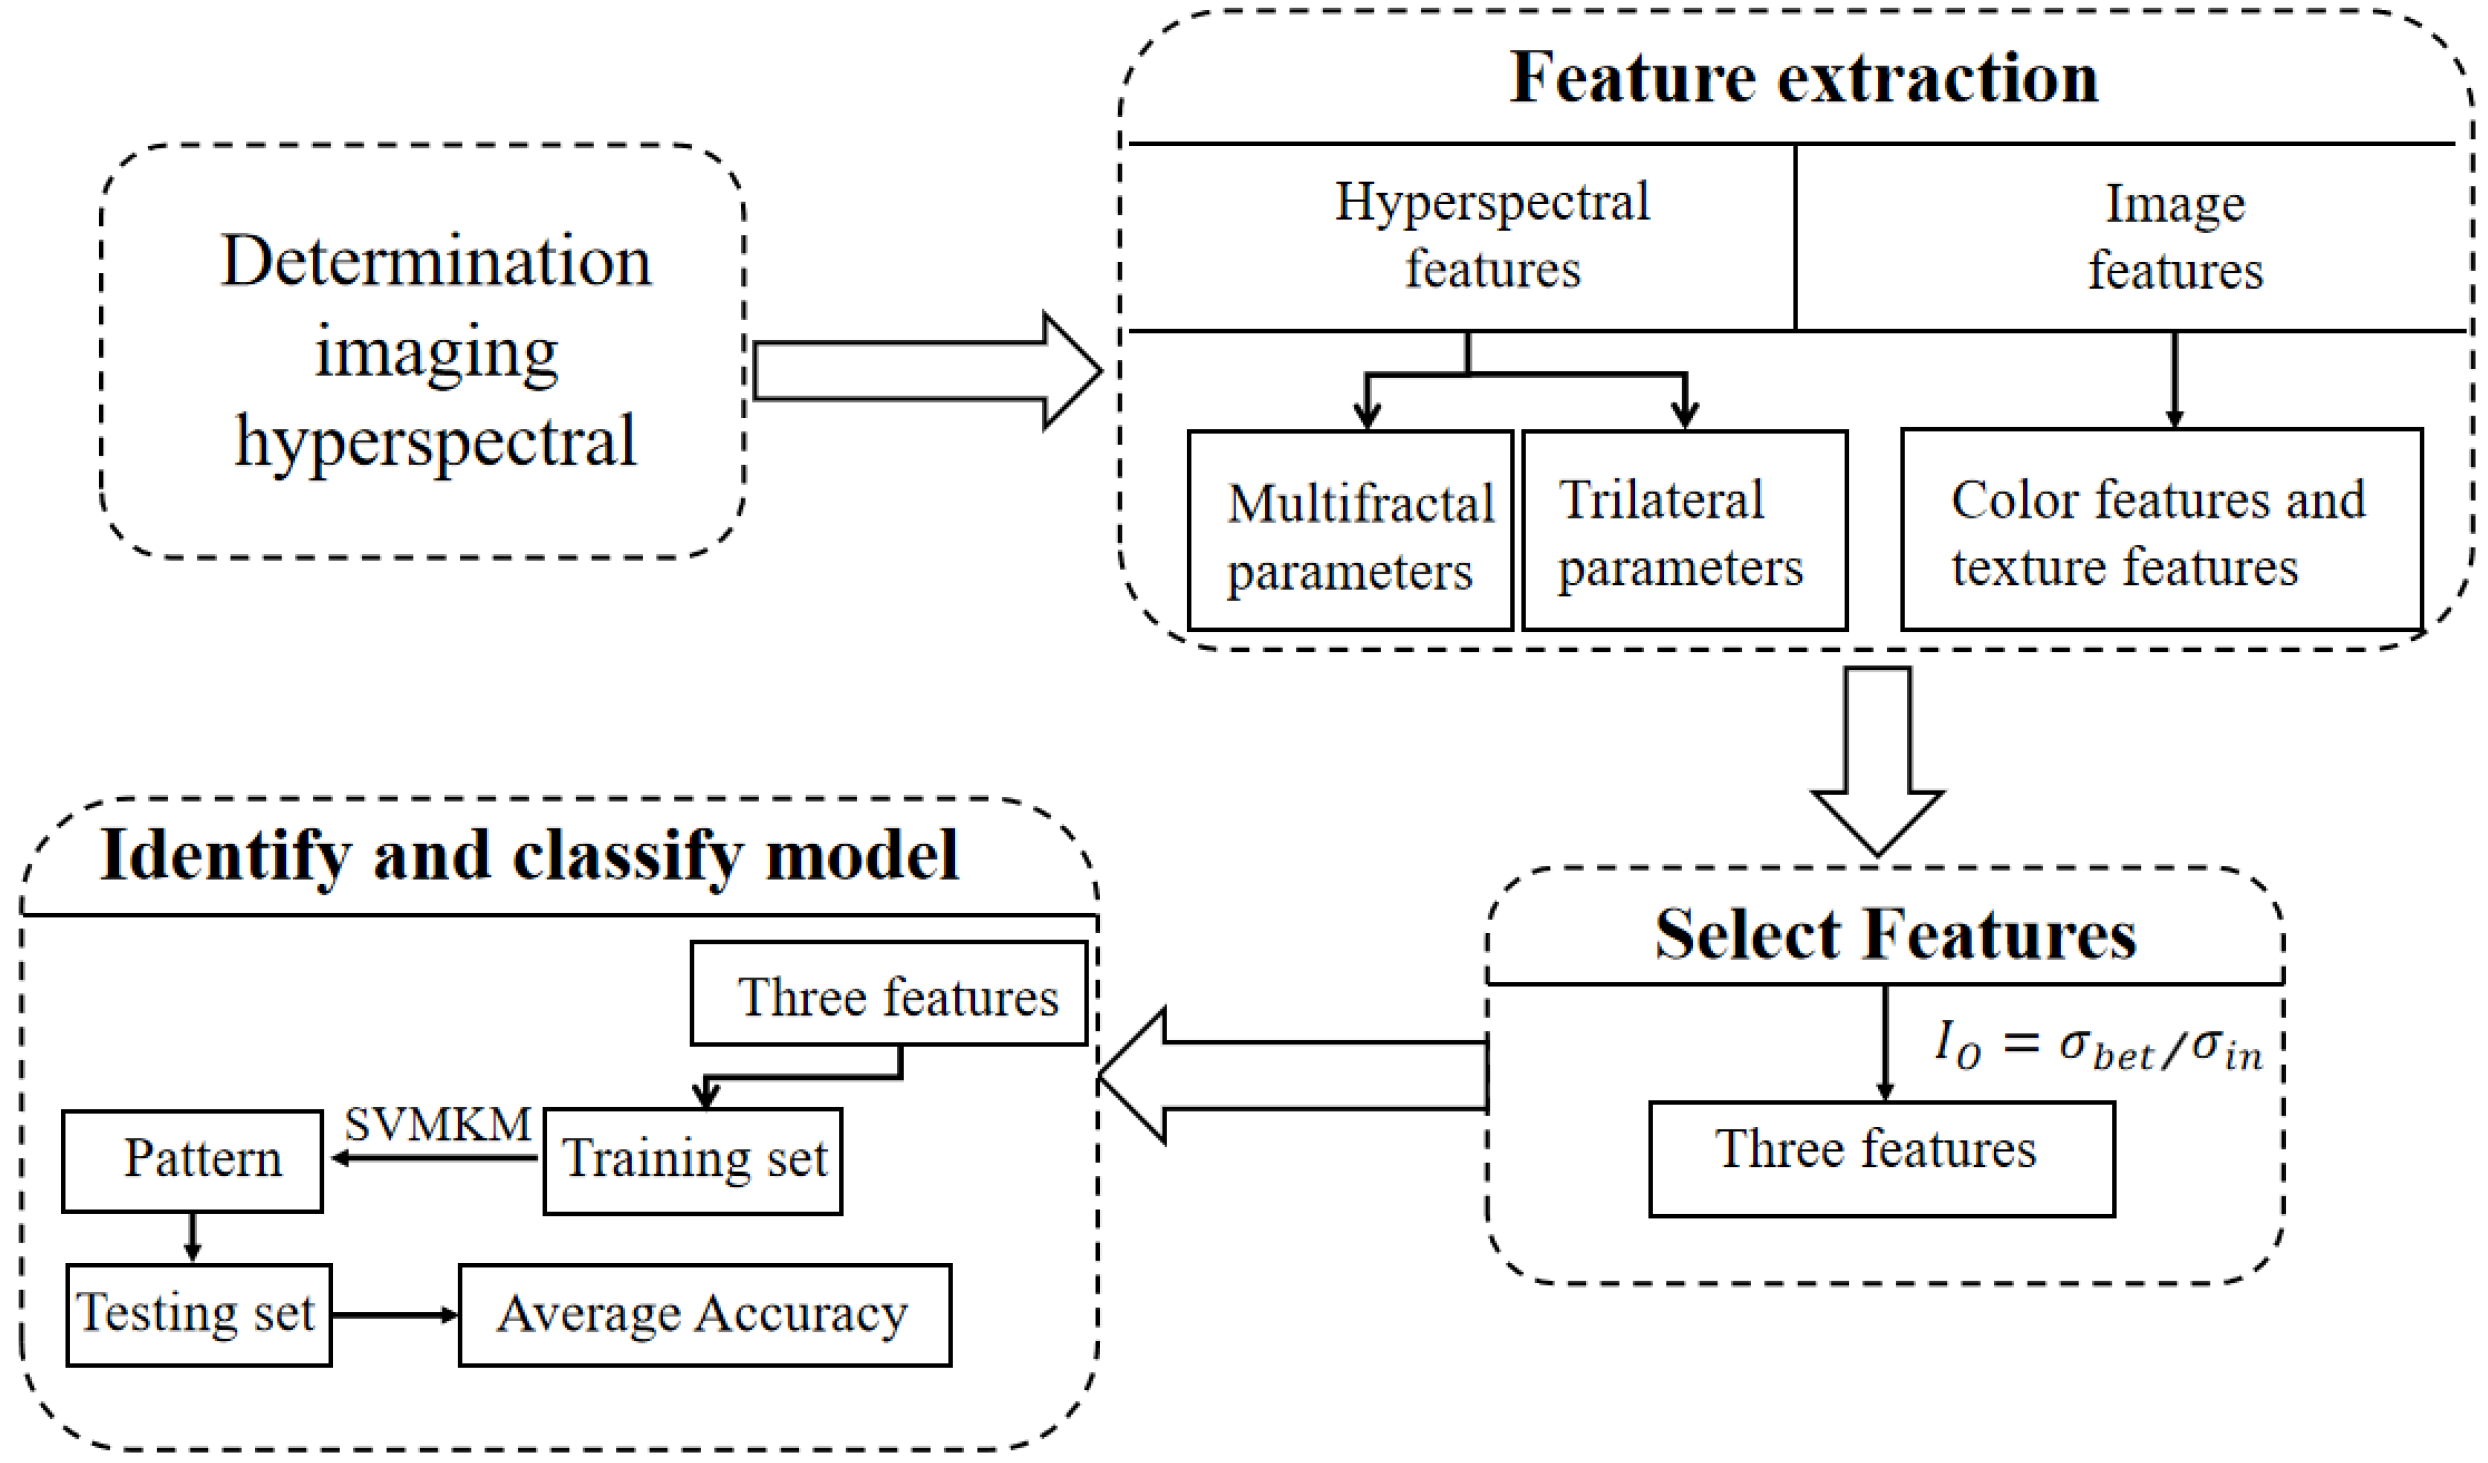
Spectral trilateral parameters, i.e., red edge, blue edge and yellow edge, are associated with the relevant characteristics based on the special position features of the spectrum, which are key indicators for green vegetation. A total of 23 representative trilateral parameters were selected, including positions, amplitudes, areas, and the normalization and ratio of the above parameters as well as their numeric characteristics [44,45]. See Table 2 for details.

2.4. Flow Chart

To clearly show our methodology and the model proposed in this work, we created a flowchart, presented in Figure 2. Follow this flowchart, we first collected rapeseed hyperspectral data (including spectral reflectance and image information). Then, we obtained three aspects’ features from the collected hyperspectral data. Next, a simple index I 0 was used to filter the characteristics. Finally, the model was established to recognize different rapeseed varieties based on SVMKM.

3. Results and Discussion

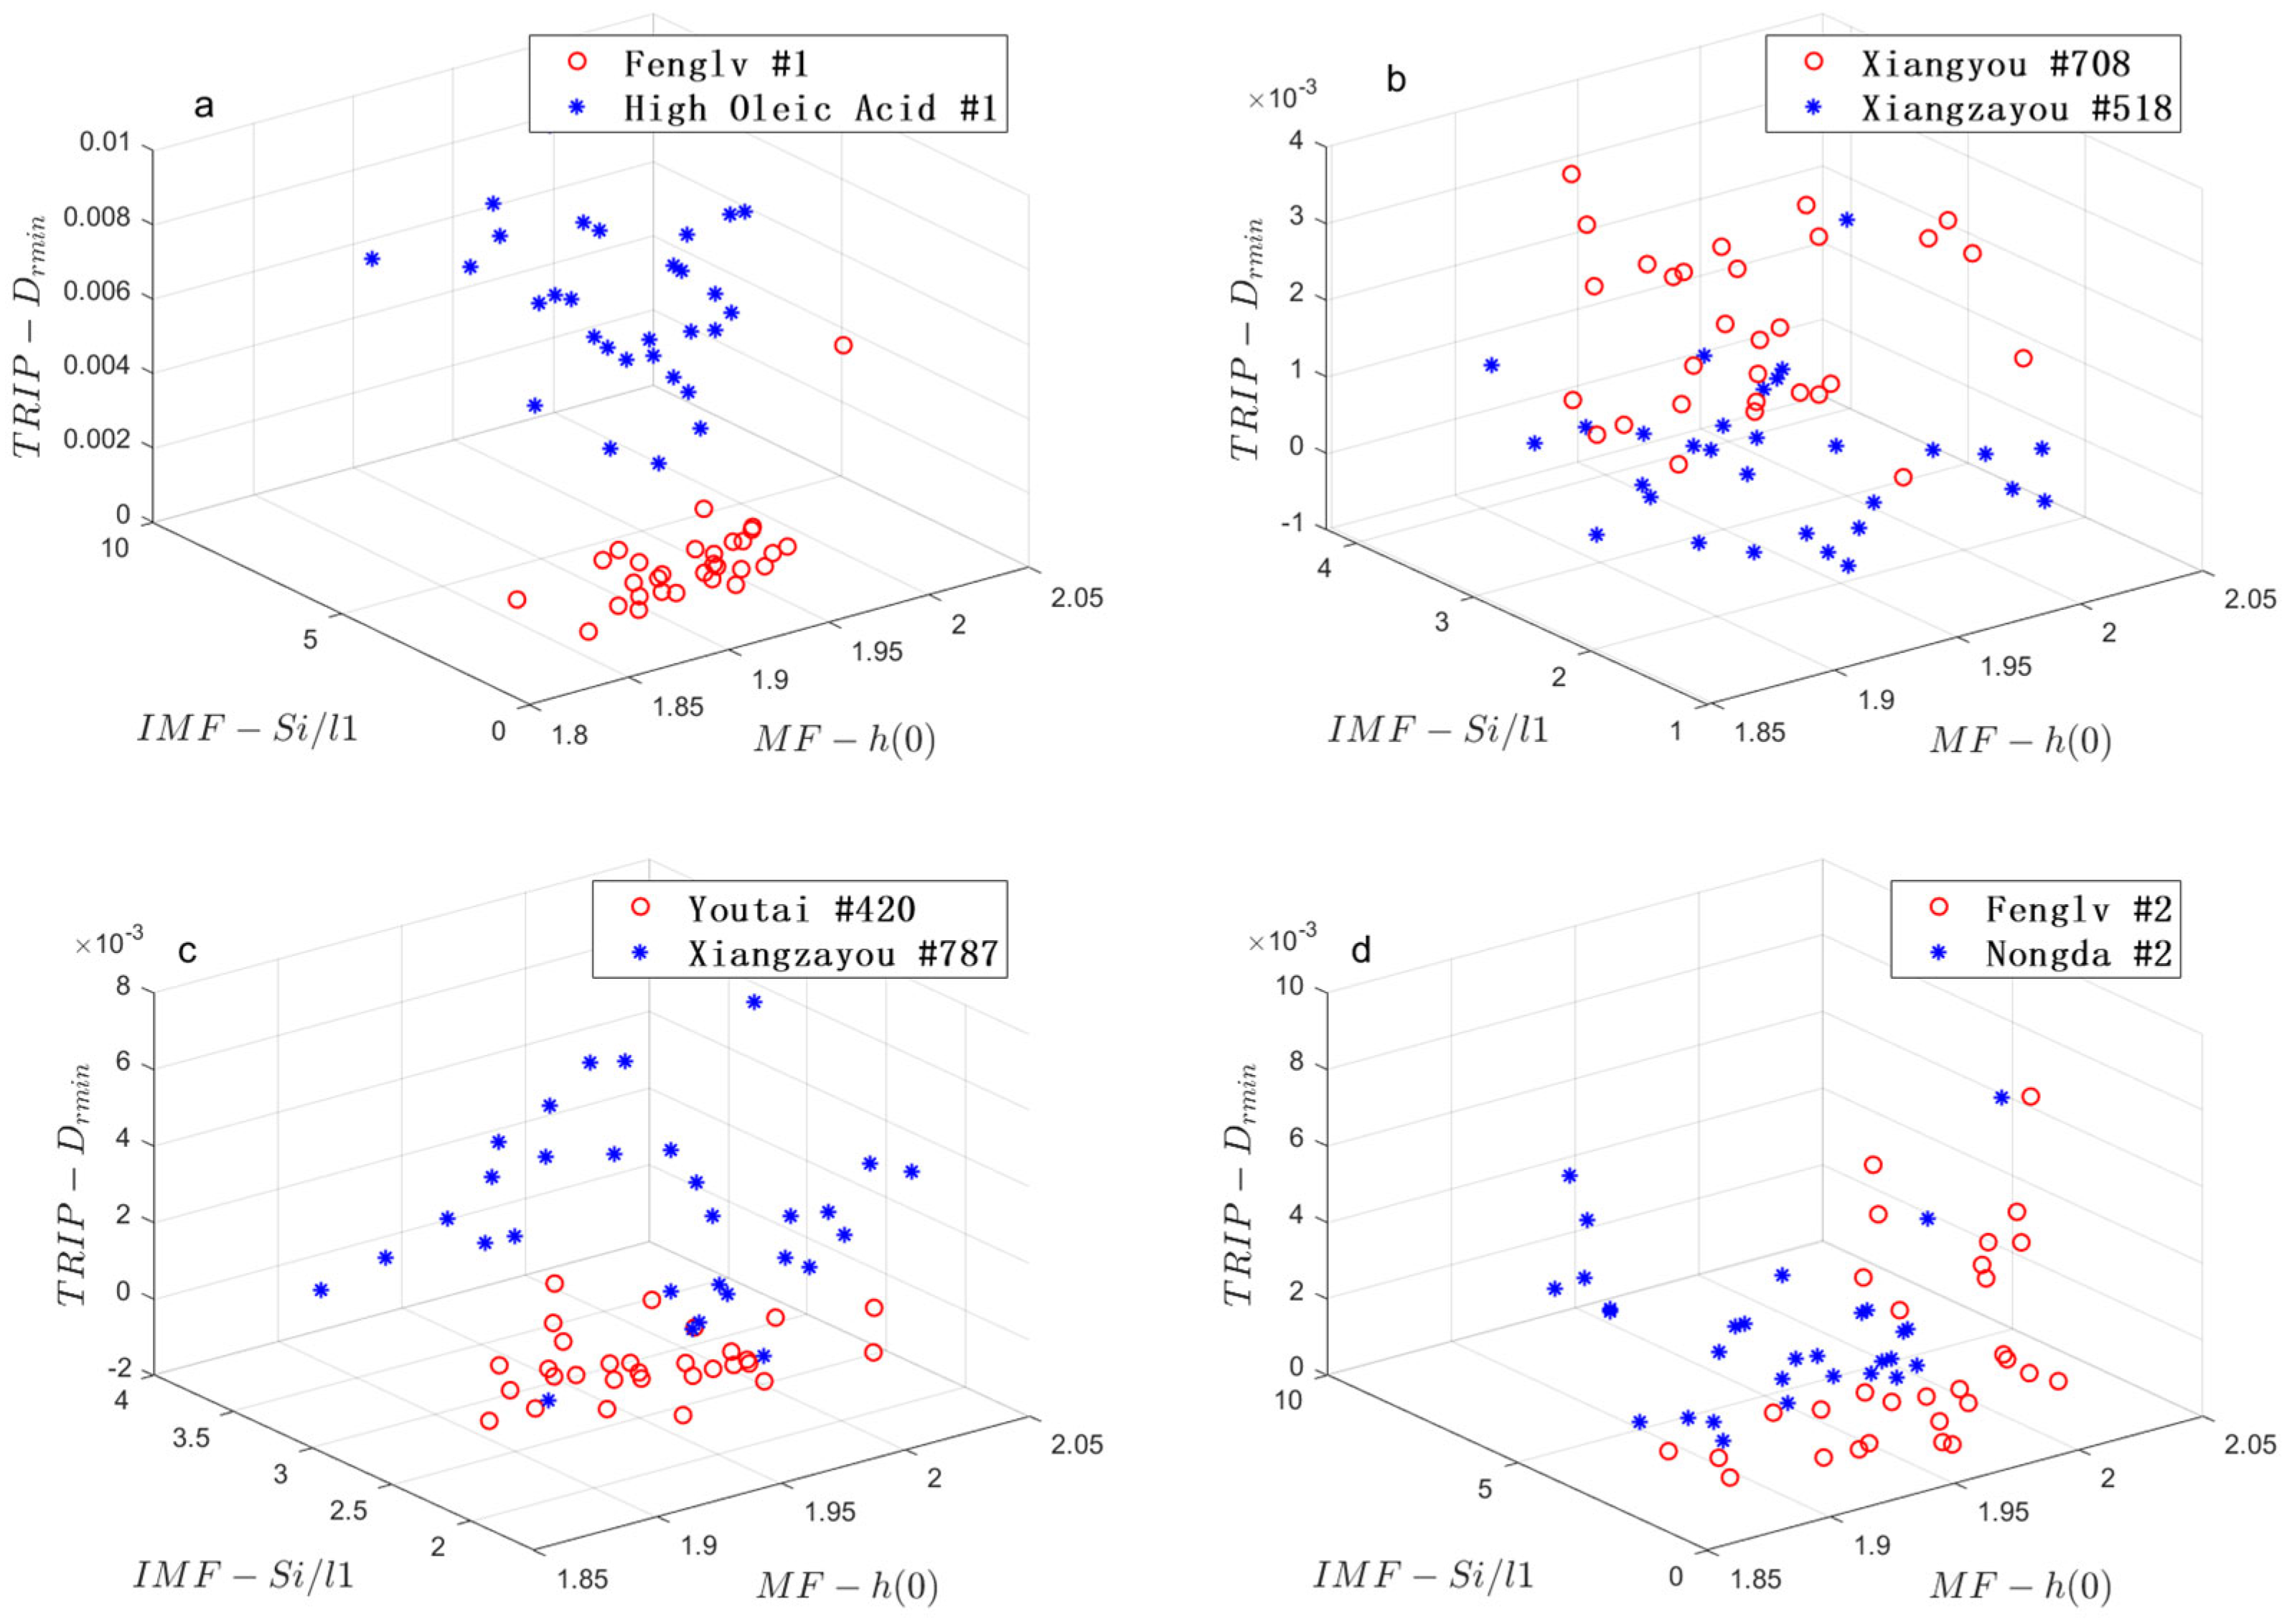
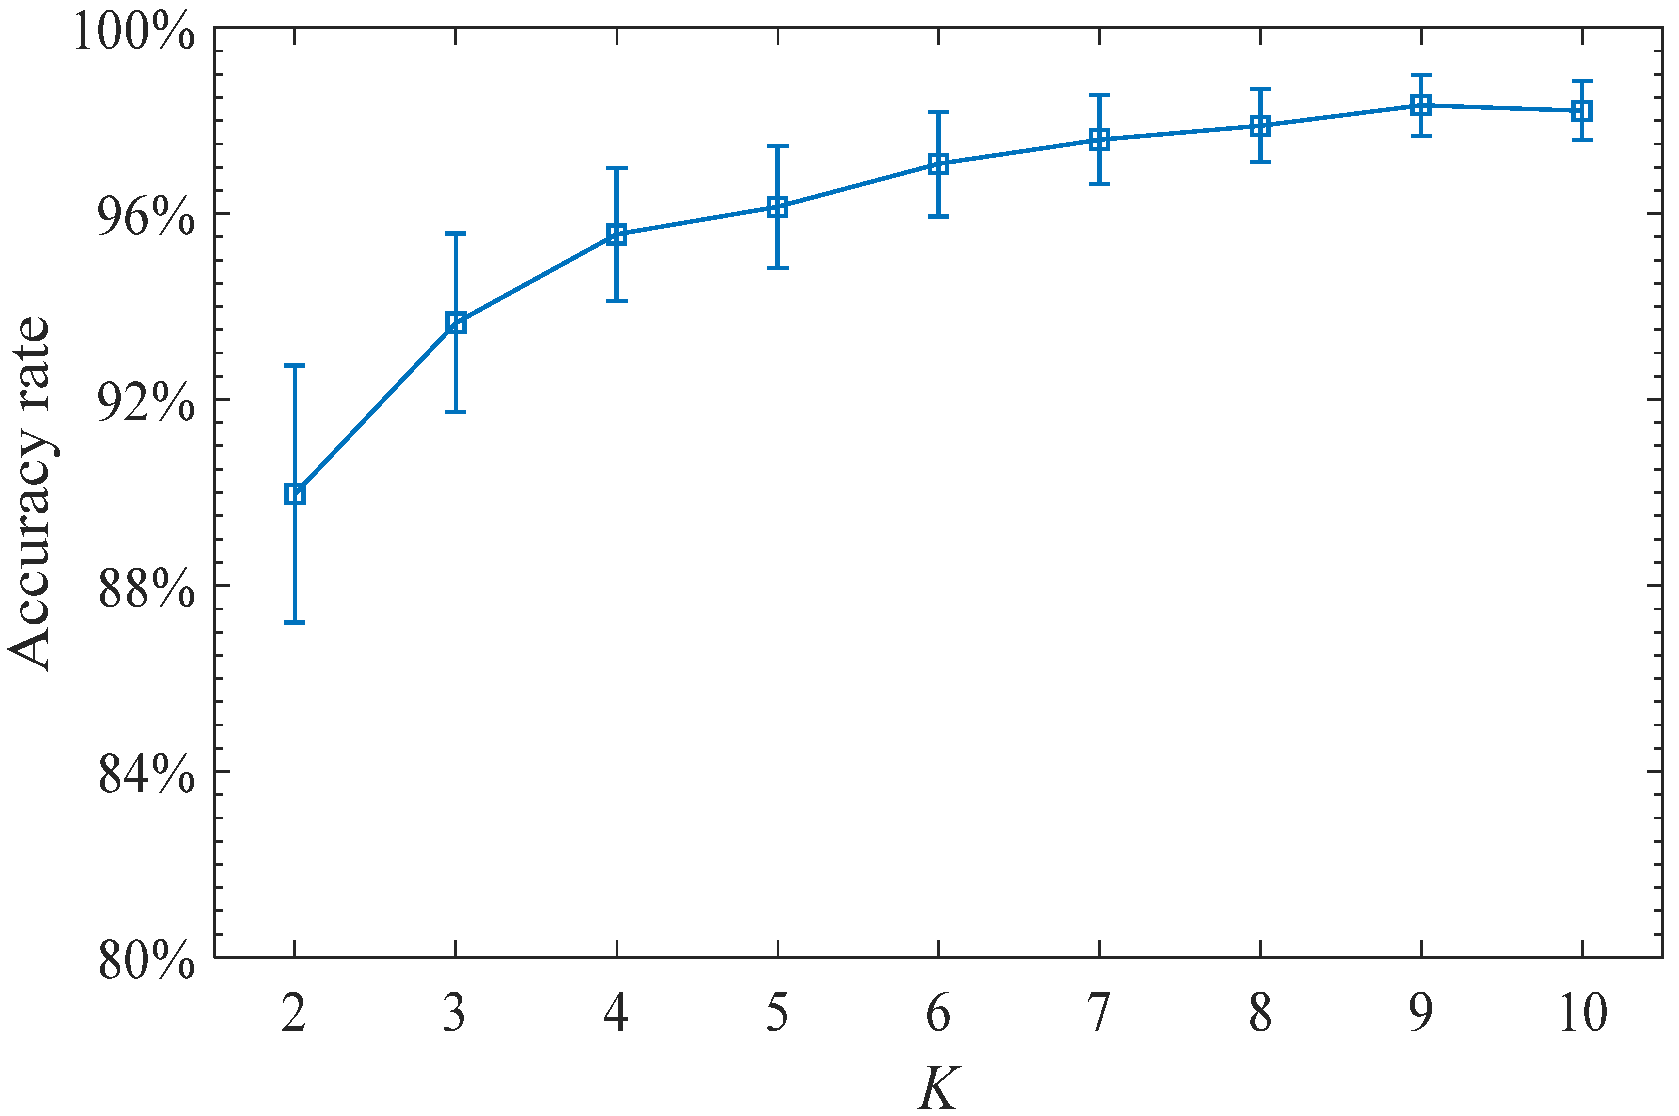
3.1. Model Establishment and Analysis

For every hyperspectral image or its corresponding reflectance, we obtained 12 multifractal parameters, 23 trilateral parameters and 104 image characteristics. To select suitable characteristic parameters for identifying the 11 rapeseed varieties, we employed the I0-index [46]. The design concept of this index is akin to the idea of one-way ANOVA. For every rapeseed species i (i = I, II, …, XI), σ i n i is defined as the standard deviation of 30 samples in the species i, which describes the difference between samples within the species i. σ b e t is the standard deviation of the average features of the 11 species, characterizing the difference between the different species. Thus, I0 is defined by
I 0 = σ b e t σ i n
where σ i n is the average of σ i n i over the 11 rapeseed varieties. From this definition, we note that the spectral feature parameter with larger I0 serves as a better indicator to distinguish species.
We note that the index I0 given by Equation (10) is quite different for the three types of features (i.e., multifractal parameters, image/texture characteristics, and trilateral parameters). We selected one parameter associated with the largest I0 for each type of feature to determine the contribution of the three features to the recognition. Hence, three best parameters were obtained: h(0) was obtained using the multifractal method (denoted by MF-h(0)), Si/I1 was obtained from the image color/texture feature (denoted by IMF-Si/I1), and Drmin was obtained from the trilateral parameters (denoted as TRIP-Drmin). The combination {MF-h(0), IMF-Si/I1, TRIP-Drmin} is considered as the feature description of the classification target. Firstly, we used this feature fusion to identify every two rapeseed species. As examples, we put the samples of four pairs of rapeseed species into a three-dimensional space established by the three features, as shown in Figure 3. In each subplot, every scattered point represents a sample. Seen in these figures, the samples belong to different species are distinguished well, and the samples come from the same breed are gathered together. The support vector machine kernel method (SVMKM; the kernel is the heavy-tailed radial basis function—“htrfb”) is employed here for species recognition. We used a K-fold cross-validation to compute the recognition accuracy rate (AR). In the K-fold cross-validation, 100(K𢈒1)/K% samples were randomly selected as the training set while the remaining 100/K% samples were used as the test set. The calculation process is repeated 10 times to eliminate the influence of noise. The AR of Fenglv #1 and High Oleic Acid #1 reached 99.67%, and the AR of the other three pairs of species is larger than 98% (set K = 5). We calculated the AR of every pair (there are 55 pairs in all) of species. The average result over the 55 pairs rapeseed species is 96.35%. To investigate the impact of different number of samples in the training set on the AR, we set K as a different value to compute the average AR of the 55 pairs of rapeseed species, as shown in Figure 4. As can be seen here, naturally, the average AR increases with the increasing K. The average AR being larger than 90%, except for K = 2, shows that our model is workable.
Let us consider the recognition of 11 species. Figure 5 shows the distribution of the average features {MF-h(0), IMF-Si/I1, TRIP-Drmin} over 30 samples in every category in the three-dimensional parameter space. Each symbol represents a rapeseed species. The visualization indicates that the 11 species, which were separated from each other, will be distinguished well by the three features. We put all samples into this three-dimensional space and calculated the recognition of AR for the 11 species with 10-fold cross validation. The average AR is 93.71% over 10 repetitions and 92.72%, respectively, by using above two classifiers. The high AR indicates that our model is workable. To illustrate the error classification of each species, the confused matrix is listed in Table 3.

3.2. Model Test

To demonstrate the effectiveness and robustness of the proposed model, we test it considering two aspects. Firstly, On the one hand, to prove the feature combination {MF-h(0), IMF-Si/I1, TRIP-Drmin} is optimal for the 11 species recognition, we select other four feature combinations for comparison, namely, {MF- Δ α , IMF- C R , TRIP- Y e p }, {MF- α m i n , IMF- S M , TRIP- Y e p }, {MF-h(-3), IMF- L , TRIP- S D r }, and {MF-h(0), IMF-a*/L*, TRIP-Dbmin} (where CR and SM denote the mean contrast and mean smoothness, respectively). We put the 330 samples of 11 species into those three-dimensional spaces, respectively, and calculated the average AR by using SVMKM and K-fold cross validation (K is set 2 to 10); the result is shown in Figure 6. It is clear that the black line (representing the combination {MF-h(0), IMF-Si/I1, TRIP-Drmin} obtained according to I0) is always superior to other four cases.
On the other hand, we would like to investigate whether the different numbers of features impact on the recognition AR. To this end, we record the features refer to the largest n (n = 1~7) Io index. As mentioned above, since that the scale of index I0 is different among the three types of features, we selected the seven parameters according to the maximum I0 in every type of features. They are IMF-Si/I1, TRIP-Drmin, MF-h(0), IMF-Hi/Si, TRIP-NDRE, MF-h(-1), IMF-B, respectively. Then, repeat above process based on SVMKM with K-fold cross validation and calculate the recognition AR for identifying every two rapeseed species (set K = 5) and the whole 11 species (set K = 10). As shown in Figure 7, the left is the average AR over the 55 pairs of species while the right is that of 11 species. From this, one can conclude that the AR undergoes a large amplification when the number of features varies from 1 to 2 and from 2 to 3; however, it maintains stability in the case n ≥ 3. In this sense, three may be the optimal feature number to establish the model for rapeseed species identification.
In what follows, we wish to examine stability of the model. To do so, we use different numbers of samples (randomly choose m samples in each species, m = 18, 20, 22, 24, 26, and 28) to construct the model; the averaged AR over 10 independent realizations is shown in Figure 8. The result fluctuates over a narrow range (93.76%~94.03%), demonstrating that the recognition AR is almost independent of the number of samples, which benefits from the robustness of the selected feature fusion.
As our last concern, let us investigate whether the high AR depends on the classifier. Besides the SVMKM, two other intelligent methods, namely, random decision forest (RDF) and K nearest neighbor (KNN), were employed as classifiers for the identification of 11 species. The three fused features {MF-h(0), IMF-Si/I1, TRIP-Drmin} of the 330 samples were input into the above classifiers, respectively. The average result with K-fold cross validation (still set K = 2 to 10) over 10 repetitions is shown in Figure 9. It confirms that the high AR is obtained independently of classifier selection.

4. Conclusion and Discussion

Recognition of crop varieties with modern intelligent devices is of great significance to the development of smart agriculture. Hyperspectral images are an important and economic tool for this purpose. In this paper, our task is to identify eleven rapeseed species by using this new tool. To establish the model for identification, we extracted three types of features to obtain their hyperspectral information, namely, the multifractal parameters of hyperspectral reflectance, trilateral parameters of hyperspectral reflectance, and color/texture feature of the hyperspectral image. With the so-called index I0, three optimal features MF- h 0 , IMF- S i / I 1 , TRIP- D r m i n were screened and fused together to act as a model input. The support vector machine kernel method and random decision forest were employed as classifiers. The recognition model was constructed to identify two rapeseed species and another 11 species. K-fold cross validation is used for training and testing the models. The average recognition accuracy rate is 96.35% for the first model (with 5-fold cross validation) and is 93.71% for the recognition of the 11 other species (with 10-fold cross validation), respectively. The model test demonstrates that our method has satisfactory recognition accuracy and robustness.
It is worth emphasizing that the hyperspectral technique is a nondestructive approach, which will shine brightly in smart agriculture in the future by combining intelligent models. The proposed model is just an intelligent model, which utilizes a variety of hyperspectral feature information to effectively improve the accuracy of crop variety identification. We highlight that most of the similar works reported in the studies [5,6,7] only considered spectral reflectance characteristics while ignored image information. In practice, the image information is as important as the spectral reflectance since the two aspects are actually the most critical carriers monitored by remote sensing. Objectively, the research on hyperspectral technology, to a large extent, serves remote sensing in the future. In this work, we consider these two aspects of information, which well complement each other. The proposed model framework, including feature exaction, feature filtering and modelling, provides more research for the rapid recognition of other crop species.

Author Contributions

Data curation, F.L. and Y.J.; Formal analysis, F.L. and F.W.; Funding acquisition, F.W.; Investigation, X.W. and Y.J.; Methodology, F.L. and Z.Z.; Project administration, F.W. and Y.Y.; Resources, G.L.; Software, F.L. and G.L.; Validation, Z.Z.; Visualization, Z.Z.; Writing—original draft, F.L.; Writing—review and editing, F.W. and Y.Y. All authors have read and agreed to the published version of the manuscript.

Funding

This research is supported partially by the National Natural Science Foundation of China (Grant No. 61973111).

Institutional Review Board Statement

Not applicable.

Informed Consent Statement

Not applicable.

Data Availability Statement

The raw/processed data required to reproduce these findings cannot be shared at this time as the data also form part of an ongoing study.

Conflicts of Interest

The authors declare no conflict of interest.

References

  1. Tan, K.; Chai, Y.; Song, W.; Cao, X. Identification of soybean seed varieties based on hyperspectral image. Trans. Chin. Soc. Agric. Eng. 2014, 30, 235–242. [Google Scholar]
  2. Wu, N.; Zhang, Y.; Na, R.; Mi, C.; Zhu, S.; He, Y.; Zhang, C. Variety identification of oat seeds using hyperspectral imaging: Investigating the representation ability of deep convolutional neural network. Rsc. Adv. 2019, 9, 12635–12644. [Google Scholar] [CrossRef]
  3. Jin, B.; Zhang, C.; Jia, L.; Tang, Q.; Gao, L.; Zhao, G.; Qi, H. Identification of Rice Seed Varieties Based on Near-Infrared Hyperspectral Imaging Technology Combined with Deep Learning. ACS Omega 2022, 7, 4735–4749. [Google Scholar] [CrossRef] [PubMed]
  4. Singh, T.; Garg, N.M.; Iyengar, S.R.S. Nondestructive identification of barley seeds variety using near-infrared hyperspectral imaging coupled with convolutional neural network. J. Food Process. Eng. 2021, 44, e13821. [Google Scholar] [CrossRef]
  5. Zheng, T.T.; Sun, T.F.; Cao, Z.; Zhang, J. Quality Analysis of Peanut Seed by Visible/Near-Infrared Spectra. Spectrosc. Spectr. Anal. 2015, 35, 622–625. [Google Scholar]
  6. Zhou, Z.L.; Zhang, Y.; He, Y.; Li, X.; Shao, Y. Method for rapid discrimination of varieties of rice using visible NIR spectroscopy. Trans. Chin. Soc. Agric. Eng. 2009, 25, 131–135. [Google Scholar]
  7. Huang, M.; He, C.; Zhu, Q.; Qin, J. Maize Seed Variety Classification Using the Integration of Spectral and Image Features Combined with Feature Transformation Based on Hyperspectral Imaging. Appl. Sci. 2016, 6, 183. [Google Scholar] [CrossRef]
  8. He, C.; Zhu, Q.; Huang, M.; Mendoza, F. Model Updating of Hyperspectral Imaging Data for Variety Discrimination of Maize Seeds Harvested in Different Years by Clustering Algorithm. T Asae 2016, 59, 1529–1537. [Google Scholar]
  9. Wang, R.; Tan, K.; Li, M.; Gong, Z. Discriminating soybean seed varieties using hyperspectral imaging and machine learning. J. Comput Methods Sci. 2019, 19, 1–15. [Google Scholar]
  10. Yang, X.; Hong, H.; You, Z.; Cheng, F. Spectral and Image Integrated Analysis of Hyperspectral Data for Waxy Corn Seed Variety Classification. Sensors 2015, 15, 15578–15594. [Google Scholar] [CrossRef]
  11. Liu, C.; Feng, Z.C.; Xiao, T.H.; Ma, X.M.; Zhou, G.S.; Huang, F.H.; Li, J.N.; Wang, H.Z. Development, potential and adaptation of Chinese rapeseed industry. Chin. J. Oil Crop Sci. 2019, 41, 485–489. [Google Scholar]
  12. Li, W.; Liu, Y.; Wang, W.; Liu, J.; Yao, M.; Guan, M.; Guan, C.; He, X. Phytochrome-interacting factor (PIF) in rapeseed (Brassica napus L.): Genome-wide identification, evolution and expression analyses during abiotic stress, light quality and vernalization. Int. J. Biol. Macromol. 2021, 180, 14–27. [Google Scholar] [CrossRef] [PubMed]
  13. Tang, N.; Bao, Y.X.; Tang, D.C. Application of ISSR Molecular Maker in the Identification of Sinapsis alba L. and Brassica juncea var. gracilis Tsen et Lee. Mol. Plant Breed. 2018, 16, 6365–6371. [Google Scholar]
  14. Wang, X.J.; Xiong, X.H.; Guan, C.Y. Identification of Five Rapeseed (B.napus) Varieties with RAPD Technique. Crop Res. 2010, 24, 99–102. [Google Scholar]
  15. Birte, B.; Santosh, S.; Zahra, S.; Johannes, R.J.; Mogens, N.; Jens, M.C. Multispectral imaging—A new tool in seed quality assessment? Seed. Sci. Res. 2018, 28, 1–7. [Google Scholar]
  16. Tong, Q.X.; Zhang, B.; Zhang, L.F. Current progress of hyperspectral remote sensing in China. J. Remote Sens. 2016, 20, 689–707. [Google Scholar]
  17. Hai, V.; Tachtatzis, C.; Murray, P.; Harle, D.; Dao, T.K.; Le, T.-L.; Andonovic, I.; Marshall, S. Rice seed varietal purity inspection using hyperspectral imaging. In Proceedings of the Hyperspectral Imaging and Applications Conference, Coventry, UK, 12–13 October 2016; pp. 169–174. [Google Scholar]
  18. Kong, W.; Zhang, C.; Liu, F.; Nie, P.; He, Y. Rice Seed Cultivar Identification Using Near-Infrared Hyperspectral Imaging and Multi-variate Data Analysis. Sensors 2013, 13, 8916–8927. [Google Scholar] [CrossRef]
  19. Yang, S.; Zhu, Q.B.; Huang, M.; Qin, J.-W. Hyperspectral Image-Based Variety Discrimination of Maize Seeds by Using a Mul-ti-Model Strategy Coupled with Unsupervised Joint Skewness-Based Wavelength Selection Algorithm. Food. Anal. Method 2017, 10, 424–433. [Google Scholar] [CrossRef]
  20. Zhao, Y.; Zhu, S.; Zhang, C.; Feng, X.; Feng, L.; He, Y. Application of hyperspectral imaging and chemometrics for variety classification of maize seeds. RSC Adv. 2018, 8, 1337–1345. [Google Scholar] [CrossRef]
  21. Zhu, S.; Zhang, J.; Chao, M.; Xu, X.; Song, P.; Zhang, J.; Huang, Z. A Rapid and Highly Efficient Method for the Identification of Soybean Seed Varieties: Hyperspectral Images Combined with Transfer Learning. Molecules 2019, 25, 152. [Google Scholar] [CrossRef] [Green Version]
  22. Wei, Y.; Li, X.; Pan, X.; Li, L. Nondestructive Classification of Soybean Seed Varieties by Hyperspectral Imaging and Ensemble Machine Learning Algorithms. Sensors 2020, 20, 6980. [Google Scholar] [CrossRef]
  23. Wang, D.; Wang, K.; Wu, J.Z.; Han, P. Progress in Research on Rapid and Non-Destructive Detection of Seed Quality Based on Spectroscopy and Imaging Technology. Spectrosc. Spectr. Anal. 2021, 41, 52–59. [Google Scholar]
  24. Filho, F.H.I.; Pazini, J.D.B.; de Medeiros, A.D.; Rosalen, D.L.; Yamamoto, P.T. Assessment of Injury by Four Major Pests in Soybean Plants Using Hyperspectral Proximal Imaging. Agronomy 2022, 12, 1516. [Google Scholar] [CrossRef]
  25. Qiu, C.R.; Liao, G.P.; Tang, H.Y.; Liu, F.; Liao, X.; Zhang, R.; Zhao, Z. Derivative Parameters of Hyperspectral NDVI and Its Application in the Inversion of Rapeseed Leaf Area Index. Appl. Sci. 2018, 8, 1300. [Google Scholar] [CrossRef]
  26. Mandelbrot, B.B. A Multifractal Walk down Wall Street. Sci. Am. 1999, 298, 70–73. [Google Scholar] [CrossRef]
  27. Peng, C.K.; Buldyrev, S.V.; Havlin, S.; Simons, M.; Stanley, H.E.; Goldberger, A.L. Mosaic organization of DNA sequences. Phys. Rev. E 1994, 49, 1685–1689. [Google Scholar] [CrossRef]
  28. Kantelhardt, J.W.; Zschiegner, S.A.; Koscielny-Bunde, E.; Havlin, S.; Bunde, A.; Stanley, H. Multifractal detrended fluctuation analysis of nonstationary time series. Phys. A 2002, 316, 87–114. [Google Scholar] [CrossRef]
  29. Fan, Q.; Li, D.; Ling, G.; Wang, F.; Liu, S. Effect of filters on multivariate multifractal detrended fluctuation analysis. Fractals 2021, 29, 2150047. [Google Scholar] [CrossRef]
  30. Wang, F.; Liao, G.; Li, J.; Li, X.; Zhou, T. Multifractal detrended fluctuation analysis for clustering structures of electricity price periods. Phys. A 2013, 392, 5723–5734. [Google Scholar] [CrossRef]
  31. Pavlov, A.; Runnova, A.; Maksimenko, V.; Pavlova, O.; Grishina, D.; Hramov, A. Detrended fluctuation analysis of EEG patterns associated with real and imaginary arm movements. Phys. A 2018, 509, 777–782. [Google Scholar] [CrossRef]
  32. Wang, F.; Fan, Q.; Stanley, H. Multiscale multifractal detrended-fluctuation analysis of two-dimensional surfaces. Phys. Rev. E 2016, 93, 042213. [Google Scholar] [CrossRef] [Green Version]
  33. Wang, F.; Fan, Q. Coupling correlation detrended analysis for multiple nonstationary series. Commun. Nonlinear Sci. 2021, 94, 105579. [Google Scholar] [CrossRef]
  34. Li, J.; Li, Q.; Wang, F.; Liu, F. Hyperspectral redundancy detection and modeling with local Hurst exponent. Phys. A 2022, 592, 126830. [Google Scholar] [CrossRef]
  35. Jiang, S.; Wang, F.; Shen, L.; Liao, G.; Wang, L. Extracting sensitive spectrum bands of rapeseed using multiscale multifractal detrended fluctuation analysis. J. Appl. Phys. 2017, 121, 104702. [Google Scholar] [CrossRef]
  36. Wang, X.-Q.; Wang, F.; Liao, G.-P.; Guan, C.-Y. Multifractal Analysis of Rapeseed Spectrum for Chlorophyll Diagnosis Modeling. Spectrosc. Spectr. Anal. 2016, 36, 3657–3663. [Google Scholar]
  37. Liu, F.; Wang, F.; Liao, G.; Lu, X.; Yang, J. Prediction of Oleic Acid Content of Rapeseed Using Hyperspectral Technique. Appl. Sci. 2021, 11, 5726. [Google Scholar] [CrossRef]
  38. Jiang, S.; Wang, F.; Shen, L.; Liao, G. Local detrended fluctuation analysis for spectral red-edge parameters extraction. Nonlinear Dyn. 2018, 93, 995–1008. [Google Scholar] [CrossRef]
  39. Zou, W.; Fang, H.; Zhou, K.Y.; Bao, Y.D.; Yong, H. Identification of rapeseed varieties based on hyperspectral imagery. J. Zhejiang Univ. Agric. Life Sci. 2011, 37, 175–180. [Google Scholar]
  40. Yu, H.; Lv, M.Q.; Liu, L.M.; Yu, G.P.; Zhao, Y.R.; He, Y. Identification of Aphid Infection on Rape Pods Using Hyperspectral Imaging Combined with Image Processing. Spectrosc. Spectr. Anal. 2017, 37, 3193–3197. [Google Scholar]
  41. Li, J.; Liao, G.P.; Ou, Z.; Jing, J. Rapeseed Seeds Classification by Machine Vision. In Proceedings of the Workshop on Intelligent Information Technology Application, Zhangjiajie, China, 2–3 December 2007; IEEE Computer Society: Washington, DC, USA, 2007; pp. 222–226. [Google Scholar]
  42. Li, J.; Liao, G.P.; Xiao, F. Rapeseed seeds colour recognition by machine vision. In Proceedings of the 27th chinese Control Conference, Kunming, China, 16–18 July 2008; IEEE Computer Society: Washington, DC, USA, 2008; pp. 146–149. [Google Scholar]
  43. Zhao, X.; Burks, T.F.; Qin, J.; Ritenour, M.A. Digital microscopic imaging for citrus peel disease classification using color texture features. Appl. Eng. Agric. 2009, 25, 769–776. [Google Scholar] [CrossRef]
  44. Peng, Z.; Lin, S.; Zhang, B.; Wei, Z.; Liu, L.; Han, N.; Cai, J.; Chen, H. Winter Wheat Canopy Water Content Monitoring Based on Spectral Transforms and “Three-edge” Parameters. Agric. Water Manag. 2020, 240, 106306. [Google Scholar] [CrossRef]
  45. Sibanda, M.; Mutanga, O.; Dube, T.; Odindi, J.; Mafongoya, P.L. The Utility of the Upcoming HyspIRI’s Simulated Spectral Settings in Detecting Maize Gray Leafy Spot in Relation to Sentinel-2 MSI, VENµS, and Landsat 8 OLI Sensors. Agronomy 2019, 9, 846. [Google Scholar] [CrossRef]
  46. Wang, F.; Liao, D.-W.; Li, J.-W.; Liao, G.-P. Two-dimensional multifractal detrended fluctuation analysis for plant identification. Plant Methods 2015, 11, 12. [Google Scholar] [CrossRef] [Green Version]
Figure 1. Location of the study area and hyperspectral collection environment. (a) Location of the study area in Changsha of China; (b) satellite map of Hunan Agricultural University Yunyuan Experimental Base (the red box); (c) the aneroid of hyperspectral data acquisition; (d) ROI of rapeseed sample.
Agronomy 12 02350 g001
Figure 2. Flowchart of rapeseed variety identification.
Agronomy 12 02350 g002
Figure 3. Visualization of two tree species in the {MF- h 0 , IMF- S i / I 1 , TRIP- D r m i n } space. (a) Fenglv 1 versus to High Oleic Acid #1; (b) Xiangyou #708 versus to Xiangzayou #518; (c) Youtai #420 versus to Xiangzayou #787; (d) Fenglv #2 versus to Nongda #2.
Agronomy 12 02350 g003
Figure 4. Average AR of every two species with respect to K value based on SVMKM. Error bar is standard deviation of the result of the 55 pairs rapeseed species.
Agronomy 12 02350 g004
Figure 5. Visualization of average features of {MF-h(0), IMF-Si/I1, TRIP- D r m i n } of 11 rapeseed varieties in three-dimensional space.
Agronomy 12 02350 g005
Figure 6. The average AR between two varieties under different feature combinations.
Agronomy 12 02350 g006
Figure 7. The recognition AR with respect to number of features. (a) is the averaged result for every two species with 5-fold cross validation and (b) is for the 11 species with 10-fold cross validation.
Agronomy 12 02350 g007
Figure 8. The average recognition AR of 11 species with respect to increasing numbers of sample in each species. Error bar is the standard deviation of the result under 10 independent realizations.
Agronomy 12 02350 g008
Figure 9. The average recognition AR of 11 species by using three intelligent classifiers. Error bar is the standard deviation of the result under 10 independent realizations.
Agronomy 12 02350 g009
Table 1. Color feature indexes.
IdFeatureIdFeatureIdFeatureIdFeatureIdFeature
F01RF21DiffF41G/YF61DGCI/YF81(R − B)/(R + G + B)
F02GF22G-RF42G/VF62DGCI/VF82(G − B)/(R + G + B)
F03BF23G-BF43G/I1F63DGCI/I1F83R/AVG(R + G + B)
F04RF24R-BF44G/L*F64DGCI/L*F84G/AVG(R + G + B)
F05GF25g-rF45g/LF65a*/L*F85B/AVG(R + G + B)
F06bF26g-bF46g/YF66b*/L*F86Hv*Diff
F07YF27r-bF47g/VF67a*/b*F87Hi*Diff
F08LF282G-R-BF48g/I1F68R/(G + B)F88Si*I1
F09DGCIF292g-r-bF49g/L*F69G/(G + B)F89r/(g + b)
F10HvF30MinF50(2G-R-B)/LF70B/(R + G)F90g/(r + b)
F11SvF31G/RF51(2G-R-B)/YF71(G − R)/BF91b/(r + g)
F12VF32R/BF52(2G-R-B)/VF72(R − B)/GF92(g − r)/(g + r)
F13HiF33G/BF53(2G-R-B)/I1F73(R − B)/RF93(g − b)/(g + b)
F14SiF34g/rF54(2G-R-B)/L*I74(G − R)/(G + R)F94(r − b)/(r + b)
F15I1F35r/bF55(2g-r-b)/LF75(G − B)/(R + B)F95DGCV
F16I2F36g/bF56(2g-r-b)/YF76(G − B)/(G + B)F96B − Y
F17I3F37Hi/I1F57(2g-r-b)/VF77(G − B)/(G − R)F97R − Y
F18L*F38Si/I1F58(2g-r-b)/I1F78(g − b)/(r − b)F98G − Y
F19a*F39Hi/SiF59(2g-r-b)/L*F79(g − b)/(g − r)
F20b*F40G/LF60DGCI/LF80(G − R)/(R + G + B)
Table 2. The calculation formula of hyperspectral trilateral characteristic parameters.
NameDescription or Calculation
TRIP- D b The spectral maximum value of first derivative in 490~530 nm (blue edge)
TRIP- B e p The bands corresponding to the maximum value of first derivative in 490~530 nm
TRIP- S D b Integration of first derivative in the range of 490~530 nm
TRIP- D b m i n The minimum value of first derivative in 490~530 nm
TRIP- N DBENormalized blue-edge index: ( D b D b m i n ) / D b + D b m i n
TRIP- D y The spectral maximum value of first derivative in 560~640 nm (yellow edge)
TRIP- Y e p The bands corresponding to the maximum value of first derivative in 560~640 nm
TRIP- S D y Integration of first derivative spectrum in the range of 560~640 nm
TRIP- D y m i n The minimum value of first derivative spectrum in 560~640 nm
TRIP- N DYENormalized yellow-edge index: ( D y D y m i n ) / D y + D y m i n
TRIP- D r The spectral maximum value of first derivative in 680~760 nm (red edge)
TRIP- R e p The bands corresponding to the maximum value of first derivative in 680~760 nm
TRIP- S D r Integration of the first derivative in the range of 680~760 nm
TRIP- D r m i n The minimum value of first derivative in 680~760 nm
TRIP- N DRE Normalized red-edge index: ( D r D r m i n ) / D r + D r m i n
TRIP-RB S D r / S D b
TRIP-RY S D r / S D y
TRIP-YB S D y / S D b
TRIP-NRB S D r S D b / S D r + S D b
TRIP-NRY S D r S D y / S D r + S D y
TRIP-NBY S D b S D y / S D b + S D y
TRIP-KurKurtosis of the first derivative curve of the red edge
TRIP-SkeSkewness of the first derivative curve of the red edge
Table 3. The identification result of 11 rapeseeds species by SVMKM with K = 10.
Species
280110000000
028000000101
002800100001
110260000101
000029010000
000102800010
000001280010
000001128000
000000112800
011000000280
001010000028
Publisher’s Note: MDPI stays neutral with regard to jurisdictional claims in published maps and institutional affiliations.

