Article

Improvement of Wheat Growth Information by Fusing UAV Visible and Thermal Infrared Images

1
National Engineering Research Center for Analysis and Application of Agro-Ecological Big Data, Anhui University, Hefei 230601, China
2
Zhejiang Academy of Agricultural Sciences, Hangzhou 310021, China
3
National Engineering Research Center for Information Technology in Agriculture, Beijing 100089, China
*
Author to whom correspondence should be addressed.
Agronomy 2022, 12(9), 2087; https://doi.org/10.3390/agronomy12092087
Submission received: 15 July 2022 / Revised: 25 August 2022 / Accepted: 30 August 2022 / Published: 1 September 2022

Abstract

:
To improve and enrich the wheat growth information, visible and thermal infrared (TIR) remote sensing images were simultaneously acquired by an unmanned aerial vehicle (UAV). A novel algorithm was proposed for fusing the visible and TIR images combing the intensity hue saturation (IHS) transform and regional variance matching (RVM). After registering the two images, IHS transform was first conducted to derive the Intensities of two images. Wavelet transform was then applied to the Intensities for obtaining the coefficients of low- and high-frequency sub-bands. The fusion rules of the fused image were developed based on regional correlation of wavelet decomposition coefficients. More specifically, the coefficients of low-frequency sub-bands were calculated by averaging the coefficients of two images. Regional variance was used to generate the coefficients of high-frequency sub-bands using the weighted template of a 3 × 3 pixel window. The inverse wavelet transform was used to create the new Intensity for the fused image using the low- and high-frequency coefficients. Finally, the inverse IHS transform consisting of the new Intensity, the Hue of visible image, and the Saturation of TIR image was adopted to change the IHS space to red–green–blue (RGB) color space. The fusion effects were validated by the visible and TIR images of winter wheat at the jointing stage and the middle and late grain-filling stage. Meanwhile, IHS and RV were also comparatively evaluated for validating our proposed method. The proposed algorithm can fully consider the correlation of wavelet coefficients in local regions. It overcomes the shortcomings (e.g., block phenomenon, color distortion) of traditional image fusion methods to obtain smooth, detailed and high-resolution images.

1. Introduction

The development of imaging sensor technology has greatly facilitated the implementation of object detection, object recognition, feature extraction, image classification, etc. [1,2,3,4]. Various images are generally produced to adapt to particular applications by the corresponding sensors. Nevertheless, a complete representation of an application scene cannot be produced via a single sensor, due to the constraint of used electromagnetic spectrum. For example, a high definition (HD) digital photograph can provide successive color contrast and detailed texture characteristics for visual perception. It cannot be used to distinguish and identify a target when having the same color and spatial characteristics as its background [5]. Conversely, the thermal infrared (TIR) image can identify the target by comparing the temperature responses with the background. A single composite image can be generated through image fusion that combines information from two or more images of a scene [6,7]. The resulting image can have the best features of each of its components, better than any individual image without significantly reducing the amount of relevant information.
The rapid development of operational Earth observation satellites has provided us the availability of multi-resolution images with various tempo-spatial features. A satellite-based sensor is usually assigned to different portions of the electromagnetic spectrum. The capability of identifying more fine and potential features of targets is greatly reduced from the single sensor data alone. Conversely, fused images may provide increased interpretation capabilities by combining eminent features from different types of sensors [8]. Over the past decades, various fusion methods have been proposed to adapt to specific application requirements concerning multi-source and multi-scale remote sensing (RS) images.
As a branch of image fusion, a great deal of attention has been paid to RS image fusion [9,10]. The principal component analysis (PCA), intensity hue saturation (IHS) transform, Brovey transform (BT), arithmetic combinations and wavelet base fusion are the most commonly used fusion methods in the RS community [11,12]. In addition to exploring the mechanism of image fusion, some methods are proposed to focus specifically on particular applications. For example, optical and radar RS data were fused to map and monitor land cover by jointly utilizing their respective spectral and structural information [13]. Landslide inventories were investigated by the synergistic use of medium resolution, multitemporal Satellite pour l’Observation de la Terre (SPOT) XS, and fine resolution IKONOS images [14]. Hyperspectral and light detection and ranging (LIDAR) data were jointly adopted for the classification of complex forest areas [15]. To summarize, we can conclude that three types of fusion approaches including pansharpening [16,17,18], optical and radar data fusion [19,20] and hyperspectral and radar data fusion [21,22] were primarily proposed in previous studies.
In comparison with the airborne and spaceborne remotely sensed imagery, the emergence of unmanned aerial vehicles (UAVs) has greatly improved the convenience and availability for acquiring various types of RS images. A UAV can simultaneously collect multi-source images of the same scene at a time by mounting multiple sensors [23]. Corresponding fusion algorithms are well-suited to be tested and validated compared to satellite remotely sensed imagery. In general, visible RGB (red-green-blue bands) and near-infrared (NIR) imagery have been most commonly acquired to evaluate the targets from an octocopter or a fixed-wing UAV platform [24]. For example, multiple cameras including multispectral, RGB and NIR bands were used to develop an automatic OBIA (object-based-image-analysis) procedure for early monitoring of a grass weed [25]. In addition, hyperspectral [26] and thermal sensors [27] have been also boarded along with the above sensors. For example, a novel miniaturized hyperspectral frame imaging sensor (500–900 nm) was used to identify mature Norway spruce (Picea abies [L.] Karst.) trees suffering from infestation [28]. We can find that spectral, spatial, color and polarization information are the highly-available fusion features in most of the previous studies. Conversely, as an important feature parameter, temperature is extremely useful and effective in the early detection or diagnosis of temperature-related plant stresses [29,30]. It is rarely merged in target recognition and detection. Consequently, fusion methods concerning thermal information are highly needed to be proposed to adapt to the miniaturized UAV platforms.
A visible image can provide more spatial details for visual perception, while a TIR image can provide the specific temperature responses particular to a target, even when it has similar color and spatial details to those of its background. It is of great importance to merge them for forming a highly informative image in precision crop management. Commonly used fusion methods are based on regional features, so the block phenomenon and color distortion are generally introduced. A novel fusion method was proposed by combining IHS transform and wavelet transform. The UAV-based HD digital photographs and TIR images of wheat at two growth stages were used to validate the method. The highlights for this study can be summarized into four aspects: (1) When obtaining the intensity components of visible and TIR images by the IHS transform, the wavelet transform (WT) was then used to decompose the original input into high-frequency (HF) and low-frequency (LF) coefficients. (2) The regional energy-based weight selection rule was introduced to determine the LF coefficients. (3) The correlation between the central pixel and its surrounding pixels was adopted to obtain the HF coefficients. (4) The inverse WT was adopted to obtain and new intensity component and the IHS inverse transform was used to fuse the new intensity, hue of visible image and saturation component of TIR image to form a new image.

2. Materials and Methods

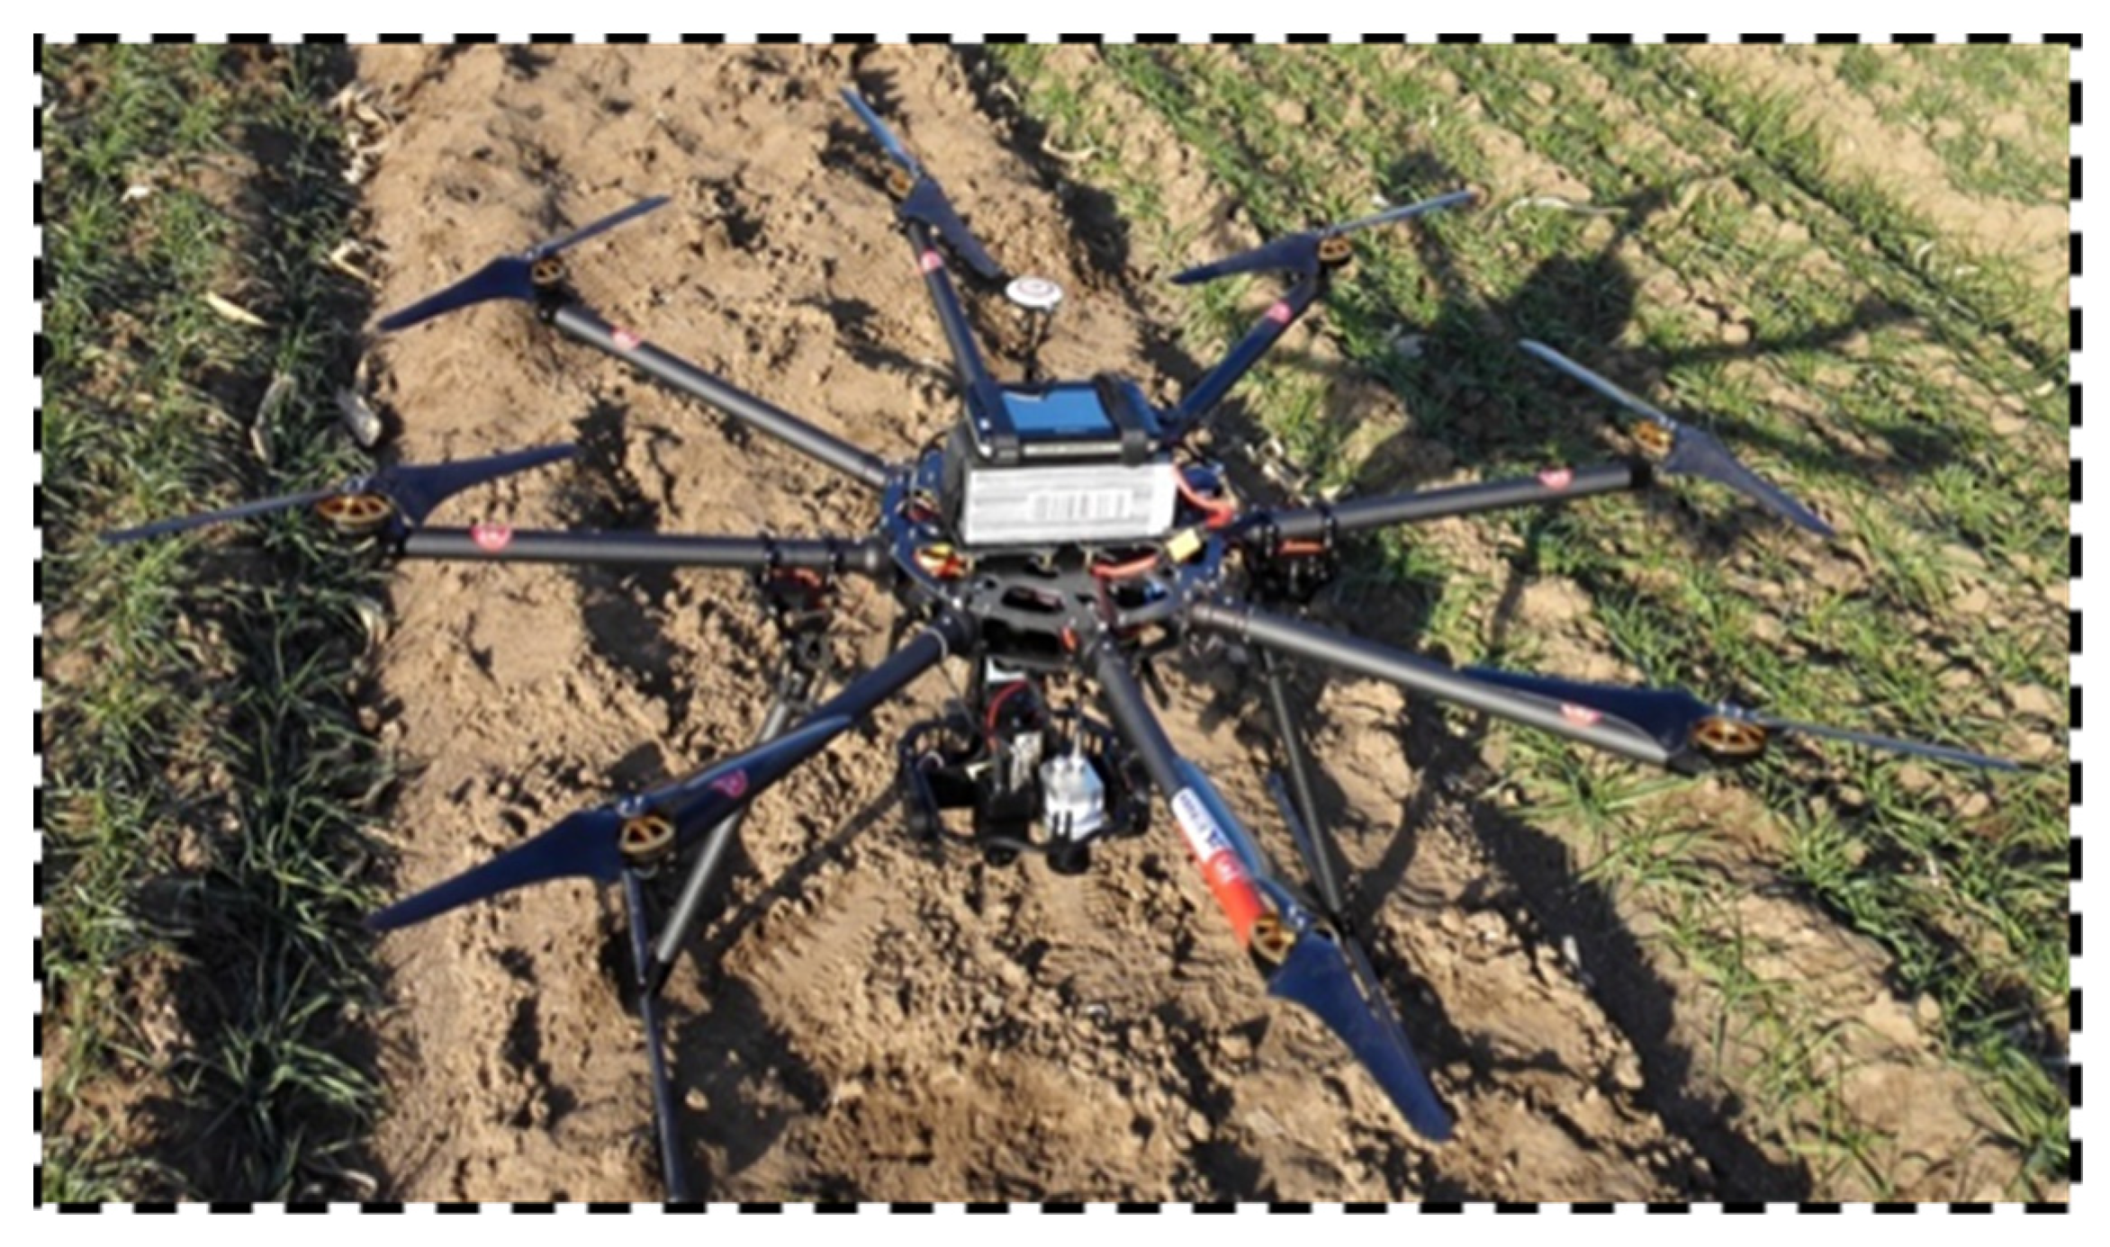
2.1. Acquisition of Experimental Data

The visible and TIR RS images were collected at the Branch of National Wheat Improvement Center, Yangzhou, Jiangsu, China. The study area has a leading research and development platform for wheat molecular breeding. It can provide us good experimental sites for collecting high-quality UAV images of wheat at different growth stages. A miniaturized eight-rotor electricity-driven UAV was selected to simultaneously deploy the HD DSC-QX100 digital camera (Sony, Tokyo, Japan, 5472 × 3648 pixels) and the optris PI thermal imaging camera (Optris GmbH, Berlin, Germany) with a resolution of 0.05 K (Figure 1). The UAV can have a load of about 6 kg with the endurance time of 20 min and a flight altitude of 50 m.
The UAV images and ground-truth data were simultaneously obtained during the jointing stage (Stage I) in March 2016, and the middle and late grain-filling stage (Stage II) in May 2016. The UAV was deployed from 10 a.m. to 2 p.m. when the weather was clear. In addition, to validate the temperature data acquired by the UAV, the OptriS PI imaging system was used to measure the background information such as the reflectance of the sky, the black and white calibration cloths, a cement floor, water bodies and wheat canopies. The self-developed image data processing software AgriHawk (Beijing Research Center for Information Technology in Agriculture, Beijing, China) UAV was used to produce the high-resolution digital orthophotos.

2.2. Indicators for Describing Remotely Sensed Images

A RS image can be produced by various sensors boarded on different types of platforms. To evaluate the imaging quality, some regular indicators are usually used, including regional median (Med), energy (E), mean (Mea) and variance (G(p)) [31]. For an image, the four indicators at the coordinate (n, m) are calculated as follows:
M e d ( n , m ) = M e d i a n [ ( n + n , m + m ) ]
E = n J , m K [ G ( n + n , m + m ) ] 2
where J and K represent the area covered by a moving window (e.g., 3 × 3, 5 × 5, 7 × 7.), and the values of n* and m* are located within the range of J and K.
M e a ( n , m ) = E ( n , m ) / N
where N is the total pixels in the specified window.
G(p) is defined as the weighted variance of the wavelet coefficients in the region Q centered on point p(m, n). Suppose that C(A) is the wavelet coefficient matrix of a RS image A. C(A, p) is the wavelet coefficient of point p for A, and the G(A, p) can be calculated as follows:
G ( A , p ) = p Q w ( p ) | C ( A , p )   u ¯ ( A , p ) | 2
where u ¯ ( A , p ) is the average of the coefficients in the region Q and w(p) is the weight.
In our study, the weighted sum of the Gaussian functions of rows and columns of the coefficient matrix was used as the weighted coefficient. Obviously, the closer away from point p, w is larger; otherwise, it is smaller.
w ( p ) = 1 2 { exp [ ( m p 1 ) 2 2 σ 2 ] + exp [ ( n p 2 ) 2 2 σ 2 ] }
where (p1, p2) are the coordinates of the point p in the region Q and σ is the variance of p.

2.3. Regional Variance Matching (RVM)

RVM is one of the moving window-based fusion strategies that can effectively reduce the preprocessing requirements of fused images [32,33]. Firstly, the edge information of source images needs to be extracted for establishing the appropriate fusion strategy. Using the regional variance based on wavelet transform, a RS image is decomposed to obtain LF and HF sub-images. Then, the HF image is divided into a series of small regions, and the variance matching degree (VMD) of each small region is calculated by a pixel-based moving window. The VMD is a measure of regional contrast for an image. It can better characterize the detailed information of remote sensing images. It requires the selection of a window size, and the 3 × 3 window has the best performance and was adopted in this study.
To measure the regional variance matching degree (RVMD) of coefficient matrix at the point p between two RS images A and B, the matching matrix MA,B(p) is defined as follows:
M A , B ( p ) = 2 × p Q w ( p ) | C ( A , p ) u ¯ ( A , p ) | | C ( B , p ) u ¯ ( B , p ) | G ( A , p ) + G ( B , p )
MA,B(p) ranges from 0 to 1. When the wavelet coefficients of A and B at point p are closer, the value of MA,B(p) approaches to 1.

2.4. Wavelet Transform and IHS Transform

WT can be used to divide an image into LF contour images and HF detail images [34,35]. It has some obvious advantages such as zooming property, information maintenance and various wavelet bases. In general, for remote sensing image fusion, the WT is carried out in the high-resolution image to acquire corresponding LF and HF images. The LF components were then substituted by those which are derived from the low-resolution image. After the transformed coefficients in approximation and detail images (sub-band images) are processed by fusion operators, the inverse WT is adopted to produce the fused image.
IHS transform is used to obtain the intensity (I), hue (H) and saturation (S) components of an image. It offers the advantage that the separate channels outline certain color properties of original image [36]. Traditional methods are used to perform the fusion based on regional features, but they make the fused images prone to block phenomenon [37,38]. As a contrast, IHS-like image fusion methods can solve this problem well, but they are prone to color distortion. There are generally four steps to perform the IHS fusion between a RGB image and a panchromatic (PAN) image: (1) Transform the RGB channels to three components of I, H and S. (2) Match the histogram of PAN image with the I component. (3) Replace the I component with the stretched PAN image. (4) Apply the IHS inverse transform to obtain the RGB channels for generating a fused image.

2.5. Our Proposed Method

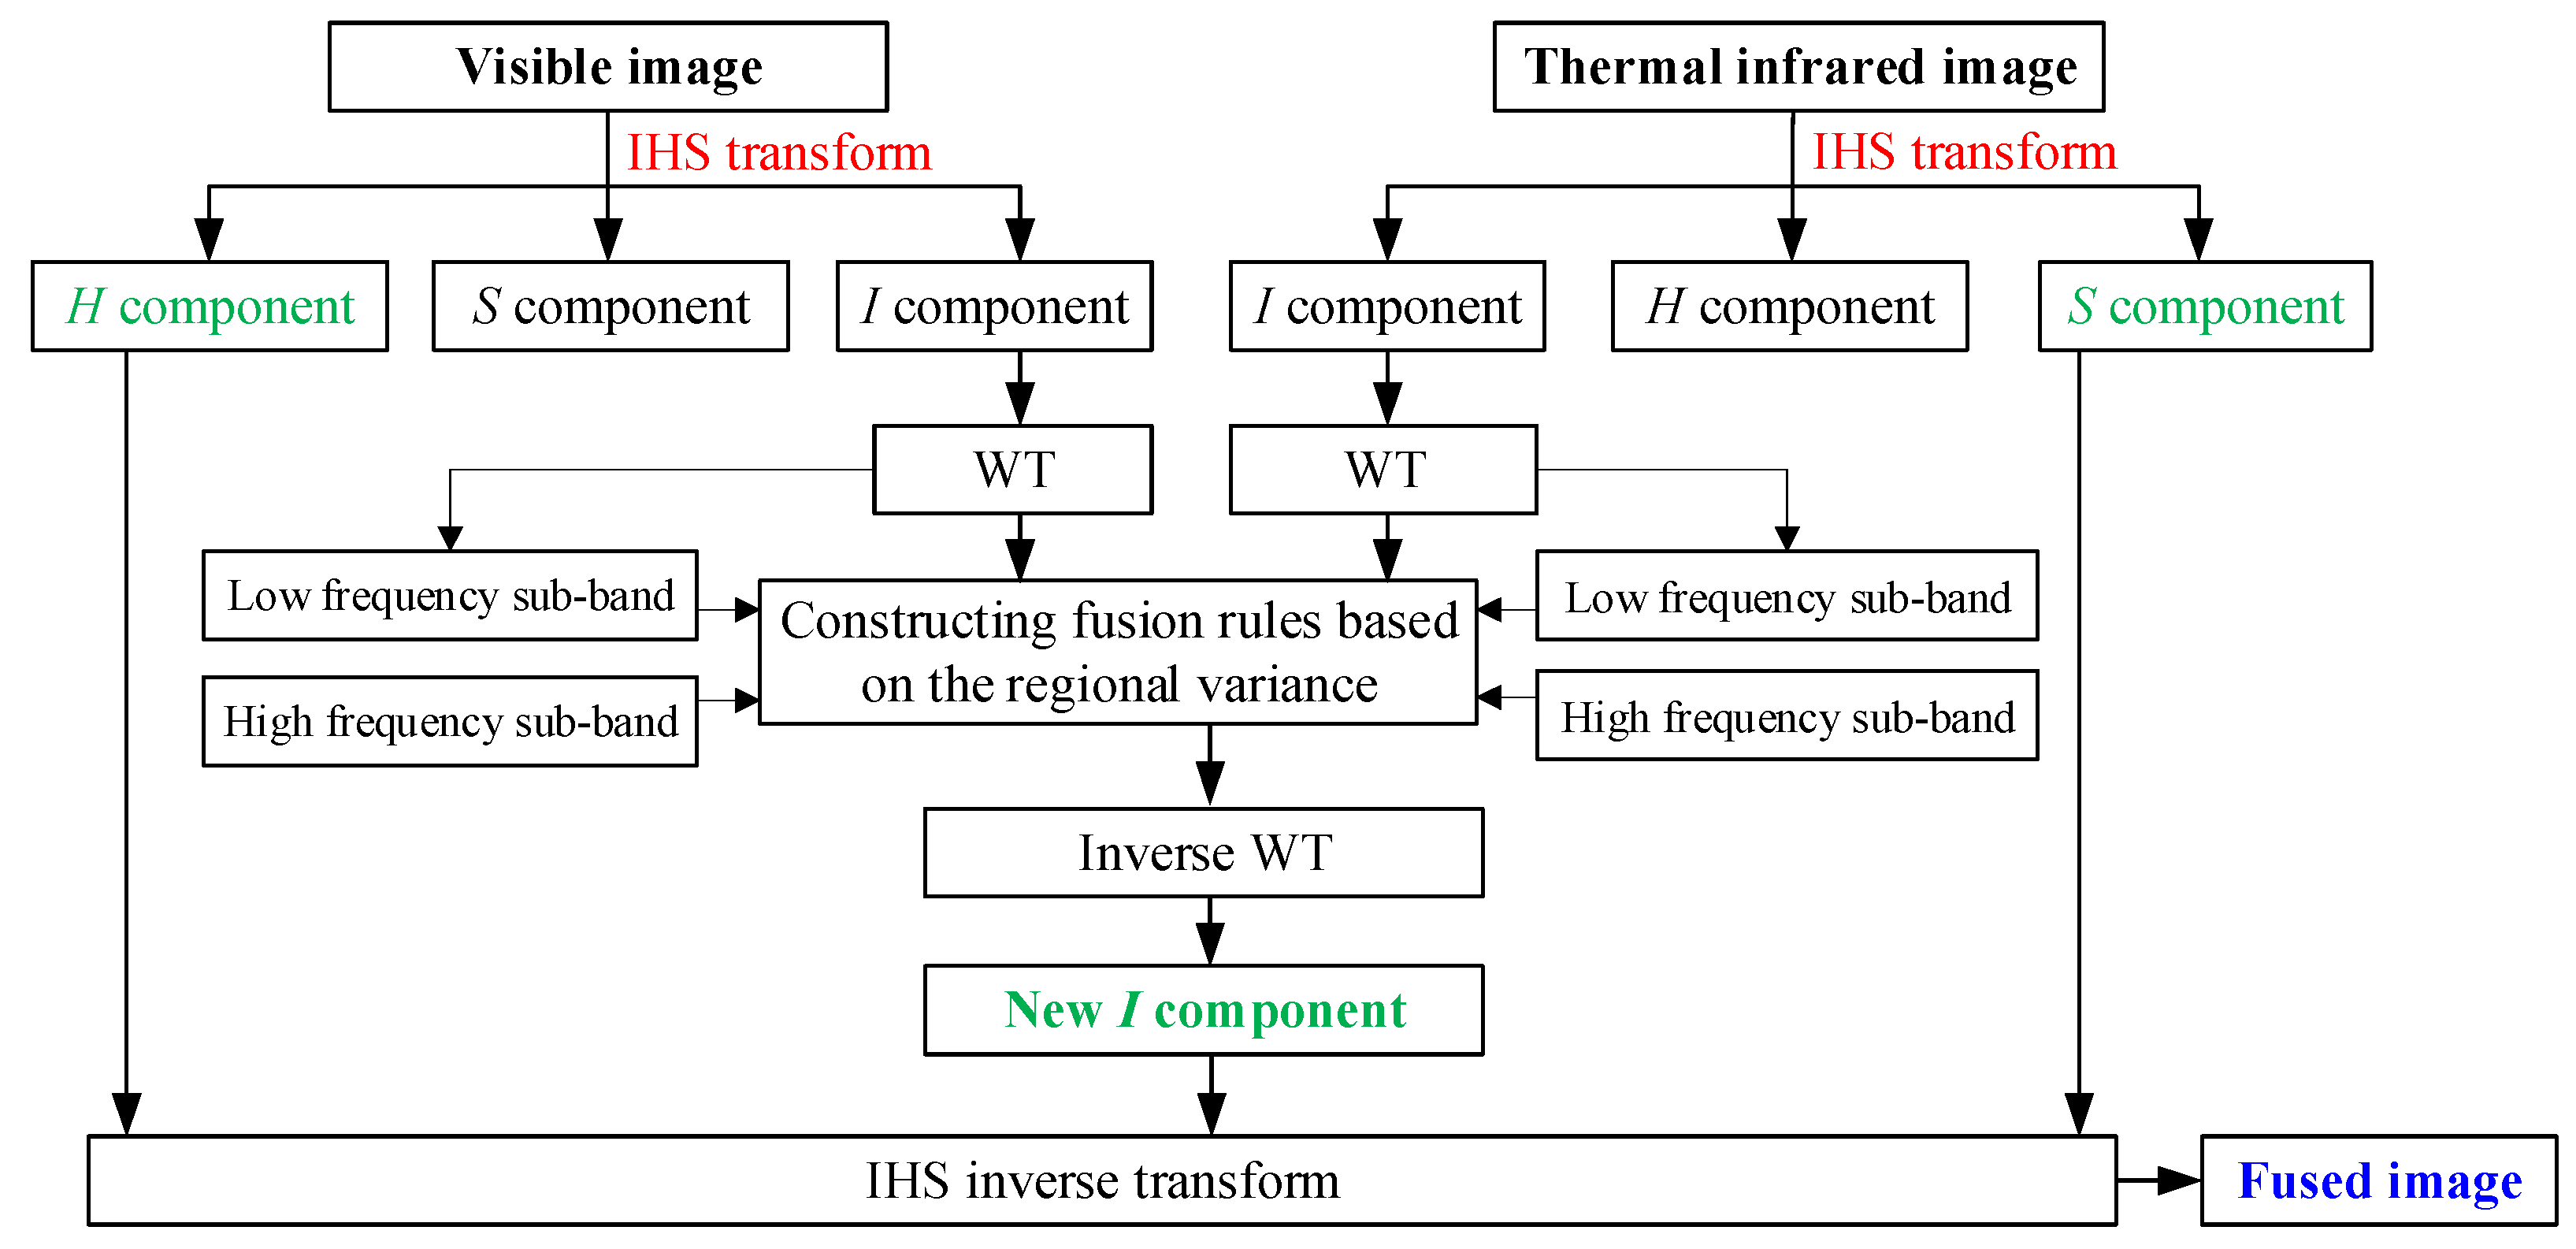
2.5.1. The General Workflow

To overcome the deficiencies of traditional IHS and IHS-like fusion techniques, we propose an integral fusion method (hereafter referred to as IHS-RVM) concerning the visible and TIR images. The specific steps are shown as follows (Figure 2):
(a)
After registering both the visible and TIR images, they are respectively transformed from RGB space to IHS space.
(b)
The I components of the visible and TIR images are decomposed into four layers: wavelet, base, selects and sym4.
(c)
The average values of LF components of the two sets of wavelet coefficients for the I components are calculated.
(d)
The regional variance of HF coefficients of the visible and TIR images are calculated.
(e)
The fusion rules are constructed based on the regional variance to perform the inverse WT and obtain the new I component.
(f)
The IHS inverse transform is used to fuse the visible and TIR images through the new I component, H component of visible image and S component of TIR image.

2.5.2. Determination of Fusion Rules for LF and HF Sub-Bands

After applying the WT to the I components of both the images, respectively, the coefficients of LF and HF sub-bands are chosen according to the fusion rules of RVMD.
(1)
Fusion Rule for LF Sub-band
The LF sub-bands of remote sensing images mainly represent the contours. It focuses on the main energy and reflect the approximate and average characteristics. The weighted average is generally applied to low frequency sub-bands for image fusion. Considering the current applications of RS technology in precision agriculture, various heterogeneous objects (e.g., crop, soil, shadow) exist in the landscape, which increases the difficulties to extract objectives [39]. When the vegetation coverage is low, such as at the jointing stage, the amount of information of vegetation in the RS image is small. Therefore, it is necessary to enhance the contour of the whole image to highlight the characteristics of target crops. Three steps are required to obtain the coefficients of LF sub-bands: (i) Select the coefficients of source image A (IA); (ii) select the coefficients of source image B (IB), and (iii) calculate the average values of A and B. In our study, the I component (IF) of the fused image was derived from the weighted average of the I components and IA and IB [40].
I F = ( I A + I B ) / 2
(2)
Fusion Rule for HF Sub-band
Regional features of a RS image mainly include the gradient, regional energy, regional variance, etc. [41]. In our study, the fusion rule of the I component for HF sub-band of was proposed based on the RVMD. The RVMD gives full consideration to the regional characteristics of RS images, i.e., the correlation between pixels and the neighborhood pixel. It can overcome the irrationality and one-sidedness of the fusion rule based on a single pixel, reflecting the regional characteristics of RS images. The region generally selects an odd number of windows, such as 3 × 3, 5 × 5, 7 × 7. The value of 3 × 3 was selected here for the weighted template P. The new I component was obtained using the RVMD with the threshold value of 0.5 [42]. The weighted template P was used to move up, down, left and right to calculate the RVMD in the corresponding regional window. The RS images are fused using the following fusion rules.
P = [ 1 1 1 1 1 1 1 1 1 ]
G ( A , p ) = p Q w ( p ) | C ( A , p ) u ¯ ( A , p ) | 2
where G(A, p) and u ¯ ( A , p ) is respectively the regional variance significance of the coefficient and the coefficient mean at the center p within the region Q in the wavelet coefficient matrix G(A) of visible image A, and C(A, p) is the coefficient value at the coordinate (m, n) in the wavelet coefficient matrix. Similarly, G(B, p) of the TIR image can be also calculated.
w ( p ) = 1 2 { exp [ ( m p 1 ) 2 2 σ 2 ] + exp [ ( n p 2 ) 2 2 σ 2 ] }
where w(p) is the mean of weighted variance, (p1, p2) are the coordinates of point p within the region Q, and the value of σ is 1.0 here.
M A , B ( p ) = 2 p Q w ( p ) | C ( A , p ) u ¯ ( A , p ) | | C ( B , p ) u ¯ ( B , p ) | G ( A , p ) + G ( B , p )
where MA,B(p) is the RVMD of HF wavelet coefficients for the I components of visible and TIR images using the template P.

2.6. Indicators to Evaluate the Fusion Effect

2.6.1. Visual Interpretation

Visual observation is usually used to visually validate and evaluate the fusion methods, which is derived directly from the human naked eyes due to its simple and intuitive characteristics [43,44,45]. The fusion effect can be quickly assessed by visual observation. The differences about texture, brightness and sharpness in the fused image can be used to assess spectral distortion, edge matching, spatial resolution, color difference, consistency of texture, etc. For example, visual observation can be used to determine whether the registration of fused images is accurate. It can figure out whether the texture and color information are consistent or not, and the overall color is consistent with the natural color or not through the fused image. This method will also give us the information on the overall brightness, contrast and sharpness of the fused image. Since human vision is not sensitive enough to the minor changes to spectral and spatial details, the visual quality strongly depends on the observers. Such a method, however, is incapable in some quantitative applications. It is highly necessary to combine the visual assessment with quantitative evaluation criteria.

2.6.2. Quantitative Indicators

(1)
Entropy
Entropy (E) proposed by Shannon in 1948 is a significant factor to measure the information richness for an image [46]. It has been widely used in the evaluation of image quality [47]. It indicates that how much information is contained in the image. For an image, it can be considered that the grey value of each pixel is independent of each other. The amount of information will be changed before and after fusion, and the E can be used to evaluate the changes in the fusion process. The definition and formation of E for a certain image can be expressed as follows:
E = i = 0 L 1 p i log 2 p i
where i is all the possible samples in the probability space, L is the maximum pixel value and pi is the probability of i within the range of [0, L−1].
(2)
Standard deviation
In comparison with the mean, the standard deviation (SD) reflects the discrete degree of the grey levels for an image. In addition, it can be also used to evaluate the image-contrast size [48]. A larger SD represents more dispersed distribution of grey levels and higher contrast. The formula is:
S D = i = 1 M j = 1 N ( Z ( x i , y j ) z ) 2 M × N
where M and N are the numbers of row and column, respectively, of image Z, and Z(xi, yj) is the grey value of the pixel at the position (xi, yj).
(3)
Average gradient
Average gradient (G) can sensitively reflect the ability of the image to discriminate different objects [49]. It can also reflect the minor differences for the contrast and texture features. The larger the value, the greater the number of image levels and the clearer the image. Its formula is as follows:
G = 1 ( M 1 ) ( N 1 ) i = 1 M 1 j = 1 N 1 ( ( z ( x i , y j ) x i ) ) 2 + ( ( z ( x i , y j ) y i ) ) 2 2
where (xi, yi) are the coordinates of the pixel i, M × N refers to the size of an image, and z ( x i , y j ) x i and z ( x i , y j ) y i respectively show the horizontal and vertical gradient.
(4)
Correlation coefficient
Correlation coefficient (r) can reflect the correlation degree between pre- and post-fused images [50]. By comparing the value changes, we can see the change degree of spectral and spatial information. The larger the correlation coefficient, the smaller the change degree. It is defined as follows:
r = M N ( A M N A ¯ ) 2 ( B M N B ¯ ) 2 ( M N ( A M N A ¯ ) 2 ) ( M N ( B M N B ¯ ) 2 )
where M × N refers to the size of original image AMN and fused image BMN, A ¯ denotes the mean of AMN and B ¯ is the mean of BMN.
(5)
Deviation index
Deviation index (Dindex) is used to compare the deviation degree between the fused image and the original image [51]. It is defined as:
D i n d e x = 1 M × N x = 1 M y = 1 N | f ( x , y ) r ( x , y ) | f ( x , y )
where f(x, y) and r(x, y) is respectively the grey value of original image and fused image of the pixel at (x, y), and M × N refers to the size of original and fused image.

3. Results and Discussion

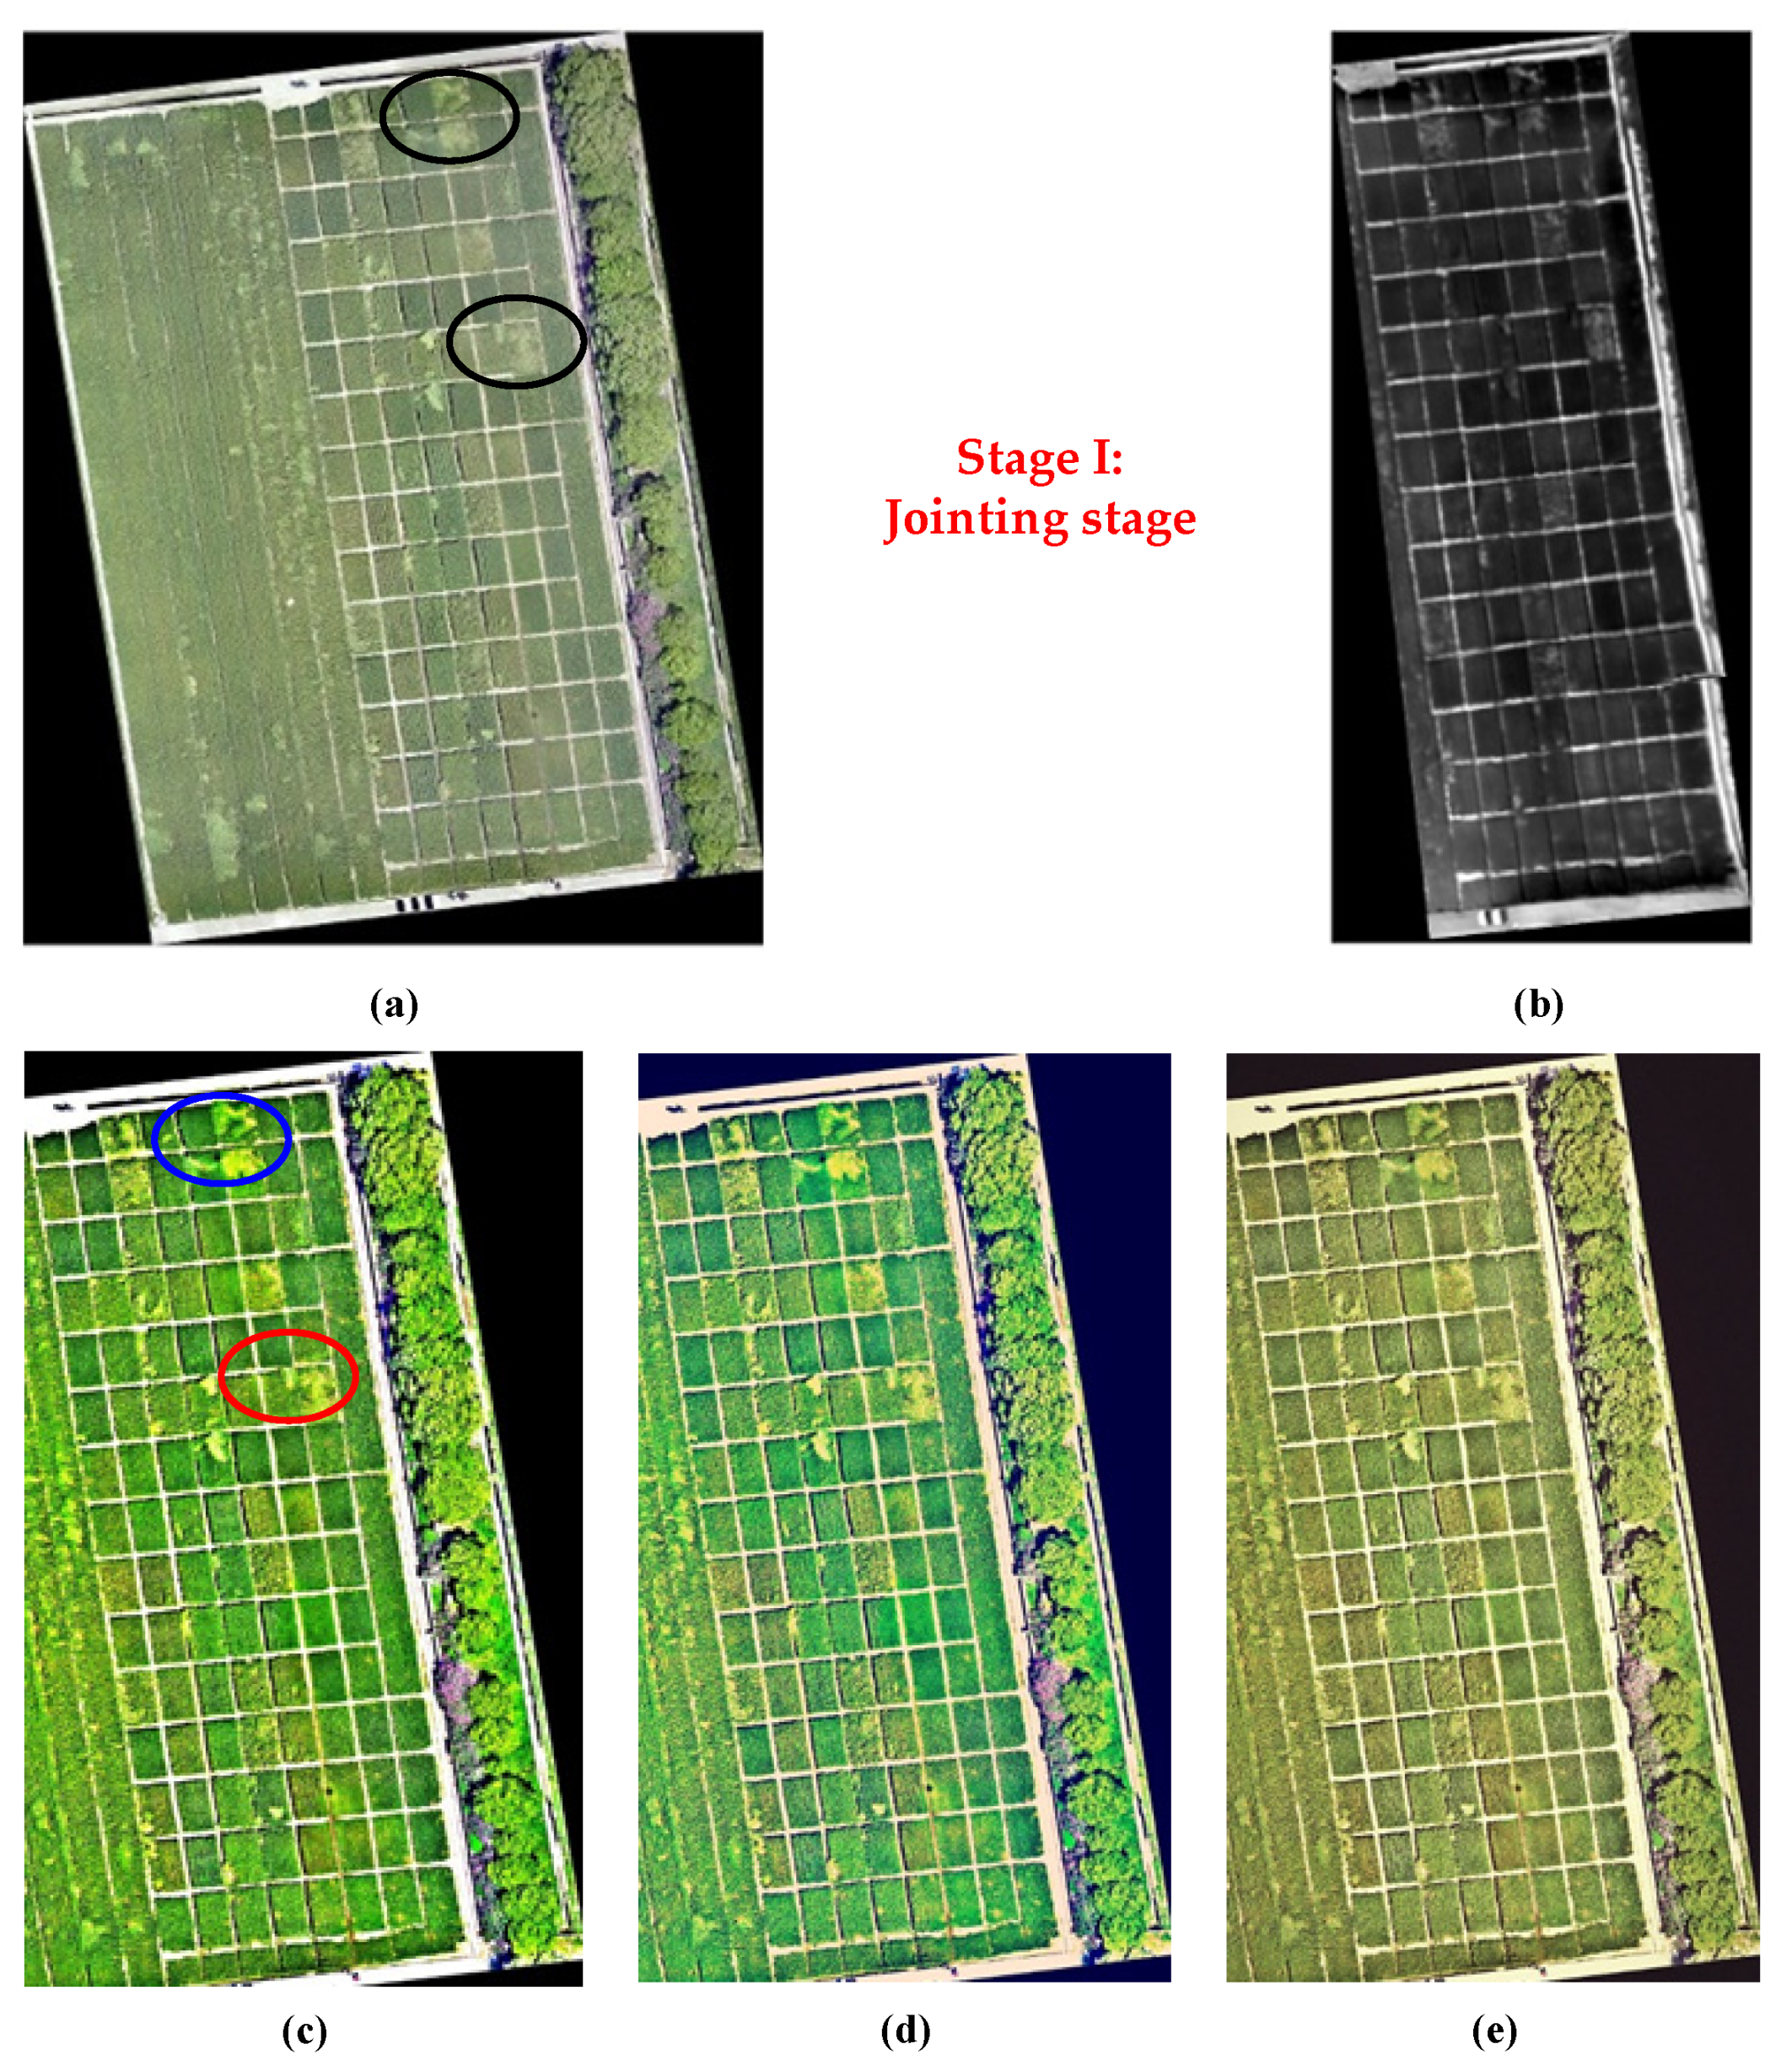
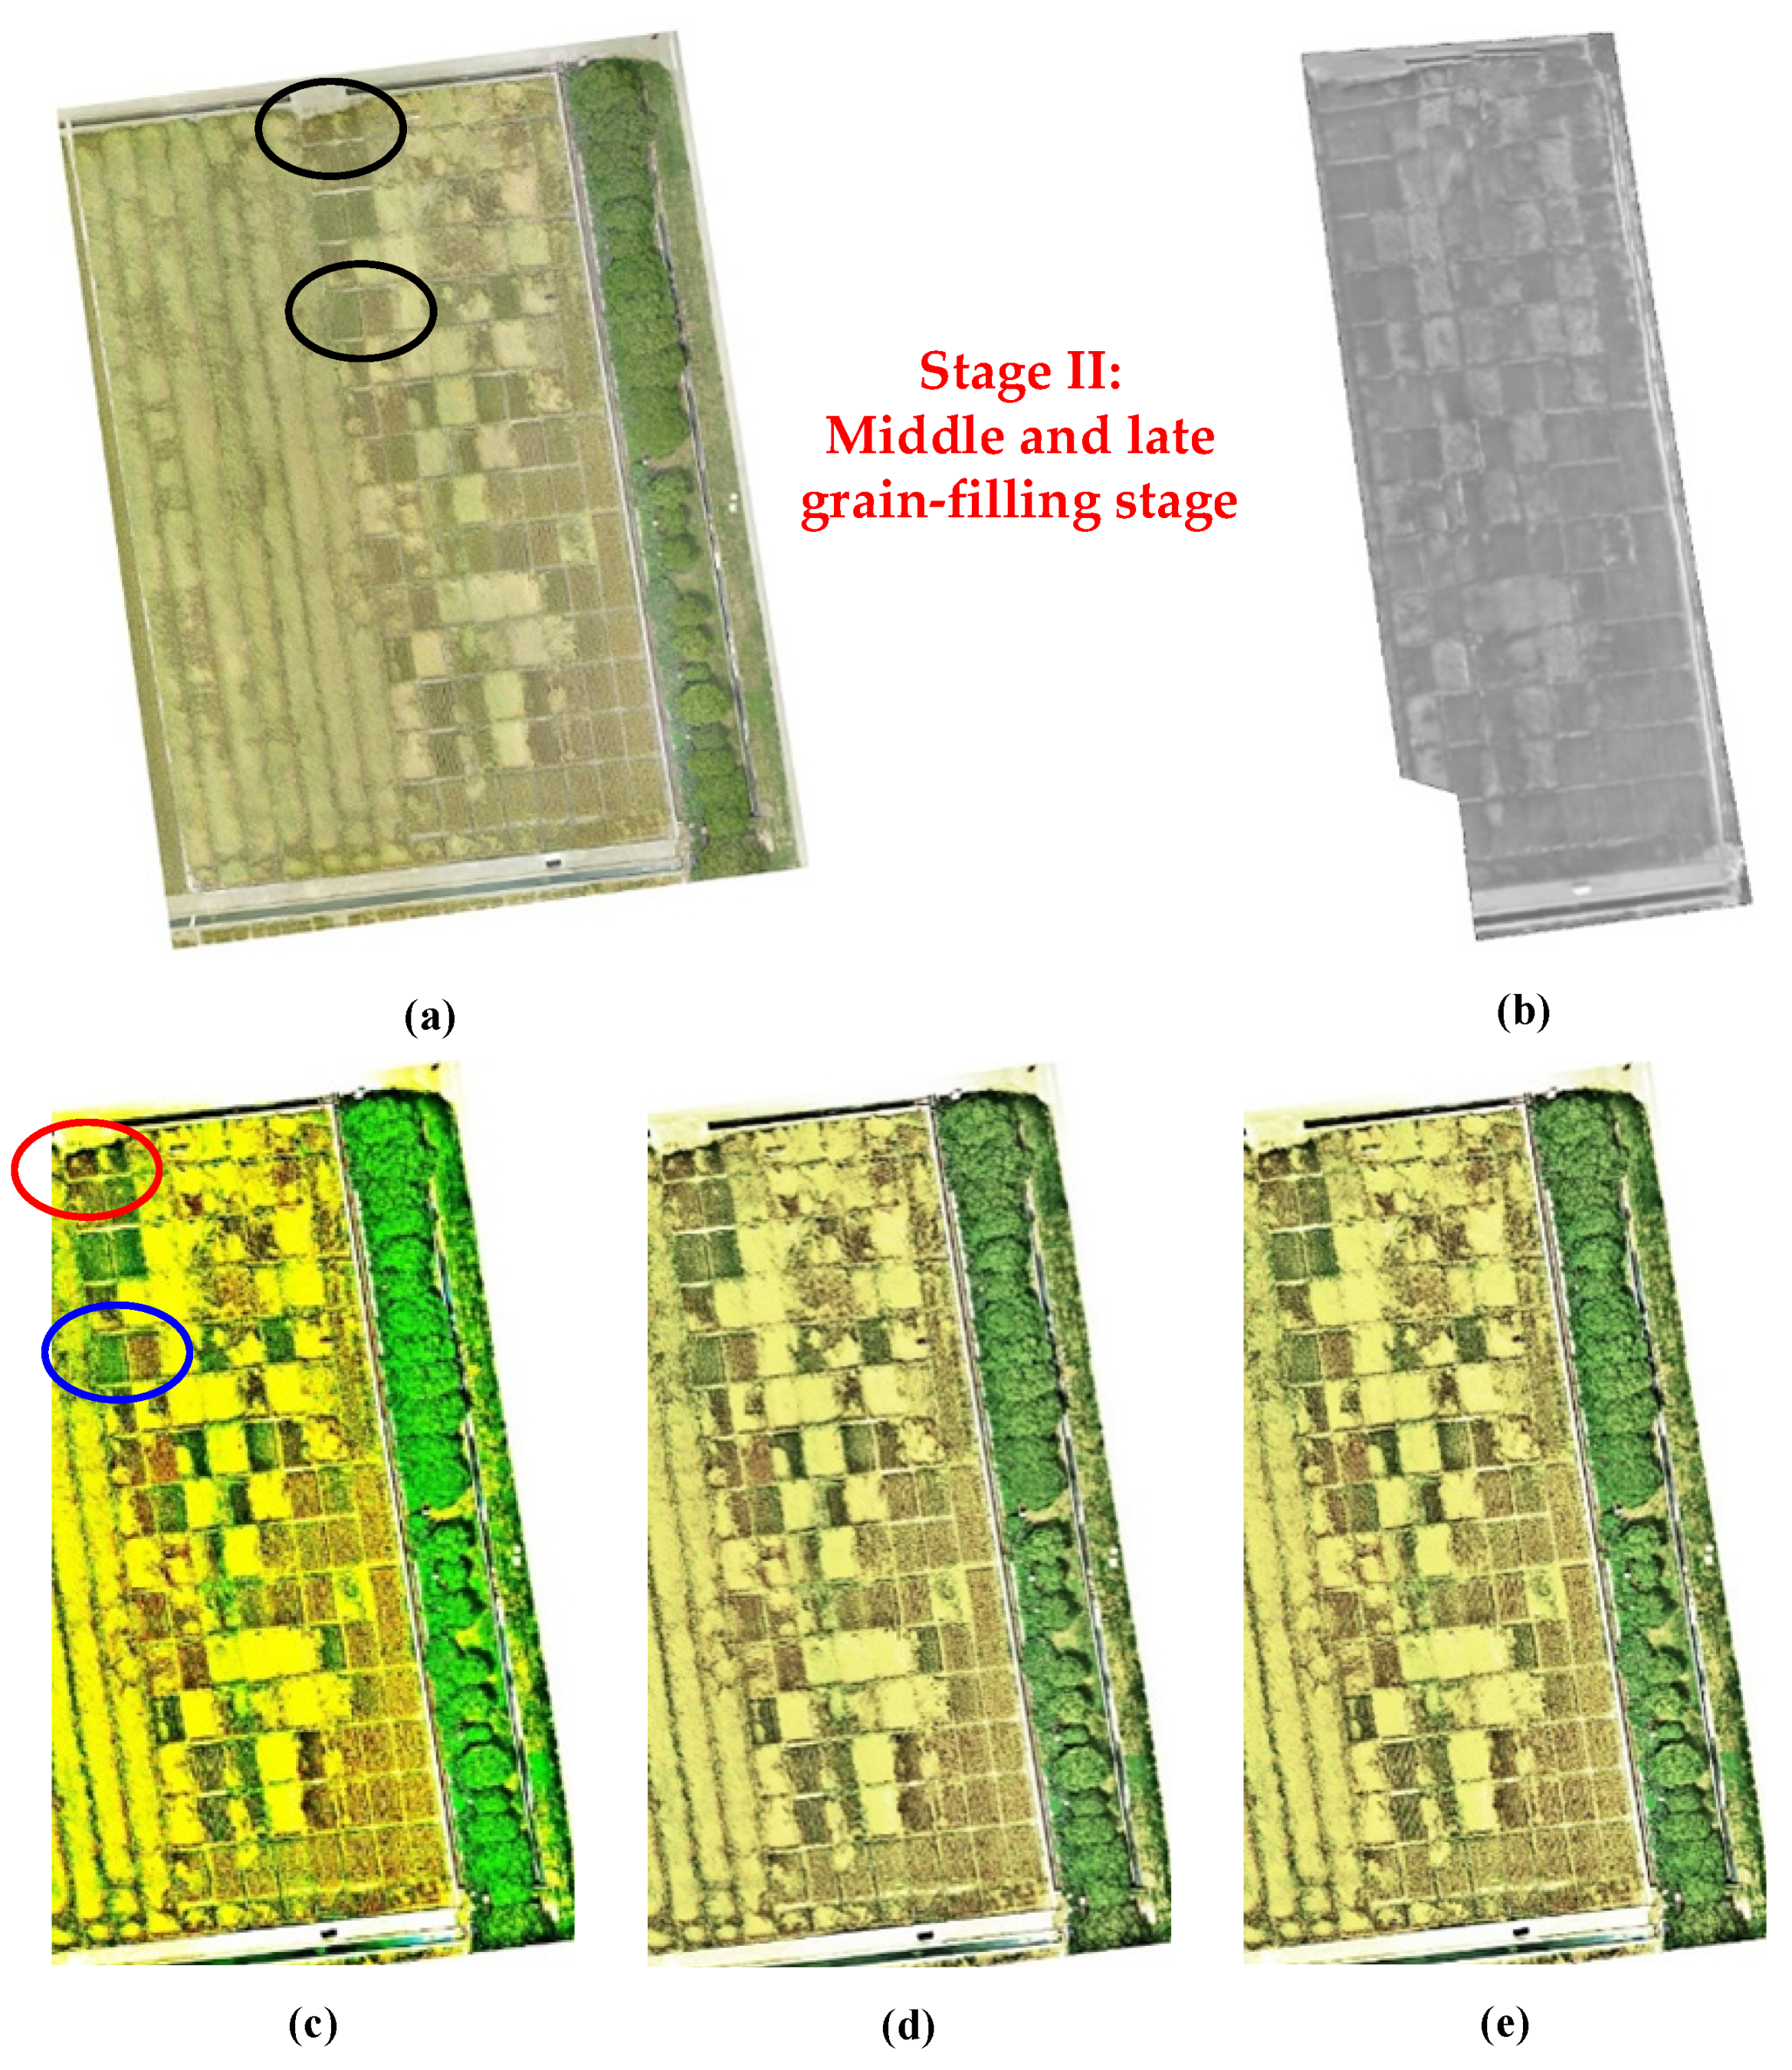
3.1. Visual Assessment

The fused images of two growth stages were respectively obtained using our proposed method, the IHS transform and regional variance (Figure 3 for Stage I and Figure 4 for Stage II). In comparison with original visible and TIR images, it can be observed that the fused images showed better visual performance than original single image. In comparison with original visible image (Figure 3a and Figure 4a), the color contrast and texture difference had been greatly enhanced (Figure 3c–e and Figure 4c–e). It seemed that the three-dimensional sense had been also improved. More fine differences could be easily found in the fused image, such as the regions highlighted in red and blue ovals (Figure 3c and Figure 4c). When comparing the three fused images of two growth stages, it can be found that the images derived from our proposed method show best visual performance. The abnormal phenomena in wheat fields can be easily found.
Visual interpretation is an indispensable procedure to perform image classification [52,53]. It is highly necessary to improve the image quality for accurately selecting enough regions of interest (ROIs) in traditional supervised classification methods and labeled samples in the deep learning era. When an image has a high enough resolution and satisfying visual effect, the ROIs can be easily and directly identified from the image. Nevertheless, it is generally insufficient and difficult to collect an image with good visual performance from a single sensor. Image fusion technology has provided us with an increasingly efficient and accurate visual understanding of a target image [54].

3.2. Quantitative Comparison

It is inevitable that some uncertainties can be produced by human perception in visual interpretation, due to apparently distinct expert knowledge and personal understating for different image interpreters [55]. The visual qualitative description can even lead to a wrong conclusion. It is highly necessary to assess the fusion effect using quantitative evaluation factors. A total of five indicators were used to compare the differences in our study (Table 1). It can be found that the indicators of fused images using the three fusion algorithms have been greatly improved compared to the original images.
In comparison with the regional variance and IHS transform, our proposed method has the best performance. For Stage I, the entropy increased by 0.77% and 1.03% for visible and TIR images, the average gradient increased by 6.3% and 10.38%, and SD increased by 4.36% and 119.17%. Similarly, the three indicators increased by 0.13% and 0.68%, 8.86% and 9.41%, and −0.61% and 293.77%, respectively. In addition, the correlation coefficients were largest and the Dindex values were smallest between the fused and original images, indicating that the details of original images were preserved to the greatest extent.
It is obvious that the fused image derived from the IHS-RVM method is superior to traditional regional variance and IHS transform. The fused images have more entropy, standard deviation and average gradient. The most important point is that the original information of visible and TIR images is as well maintained as possible. When identifying the stress characteristics of wheat growth, the fused images can provide interpretation capabilities than original visible or TIR images [56].

3.3. Comaprison of Other Fusion Methods with Ours

To achieve more informative and comprehensive images, image fusion combines multiple images of the same scene derived from more than two different sensors at same or different imaging times [57,58]. Different image fusion methods have been developed to assess fused images, including PCA, IHS, Brovey fusion, contourlet transform, WT, median filtering algorithm, principal component transform, etc. Those fusion algorithms have their own advantages and disadvantages.
For example, WT can effectively separate the low- and high-frequency characteristics from an image, where low-frequency components reflect visual information and high-frequency components provide image details. It can retain high-frequency characteristics to result in high quality fusion. Nevertheless, it is difficult to select appropriate fusion rules, and poor selection can cause losses of image details and specific information [59]. IHS-based fusion methods are relatively simple and can improve the spatial resolution of the image. The fused image has both high spatial resolution and saturation. In addition, spectral features are preserved to a large extent. However, they can only fuse three bands of a spectral image with a panchromatic image. When there are more than three bands, they need to be carried out separately, and multiple bands are recombined by the inverse IHS transform. In addition, when large differences exist between the I component and panchromatic image, the fused image will be seriously distorted. Fusion algorithms based on regional features consider the correlations between pixels in the same region to determine pixel coefficients [60]. The regional features based fusion algorithms takes the correlation of pixels in the same region into account. They consider all the neighboring pixels of the fusion pixel and then decide the fusion pixel coefficient. It is obvious that the calculation efficiency will be affected and the block phenomenon may be caused.
To address the above-mentioned issues, combining the outstanding advantages of IHS and regional features, a novel image fusion method was proposed based on the IHS transform and regional variance matching. The UAV image is first transformed from RGB space to IHS space, and the WT of the I components of visible and TIR images are calculated. The wavelet coefficients are selected based on the regional variance correlation. The fusion rules are respectively used by considering the LF and HF sub-bands.

4. Conclusions

The growth information for what is highly significant to facilitate the management of farm practices. UAV has played a very important role in the high-throughput data collection of multiple parameters for precision agriculture. More integral information should be collected and fused to reflect the crop growth and planting environment, due to complex background influence. The application of image fusion is increasing, but the fusion algorithms are becoming increasingly complex. Easily-used and lightweight algorithms are required in agricultural scene. The image fusion method was proposed based on IHS space and regional variance in this study. The produced fused images have more entropy, standard deviation and average gradient compared with regional variance and IHS transform. The edges of the fused images are clearer due to the enhanced color contrast. In the future works, more types of UAV images can be used and fused to improve the separability and sensitivities to crops, such as LiDAR, multi- and hyper-spectral sensors.

Author Contributions

C.Z. and J.Z. conceived and designed the experiments; J.Y. performed the experiments; J.Y. and C.Z. analyzed the data; J.Y. and J.Z. wrote the paper. All authors have read and agreed to the published version of the manuscript.

Funding

This research was funded by the National Natural Science Foundation of China (31971789); the Natural Science Foundation of Anhui Province (2008085MF184) and the Science and Technology Major Project of Anhui Province (202003a06020016).

Acknowledgments

The authors would acknowledge the support of experimental design and data collection from the National Engineering Research Center for Information Technology in Agriculture.

Conflicts of Interest

The authors declare no conflict of interest.

References

  1. Manolakis, D.; Shaw, G. Detection algorithms for hyperspectral imaging applications. IEEE Signal Proc. Mag. 2002, 19, 29–43. [Google Scholar] [CrossRef]
  2. Zhou, Y.; Guo, H.; Ma, L.; Zhang, Z.; Skitmore, M. Image-based onsite object recognition for automatic crane lifting tasks. Autom. Constr. 2021, 123, 103527. [Google Scholar] [CrossRef]
  3. Hong, Z.Q. Algebraic feature extraction of image for recognition. Pattern Recogn. 1991, 24, 211–219. [Google Scholar] [CrossRef]
  4. Harsanyi, J.C.; Chang, C.I. Hyperspectral image classification and dimensionality reduction: An orthogonal subspace projection approach. IEEE Trans. Geosci. Remote Sens. 1994, 32, 779–785. [Google Scholar] [CrossRef]
  5. Zhang, H.; Xu, H.; Tian, X.; Jiang, J.; Ma, J. Image fusion meets deep learning: A survey and perspective. Inform. Fusion 2021, 76, 323–336. [Google Scholar] [CrossRef]
  6. Pohl, C.; Van Genderen, J.L. Review article multisensor image fusion in remote sensing: Concepts, methods and applications. Int. J. Remote Sens. 1998, 19, 823–854. [Google Scholar] [CrossRef]
  7. Ehlers, M.; Klonus, S.; Johan Åstrand, P.; Rosso, P. Multi-sensor image fusion for pansharpening in remote sensing. Int. J. Image Data Fusion 2010, 1, 25–45. [Google Scholar] [CrossRef]
  8. Simone, G.; Farina, A.; Morabito, F.C.; Serpico, S.B.; Bruzzone, L. Image fusion techniques for remote sensing applications. Inform. Fusion 2002, 3, 3–15. [Google Scholar] [CrossRef]
  9. Ghassemian, H. A review of remote sensing image fusion methods. Inform. Fusion 2016, 32, 75–89. [Google Scholar] [CrossRef]
  10. Tu, T.M.; Su, S.C.; Shyu, H.C.; Huang, P.S. A new look at IHS-like image fusion methods. Inform. Fusion 2001, 2, 177–186. [Google Scholar] [CrossRef]
  11. Nunez, J.; Otazu, X.; Fors, O.; Prades, A.; Pala, V.; Arbiol, R. Multiresolution-based image fusion with additive wavelet decomposition. IEEE Trans. Geosci. Remote Sens. 1999, 37, 1204–1211. [Google Scholar] [CrossRef]
  12. Pajares, G.; De La Cruz, J.M. A wavelet-based image fusion tutorial. Pattern Recogn. 2004, 37, 1855–1872. [Google Scholar] [CrossRef]
  13. Joshi, N.; Baumann, M.; Ehammer, A.; Fensholt, R.; Grogan, K.; Hostert, P.; Jepsen, M.R.; Kuemmerle, T.; Meyfroidt, P.; Mitchard, E.T.A.; et al. A review of the application of optical and radar remote sensing data fusion to land use mapping and monitoring. Remote Sens. 2016, 8, 70. [Google Scholar] [CrossRef]
  14. Nichol, J.; Wong, M.S. Satellite remote sensing for detailed landslide inventories using change detection and image fusion. Int. J. Remote Sens. 2005, 26, 1913–1926. [Google Scholar] [CrossRef]
  15. Dalponte, M.; Bruzzone, L.; Gianelle, D. Fusion of hyperspectral and LIDAR remote sensing data for classification of complex forest areas. IEEE Trans. Geosci. Remote Sens. 2008, 46, 1416–1427. [Google Scholar] [CrossRef]
  16. Li, S.; Yin, H.; Fang, L. Remote sensing image fusion via sparse representations over learned dictionaries. IEEE Trans. Geosci. Remote Sens. 2013, 51, 4779–4789. [Google Scholar] [CrossRef]
  17. Guo, Q.; Chen, S.; Leung, H.; Liu, S. Covariance intersection based image fusion technique with application to pansharpening in remote sensing. Inform. Sci. 2010, 180, 3434–3443. [Google Scholar] [CrossRef]
  18. Luo, B.; Khan, M.M.; Bienvenu, T.; Chanussot, J.; Zhang, L. Decision-based fusion for pansharpening of remote sensing images. IEEE Geosci. Remote Sens. Lett. 2013, 10, 19–23. [Google Scholar]
  19. Solberg, A.H.S.; Jain, A.K.; Taxt, T. Multisource classification of remotely sensed data: Fusion of Landsat TM and SAR images. IEEE Trans. Geosci. Remote Sens. 1994, 32, 768–778. [Google Scholar] [CrossRef]
  20. Palubinskas, G.; Reinartz, P.; Bamler, R. Image acquisition geometry analysis for the fusion of optical and radar remote sensing data. Int. J. Image Data Fusion 2010, 1, 271–282. [Google Scholar] [CrossRef]
  21. Chen, C.M.; Hepner, G.F.; Forster, R.R. Fusion of hyperspectral and radar data using the IHS transformation to enhance urban surface features. ISPRS J. Photogram. 2003, 58, 19–30. [Google Scholar] [CrossRef]
  22. Held, A.; Ticehurst, C.; Lymburner, L.; Williams, N. High resolution mapping of tropical mangrove ecosystems using hyperspectral and radar remote sensing. Int. J. Remote Sens. 2003, 24, 2739–2759. [Google Scholar] [CrossRef]
  23. Besiris, D.; Tsagaris, V.; Fragoulis, N.; Theoharatos, C. An FPGA-based hardware implementation of configurable pixel-level color image fusion. IEEE Trans. Geosci. Remote Sens. 2012, 50, 362. [Google Scholar] [CrossRef]
  24. Sankey, T.; Donager, J.; McVay, J.; Sankey, J.B. UAV lidar and hyperspectral fusion for forest monitoring in the southwestern USA. Remote Sens. Environ. 2017, 195, 30–43. [Google Scholar] [CrossRef]
  25. López-Granados, F.; Torres-Sánchez, J.; De Castro, A.I.; Serrano-Pérez, A.; Mesas-Carrascosa, F.J.; Peña, J.M. Object-based early monitoring of a grass weed in a grass crop using high resolution UAV imagery. Agron. Sustain. Dev. 2016, 36, 67. [Google Scholar] [CrossRef]
  26. Aasen, H.; Burkart, A.; Bolten, A.; Bareth, G. Generating 3D hyperspectral information with lightweight UAV snapshot cameras for vegetation monitoring: From camera calibration to quality assurance. ISPRS J. Photogramm. Remote Sens. 2015, 108, 245–259. [Google Scholar] [CrossRef]
  27. Berni, J.A.; Zarco-Tejada, P.J.; Suárez, L.; Fereres, E. Thermal and narrowband multispectral remote sensing for vegetation monitoring from an unmanned aerial vehicle. IEEE Trans. Geosci. Remote Sens. 2009, 47, 722–738. [Google Scholar] [CrossRef]
  28. Näsi, R.; Honkavaara, E.; Lyytikäinen-Saarenmaa, P.; Blomqvist, M.; Litkey, P.; Hakala, T.; Viljanen, N.; Kantola, T.; Tanhuanpää, T.; Holopainen, M. Using UAV-based photogrammetry and hyperspectral imaging for mapping bark beetle damage at tree-level. Remote Sens. 2015, 7, 15467–15493. [Google Scholar] [CrossRef]
  29. Niu, Y.; Xu, S.; Wu, L.; Hu, W. Airborne infrared and visible image fusion for target perception based on target region segmentation and discrete wavelet transform. Math. Probl. Eng. 2012, 2012, 275138. [Google Scholar] [CrossRef]
  30. Calderón, R.; Navas-Cortés, J.A.; Lucena, C.; Zarco-Tejada, P.J. High-resolution airborne hyperspectral and thermal imagery for early detection of Verticillium wilt of olive using fluorescence, temperature and narrow-band spectral indices. Remote Sens. Environ. 2013, 139, 231–245. [Google Scholar] [CrossRef]
  31. Jin, Z.; Chen, G.; Hou, J.; Jiang, Q.; Zhou, D.; Yao, X. Multimodal sensor medical image fusion based on nonsubsampled shearlet transform and S-PCNNs in HSV space. Signal Process. 2018, 153, 379–395. [Google Scholar] [CrossRef]
  32. Barlow, J.S. Methods of analysis of nonstationary EEGs with emphasis on segmentations techniques: A comparative review. J. Clin. Neurophysiol. 1985, 2, 267–304. [Google Scholar] [CrossRef]
  33. Karathanassi, V.; Kolokousis, P.; Ioannidou, S. A comparison study on fusion methods using evaluation indicators. Int. J. Remote Sens. 2007, 28, 2309–2341. [Google Scholar] [CrossRef]
  34. Zhang, Y.; Hong, G. An IHS and wavelet integrated approach to improve pan-sharpening visual quality of natural colour IKONOS and QuickBird images. Inform. Fusion 2005, 6, 225–234. [Google Scholar] [CrossRef]
  35. Daubechies, I. The wavelet transform, time-frequency localization and signal analysis. IEEE Trans. Inform. Theory 1990, 36, 961–1005. [Google Scholar] [CrossRef]
  36. Wang, Z.; Ziou, D.; Armenakis, C.; Li, D.; Li, Q. A comparative analysis of image fusion methods. IEEE Trans. Geosci. Remote Sens. 2005, 43, 1391–1402. [Google Scholar] [CrossRef]
  37. Yang, H.; Du, Q.; Ma, B. Decision fusion on supervised and unsupervised classifiers for hyperspectral imagery. IEEE Geosci. Remote Sens. 2010, 7, 875–879. [Google Scholar] [CrossRef]
  38. Yuan, Q.; Zhang, L.; Shen, H. Hyperspectral image denoising with a spatial–spectral view fusion strategy. IEEE Trans. Geosci. Remote Sens. 2014, 52, 2314–2325. [Google Scholar] [CrossRef]
  39. El-Kawy, O.A.; Rød, J.K.; Ismail, H.A.; Suliman, A.S. Land use and land cover change detection in the western Nile delta of Egypt using remote sensing data. Appl. Geogr. 2011, 31, 483–494. [Google Scholar] [CrossRef]
  40. Shi, A.; Xu, L.; Xu, F.; Huang, C. Multispectral and panchromatic image fusion based on improved bilateral. J. Appl. Remote Sens. 2011, 5, 053542. [Google Scholar] [CrossRef]
  41. Liu, X.; Zhou, Y.; Wang, J. Image fusion based on shearlet transform and regional features. AEU-Int. J. Electron. Commun. 2014, 68, 471–477. [Google Scholar] [CrossRef]
  42. Varshney, P.K. Multisensor data fusion. Electron. Commun. Eng. 1997, 9, 245–253. [Google Scholar] [CrossRef]
  43. Chai, Y.; Li, H.F.; Guo, M.Y. Multifocus image fusion scheme based on features of multiscale products and PCNN in lifting stationary wavelet domain. Opt. Commun. 2011, 284, 1146–1158. [Google Scholar] [CrossRef]
  44. Du, C.; Gao, S. Multi-focus image fusion algorithm based on pulse coupled neural networks and modified decision map. Optik 2018, 157, 1003–1015. [Google Scholar] [CrossRef]
  45. Tang, S.; Shen, C.; Zhang, G. Adaptive regularized scheme for remote sensing image fusion. Front. Earth Sci. 2016, 10, 236–244. [Google Scholar] [CrossRef]
  46. Shannon, C.E. A note on the concept of entropy. Bell Syst. Tech. J. 1948, 27, 379–423. [Google Scholar] [CrossRef]
  47. De Albuquerque, M.P.; Esquef, I.A.; Mello, A.G. Image thresholding using Tsallis entropy. Pattern Recogn. Lett. 2004, 25, 1059–1065. [Google Scholar] [CrossRef]
  48. Hang, R.; Liu, Q.; Song, H.; Sun, Y. Marix-Based Discriminant subspace ensemble for hyperspectral image spatial–spectral feature fusion. IEEE Geosci. Remote Sens. 2016, 54, 783–794. [Google Scholar] [CrossRef]
  49. Udupa, J.K.; Samarasekera, S. Fuzzy connectedness and object definition: Theory, algorithms, and applications in image segmentation. Graph. Models Image Process. 1996, 58, 246–261. [Google Scholar] [CrossRef]
  50. Taylor, R. Interpretation of the correlation coefficient: A basic review. J. Diagn. Med. Sonogr. 1990, 6, 35–39. [Google Scholar] [CrossRef]
  51. Dou, W.; Chen, Y.; Li, X.; Sui, D.Z. A general framework for component substitution image fusion: An implementation using the fast image fusion method. Comput. Geosci. 2007, 33, 219–228. [Google Scholar] [CrossRef]
  52. Pavlovic, V.I.; Sharma, R.; Huang, T.S. Visual interpretation of hand gestures for human-computer interaction: A review. IEEE Trans. Pattern Anal. Mach. Intell. 1997, 19, 677–695. [Google Scholar] [CrossRef]
  53. Hamylton, S.M.; Morris, R.H.; Carvalho, R.C.; Roder, N.; Barlow, P.; Mills, K.; Wang, L. Evaluating techniques for mapping island vegetation from unmanned aerial vehicle (UAV) images: Pixel classification, visual interpretation and machine learning approaches. Int. J. Appl. Earth Obs. Geoinf. 2020, 89, 102085. [Google Scholar] [CrossRef]
  54. Zhang, Y. Understanding image fusion. Photogramm. Eng. Remote Sens. 2004, 70, 657–661. [Google Scholar]
  55. Kraff, N.J.; Wurm, M.; Taubenböck, H. Uncertainties of human perception in visual image interpretation in complex urban environments. IEEE J. Sel. Top. Appl. Earth Obs. Remote Sens. 2020, 13, 4229–4241. [Google Scholar] [CrossRef]
  56. Moshou, D.; Pantazi, X.E.; Kateris, D.; Gravalos, I. Water stress detection based on optical multisensor fusion with a least squares support vector machine classifier. Biosyst. Eng. 2014, 117, 15–22. [Google Scholar] [CrossRef]
  57. Li, S.; Yang, B.; Hu, J. Performance comparison of different multi-resolution transforms for image fusion. Infor. Inform. Fusion 2011, 12, 74–84. [Google Scholar] [CrossRef]
  58. Zhang, Q.; Guo, B.L. Multifocus image fusion using the nonsubsampled contourlet transform. Signal Process. 2009, 89, 1334–1346. [Google Scholar] [CrossRef]
  59. Li, H.; Manjunath, B.S.; Mitra, S.K. Multisensor image fusion using the wavelet transform. Graph. Models Image Process. 1995, 57, 235–245. [Google Scholar] [CrossRef]
  60. Klonus, S.; Ehlers, M. Image fusion using the Ehlers spectral characteristics preservation algorithm. GISci. Remote Sens. 2007, 44, 93–116. [Google Scholar] [CrossRef]
Figure 1. The UAV platform for simultaneously mounting the HD digital and TIR cameras.
Agronomy 12 02087 g001
Figure 2. The general workflow of the proposed method to fuse the visible and TIR images. IHS is the intensity hue saturation; WT is the wavelet transform; and H, S, I refer to the hue, saturation, intensity, respectively.
Agronomy 12 02087 g002
Figure 3. Comparison of fused images using our proposed method, reginal variance and IHS transform for Stage I. (a) Original visible image; (b) Original TIR image; (c) IHS-RVM; (d) Regional variance; and (e) IHS transform.
Agronomy 12 02087 g003
Figure 4. Comparison of fused images using our proposed method, reginal variance and IHS transform for Stage II. (a) Original visible image; (b) Original TIR image; (c) IHS-RVM; (d) Regional variance; and (e) IHS transform.
Agronomy 12 02087 g004
Table 1. Comparison of quantitative indicators between pre- and post-fusion images at two growth stages.
ImageESDGrDindex (%)
Stage I: Jointing stage
Figure 3a7.7460.149.64--
Figure 3b7.7657.924.59--
Figure 3c7.8263.9310.060.92623.7
Figure 3d7.5458.089.320.86742.9
Figure 3e7.7757.929.340.87855.6
Stage II: Middle and late grain-filling stage
Figure 4a7.8561.3111.45--
Figure 4b7.7361.002.89--
Figure 4c7.8666.7411.380.92125.9
Figure 4d7.6761.0110.730.87244.8
Figure 4e7.6751.5110.930.89755.3
The bold font shows the largest or smallest value for the growth stage.
Publisher’s Note: MDPI stays neutral with regard to jurisdictional claims in published maps and institutional affiliations.

