Article

Wheat Yield Estimation Using Remote Sensing Indices Derived from Sentinel-2 Time Series and Google Earth Engine in a Highly Fragmented and Heterogeneous Agricultural Region

by
Hajar Saad El Imanni
1,
Abderrazak El Harti
1,* and
Lahcen El Iysaouy
2
1
Geomatics, Georesources and Environment Laboratory, Faculty of Sciences and Techniques, Sultan Moulay Slimane University, Beni Mellal 23000, Morocco
2
ERSC Formerly Known as LEC, Research Center E3S, EMI, Mohammed V University in Rabat, BP765 Agdal, Rabat 10106, Morocco
*
Author to whom correspondence should be addressed.
Agronomy 2022, 12(11), 2853; https://doi.org/10.3390/agronomy12112853
Submission received: 26 August 2022 / Revised: 6 October 2022 / Accepted: 13 October 2022 / Published: 15 November 2022

Abstract

:
In Morocco, monitoring and estimation of wheat yield at the regional and national scales are critical issues for national food security. The recent Sentinel-2 imagery offers potential for managing grain production systems on a field and regional level. The present study was planned based on a time series of six remote sensing indices and Multiple Linear Regression (MLR) methods for real-time estimation of wheat yield using the Google Earth Engine (GEE) platform in a highly heterogeneous and fragmented agricultural region, such as the Tadla Irrigated Perimeter (TIP). First, the spatial distribution of wheat in the TIP region was mapped by performing Random Forest (RF) classification of Sentinel 2 images. Following that, using MLR models, the wheat yield of nine sampled fields was estimated for the different phenological stages of wheat. The yield measured in-situ was the independent variable of the regressions. The dependent variables included the remote sensing indices derived from Sentinel-2. The remote sensing index and the phenological period of the greatest model were investigated to estimate and map the wheat yield in the entire study area. The RF generated the wheat mapping of the study area with an overall accuracy (OA) of 93.82%. Furthermore, the coefficient of determination (R2) of the tested MLR was from 0.53 to 0.89, while the Root Mean Square Error (RMSE) varied from 4.29 to 7.78 q ha−1. The best model was the one that uses the Green Normalized Difference Vegetation Index (GNDVI) in the tillering and maturity stages.

1. Introduction

Cereals are vital to national food security all around the world. Accurate and timely estimation of cereal production on regional and national levels is essential for developing countries like Morocco. Moreover, due to the increasing demand for food grain, early crop production information is critical for planning emergency response and food aid initiatives [1]. To estimate production, both area and yield must be considered. In many countries, such statistics are obtained from traditional data collection techniques, for example, sample surveys, expert assessments, farmer reports, and allometric models [2]. These approaches are costly, time-consuming, and necessitate extensive fieldwork. The estimating process may involve significant errors due to limited field observations and the subjectivity of respondents’ responses.
The opportunities for improving the quality of Moroccan agricultural statistics are considerable. Accessibility of remote sensing data and the efficiency of the recent Google Earth Engine (GEE) platform in reduction of processing time, computation, and automation, could aid in the more effective collection of agricultural statistics. The Tadla Irrigated Perimeter (TIP) in central Morocco, is chosen as a study area due to its agricultural importance, particularly in cereals production [3]. The TIP as well as other Moroccan irrigated perimeters are expected to develop irrigation management, crop monitoring, and yield estimation approaches to increase production and save water [4].
Several sensors with a variety of spatial and temporal resolutions have been used worldwide to estimate yield. The Advanced Very-High-Resolution Radiometer (AVHHR) has been the most extensively used sensor for crop monitoring and yield forecasting on a large scale since the early 1980s [5]. Recently, satellite data including Moderate Resolution Imaging Spectroradiometer (MODIS), Landsat, and Sentinel data have been exploited for yield forecasting and monitoring, with significant results [2,5]. In Spain, Belin et al. [6] combined AVHRR-NDVI data and drought indices at different time scales for early prediction of wheat and barley production. In China, Prasad et al. [7] used MODIS-NDVI data to estimate regional yield production using a linear regressive relationship between spatial accumulation of NDVI and the production of winter wheat. In Pakistan, Hassan et al. [8] evaluated the feasibility of using MODIS-derived vegetation indices to predict pre-harvest wheat yield with the statistical modeling approach. In the lowlands of the Tisza river catchment, Nagy et al. [9] employed Landsat-8 derived vegetation indices (NDVI and SAVI) and a linear regression model for early season prediction of wheat production. In Afghanistan, Arab et al. [10] evaluated Landsat-8 time-series vegetation indices for the prediction of grape yields using a machine learning approach. In Pakistan, Usman et al. [11] evaluated MODIS and Landsat multiband vegetation indices for wheat yield forecasting using a step-wise regression model. In Tunisia, Mehdaoui et al. [2] exploited red-edge bands of Sentinel-2 to improve the prediction of durum wheat yield at the field and regional scale.
According to previous studies, remote sensing indices such as the Enhanced Vegetation Index (EVI), Green Normalized Difference Vegetation Index (GNDVI), and Weighted Difference Vegetation Index (WDVI) have recently been used in several studies for crop monitoring and crop yield forecasting [12].
Despite the increasing importance of remote sensing for the scientific community and agricultural statistics, it faces several significant technical challenges in its operational application. The low spatial resolution of some images is one of the most significant limitations [2]. This is highly relevant in Morocco where small portions of land ownership have resulted in fragmented agricultural areas such as the TIP region. Some of these drawbacks have been remedied with the latest release of Sentinel-2. The publicly accessible data from the Sentinel-2 missions of the European Space Agency (ESA) provide open imagery at a high spatial and temporal resolution.
Sen2Cor is a Level-2A (L2A) processor of Sentinel-2 whose primary function is to remove atmospheric effects from single-date Sentinel-2 Level-1C products to provide a Level-2A surface reflectance product. Furthermore, the cloud shadow algorithm’s implementation in Sentinel-2 Level 2A has been evaluated to enable accurate cloud shadow computation for all configurations of solar angles and viewing angles in the northern and southern hemispheres [13].
Several methods, including biophysical crop-simulation models, crop growth models, agrometeorological and machine learning models [2,14,15] have been developed to forecast crop yield using remotely sensed data, with statistical regression methods being the most used [16,17]. Using remote sensing data, more complicated machine learning models have been used to anticipate agricultural yield [18].
Machine learning models have the disadvantage of being less interpretable than regression models with a priori functional form requirements.
However, these methods are more useful when different factors such as climate, temperature, humidity, air temperature, and water temperature are used as inputs in yield prediction; the algorithm requires a considerable number of inputs to be trained [19].
The regression models are founded on empirical relationships between in-situ yield measurements and vegetation indices [2,5]. These techniques do get by without a large amount of data and are easy to apply. [16].
There is currently no scientific publication in Scopus that combines the use of the high spatiotemporal resolution of Sentinel-2 images, the phonological stages of wheat, and the new computational capability of the GEE cloud platform to develop an accurate model for predicting wheat yield in Morocco, in a region with highly heterogeneous and fragmented landscapes.
We believe that this approach can be extended to the estimation of the yield of other crops by studying in a comprehensive approach the relationship between remote sensing indices data and typical phenological stages of crops.
Therefore, this paper was planned as follows: (1) to assess six remote sensing indices derived from Sentinel-2 and phenological stages in developing an accurate model for wheat yield prediction using MLR technique, (2) to deduce the optimal phenological stage and remote sensing index for forecasting wheat yield, and (3) to extrapolate the best performing model to the TIP regional scale.

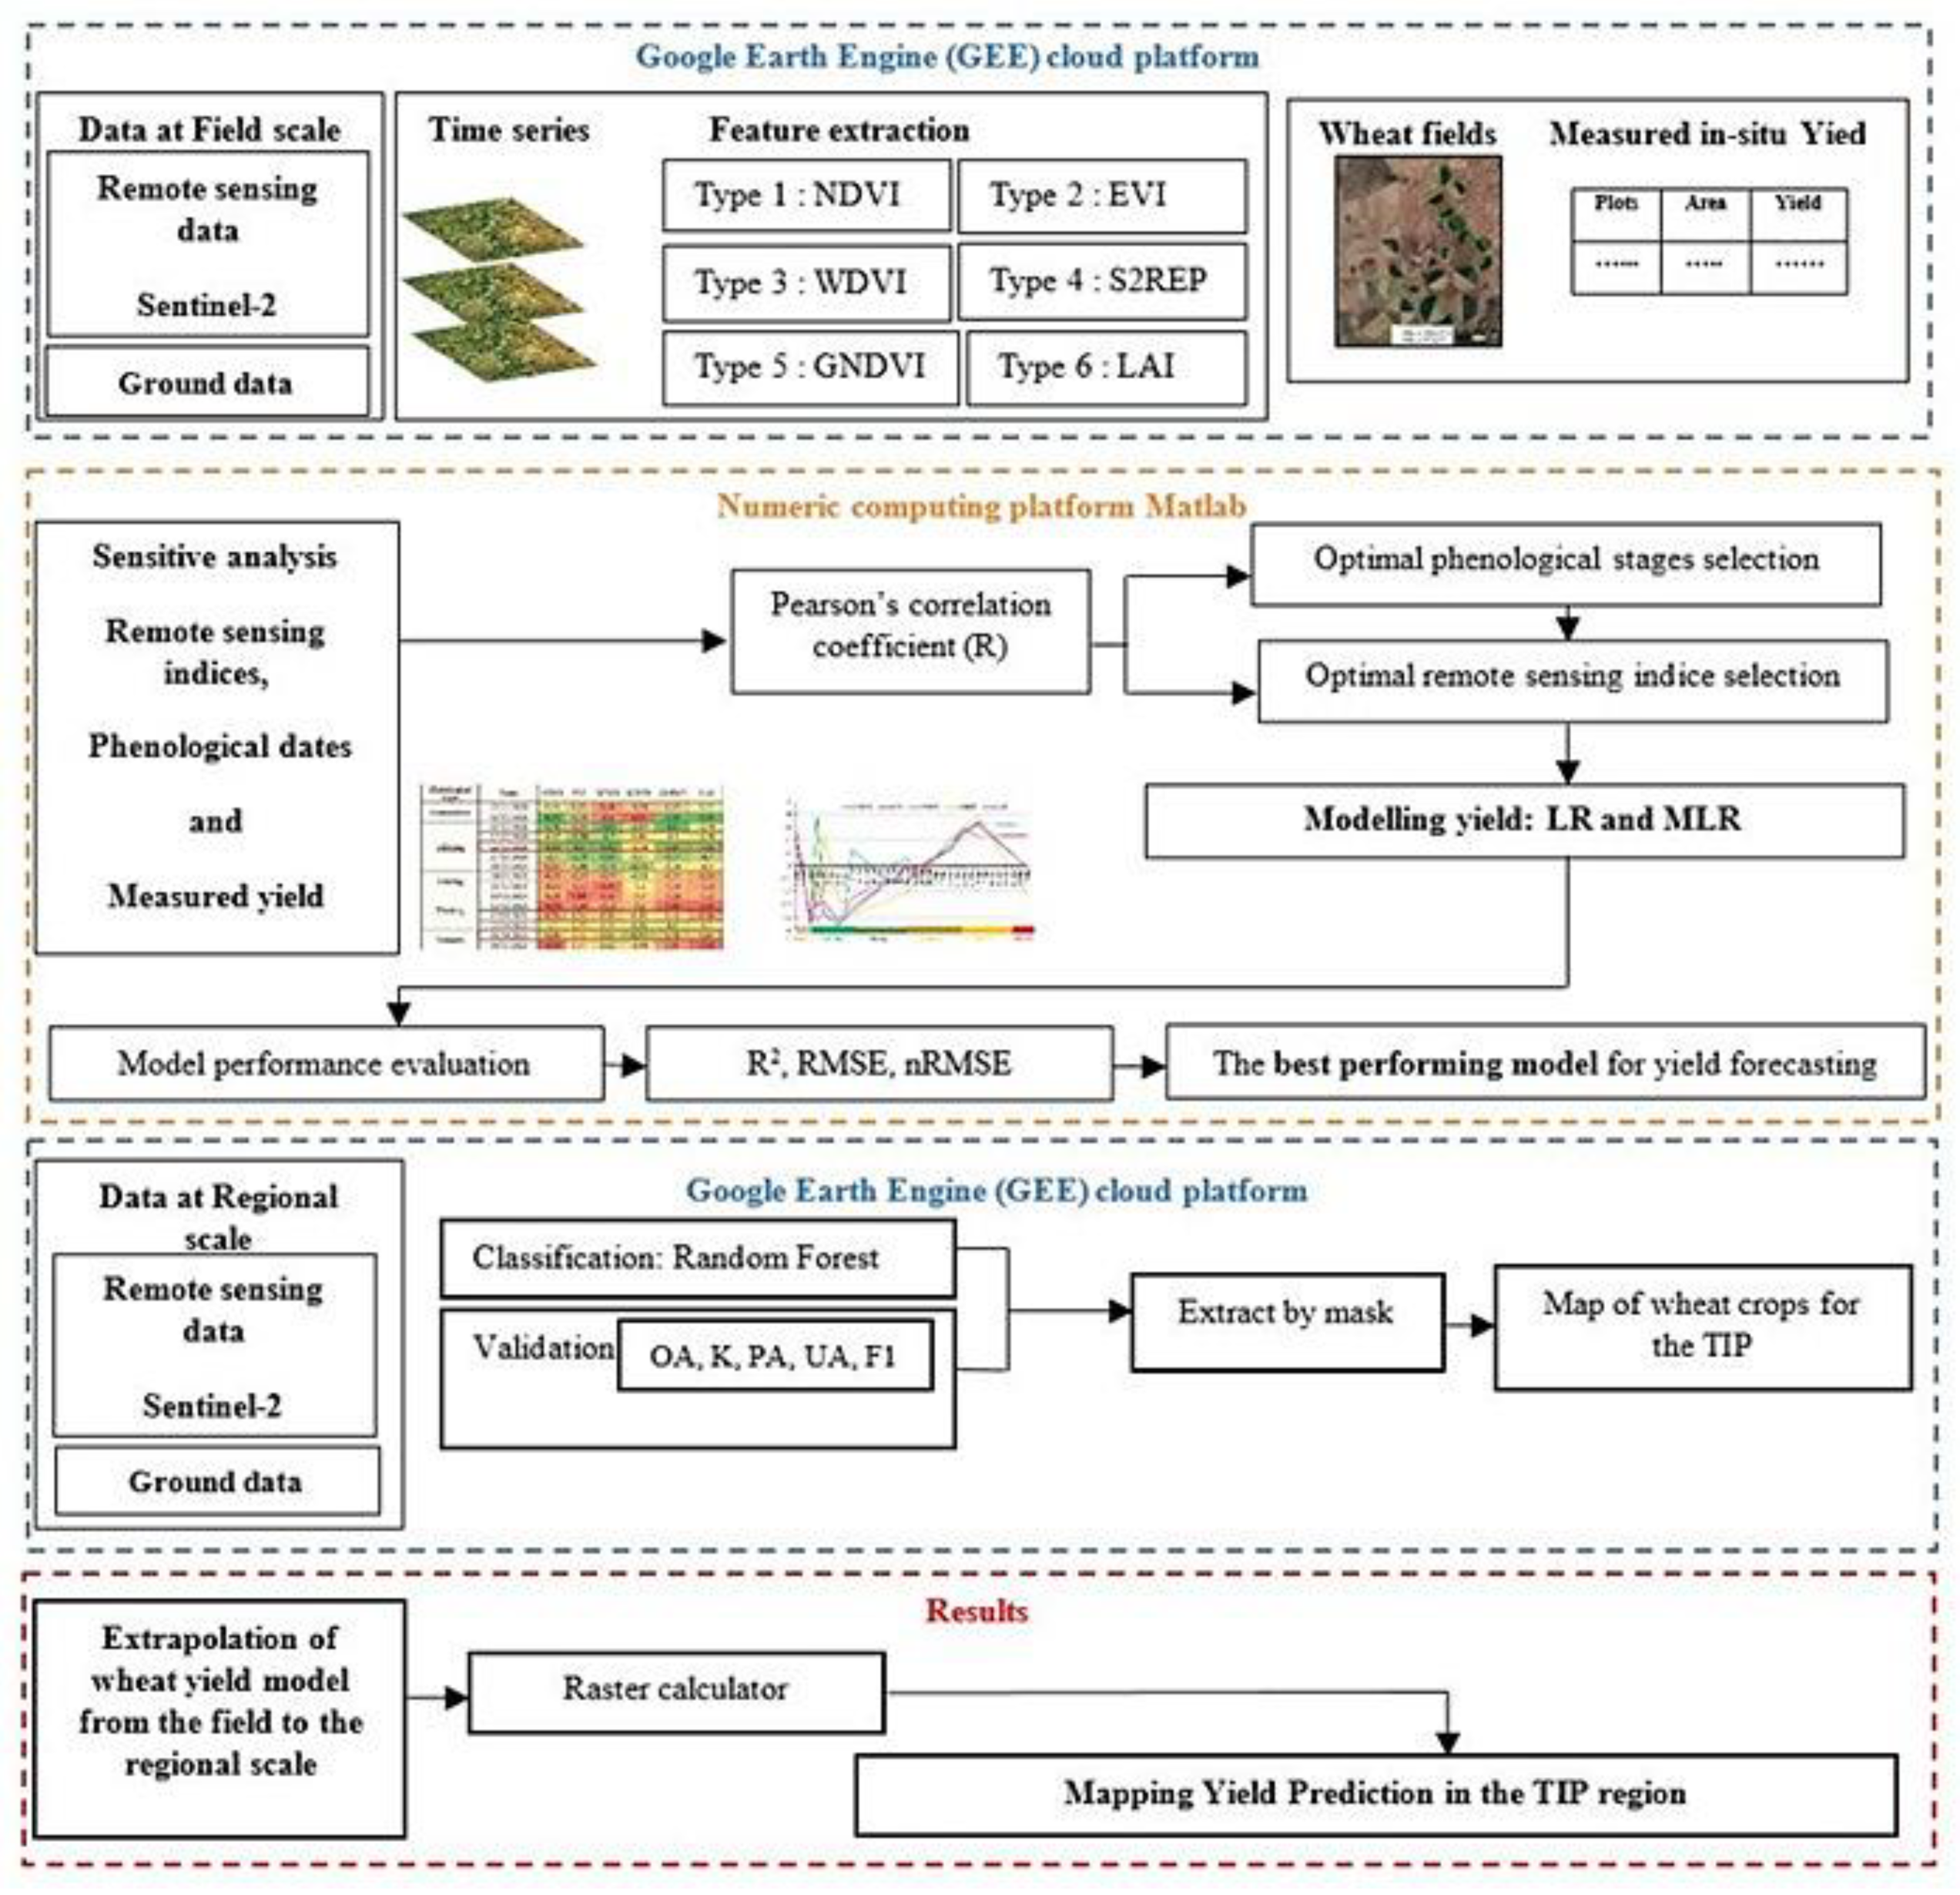
2. Materials and Methods
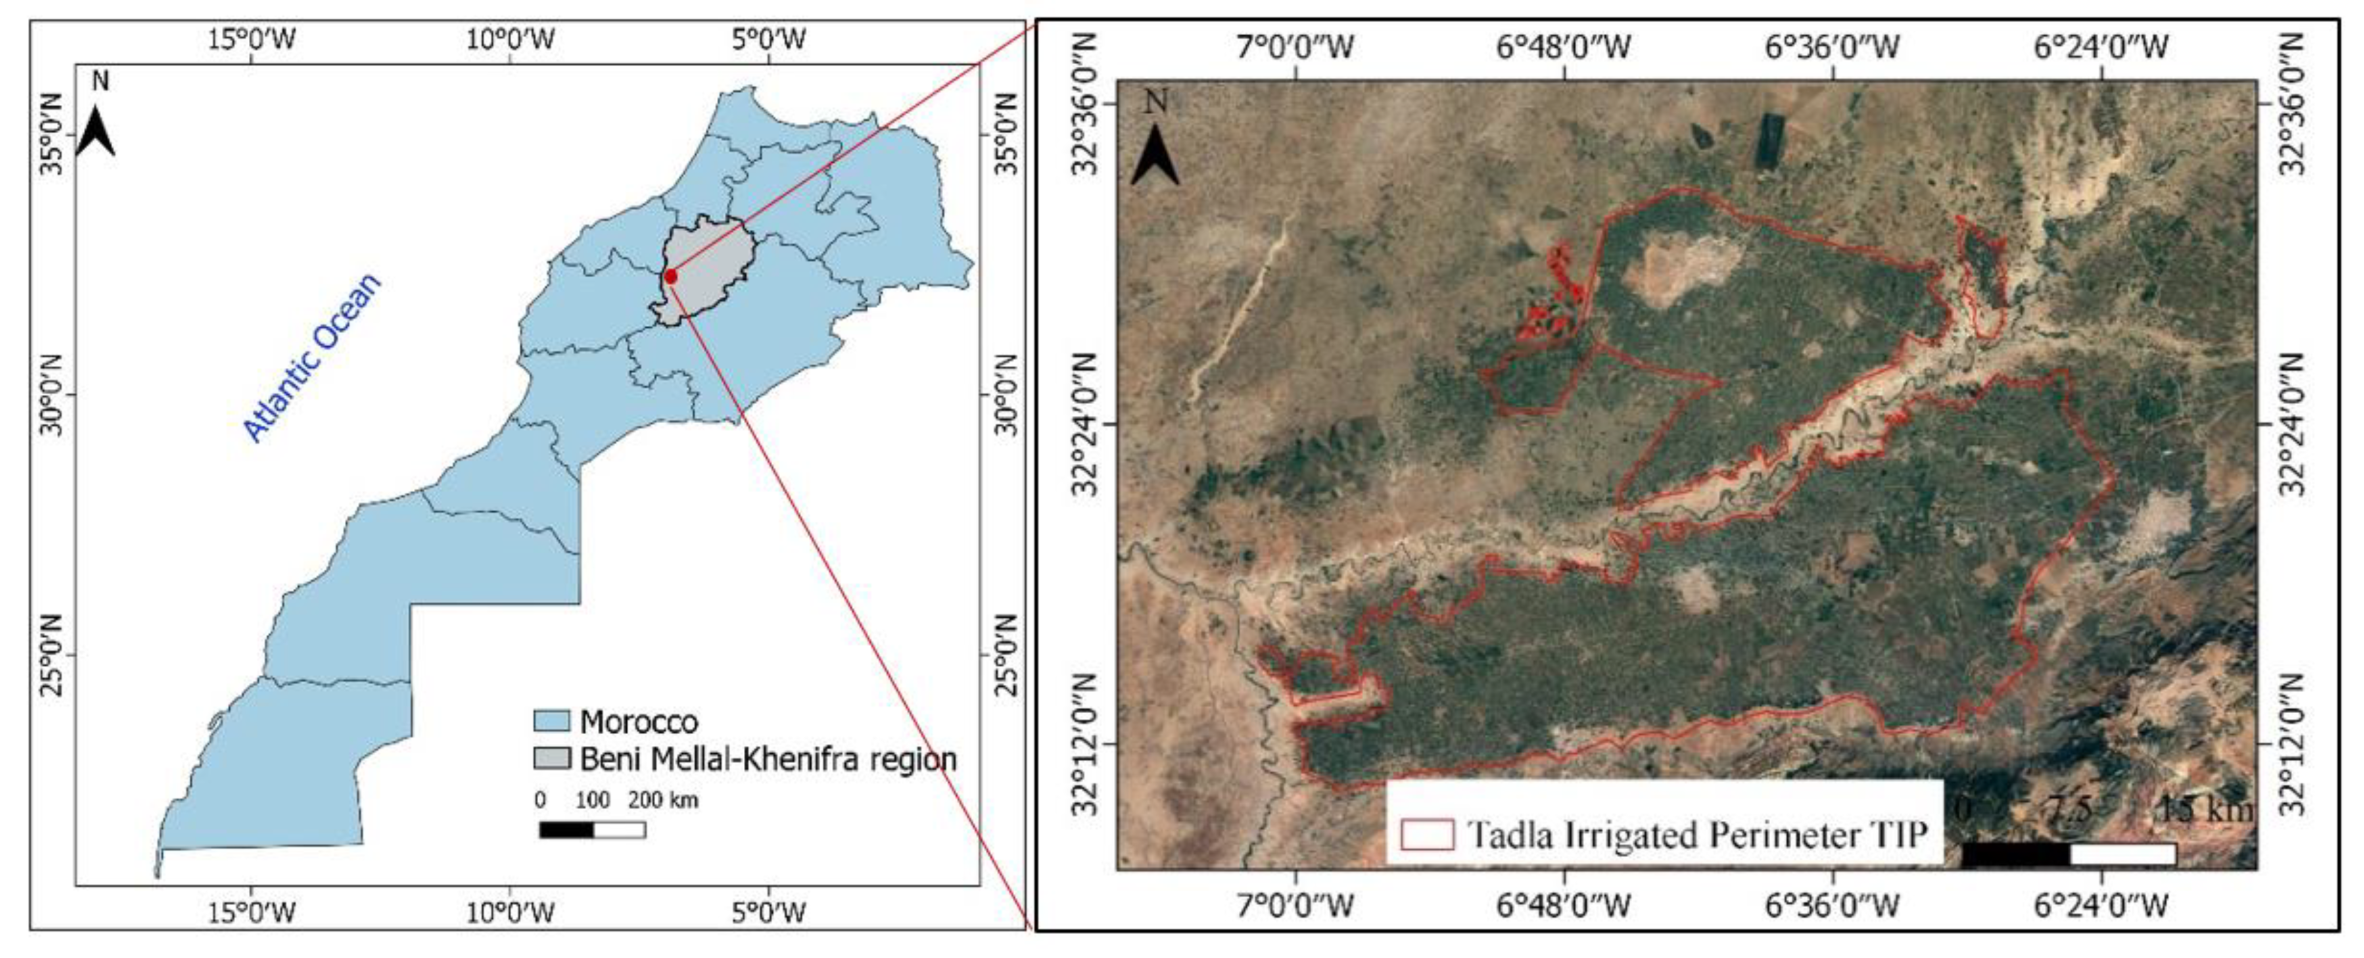
2.1. Study Area

The study area represents an irrigated perimeter of the Beni Mellal-Khenifra region in central Morocco, namely, the Tadla Irrigated Perimeter (TIP), which is located between 32°12′0″ N 7°0′0″ W and 32°36′0″ N 6°24′0″ W with an average altitude of 400 m (Figure 1). The TIP covers over 100,000 hectares of irrigated land and is one of the most important large-scale irrigation systems in Morocco. The TIP is divided into two compartments: the Northern bank’s Beni Amir perimeter and the Southern bank’s Beni Moussa perimeter. The climate is arid to semi-arid, with temperatures ranging from 6° in January to 48° in August [3,20]. The landscape is mainly fragmented and heterogeneous; 86% of parcels are less than 5 ha, and only 5% of parcels exceed 10 ha [20]. Land use is predominantly agricultural, with the main crops being cereals (wheat, barley, corn), sugar beet, alfalfa, and arboriculture (citrus, pomegranate, olives).

2.2. Image Acquisition and Pre-Processing

The Sentinel-2 Multi-Spectral Instrument (MSI) is aboard two orbiting satellites (Sentinel-2 A/B) that provide images at high spatial and temporal resolution (10 m, 20 m, and 60 m every 5 days) [21]. The MSI is composed of 13 spectral bands. The Level-2A product, which gives Bottom Of Atmosphere (BOA) reflectance images, was applied in this study. This product provides 12 spectral bands (Cirrus band B10 is not included) (Table 1).
The Sentinel-2 images were filtered from the GEE catalog based on the presence of minimal or no clouds in the scene by setting the threshold of cloud cover (less than 5% cloud cover).
This study examined a set of 15 Sentinel-2 images from November 2020 to May 2021, which represents the wheat growing season from germination to full maturity, to develop the yield estimation models.

2.3. Tools Used

The workflow for the computation of vegetation indices from the time series images was implemented in the Google Earth Engine (GEE) environment using a Java scripts interface. To execute the classification of TIP crops, the preprocessed images were also uploaded from the GEE asset. The charts of vegetation indices time series were then exported to extract vegetation indices values for the different dates of the agricultural season 2020/2021 (from November 2020 to May 2021). The Sensitive Analysis between Remote Sensing Indices and Crop Yield was generated in the programming and numeric computing platform MATLAB. The founding wheat map was exported from GEE as Geocoded raster and imported to QGIS software for visual interpretation.

2.4. Methods

The goal of this research is to develop a forecast model of durum wheat yield based on satellite data. The methodology is divided into four parts. Firstly, the six vegetation indices were computed for the different dates between November 2020 and May 2021 from the spectral bands of Sentinel-2. Secondly, the six remote sensing indices are used for assessing the relationship between yield measured in-situ as input of the estimation model of durum wheat yield. The yield measured in-situ was the independent variable of the regressions. The dependent variables included the six vegetation indices. Thirdly, the greatest phenological period was deduced and chosen as input for the prediction of the yield model. Fourthly, the durum wheat regression models were developed and the wheat mapping of TIP for the season 2020/2021 was obtained to extrapolate the yield estimation from the nine wheat fields of the season 2020/2021 to the TIP regional scale. The methodological approach was developed and analyzed in the GEE cloud computing platform and MATLAB software. Figure 2 describes the overall flowchart of this study, as well as the processing approach and individual steps.

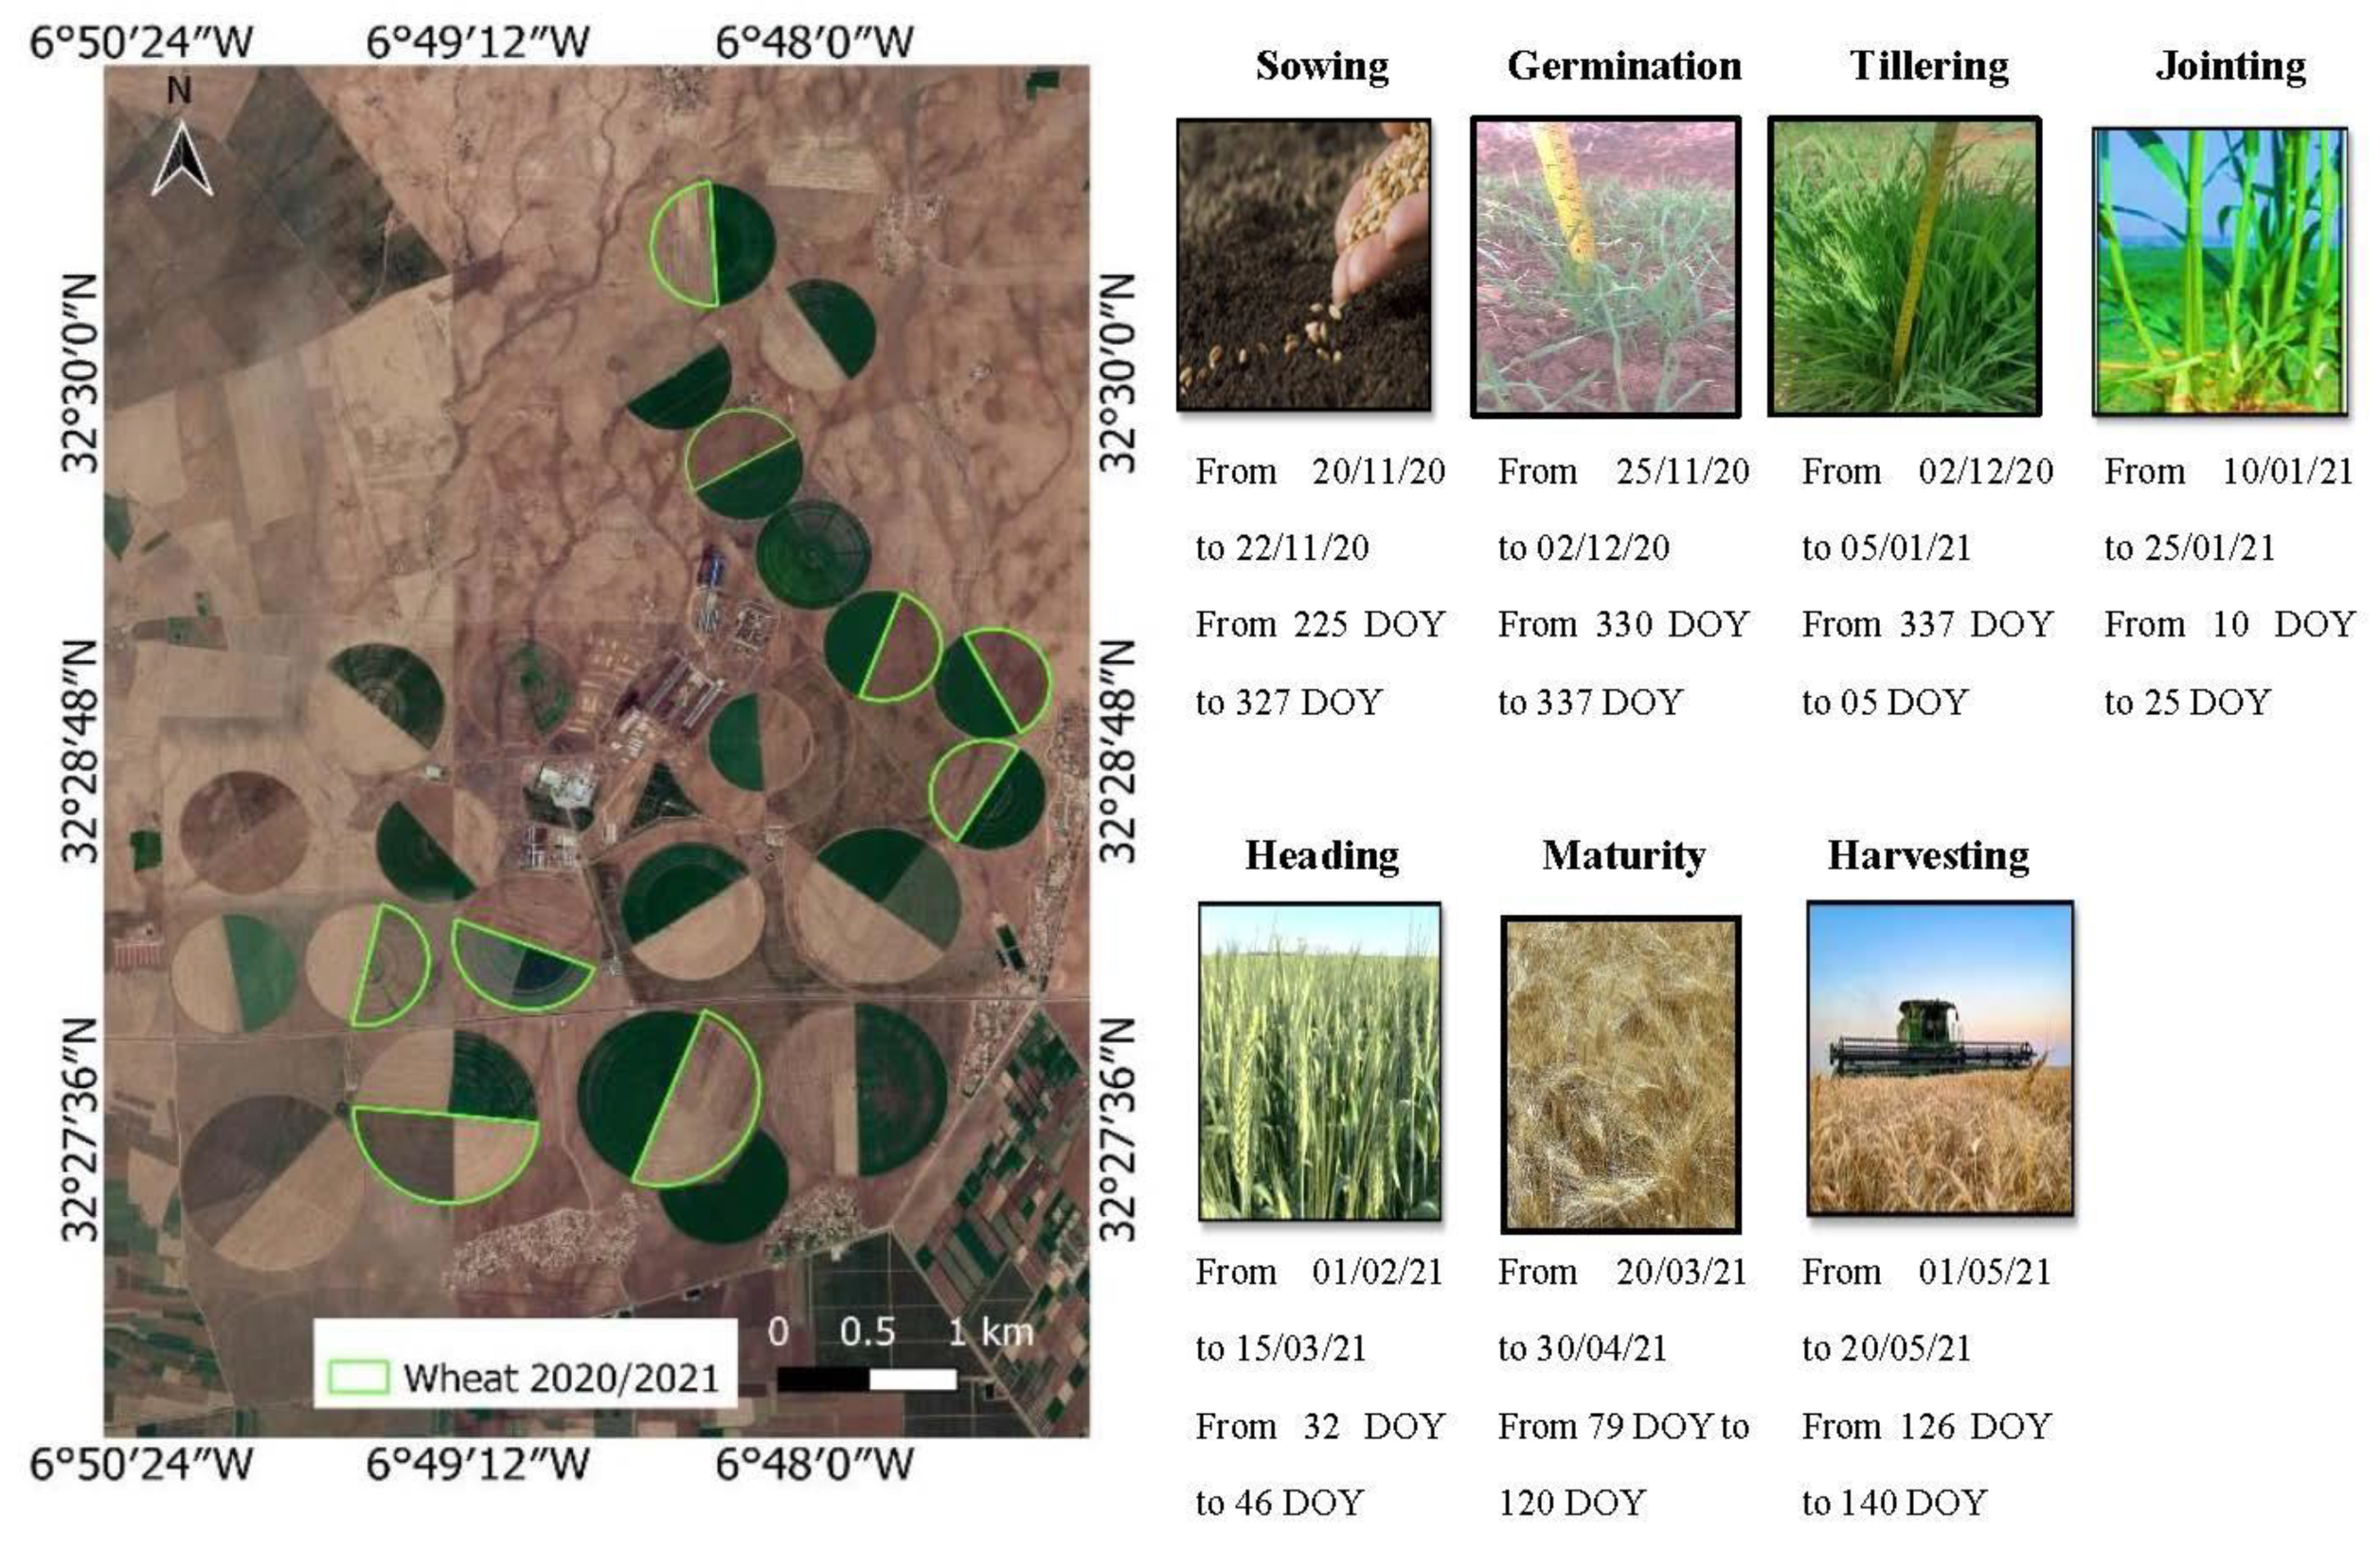
2.4.1. Wheat Yield Measurements

The measurement of yield was conducted on 9 durum wheat fields during the 2020/2021 agricultural season. The different plots of wheat were identified and vectorized as Regions of Interest (ROIs). The coordinates of the ROIs were recorded using GPS. Their areas vary from 11.5 ha to 21 ha (mean = 16.22 ha, median = 16 ha). The location of durum wheat fields for the year 2020/2021 is shown in Figure 3. Seven phenological stages have been observed during the field campaigns: sowing, germination, tillering, jointing, heading, maturity, and harvesting. The calendar of phenological stages of durum wheat is presented in Figure 3. The yield value for durum wheat varies from 22.68 q ha−1 to 59.16 q ha−1 (mean = 46.91 q ha−1, median = 52.55 q ha−1 ). Yield measurements from the 2019/2020, 2018/2019, and 2017/2018 agricultural seasons were used for validation of the yield model developed based on 2020/2021 yield data.

2.4.2. Remote Sensing Indices Computing

The growing conditions in each crop stage have a significant effect on crop production. Six vegetation indices were calculated based on their potential to monitor crop growth and estimate yield production: The Normalized Difference Vegetation Index (NDVI), Enhanced Vegetation Index (EVI), Green Normalized Difference Vegetation Index (GNDVI), Sentinel-2 Red Edge Position (S2REP), the Weighted Difference Vegetation Index (WDVI) and the Leaf Area Index (LAI) (Table 2). Previous studies indicate that these remote sensing indicators have recently been incorporated into crop monitoring and yield forecasting [14].
The NDVI is the most widely used vegetation index among the many that have been developed. The empirical regression models that are used to estimate yields employ it as an independent variable [2]. The NDVI is derived from reflectance in the red (R) and near-infrared (NIR) portions of the spectrum.
The EVI has attracted considerable attention in the context of monitoring the quality and quantity of vegetation. It is represented as an optimized vegetation index to provide an improved vegetation signal with higher sensitivity in areas with dense biomass [22]. The EVI is calculated from reflectance in the R, blue (B), and NIR portions of the spectrum [23].
Generally, the NDVI and GNDVI are employed to estimate yield since they have a significant association with the amount of the plant in the field. The GNDVI is created from the green (G) and NIR bands, the same as the NDVI formula [24].
The greatest absorption in the red part and the maximum reflectance in the NIR part are distinguished by the S2REP, which was created specifically for Sentinel-2.
The WDVI is distinct from the ratio indices, as it is a distance-based index that was developed for correcting the near-infrared reflectance of soil background [14].
The LAI is a biophysical variable that measures the density of green vegetation and describes the state of the vegetation cover [25]. The LAI index refers to the ratio of leaf area to the ground area under broadleaf canopies. Preceding research has focused on the correlation between NDVI and LAI values derived from satellite data and monthly field measurements to develop regression curves [5]. The least-squares method was used to resolve this issue. Table 2 shows the basis for the calculation of the remote sensing indices.
Crop production and growth condition are highly correlated at the pixel level [5]. The value of each pixel’s remote sensing index was directly obtained for the nine fields of durum wheat, and an averaging of pixel values was then performed for each field. NDVI, EVI, WDVI, S2REP, GNDVI, and LAI were used to examine the relationship between the six remote sensing indices and the measured in-situ yield throughout the growing season (from November to May) for the year 2020/2021.
Table 2. Remote sensing indices calculated from Sentinel-2 images.
IndexEquationS-2 Bands UsedOriginal Author
NDVI(NIR − R)/(NIR + R)(B8 − B4)/(B8 + B4)[26]
EVI2.5(NIR − R)/(NIR + 6R − 7.5 ×BLUE + 1)2.5(B8 − B4)/(B8 + 6B4 − 7.5 × B2 + 1)[27]
WDVI(NIR − 0.5 × R)(B8 – 0.5 × B4)[28]
S2REP705 + 35 × (((NIR + R)/2) − RE1)/(RE2 − RE1))705 + 35 × (((B7 + B4)/2) − B5)/(B6 − B5))[29]
GNDVI(NIR − GREEN)/(NIR + GREEN)(B8 − B3)/(B8 + B3)[27]
LAI0.57 × exp(2.33 × NDVI)0.57 × exp(2.33 × ((B8 − B4)/(B8 + B4)))[30]

2.4.3. Sensitive Analysis between Remote Sensing Indices and Crop Yield

Regression models for yield prediction are essentially based on empirical correlations between in-situ yield data and vegetation indices [2,5]. They are simple to implement and do not necessitate a large number of inputs [15]. In this research, Pearson’s correlation coefficient (R) of remote sensing indices and durum wheat yield was computed throughout the phenological growing stages from November to May. Pearson’s correlation coefficient (R) is a measure of the degree and direction of the linear regression between two continuous variables recorded on an equal interval. R values vary from −1 to 1 (R > 0 denotes a positive linear relationship, R = 0 denotes no relationship, and R < 0 denotes a negative linear relationship) [5].
R = i = 1 n x i x ¯ y i y ¯ i = 1 n x i x ¯ 2 i = 1 n y i y ¯ 2
where x i and y i indicates remote sensing indices and the value of durum wheat yield at different periods, n represents the number of samples, x ¯ and   y ¯ are the average values of x i and y i .

2.4.4. Crop Yield Estimation Model

For crop yield estimation and forecasting studies, regression approaches are commonly used [2]. They are simple and clear to establish and do not necessitate numerous inputs. These are based on empirical relationships between historical yields and remote sensing indices. Because of their modest data needs and ease of deployment, they are frequently the favored approach [5,16,31]. In this study, the correlation between durum wheat and remote sensing indices was examined throughout the growing stages to deduce the optimal remote sensing index and phenological dates for predicting yield using the MLR technique. The six remote sensing indices were the independent variables while the durum wheat yield was the dependent variable.

2.4.5. Model Performance Evaluation

The established model performance was achieved in two steps. Firstly, the correlation between predicted and measured yield values was examined by using model fitting and performance statistics such as the coefficient of determination (R2), root mean square error (RMSE), and normalized nRMSE. Secondly, the regression model developed using measured yield data from the 2020/2021 season was validated using data from 2019/2020, 2019/2018, and 2018/2017 seasons.
R 2 = 1 i = 1 n P i M i   i = 1 n ( M ¯ M i )  
R M S E = i = 1 n ( P i M i ) 2 / n
n R M S E = R M S E / M ¯ 100
where n , P i , M i , and M ¯ represent numbers of samples, predicted values, measured values, and the mean value of   M i .

2.4.6. Crop Classification

To upscale the yield estimation from the nine wheat fields to the entire study area, the crop classification map of TIP was generated. This map was developed from the pixel-based image classification of multi-temporal data from September 2020 to March 2021, using RF classifier.
The Random Forest (RF) algorithm developed by Breiman et al. [32] is a collection of several decision trees, with each tree contributing a single vote for the most frequent class [33]. Due to the construction of a set of Decision Trees (DTs), the RF classifier is more effective and avoids the overfitting issue that is present in DT classifiers [32].
The traditional bands (Blue, Green, and Near Infrared), SWIR bands, red-edge bands, and vegetation indices (NDVI and EVI) were used as inputs for classification. The training data involved 736 plots where 512 were for training (70%) and 224 for validation (30%). The accuracy verification was performed with five evaluation indices: the Overall Accuracy (OA), Kappa coefficient, user’s accuracy, producer’s accuracy, and F1 score using validation parcels that were not included in the training model.

2.4.7. Wheat Yield Mapping

The following procedure was used to create the wheat mapping at the TIP regional level: -Extract the wheat class from the crop classification result and convert it to a shapefile;
-Apply the resulting equation of the greatest model.

3. Results

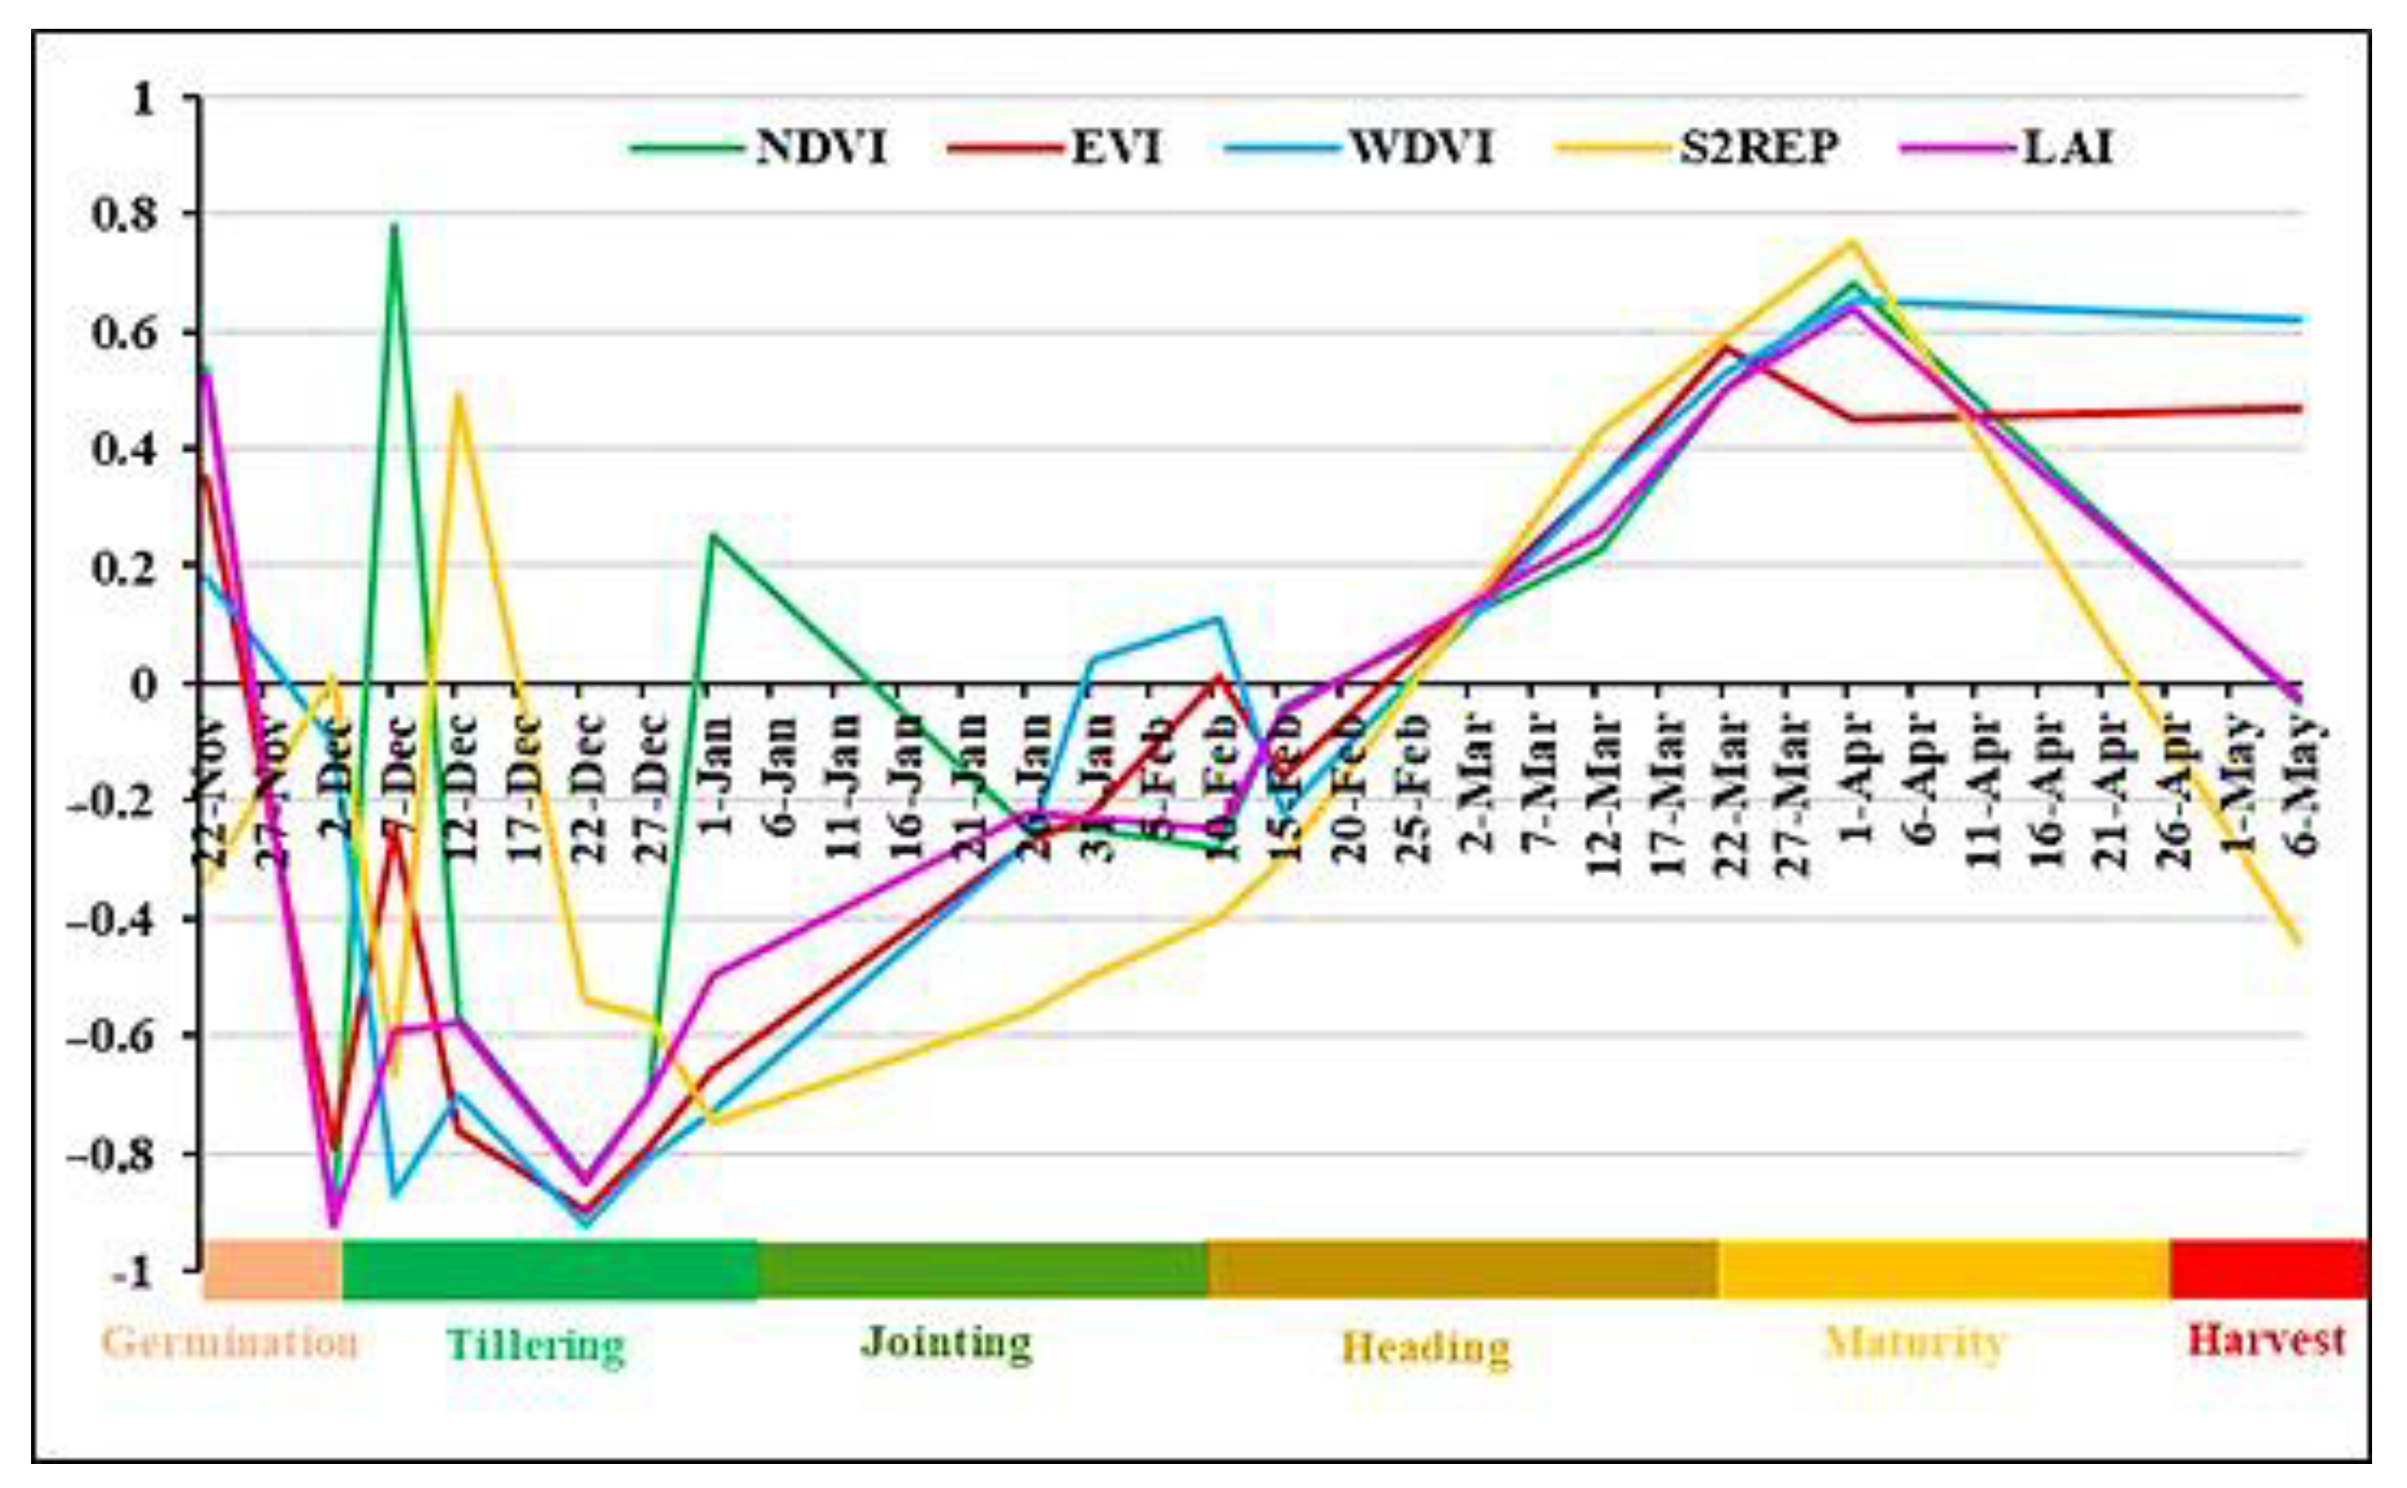
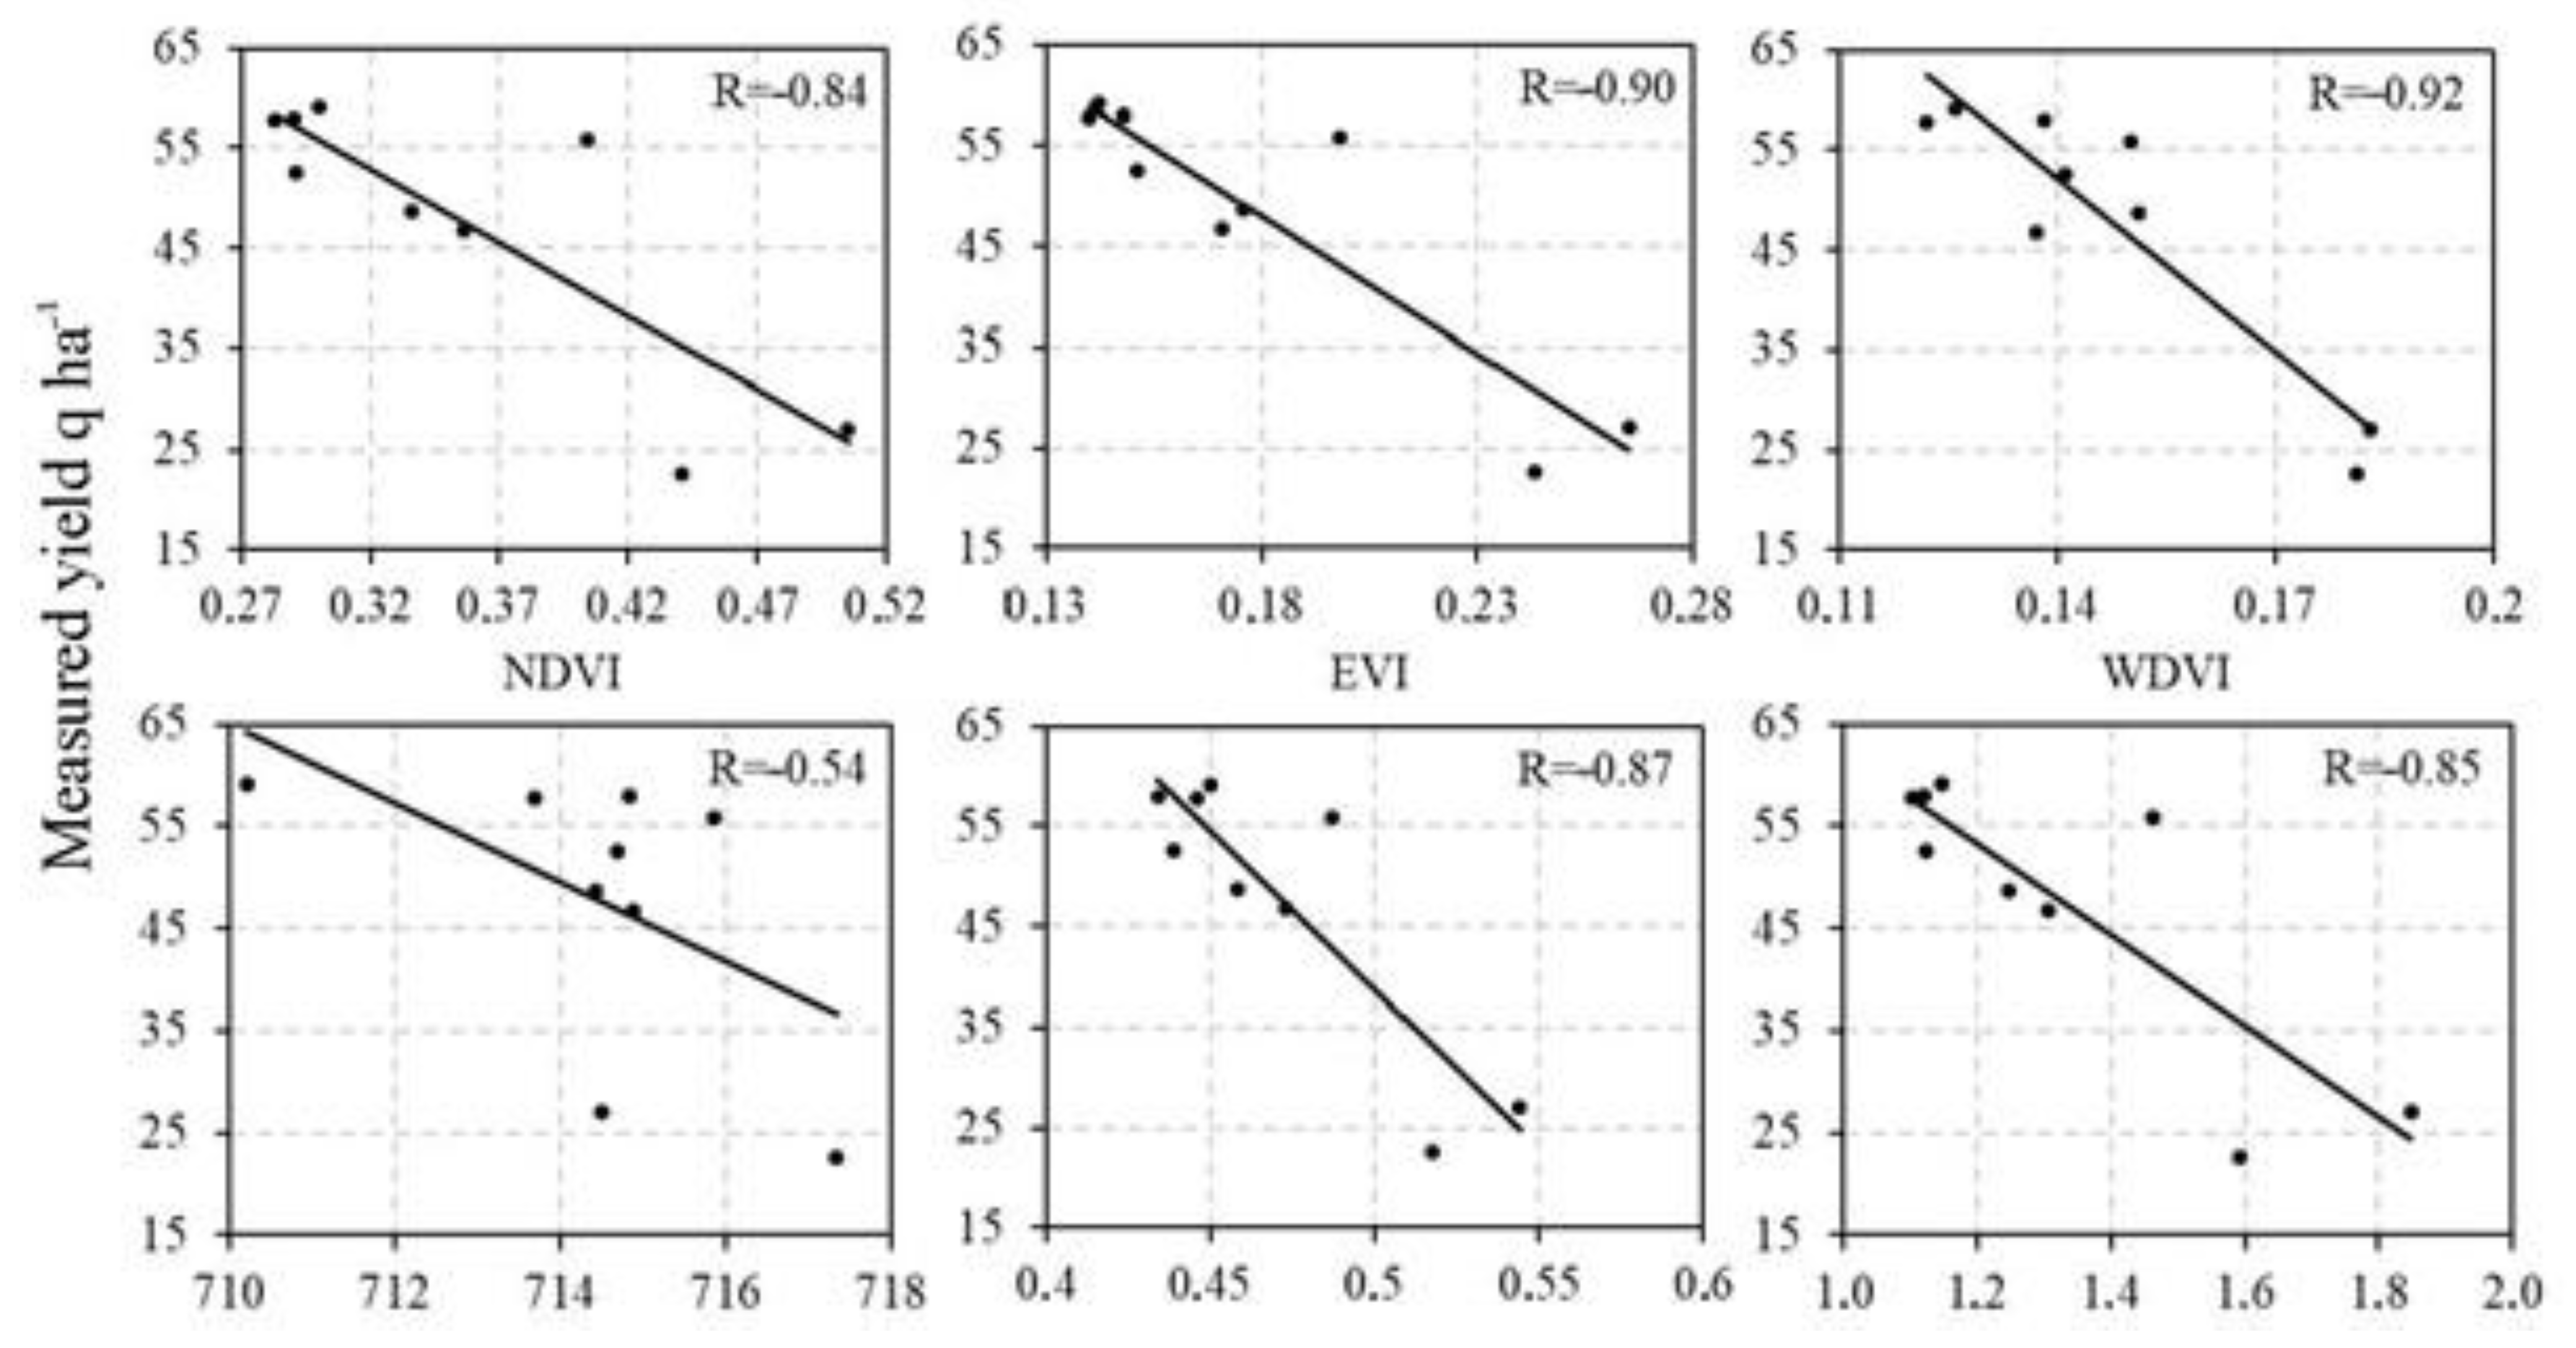
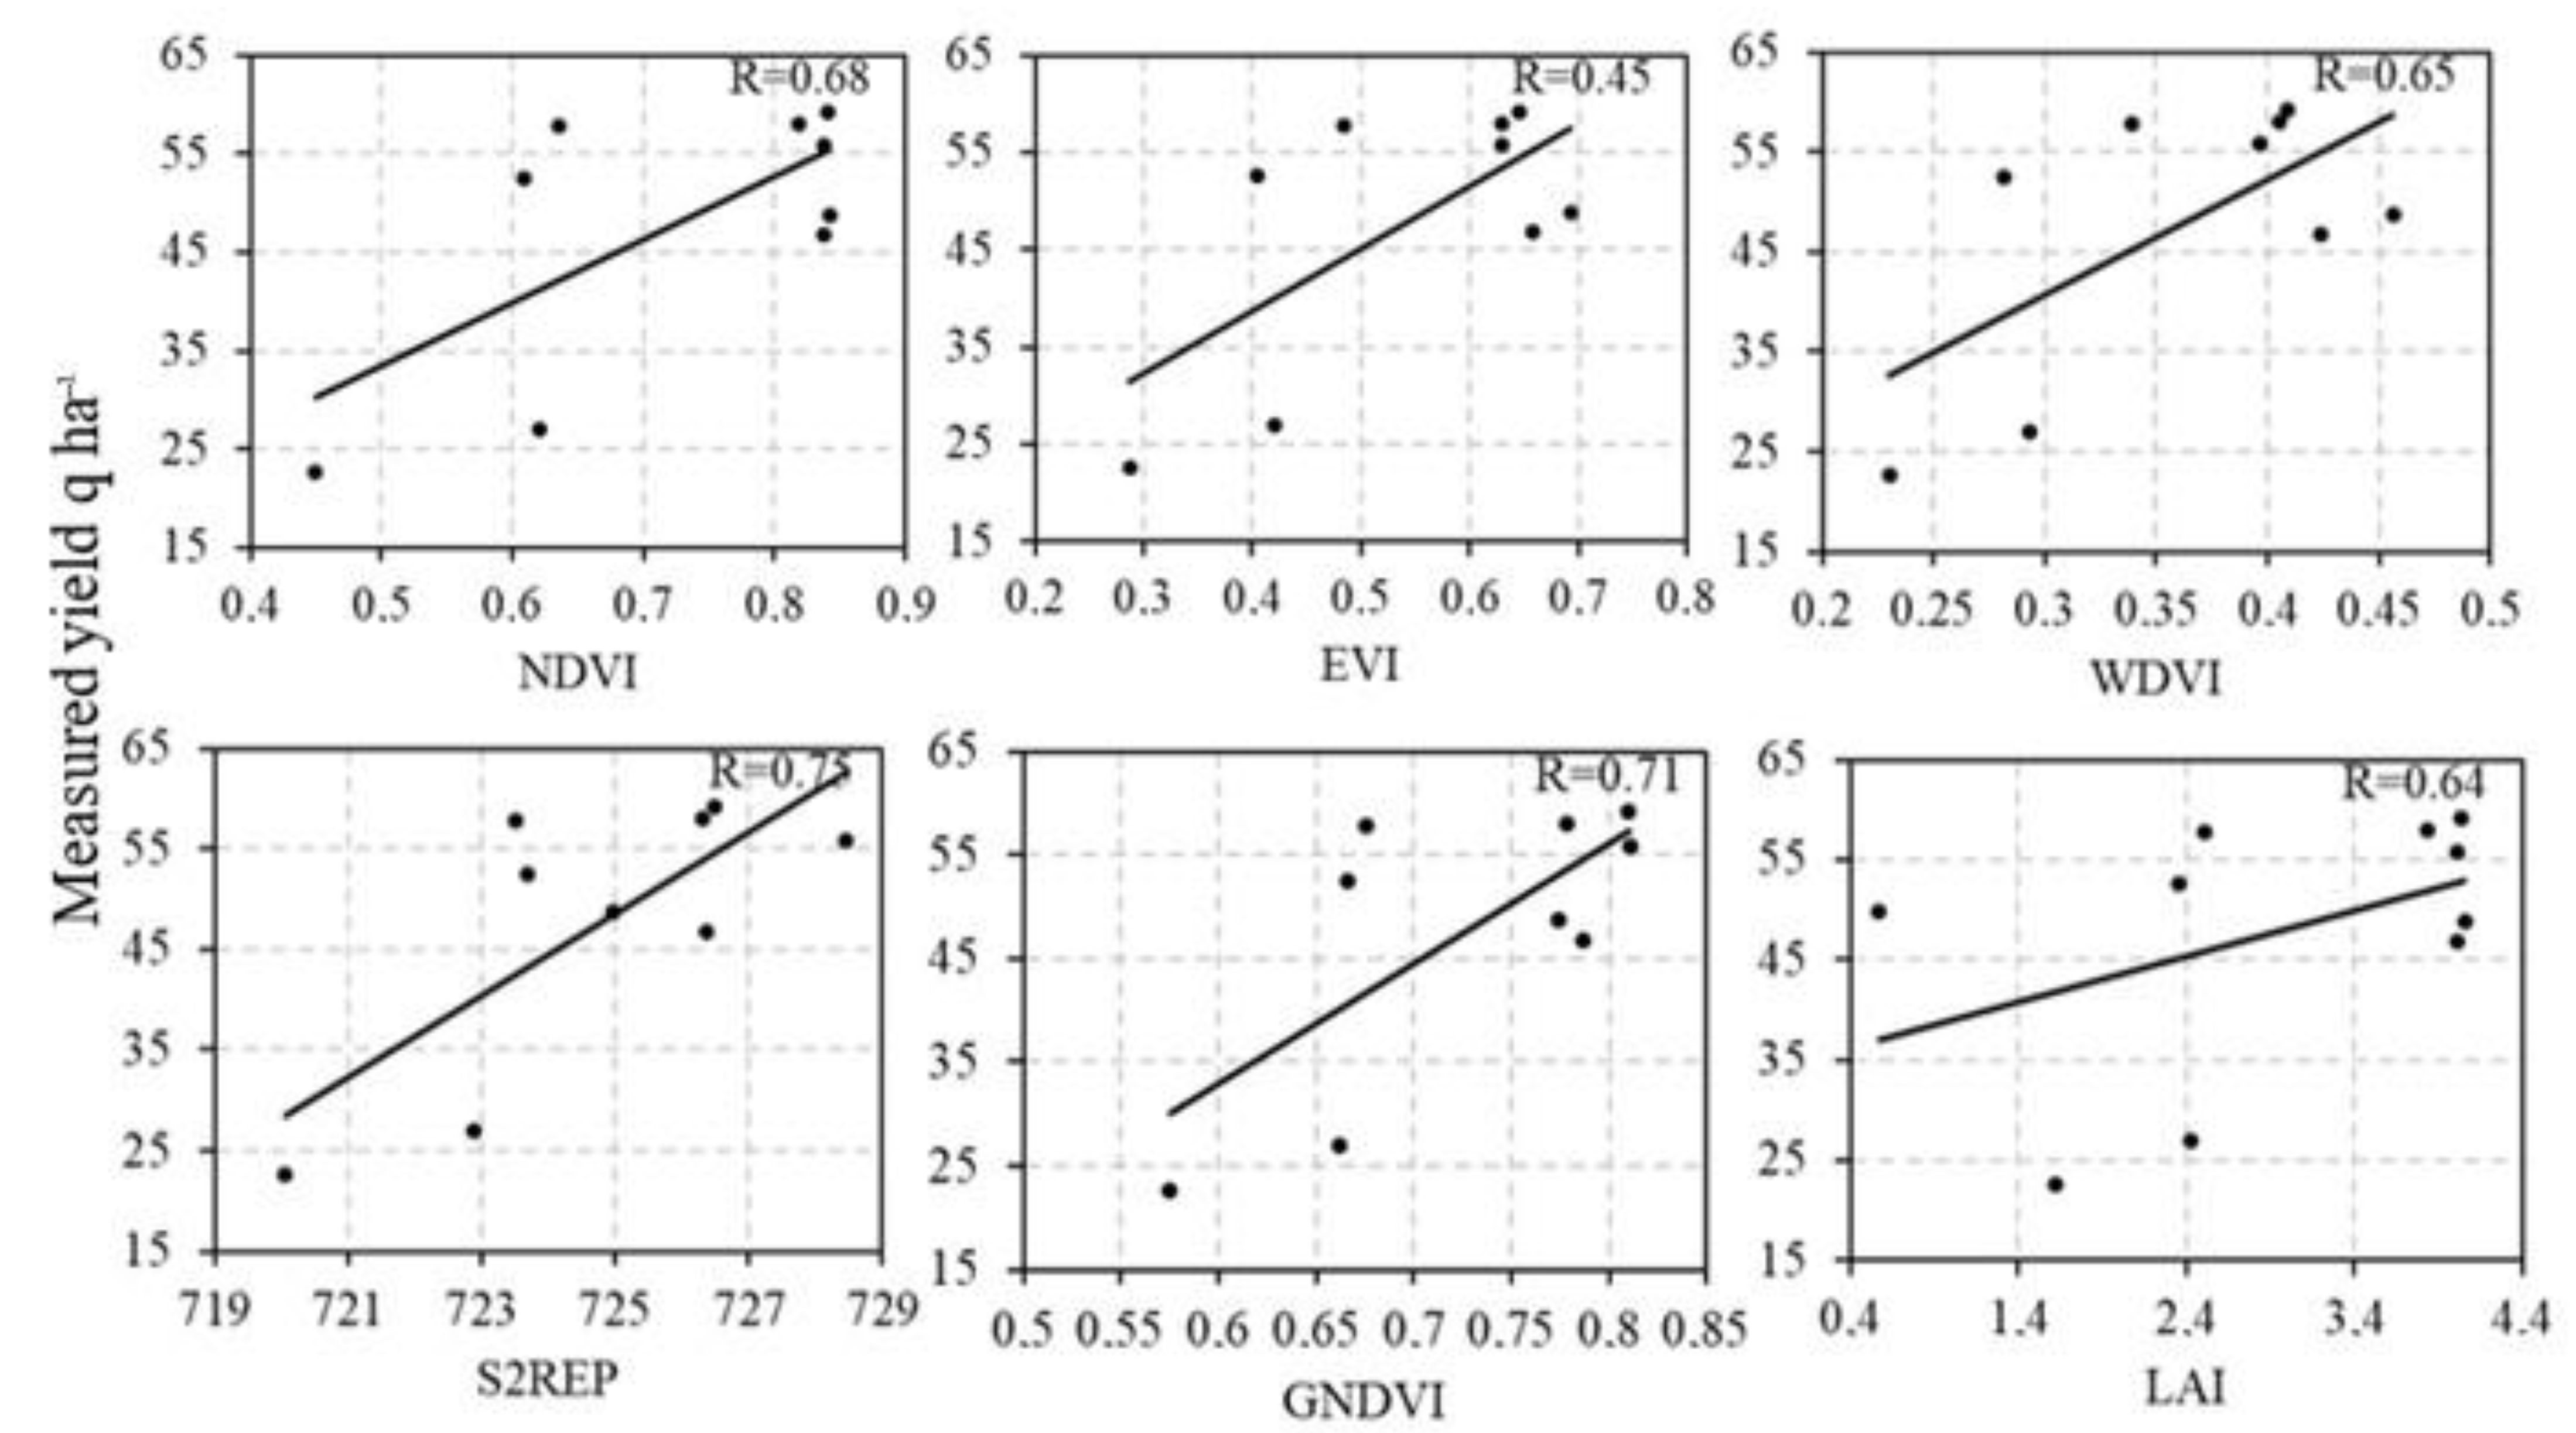
3.1. Sensitive Analysis between Remote Sensing Indices, Phenological Dates, and Crop Yield

Sentinel-2 provided 5-days temporal resolution, allowing the collection of more spectral reflectance values at each stage of durum wheat phenological development. Throughout the phenological stages, the Pearson’s correlation between remote sensing indices and measured yield was examined from November to May. In the study region, generally, the sown stage is in late November, the germination stage is from late November to early December, tillering is from December to early January, jointing is in January, maturity is from late March to the end of April, and harvesting is from May to early June (each stage of growth is depicted in Figure 3). For each six remote sensing indices, the correlation values were calculated for the nine wheat fields for the season 2020/2021 (Table 3 and Figure 4).
The results show that all selected remote sensing indices presented a higher correlation with wheat yield in the tillering and maturity stages of wheat. These periods cover the months of December and April. Specifically, the greatest correlation results were found for the last ten days of December and the first ten days of April. The majority of the annual precipitation fell during the growing season, especially in the tillering period. As a result, there is adequate moisture and favorable weather conditions for developing new tillers. Moreover, the maturity stage refers to the end of the doughy stage, the grain gradually loses moisture, turns a straw color, and becomes exceedingly rigid and mature. Between January and February, the correlation was reduced as that is when the production of tillers ceases and the plant enters the jointing and heading phases. The correlation increases as the heading period progresses until it reaches the mature phase. Harvesting can occur once the plant has achieved full maturity, and the lowest correlation values were recorded. In the last 10 days of the tillering stage (last 10 days of December), the wheat yield was negatively correlated with the remote sensing indices, while in the first days of maturity the wheat yield was positively correlated. The WDVI had the highest correlation coefficient (R) values in the last 10 days of December, with (−0.92) on 22 December and (−0.81) on 27 December. Figure 5 and Figure 6 show the correlation charts between durum wheat yield and remote sensing indices on 22 December 2020 and 1 April 2021.

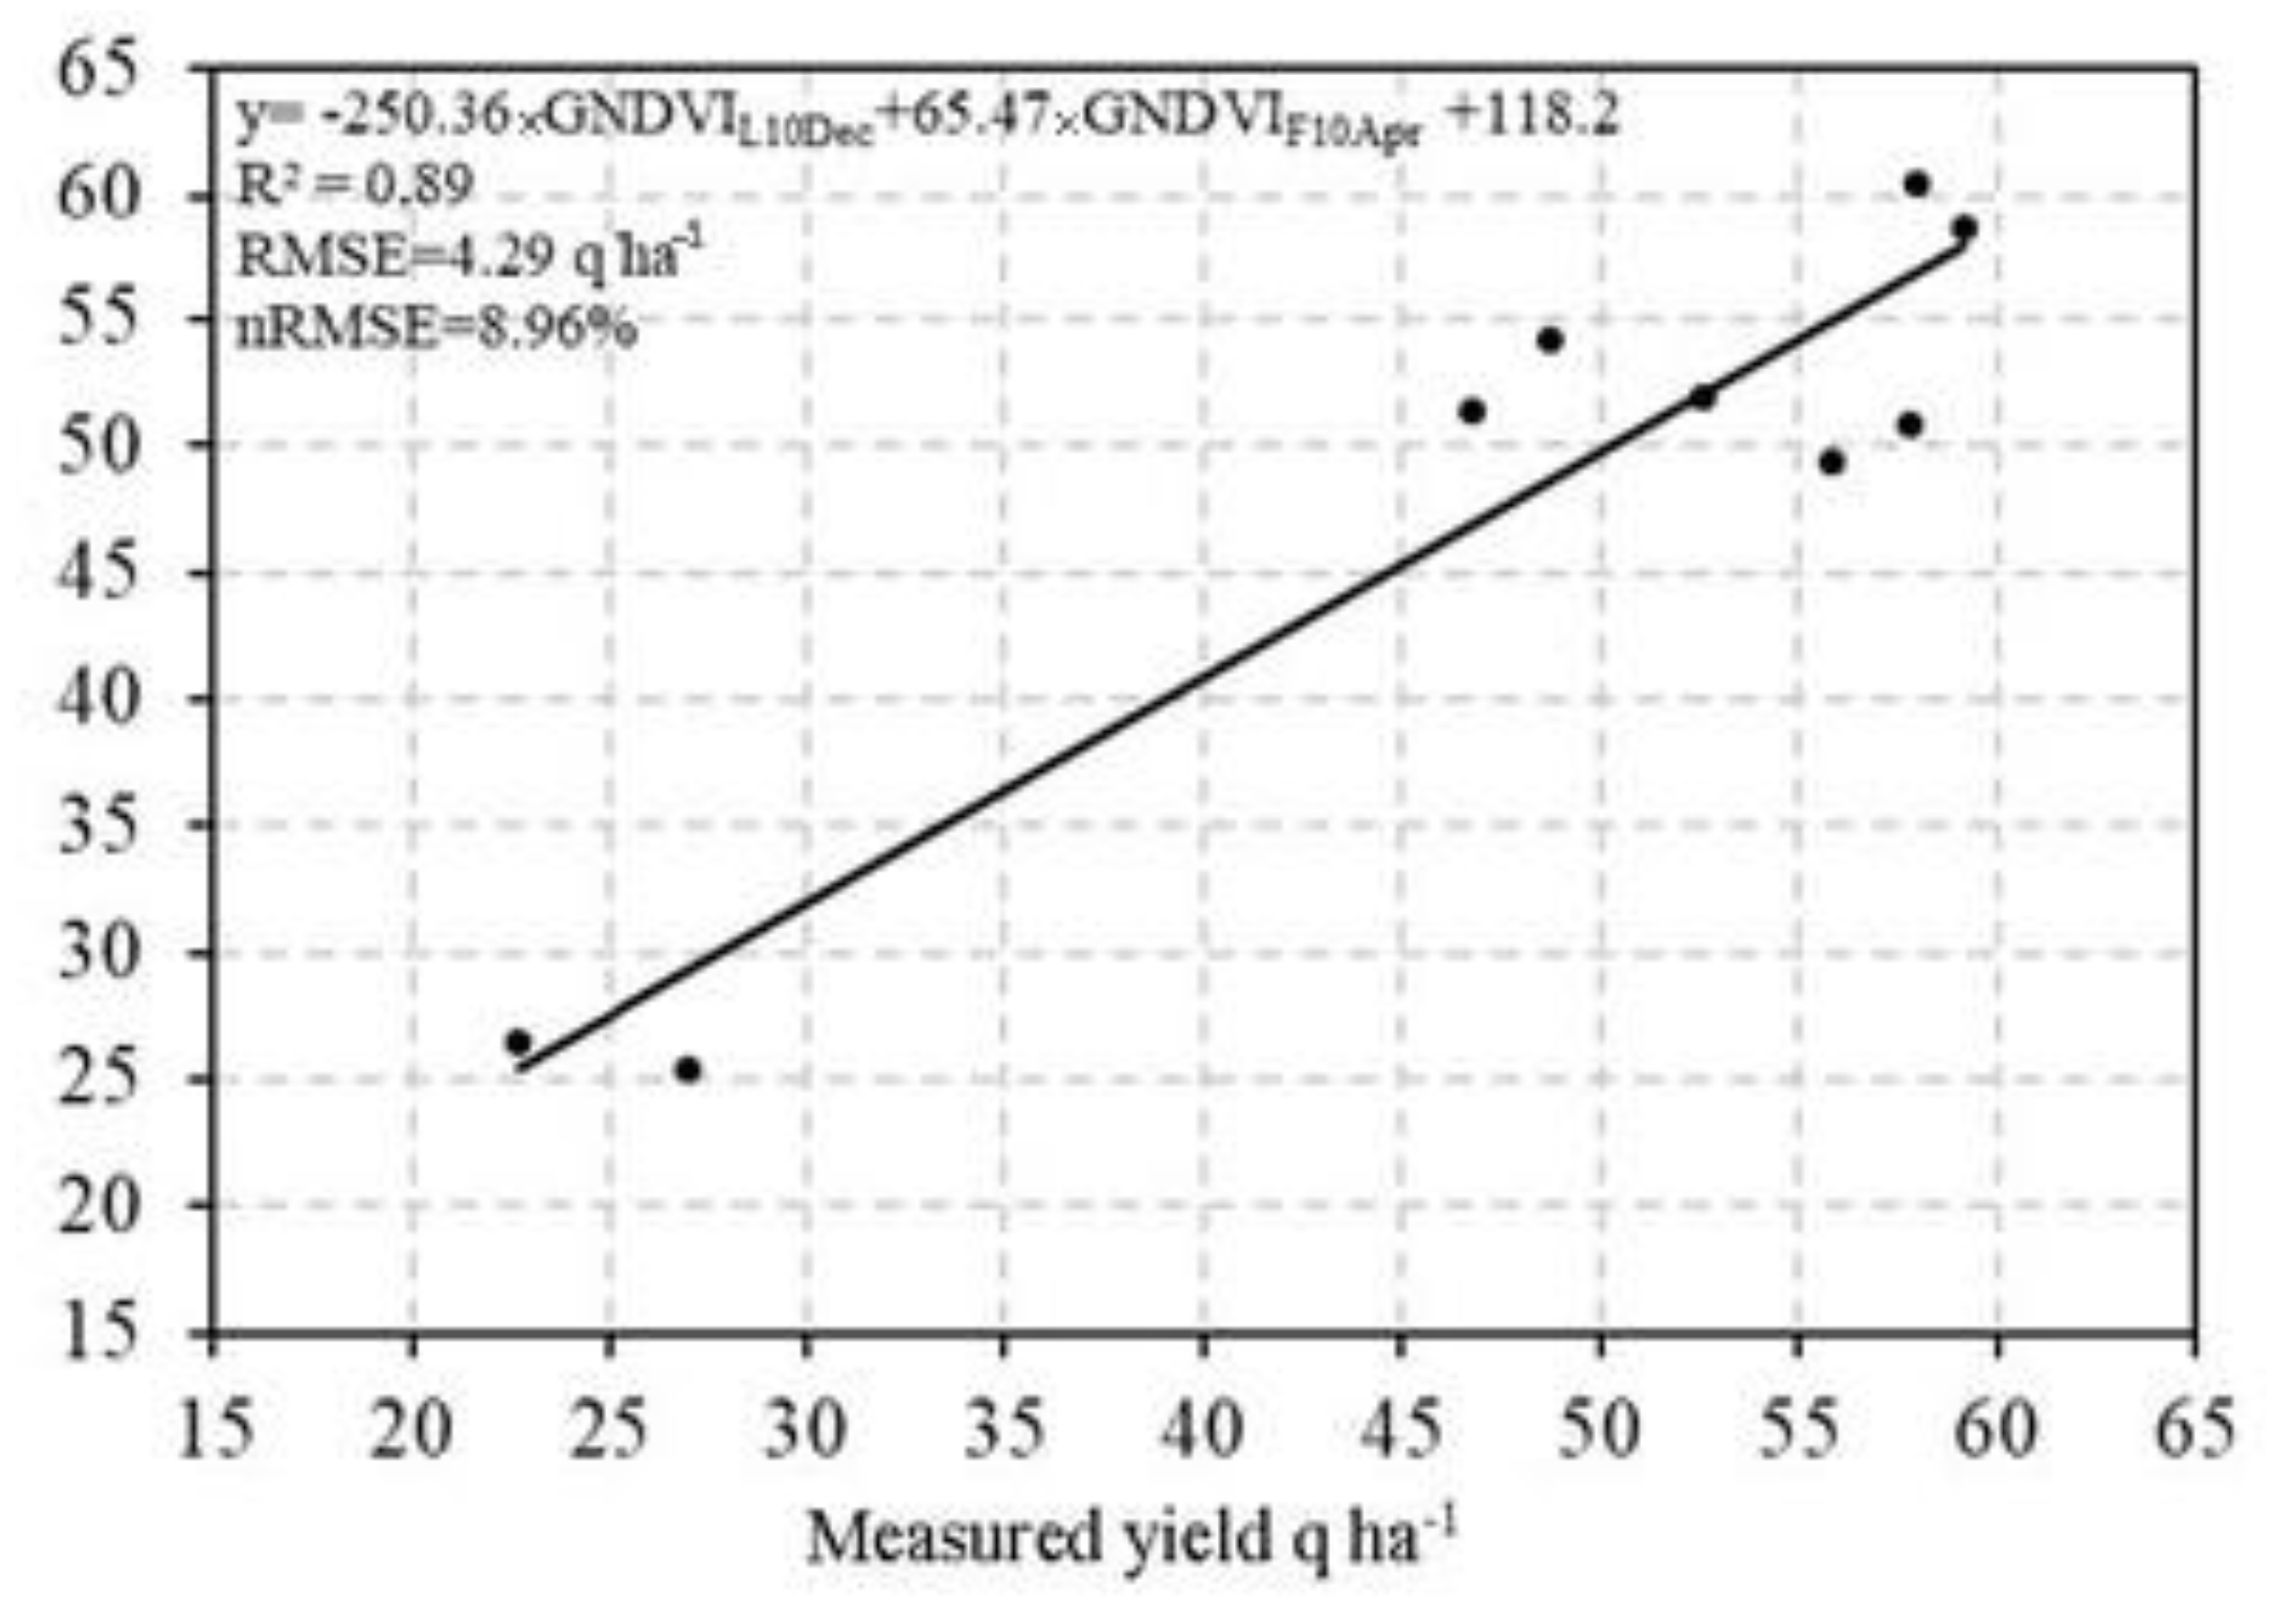
3.2. Yield Estimation Model

In this study, six remote sensing indices were examined to develop the best performing yield estimation model during the growing stages of wheat. Each model used nine wheat fields and six remote sensing indices linked to the tillering (last 10 days of December) and maturity stages (first 10 days of April). The MLR was used as a technique to develop and assess the remote sensing models where the six remote sensing indices were the independent variables and the durum wheat yield was the dependent variable (Table 4). Results show that the six remote sensing models generated had R2 values ranging from 0.64 to 0.89, RMSE between 4.29 and 7.78, and nRMSE from 8.96% to 16.34%. The model with a higher R2 value and lower RMSE value represents the most suitable model for durum wheat yield estimation.
The best model was obtained when using GNDVIL10Dec and GNDVIF10Apr, with R2 = 0.89, RMSE = 4.29, and nRMSE = 8.96%.

3.3. Validation of MLR Model

To assess the estimation performance of the developed model, the predicted and measured yields were compared using the coefficient of determination (R2), root mean square error (RMSE), and normalized RMSE (nRMSE). Model 5 was selected as the optimal estimation model for durum wheat. It has combined variables of GNDVIL10Dec and GNDVIF10Apr. The correlation between measured and retrieved yield was R2 = 0.89 while the root mean square error was RMSE = 4.29 qha−1 (Figure 7).
Based on the model developed for the growing season 2020/2021, the wheat yield for the seasons 2017/2018, 2018/2019, and 2019/2020 were assessed by deducing the estimated yield from Model 5 and the respectively measured yields (Table 5). The results show that the R2 ranged between 0.53 to 0.93 from the season of 2017/2018 to the season of 2019/2020.
The best correlation was found in 2017/2018 (R2 = 0.93 and RMSE = 4.26 q ha−1), while the worst correlation was found in 2019/2020 (R2 = 0.53 and RMSE = 8.78 q ha−1).
The results showed that the accuracy of the wheat yield estimating model, based on remote sensing indices, is satisfied, and can be promoted in actual practice.

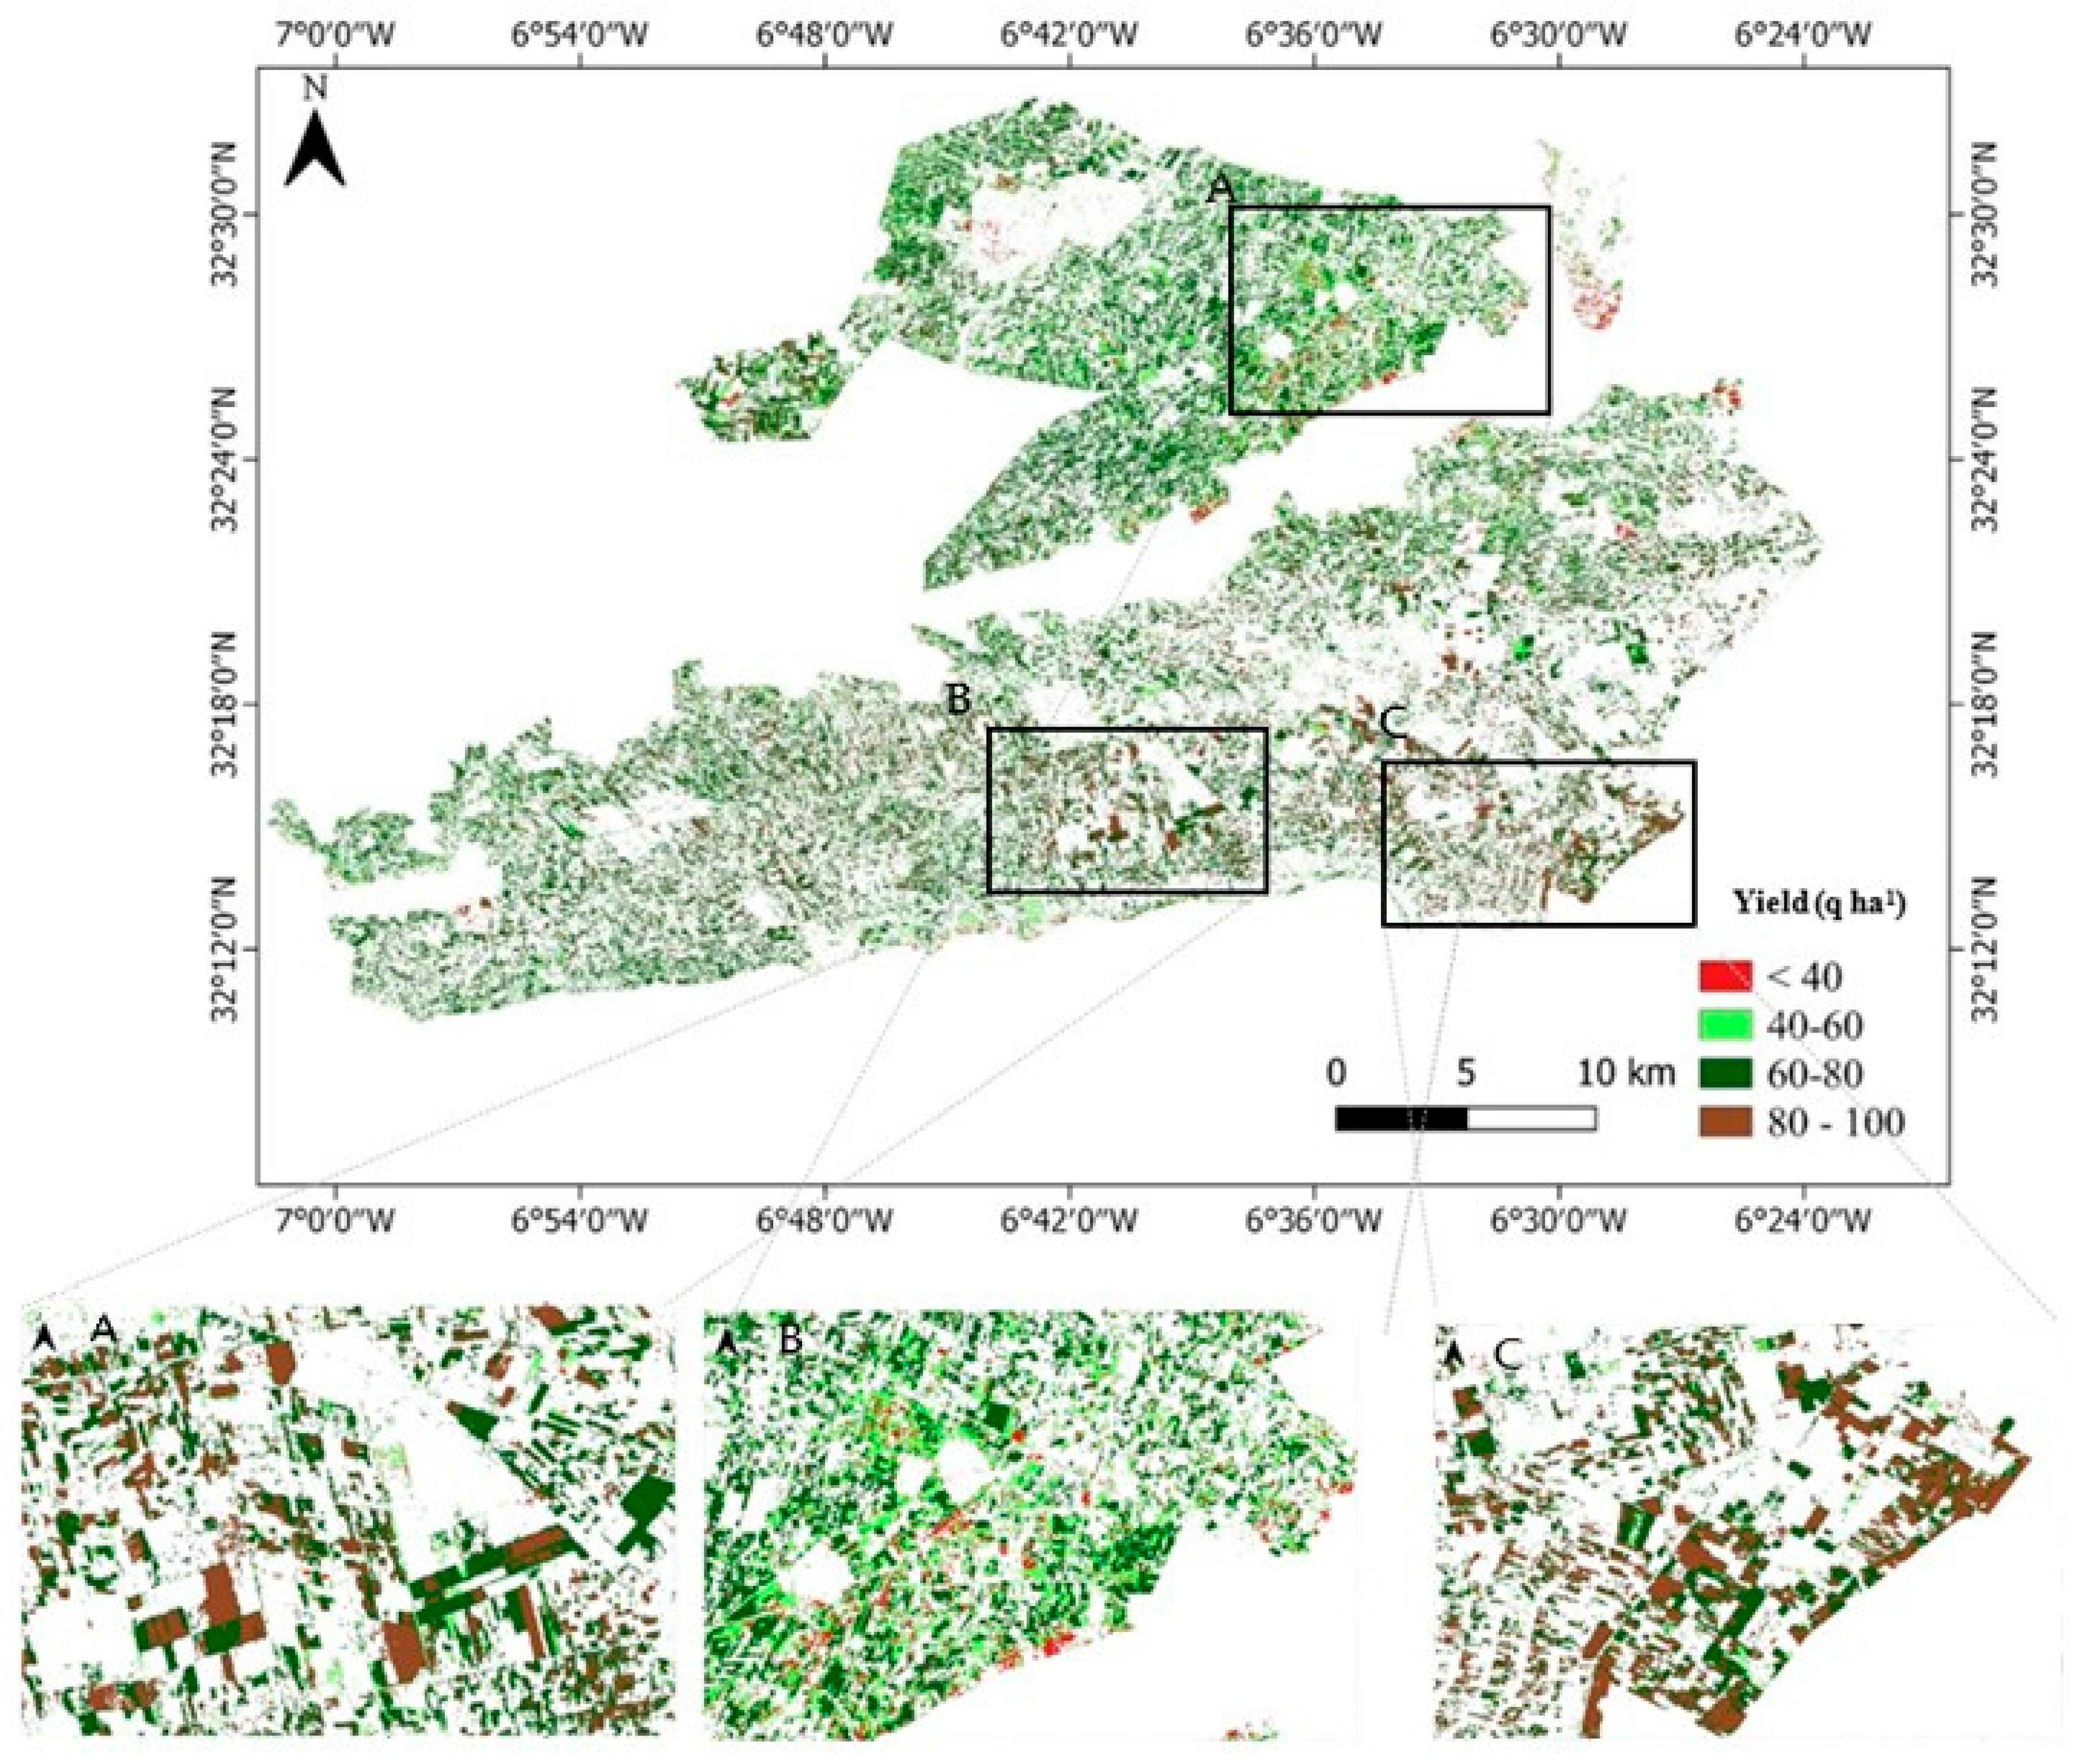
3.4. Extrapolation of Wheat Yields from the Field to the Region Scale

The wheat yield estimation was upscaled to the entire study area using the wheat crop classification map generated from the RF classification. This map was produced from the pixel-based classification of Sentinel-2 time series in the early season of wheat growth (from September 2020 to March 2021). Table 6 shows the overall accuracy as well as the wheat accuracy characteristics of the resulting RF classification.
The most accurate model for predicting durum wheat yield (Model 5) was selected for upscaling and mapping the spatial distribution of wheat yields across the full research area. Figure 8 shows the produced yield map. The extrapolated model produced a yield map that was classified into 4 classes: <40 q ha−1, 40–60 q ha−1, 60–80 q ha−1, and 80–100 q ha−1. The highest yields were concentrated in the Southern bank of the Beni Moussa perimeter, while the lowest yields were recorded in the Northern bank of the Beni Amir perimeter.

4. Discussion

This study paves the way for an approach to estimate yield in the early period of wheat growth using Sentinel-2 time series data and GEE cloud computing. To develop a yield estimation model and extrapolate it from layers to the entire region, this investigation evaluated six vegetation indices and the computational performance of GEE. Six remote sensing indices (NDVI, EVI, WDVI, S2REP, GNDVI, and LAI) were extracted from dense Sentinel-2 time series in this investigation. Using the usual method, this amount is hard to process. In the GEE, on the other hand, the cloud computing process was fast and took only a few seconds.
This survey showed a strong correlation between vegetation indices linked to a specific phenological stage and yield production, which should be exploited in future yield estimation studies.
More specifically, the results of this paper show that in the tillering and maturity stages of wheat, all selected remote sensing indices had a greater correlation with wheat yield. The most significant correlations were discovered during the last ten days of December and the first ten days of April. These findings are in accordance with previous studies. Křen et al. [34] found that the essential period for the creation of spring barley production and grain quality is governed by the growth stages of tillering. Sultana et al. [35] revealed that the correlation between grain yield and NDVI at maturity is stronger than the NDVI values observed at other growth stages.
Based on these two phenological growth stages, the remote sensing indices were examined to develop the model estimation equations using MLR. The model created with the GNDVIL10Dec and GNDVIF10Apr as the independent variables was found to be the most accurate (R2 = 0.89). Naqvi et al. [12] compared the accuracy of different indices (GNDVI, NDVI, EVI, and WDVRI) in district Chakwal, Pakistan, for wheat yield, and the GNDVI gave one of the most accurate results, with R2 = 0.82. The relationship between measured wheat yield and the values extracted from the regression model developed with GNDVIL10Dec and GNDVIF10Apr was examined from the growing season 2017/2018 to 2020/2021. The results reveal that the R2 values ranged from 0.53 to 0.93. The best correlation was found in 2017/2018 (R2 = 0.93 and RMSE = 4.26 q ha−1), while the worst correlation was found in 2019/2020 (R2 = 0.53 and RMSE = 3.04 q ha−1). Cavalaris et al. [36] used NDVI, EVI, NDMI, and NDWI derived from Sentinel-2 for modeling durum wheat yield. The best-performing model was achieved by combining the NDVI integral from 20 April to 31 May as the plant signal, the NDWI on 29 April as the water signal, and the NDWI of bare ground as the soil signal (R2 = 0.629, RMSE = 538 kg/ha), which was lower than our results.
A further result was found in the extrapolation of the model to the TIP region. The map produced showed a heterogeneous distribution of yield between the Northern bank of the Beni Amir perimeter and the Southern bank of the Beni Moussa perimeter. The greatest yields are concentrated in the Southern bank, while the lowest yields are distributed in the northern bank. This difference could be explained by the salinization of soils within the Beni Amir perimeter as a result of the cessation of the use of saline groundwater and surface water of the Oum Er Rabia River, as well as management issues. This result is in accordance with the El Harti et al. [3] study, in which authors stated that the area of Beni Amir soils is affected by salinity due to unsuitable irrigation and intensification of agricultural practices.
We believed that this study can be extended for forecasting the yield of many crops in the early season by thoroughly examining the publicly accessible data from the Sentinel missions of the European Space Agency (ESA) and typical phenological stages of crops.
Furthermore, by accounting for the seasonal characteristics of crops, this study can also be generalized for predicting yields in other countries.

5. Conclusions

The use of remote sensing indices and cloud computing in agriculture policy and practices is still in its early stages in the Tadla Irrigated Perimeter region. This was the first time a Multiple Linear Regression model derived from remote sensing indices through the growth stages of wheat was developed to estimate crop production in the TIP, which is the key wheat-producing region.
To that end, the best and most appropriate indices were initially identified by testing correlations between the six indices and measured durum wheat yield.
This study proved that a strong correlation between vegetation indices and yield was obtained in the tillering and maturity stages of wheat, with R2 values ranging from 0.64 to 0.89.
The best model was obtained when using GNDVI in the tillering and maturity stages of wheat development, having R2 equal to 0.89 and RMSE equal to 4.29 q ha−1.
The proposed method offers a simple and clear way to map the spatial distribution of wheat yield from the field to the regional scale. It employs remote sensing products ready for processing via the cloud, reduces time, and does not require supplementary inputs, allowing it to be extended across the entire national scale.
However, the developed model can be viewed as the first and most basic model for predicting the yield of wheat in the TIP; further variables can be added to the MLR model in the upcoming studies such as temperature, humidity, air temperature, and water temperature.

Author Contributions

Conceptualization, H.S.E.I. and A.E.H.; methodology, H.S.E.I. and A.E.H.; software, H.S.E.I. and L.E.I.; validation, A.E.H.; formal analysis, H.S.E.I.; investigation, H.S.E.I.; resources, H.S.E.I. and A.E.H.; data curation, H.S.E.I. and A.E.H., L.E.I.; writing—original draft preparation, H.S.E.I. writing—review and editing, A.E.H.; visualization, H.S.E.I.; supervision, A.E.H.; project administration, H.S.E.I.; funding acquisition, H.S.E.I. All authors have read and agreed to the published version of the manuscript.

Funding

This research received no external funding.

Data Availability Statement

Not applicable.

Acknowledgments

We would like to acknowledge the Google Earth Engine platform (GEE) platform, powered by Google’s cloud infrastructure for providing public data archives and a rapid and accurate process. We gratefully acknowledge the anonymous referees for their helpful revisions and remarks.

Conflicts of Interest

The authors declare no conflict of interest.

References

  1. Dubey, S.K.; Gavli, A.S.; Yadav, S.K.; Sehgal, S.; Ray, S.S. Remote Sensing-Based Yield Forecasting for Sugarcane (Saccharum officinarum L.) Crop in India. J. Indian Soc. Remote Sens. 2018, 46, 1823–1833. [Google Scholar] [CrossRef]
  2. Mehdaoui, R.; Anane, M. Exploitation of the red-edge bands of Sentinel 2 to improve the estimation of durum wheat yield in Grombalia region (Northeastern Tunisia). Int. J. Remote Sens. 2020, 41, 8984–9006. [Google Scholar] [CrossRef]
  3. El Harti, A.; Lhissou, R.; Chokmani, K.; Ouzemou, J.-e.; Hassouna, M.; Bachaoui, E.M.; El Ghmari, A. Spatiotemporal monitoring of soil salinization in irrigated Tadla Plain (Morocco) using satellite spectral indices. Int. J. Appl. Earth Obs. Geoinf. 2016, 50, 64–73. [Google Scholar] [CrossRef]
  4. Mancosu, N.; Snyder, R.L.; Kyriakakis, G.; Spano, D. Water scarcity and future challenges for food production. Water 2015, 7, 975–992. [Google Scholar] [CrossRef]
  5. Tuvdendorj, B.; Wu, B.; Zeng, H.; Batdelger, G.; Nanzad, L. Determination of appropriate remote sensing indices for spring wheat yield estimation in Mongolia. Remote Sens. 2019, 11, 2568. [Google Scholar] [CrossRef] [Green Version]
  6. Belin, E. International Journal of Remote Early prediction of crop production using drought indices at different time-scales and remote sensing data: Application in the Ebro Valley (north-east Spain). Int. J. Remote Sens. 2007, 27, 37–41. [Google Scholar]
  7. Prasad, A.K.; Chai, L.; Singh, R.P.; Kafatos, M. Crop yield estimation model for Iowa using remote sensing and surface parameters. Int. J. Appl. Earth Obs. Geoinf. 2006, 8, 26–33. [Google Scholar] [CrossRef]
  8. Hassan, S.S.; Goheer, M.A. Modeling and Monitoring Wheat Crop Yield Using Geospatial Techniques: A Case Study of Potohar Region, Pakistan. J. Indian Soc. Remote Sens. 2021, 49, 1331–1342. [Google Scholar] [CrossRef]
  9. Nagy, A.; Szabó, A.; Adeniyi, O.D.; Tamás, J. Wheat yield forecasting for the tisza river catchment using landsat 8 ndvi and savi time series and reported crop statistics. Agronomy 2021, 11, 652. [Google Scholar] [CrossRef]
  10. Arab, S.T.; Noguchi, R.; Matsushita, S.; Ahamed, T. Prediction of grape yields from time-series vegetation indices using satellite remote sensing and a machine-learning approach. Remote Sens. Appl. Soc. Environ. 2021, 22, 100485. [Google Scholar] [CrossRef]
  11. Usman, M.; Jehanzeb, M.; Cheema, M.; Huang, W.; Mahmood, T.; Zaman, M.; Mohsin, M. Evaluation of MODIS and Landsat multiband vegetation indices used for wheat yield estimation in irrigated Indus Basin. Comput. Electron. Agric. 2017, 138, 39–47. [Google Scholar] [CrossRef]
  12. Naqvi, S.M.Z.A.; Tahir, M.N.; Shah, G.A.; Sattar, R.S.; Awais, M. Remote estimation of wheat yield based on vegetation indices derived from time series data of landsat 8 imagery. Appl. Ecol. Environ. Res. 2019, 17, 3909–3925. [Google Scholar] [CrossRef]
  13. Louis, J.; Debaecker, V.; Pflug, B.; Main-Knorn, M.; Bieniarz, J.; Mueller-Wilm, U.; Cadau, E.; Gascon, F. Sentinel-2 SEN2COR: L2A processor for users. ESA-SP 2016, 70, 91. [Google Scholar]
  14. Saad El Imanni, H.; El Harti, A.; Panimboza, J. Investigating Optical and SAR data efficiency in studying the temporal behavior of wheat phenological stages using Google Earth Engine. Agriculture 2022, 40, 24–30. [Google Scholar]
  15. Ren, J.; Chen, Z.; Zhou, Q.; Tang, H. Regional yield estimation for winter wheat with MODIS-NDVI data in Shandong, China. Int. J. Appl. Earth Obs. Geoinf. 2008, 10, 403–413. [Google Scholar] [CrossRef]
  16. Becker-Reshef, I.; Vermote, E.; Lindeman, M.; Justice, C. A generalized regression-based model for forecasting winter wheat yields in Kansas and Ukraine using MODIS data. Remote Sens. Environ. 2010, 114, 1312–1323. [Google Scholar] [CrossRef]
  17. Zhu, B.; Chen, S.; Cao, Y.; Xu, Z.; Yu, Y.; Han, C. A regional maize yield hierarchical linear model combining landsat 8 vegetative indices and meteorological data: Case study in Jilin Province. Remote Sens. 2021, 13, 1–14. [Google Scholar] [CrossRef]
  18. Roznik, M.; Boyd, M.; Porth, L. Improving crop yield estimation by applying higher resolution satellite NDVI imagery and high-resolution cropland masks. Remote Sens. Appl. Soc. Environ. 2022, 25, 100693. [Google Scholar] [CrossRef]
  19. Astaoui, G.; Dadaiss, J.E.; Sebari, I.; Benmansour, S.; Mohamed, E. Mapping Wheat Dry Matter and Nitrogen Content Dynamics and Estimation of Wheat Yield Using UAV Multispectral Imagery Machine Learning and a Variety-Based Approach: Case Study of Morocco. AgriEngineering 2021, 3, 29–49. [Google Scholar] [CrossRef]
  20. Ouzemou, J.E.; El Harti, A.; Lhissou, R.; El Moujahid, A.; Bouch, N.; El Ouazzani, R.; Bachaoui, E.M.; El Ghmari, A. Crop type mapping from pansharpened Landsat 8 NDVI data: A case of a highly fragmented and intensive agricultural system. Remote Sens. Appl. Soc. Environ. 2018, 11, 94–103. [Google Scholar] [CrossRef]
  21. Tripathy, R.; Chaudhari, K.N.; Bairagi, G.D.; Pal, O.; Das, R.; Bhattacharya, B.K. Towards Fine-Scale Yield Prediction of Three Major Crops of India Using Data from Multiple Satellite. J. Indian Soc. Remote Sens. 2021, 50, 271–284. [Google Scholar] [CrossRef]
  22. Liu, H.Q.; Huete, A. Feedback based modification of the NDVI to minimize canopy background and atmospheric noise. IEEE Trans. Geosci. Remote Sens. 1995, 33, 457–465. [Google Scholar] [CrossRef]
  23. Kouadio, L.; Newlands, N.K.; Davidson, A.; Zhang, Y.; Chipanshi, A. Assessing the performance of MODIS NDVI and EVI for seasonal crop yield forecasting at the ecodistrict scale. Remote Sens. 2014, 6, 10193–10214. [Google Scholar] [CrossRef]
  24. Yawata, K.; Yamamoto, T.; Hashimoto, N.; Ishida, R.; Yoshikawa, H. Mixed model estimation of rice yield based on NDVI and GNDVI using a satellite image. In Remote Sensing for Agriculture, Ecosystems, and Hydrology; SPIE: Bellingham, WA, USA, 2019; Volume 1114918, p. 48. [Google Scholar] [CrossRef]
  25. Mercier, A.; Betbeder, J.; Baudry, J.; Le Roux, V.; Spicher, F.; Lacoux, J.; Roger, D.; Hubert-Moy, L. Evaluation of Sentinel-1 & 2 time series for predicting wheat and rapeseed phenological stages. ISPRS J. Photogramm. Remote Sens. 2020, 163, 231–256. [Google Scholar] [CrossRef]
  26. Rouse, J.H. Monitoring Vegetation Systems in the Great Plains with ERTS, 3rd. ed.; NASA: Washington, DC, USA, 1973; Volume 1, pp. 309–317. [Google Scholar]
  27. Huete, A.D. Overview of the radiometric and biophysical performance of the MODIS vegetation indices. Remote Sens. Environ. 2002, 83, 195–213. [Google Scholar] [CrossRef]
  28. Clevers, J.G.P.W. Application of a weighted infrared-red vegetation index for estimating leaf Area Index by Correcting for Soil Moisture. Remote Sens. Environ. 1989, 29, 25–37. [Google Scholar] [CrossRef]
  29. Guyot, G.; Baret, F. Utilisation de la haute resolution spectrale pour suivre l’etat des couverts vegetaux. J. Chem. Inf. Model. 1988, 53, 1689–1699. [Google Scholar]
  30. Tewari, S.; Kulhavý, J.; Rock, B.N.; Hadaš, P. Remote monitoring of forest response to changed soil moisture regime due to river regulation. J. For. Sci. 2003, 49, 429–438. [Google Scholar] [CrossRef] [Green Version]
  31. Lykhovyd, P. Sweet corn yield simulation using normalized difference vegetation index and leaf area index. J. Ecol. Eng. 2020, 21, 228–236. [Google Scholar] [CrossRef]
  32. Breiman, L. Statistical modeling: The two cultures. Stat. Sci. 2001, 16, 199–215. [Google Scholar] [CrossRef]
  33. Adam, E.; Mutanga, O.; Odindi, J.; Abdel-Rahman, E.M. Land-use/cover classification in a heterogeneous coastal landscape using RapidEye imagery: Evaluating the performance of random forest and support vector machines classifiers. Int. J. Remote Sens. 2014, 35, 3440–3458. [Google Scholar] [CrossRef]
  34. Křen, J.; Klem, K.; Svobodová, I.; Míša, P.; Neudert, L. Yield and grain quality of spring barley as affected by biomass formation at early growth stages. Plant Soil Environ. 2014, 60, 221–227. [Google Scholar] [CrossRef] [Green Version]
  35. Sultana, S.R.; Ali, A.; Ahmad, A.; Mubeen, M.; Zia-Ul-Haq, M.; Ahmad, S.; Ercisli, S.; Jaafar, H.Z.E. Normalized difference vegetation index as a tool for wheat yield estimation: A case study from Faisalabad, Pakistan. Sci. World J. 2014, 2014, 725326. [Google Scholar] [CrossRef] [PubMed]
  36. Cavalaris, C.; Megoudi, S.; Maxouri, M.; Anatolitis, K.; Sifakis, M.; Levizou, E.; Kyparissis, A. Modeling of durum wheat yield based on sentinel-2 imagery. Agronomy 2021, 11, 1486. [Google Scholar] [CrossRef]
Figure 1. Location of the study area at the national scale (left). Scene of Tadla Irrigated Perimeter (right).
Agronomy 12 02853 g001
Figure 2. Flowchart of the proposed method for wheat yield estimation using LR, MLR, and Google Earth Engine.
Agronomy 12 02853 g002
Figure 3. Location of durum wheat fields for the year 2020/2021 (left) and phenological stages calendar of wheat (right).
Agronomy 12 02853 g003
Figure 4. Correlations of remote sensing indices with in-situ yield. Durum wheat plant phenological stages.
Agronomy 12 02853 g004
Figure 5. Sensitivity Analysis between Remote Sensing Indices and Crop Yield in the tillering stage (22 December 2020).
Agronomy 12 02853 g005
Figure 6. Sensitivity Analysis between Remote Sensing Indices and Crop Yield in the maturity stage (1 April 2021).
Agronomy 12 02853 g006
Figure 7. Relationship between measured and retrieved wheat yield.
Agronomy 12 02853 g007
Figure 8. Wheat yield map (q ha−1) of TIP region based on model 5, for the 2020/2021 agricultural season.
Agronomy 12 02853 g008
Table 1. Characteristics of Sentinel-2 MSI L2A images.
BandDescriptionResolutionWavelength
B1Aerosols60 m443.9 nm (S2A)/442.3 nm (S2B)
B2Blue10 m496.6 nm (S2A)/492.1 nm (S2B)
B3Green10 m560 nm (S2A)/559 nm (S2B)
B4Red10 m664.5 nm (S2A)/665 nm (S2B)
B5Red Edge 120 m703.9 nm (S2A)/703.8 nm (S2B)
B6Red Edge 220 m740.2 nm (S2A)/739.1 nm (S2B)
B7Red Edge 320 m782.5 nm (S2A)/779.7 nm (S2B)
B8NIR10 m835.1 nm (S2A)/833 nm (S2B)
B8ARed Edge 420 m864.8 nm (S2A)/864 nm (S2B)
B9Water vapor60 m945 nm (S2A)/943.2 nm (S2B)
B11SWIR 120 m1613.7 nm (S2A)/1610.4 nm (S2B)
B12SWIR 220 m2202.4 nm (S2A)/2185.7 nm (S2B)
Table 3. Pearson’s Correlation coefficient between remote sensing indices and wheat yield in the different phenological stages.
Agronomy 12 02853 i001
Phenological StagesDatesNDVIEVIWDVIS2REPGNDVILAI
Germination22/11/20200.540.350.18−0.340.370.52
Tillering02/12/2020−0.92−0.79−0.10.01−0.89−0.92
07/12/20200.78−0.25−0.87−0.670.9−0.59
12/12/2020−0.57−0.76−0.70.49−0.5−0.58
22/12/2020−0.84−0.9−0.92−0.54−0.87−0.85
27/12/2020−0.7−0.79−0.81−0,57−0.77−0.7
01/01/20210.25−0.66−0.73−0.75−0.54−0.5
Jointing26/01/2021−0.25−0.27−0.27−0.56−0.33−0.22
31/01/2021−0.25−0.220.04−0.5−0.31−0.23
Heading10/02/2021−0.280.010.11−0.4−0.26−0.25
15/02/2021−0.04−0.16−0.22−0.3−0.03−0.05
12/03/20210.230.340.340.430.410.26
22/03/20210.50.570.530.590.60.5
Maturity01/04/20210.680.450.650.750.710.64
Harvest06/05/2021−0.030.470.62−0.440.19−0.02
Table 4. Yield estimation models for durum wheat using remote sensing indices.
MLR ModelsEquationsR2RMSE (qha−1)nRMSE
(%)
Model 1y = −118.86 × NDVIL10Dec + 39 × NDVIF10Apr + 61.260.874.699.84
Model 2y = −229.12 × EVIL10Dec + 26.47 × EVIF10Apr + 74.930.884.439.31
Model 3y = −509.43 × WDVIL10Dec + 34.73 × WDVIF10Apr + 110.350.874.599.64
Model 4y = −2.25 × S2REPL10Dec + 3.45 × WDVIF10Apr − 843.820.647.7816.34
Model 5y = −250.36 × GNDVIL10Dec + 65.47 × GNDVIF10Apr + 118.20.894.298.96
Model 6y = −37.13 × LAIL10Dec + 5.30 × LAIF10Apr + 79.90.845.1710.86
Table 5. The comparison of wheat yield in situ measured and retrieved from remote sensing indices in 2017/2018, 2018/2020, 2019/2020, and 2020/2021.
Model Yield Measured/Retrieved (qha−1)R2RMSE
Model
5
2020/2021Measured
Retrieved
27
25.9
22.6
26.7
57.7
52.9
48.8
54.8
46.8
52.2
55.8
46.6
59.1
59
58
59.3
52.5
51
0.894.26
2019/2020Measured
Retrieved
33
32.7
66
58
43
39.1
55
63.3
55
72.5
47
62.46
0.538.78
2018/2019Measured
Retrieved
54
60
53
62
44
51
43
55
0.795.87
2017/2018Measured
Retrieved
65
64.1
53
44
32
30.9
62
62.3
0.933.04
Table 6. Overall accuracy, Kappa index, wheat user and producer accuracy, and F1 score of the classification result.
Accuracy IndexAccuracy Values
Overall accuracy93.82%
Kappa index0.92
Wheat user accuracy90.46%
Wheat producer accuracy94.96%
Wheat F1 score92.66%
Publisher’s Note: MDPI stays neutral with regard to jurisdictional claims in published maps and institutional affiliations.

