
Effects of Various Quantities of Three Irrigation Water Types on Yield and Fruit Quality of ‘Succary’ Date Palm


Abstract
:1. Introduction
2. Materials and Methods
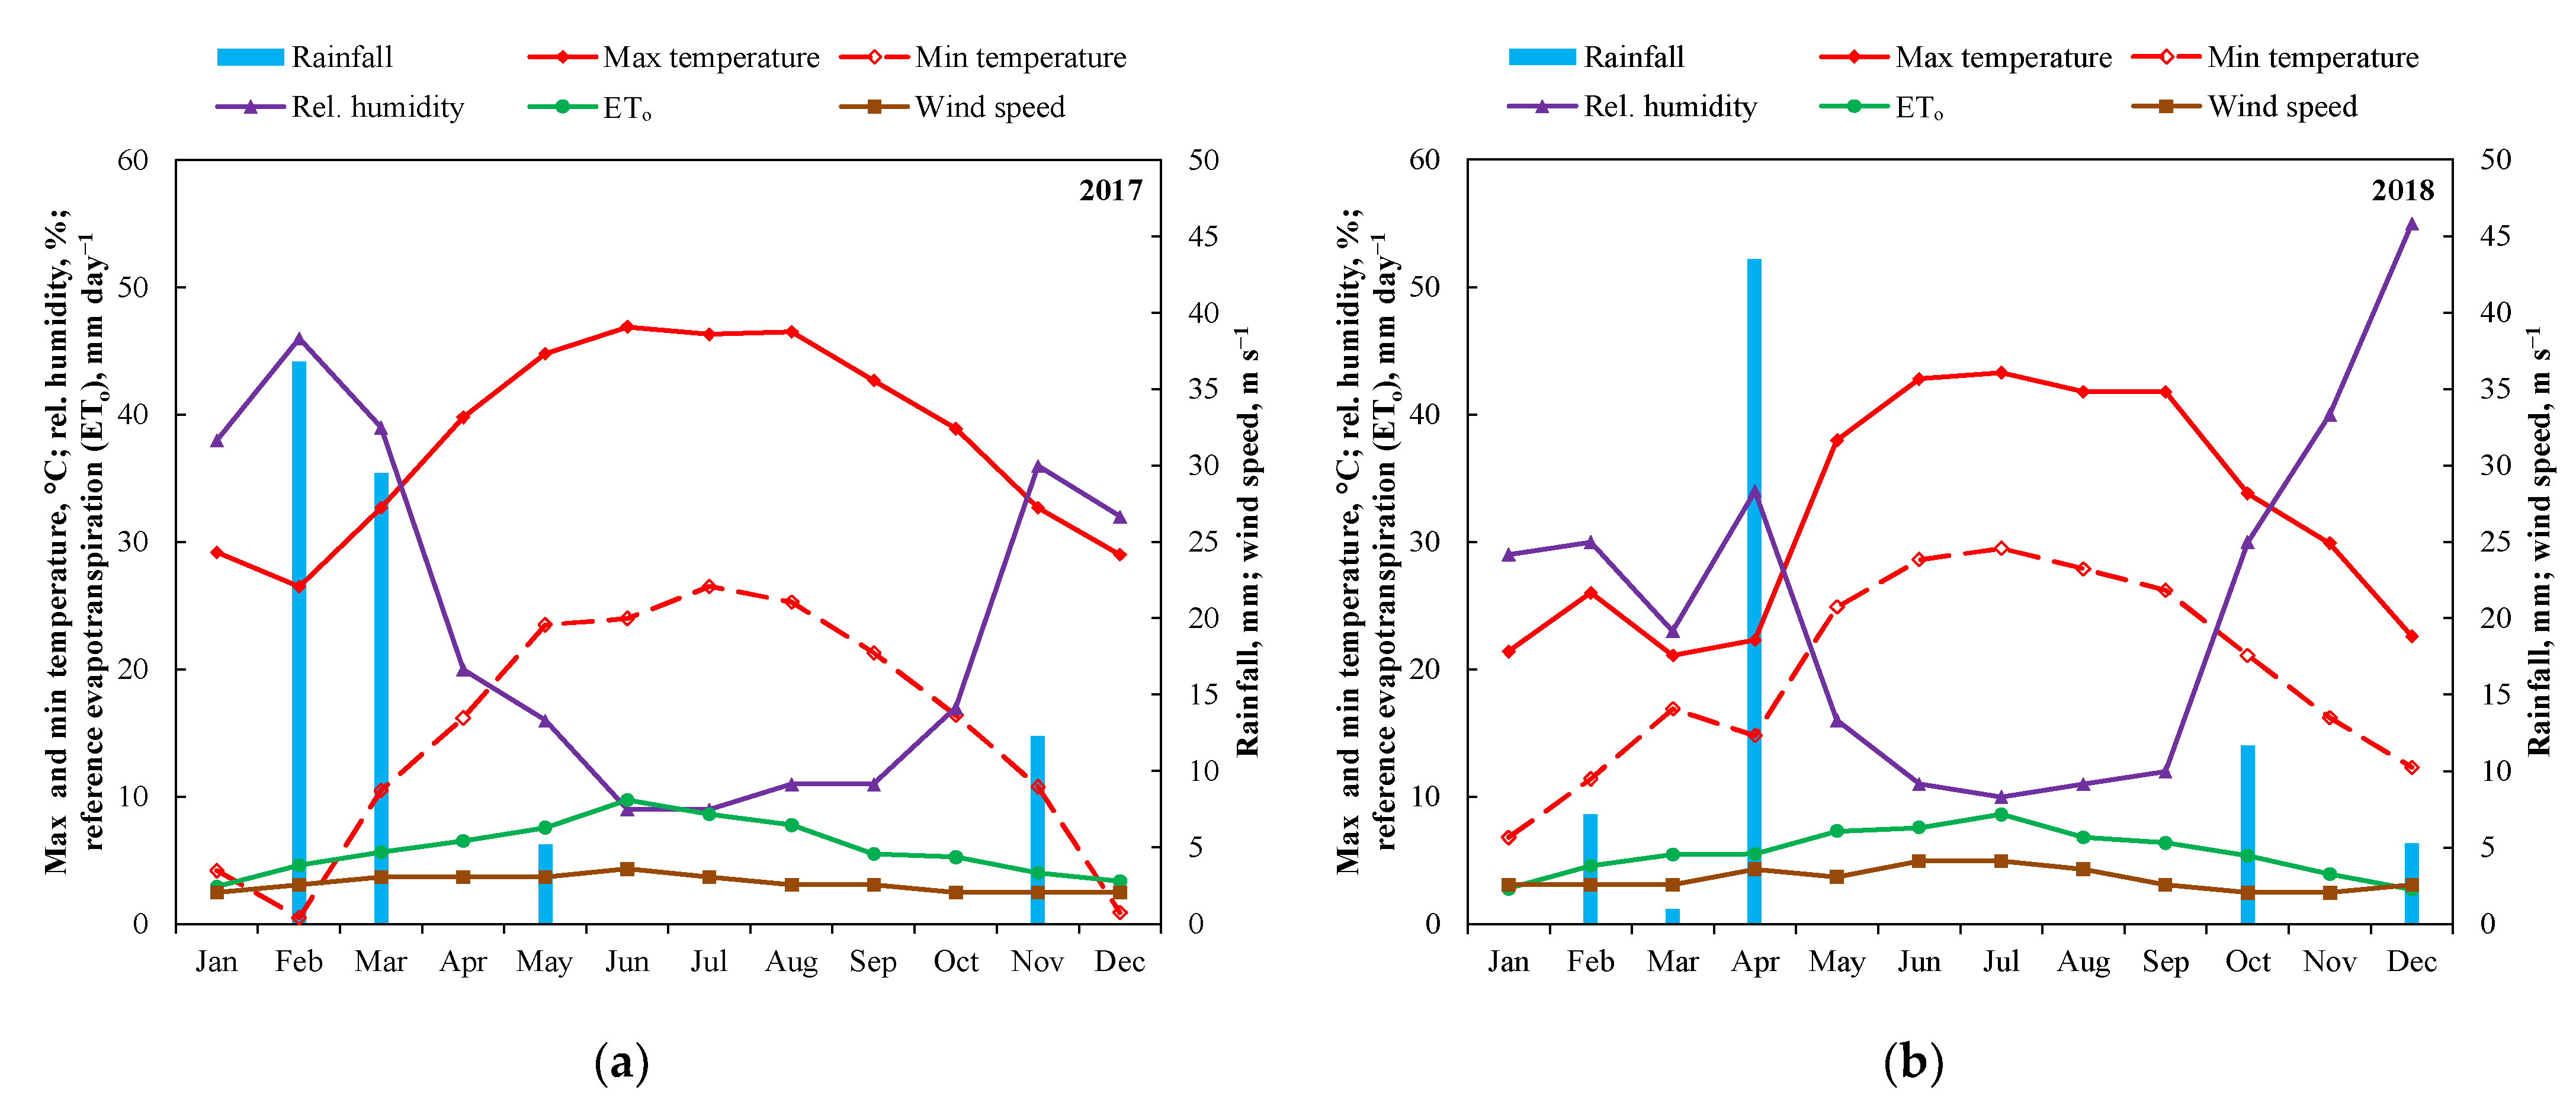
2.1. Site Description
2.2. Experimental Design and Implementation
2.3. Water Content and Soil Salinity
2.4. Yield and Water Productivity
2.5. Fruit Quality
2.6. Statistical Analysis
3. Results
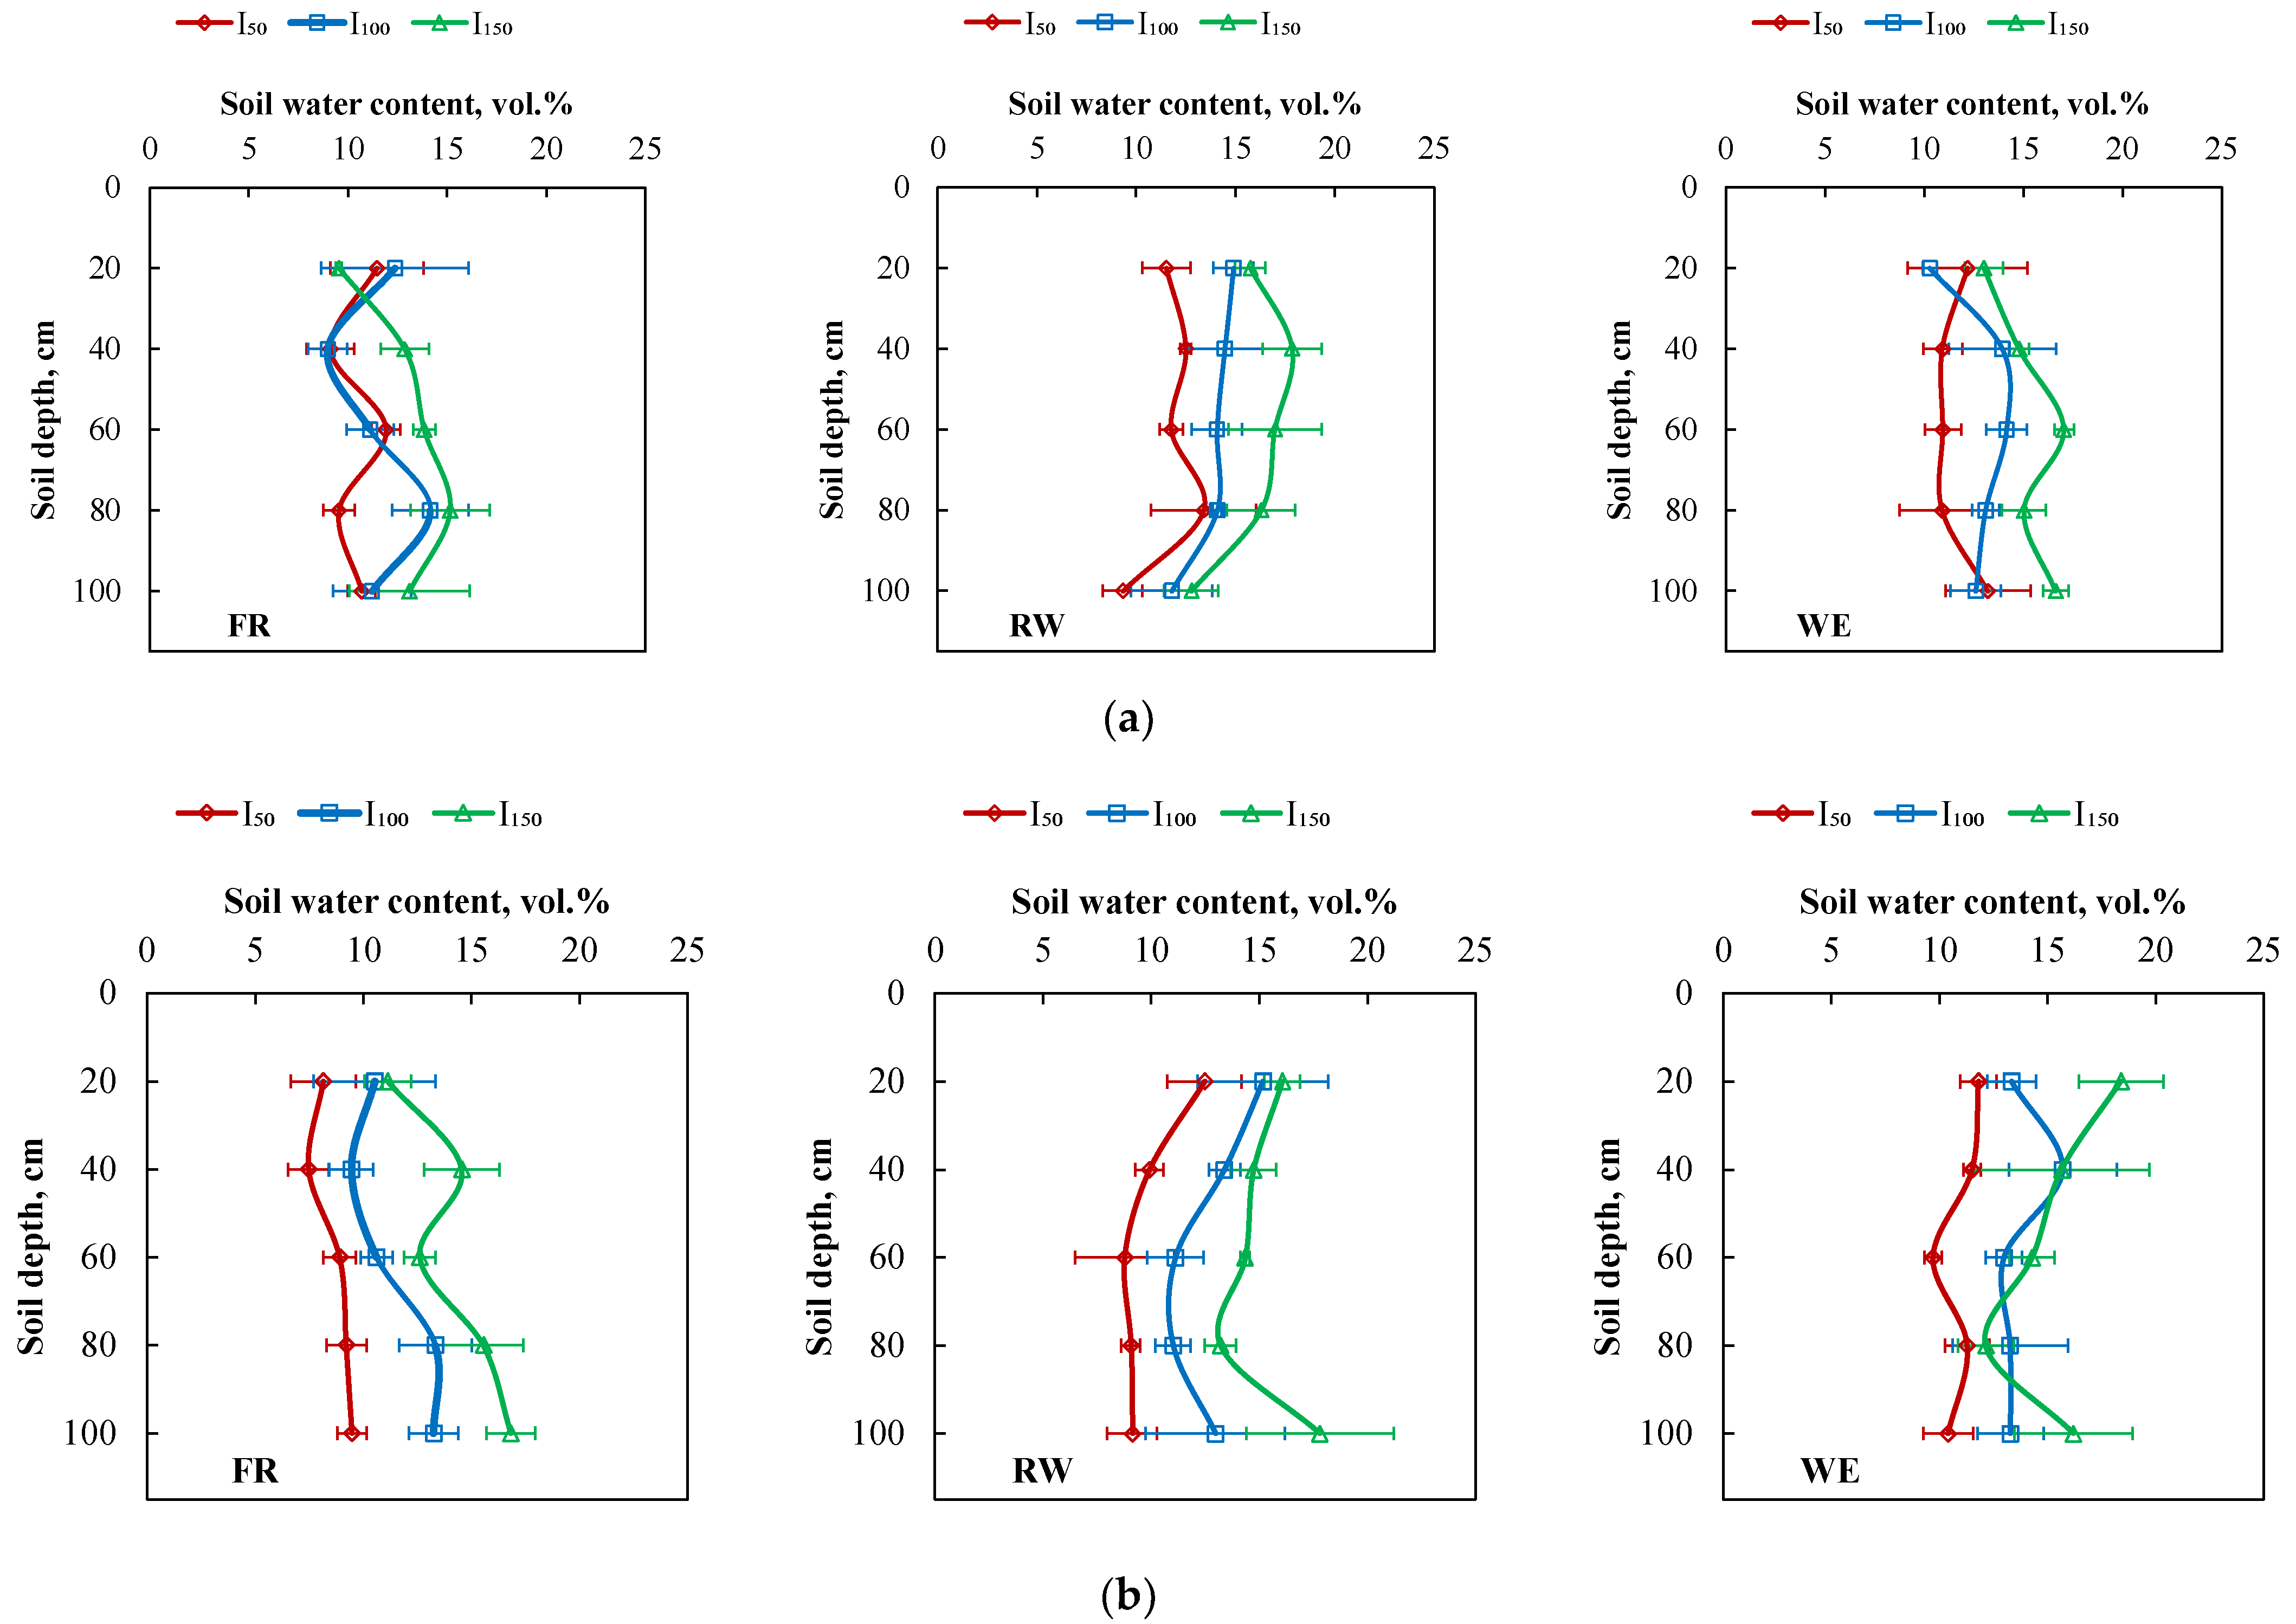
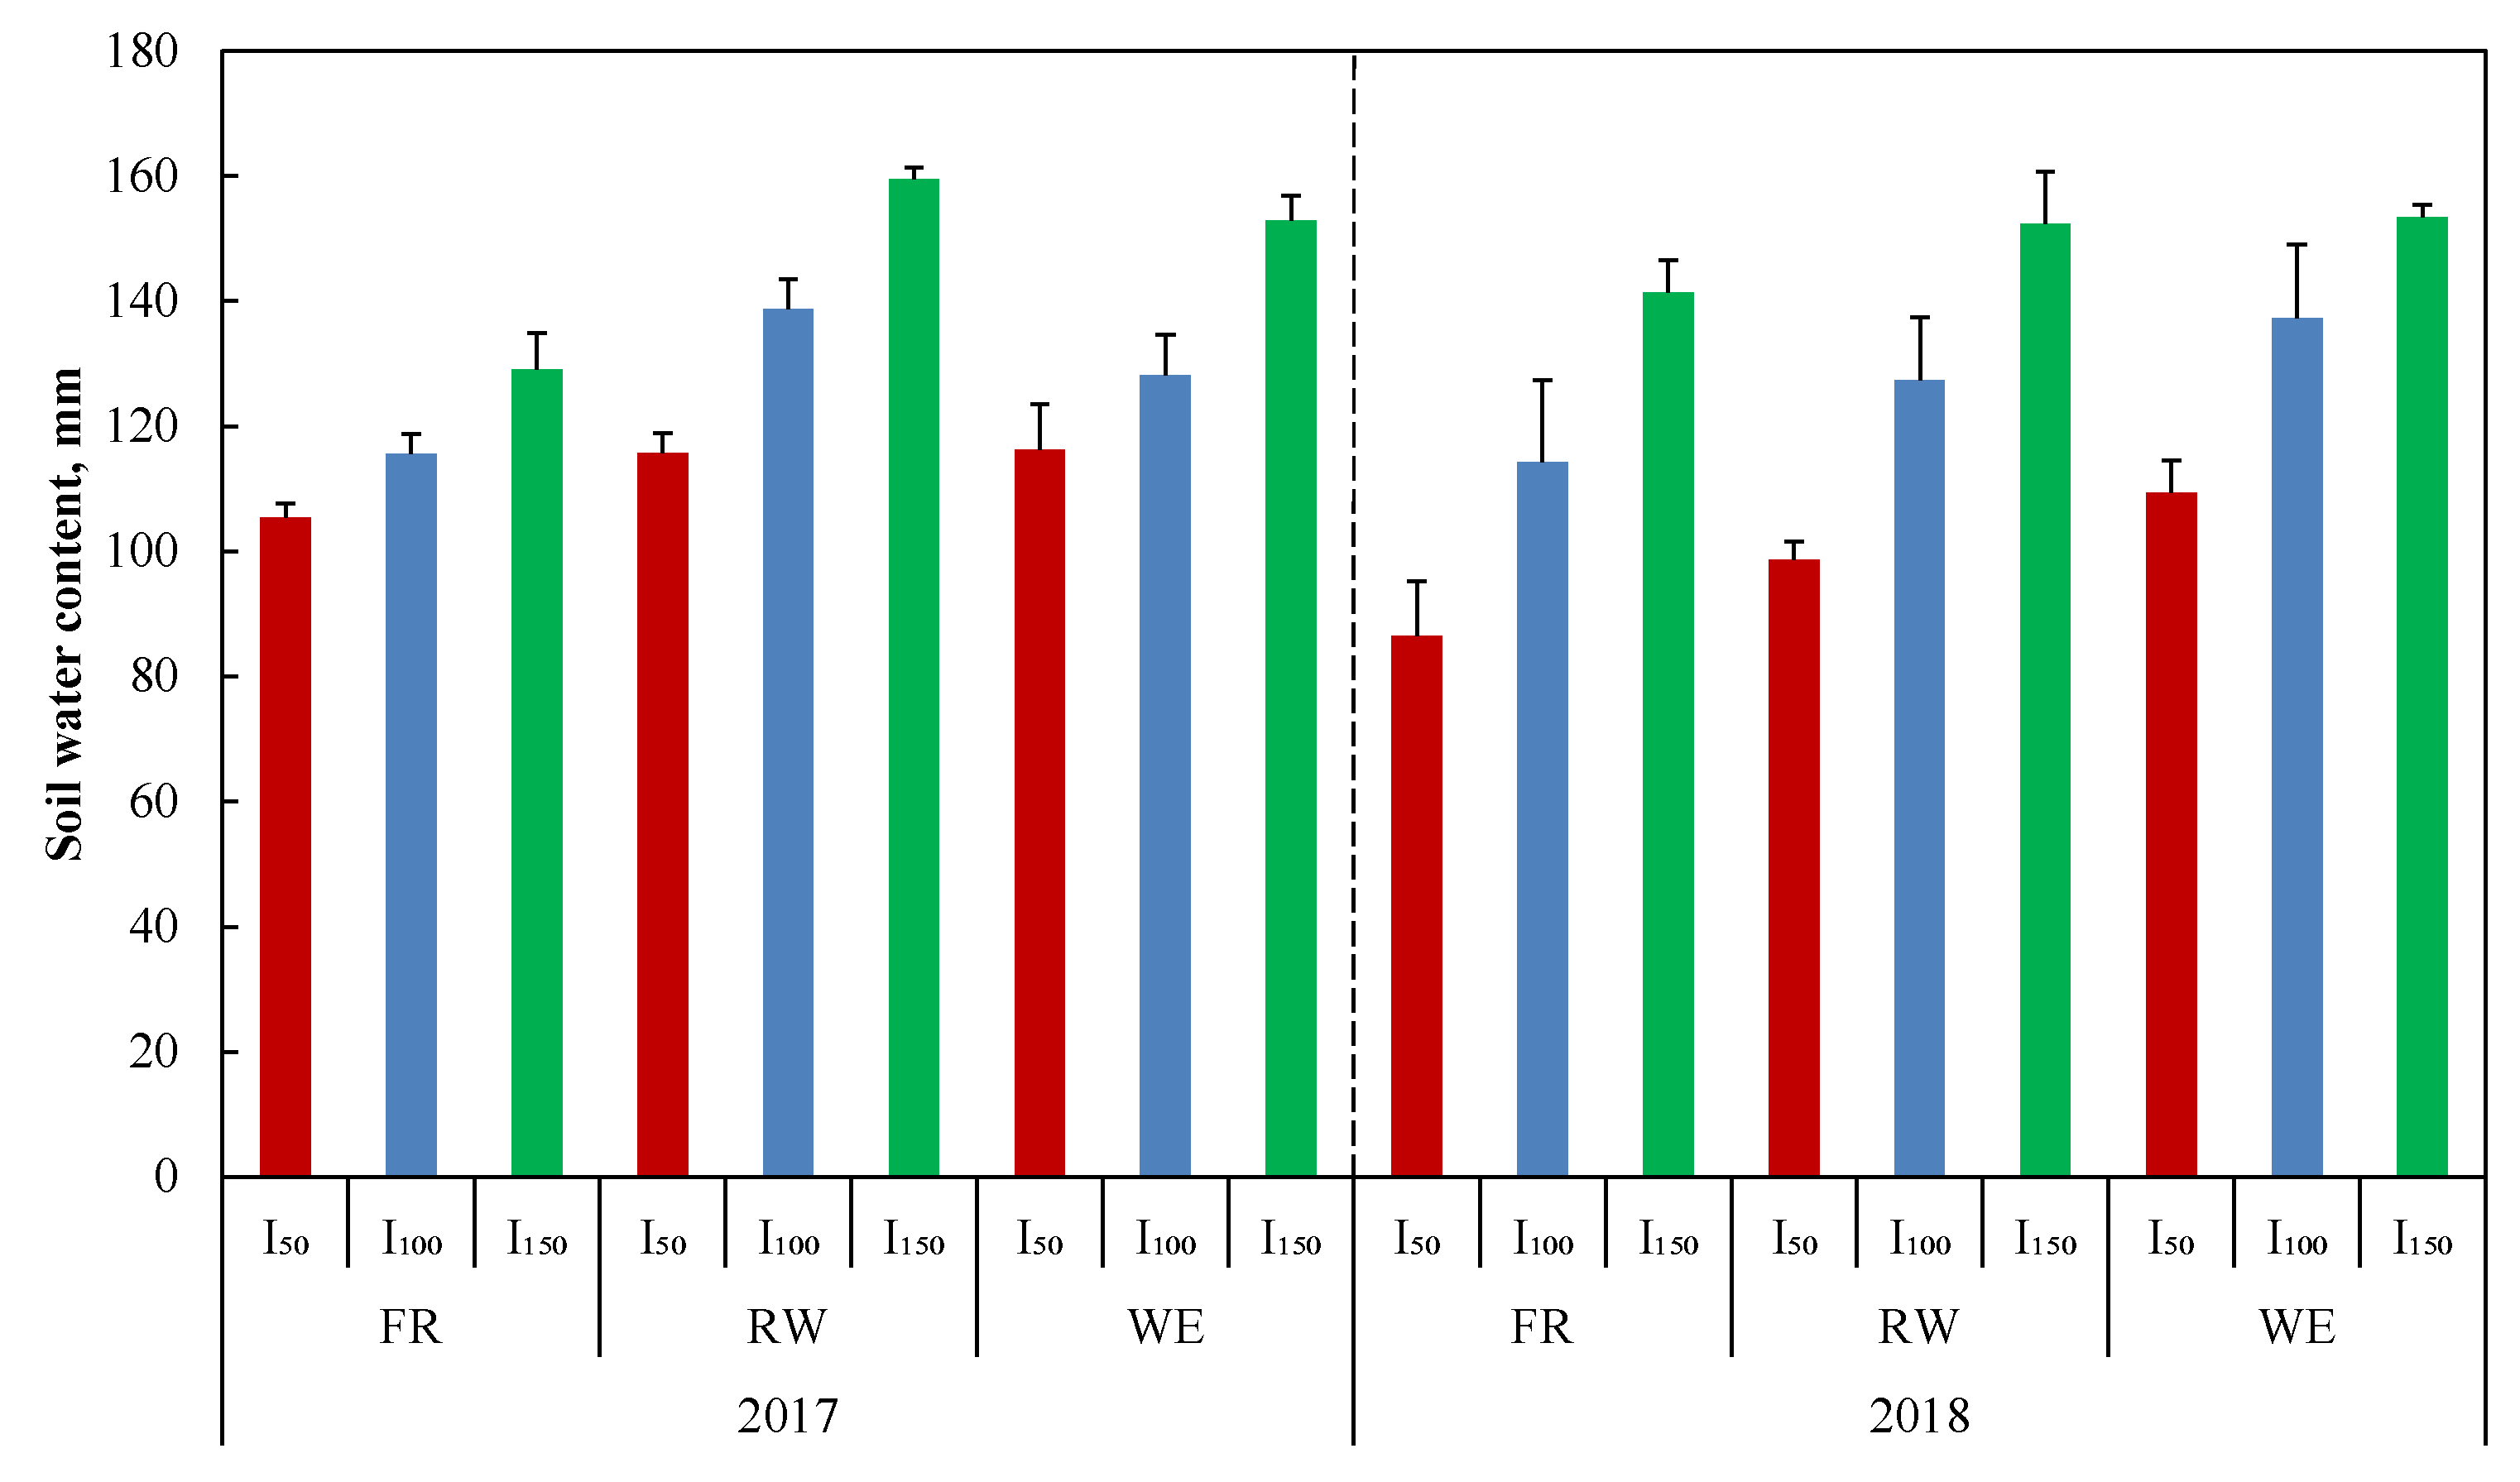
3.1. Soil Water
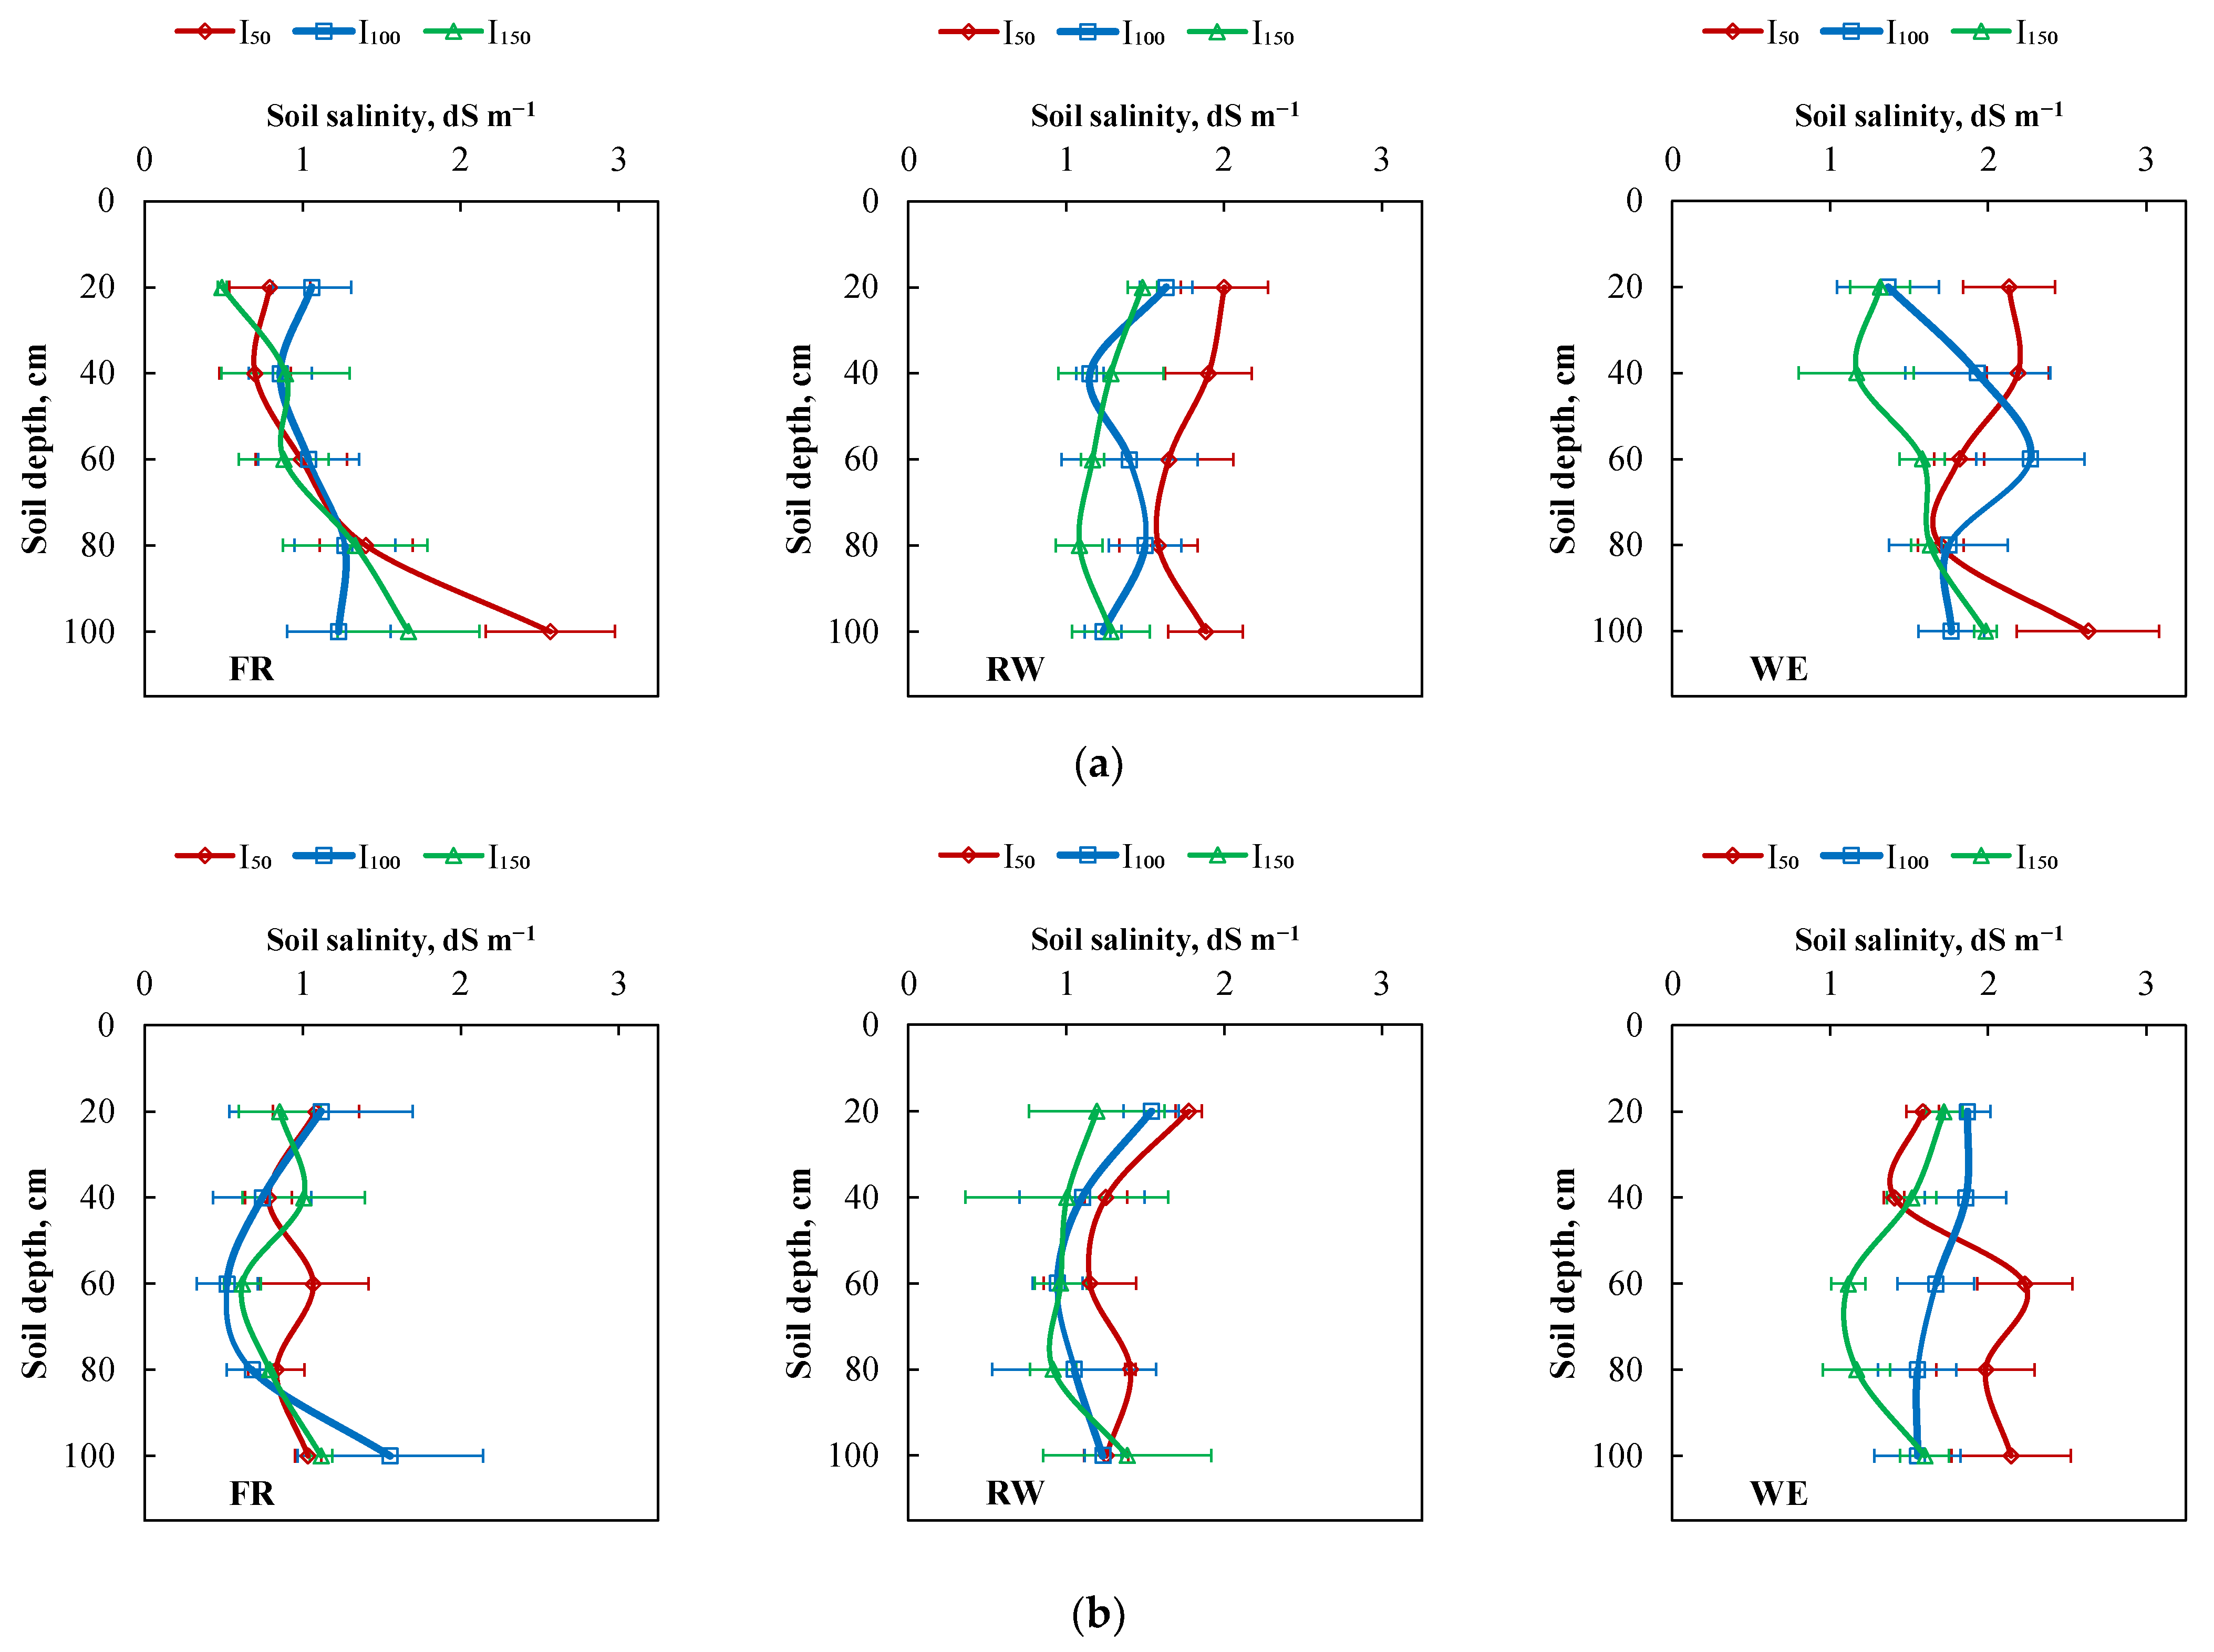
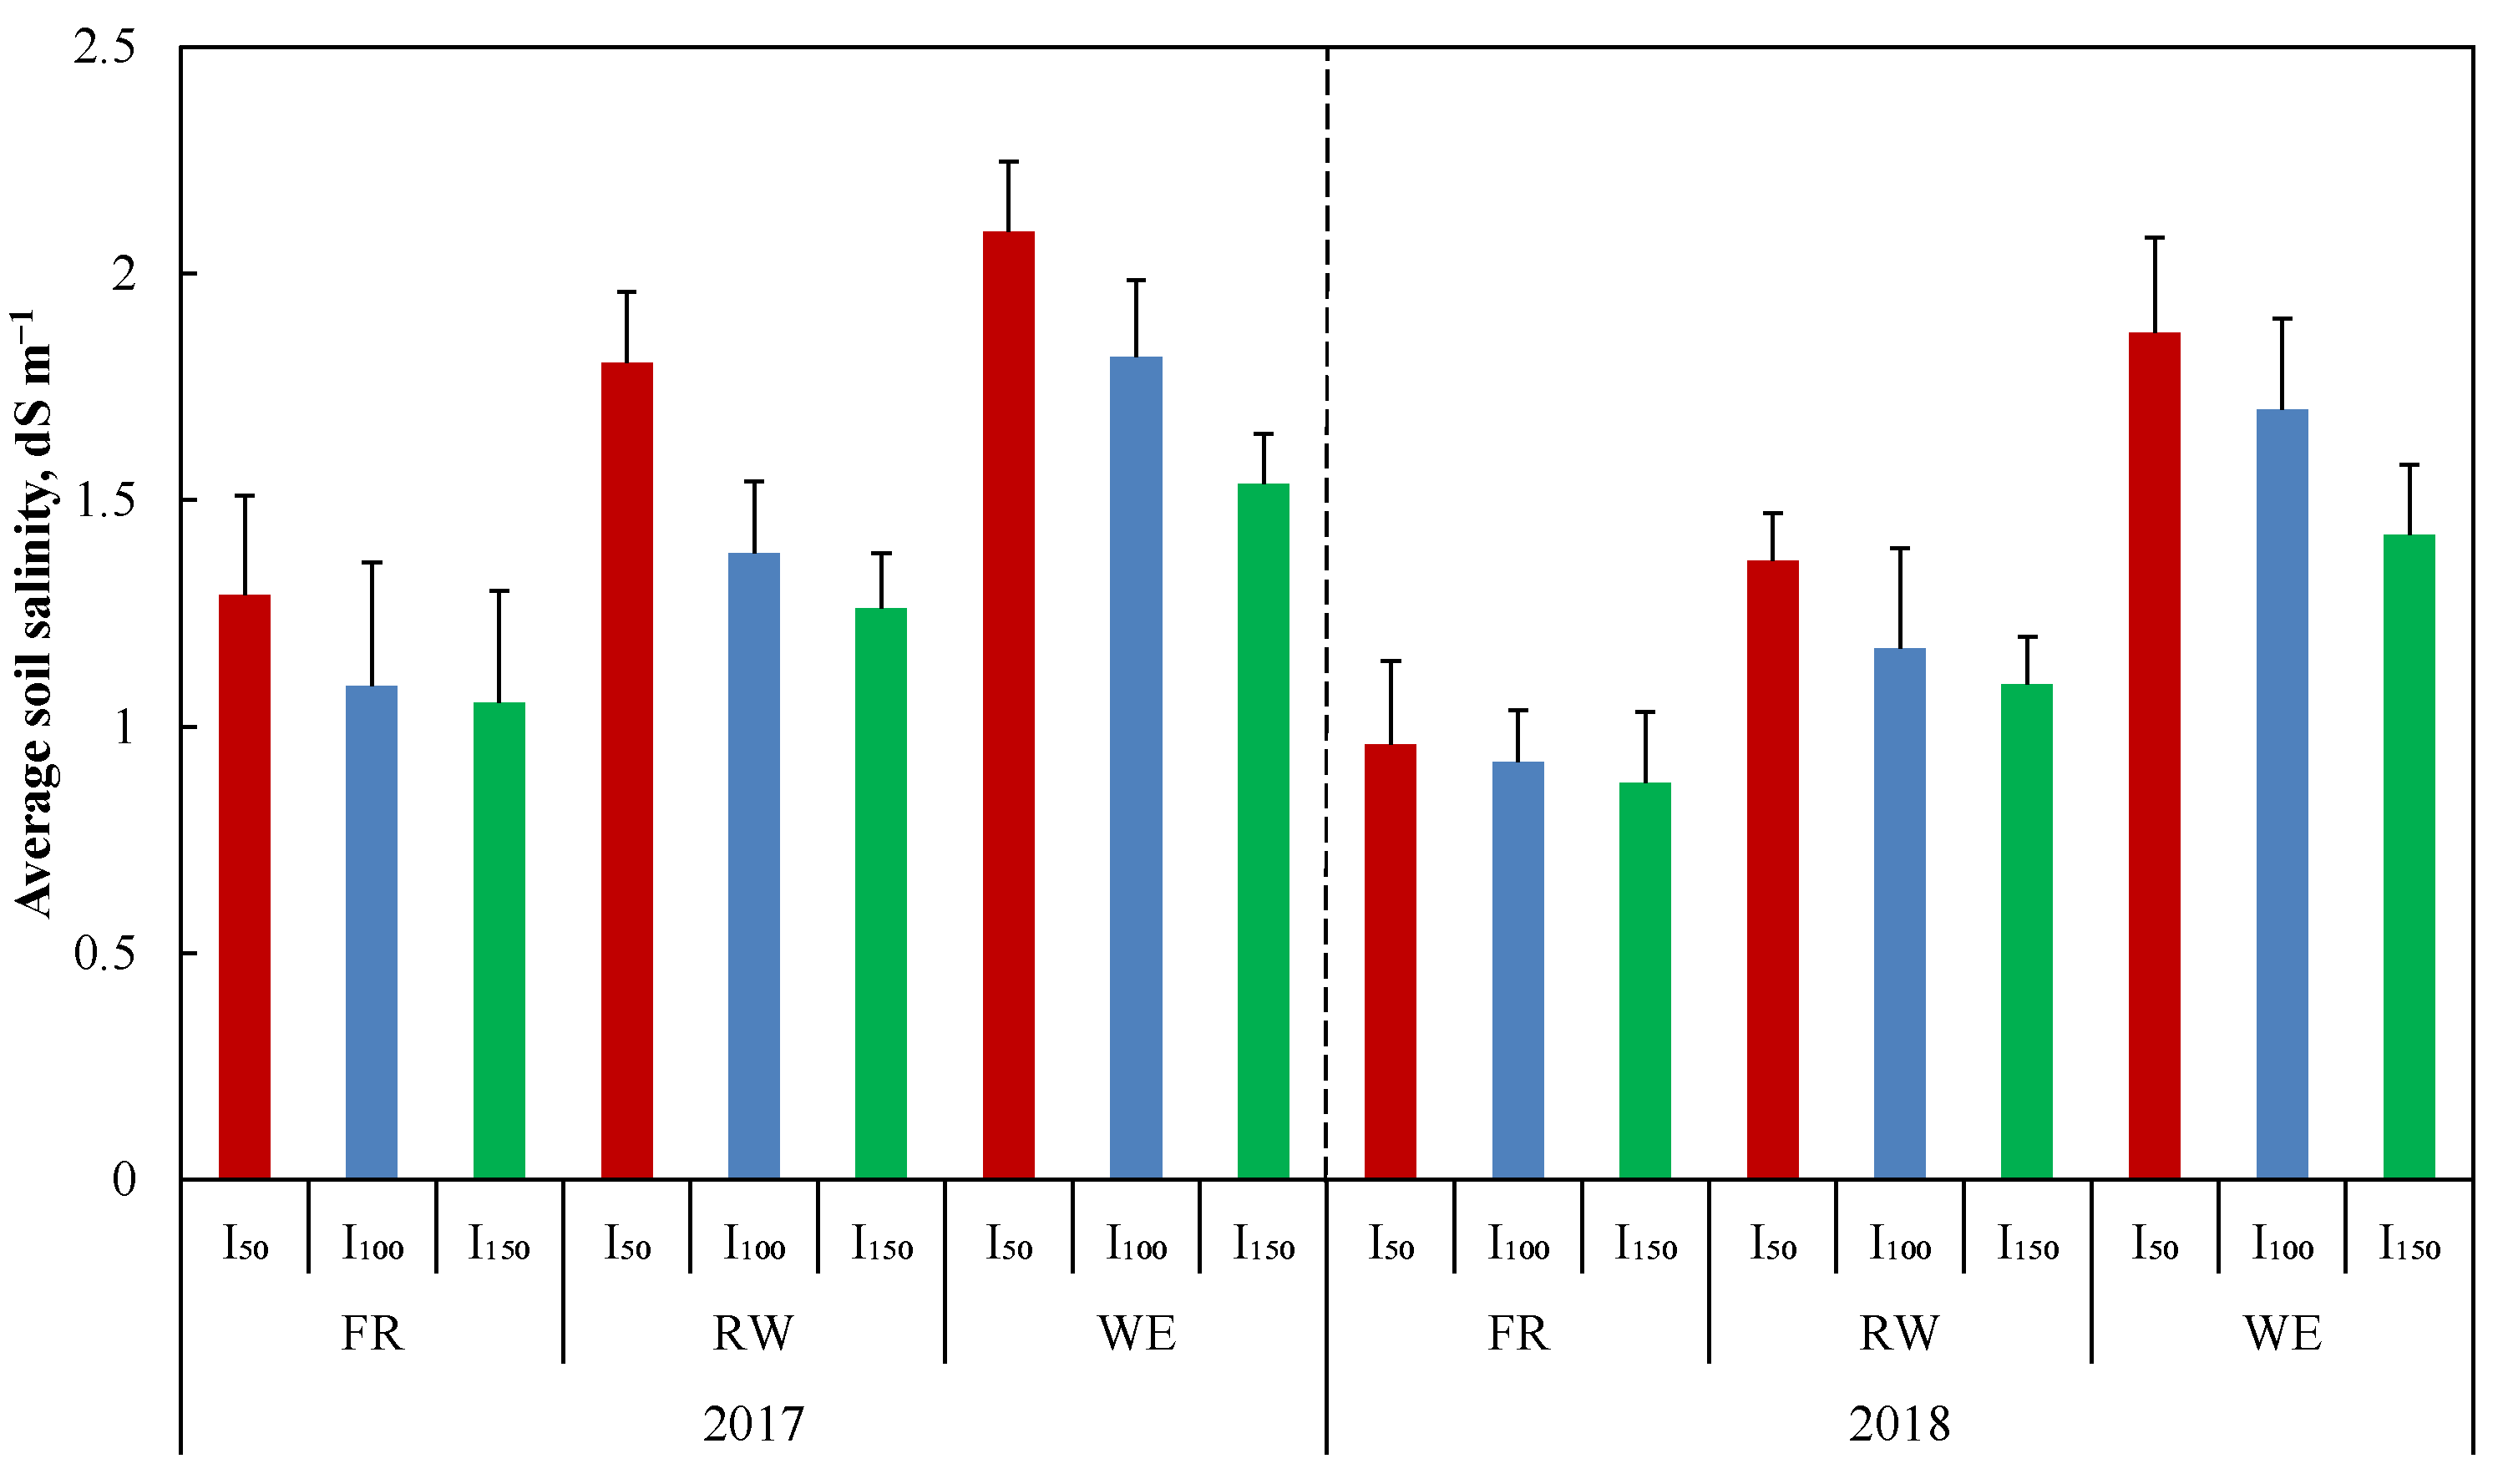
3.2. Soil Salinity
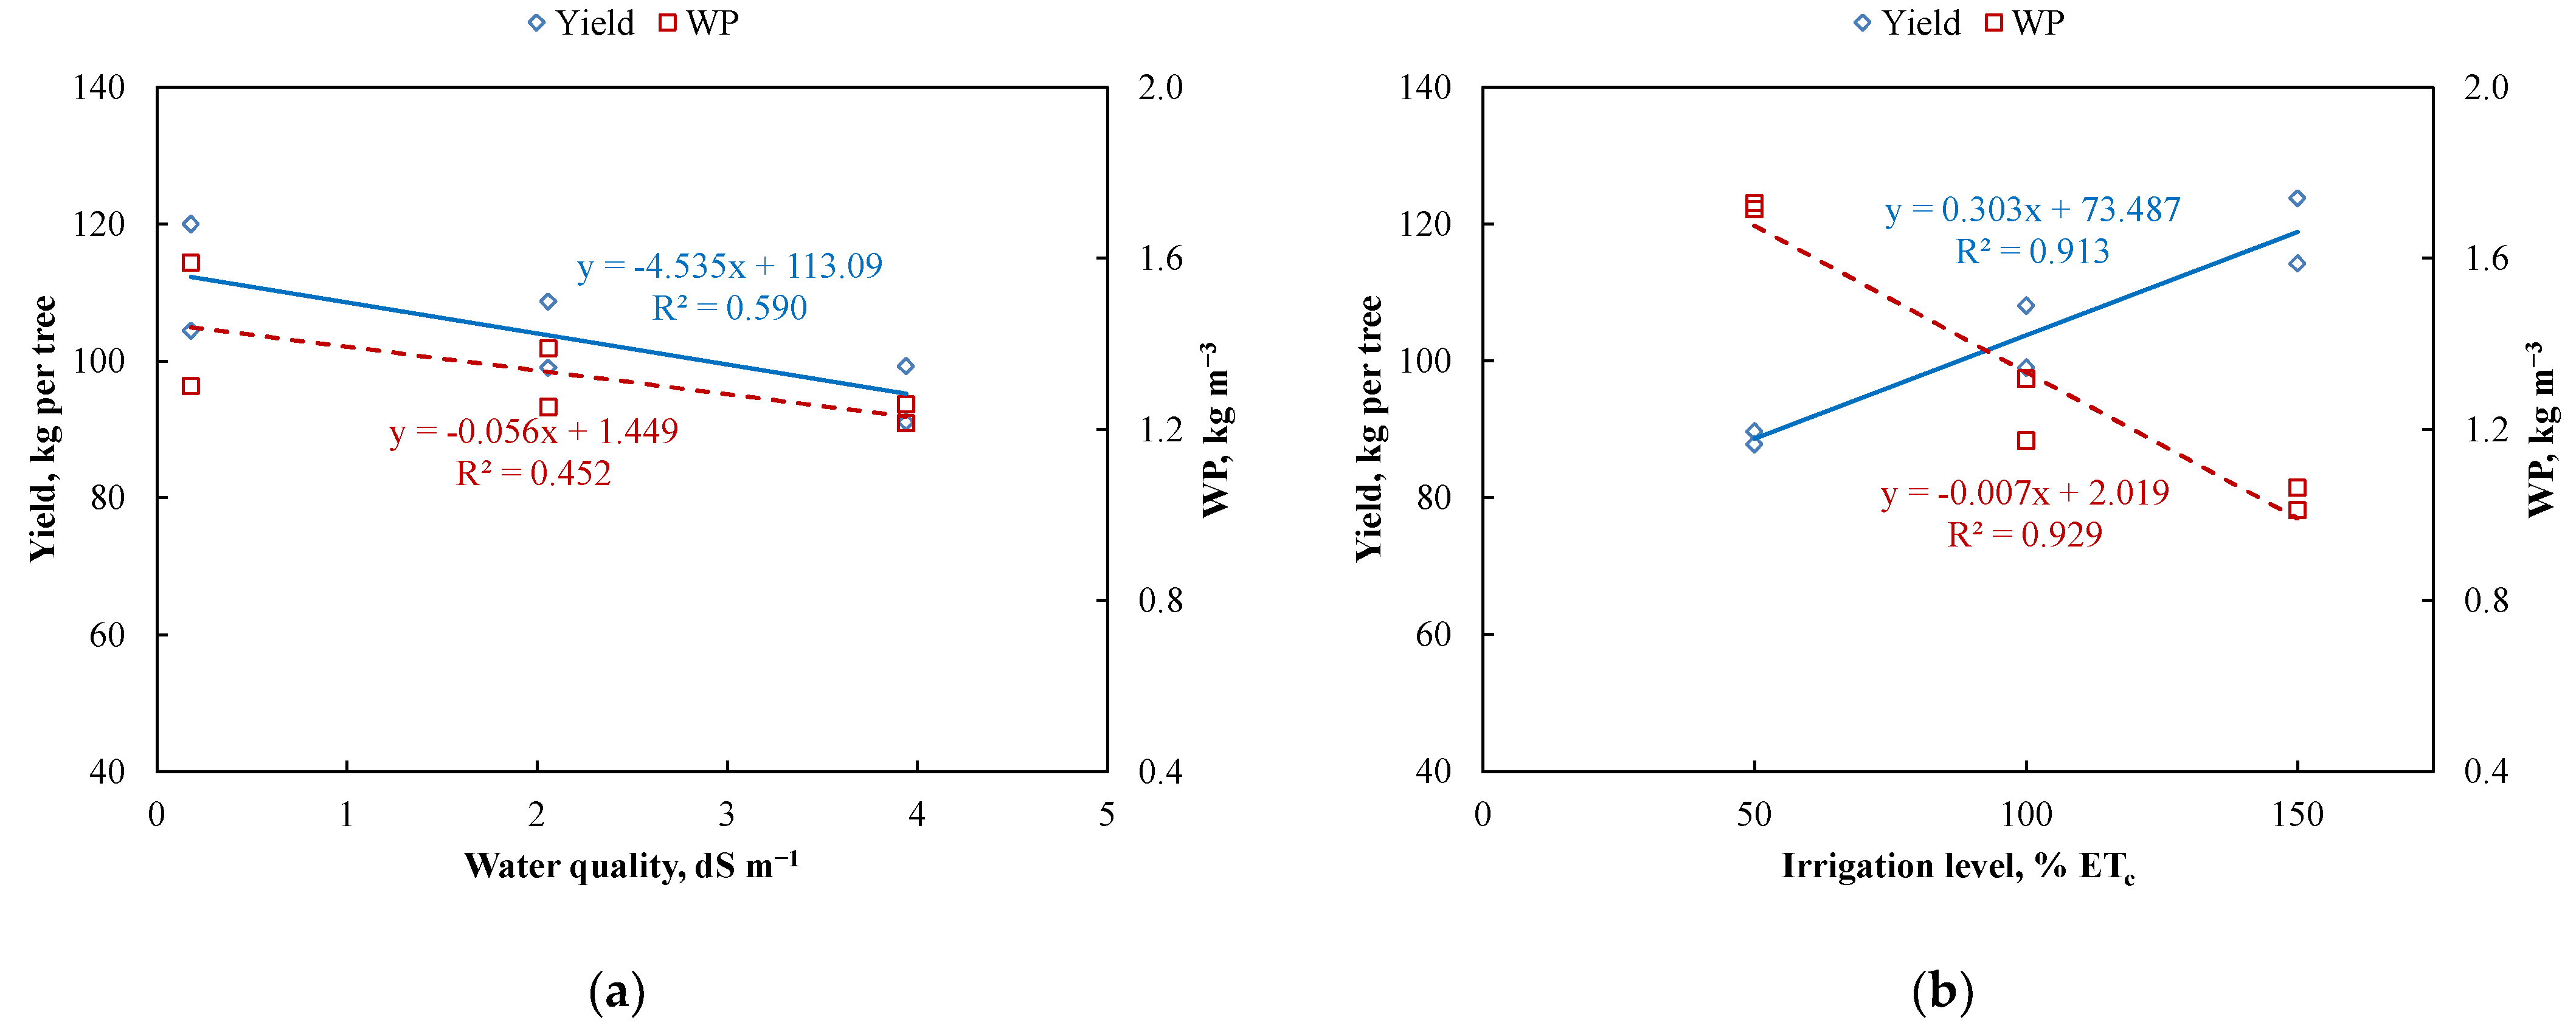
3.3. Yield and Water Productivity
3.4. Physical Properties of Fruit
3.5. Chemical Properties of Fruits
4. Discussion
5. Conclusions
Author Contributions
Funding
Institutional Review Board Statement
Informed Consent Statement
Data Availability Statement
Acknowledgments
Conflicts of Interest
References
- NCPD (National Centre for Palms and Dates). Semi-Annual Report; NCPD: Riyadh, Saudi Arabia, 2018. [Google Scholar]
- Al-Farsi, M.A.; Lee, C.Y. Nutritional and functional properties of dates: A review. Crit. Rev. Food Sci. Nutr. 2008, 48, 877–887. [Google Scholar] [CrossRef] [PubMed]
- Hussain, N.; Al-Rasbi, S.; Al-Wahaibi, N.S.; Al-Ghanum, G.; El-Sharief, A.O.A. Salinity Problems and their Management in Date Palm Production. In Dates: Production, Processing, Food, and Medicinal Value; Essa, M.M., Sukumar, E., Manickavasagan, A., Eds.; CRC Press: Boca Raton, FL, USA, 2012; p. 442. [Google Scholar]
- FAO. Water for Sustainable Food and Agriculture; A Report Produced for the G20 Presidency of Germany; Food and Agriculture Organization of the United Nations: Rome, Italy, 2017. [Google Scholar]
- Sameni, A.M.; Morshedi, A. Hydraulic conductivity of calcareous soils as affected by salinity and sodicity, II. Effect of gypsum application and flow rate of leaching solution carbohydrate. Commun. Soil Sci. Plan. 2000, 31, 69–80. [Google Scholar] [CrossRef]
- Shahin, M.M.; Alhajhoj, M.R. Effect of different irrigation water qualities on the content of some macro and micronutrients in leaves fruit, as well as yield and fruit quality of some date palm cultivars in Al−Hassa Oasis, Saudi Arabia. Middle East. J. Agric. Res. 2015, 4, 834–847. [Google Scholar]
- Al-Muaini, A.; Green, S.; Dakheel, A.; Abdullah, A.; Abou Dahr, W.A.; Dixon, S.; Kemp, P.; Clothier, B. Irrigation management with saline groundwater of a date palm cultivar in the hyper-arid United Arab Emirates. Agric. Water Manag. 2019, 211, 123–131. [Google Scholar] [CrossRef]
- Tripler, E.; Ben-Gal, A.; Shani, U. Consequence of salinity and excess boron on growth, evapotranspiration and ion uptake in date palm (Phoenix dactylifera L., cv. Medjool). Plant. Soil 2007, 297, 147–155. [Google Scholar] [CrossRef]
- Al-Amoud, A.I.; Bacha, M.A.; Al-Darby, A.M. Seasonal water use of date palms in the Central region of Saudi Arabia. Agric. Eng. J. 2000, 9, 51–62. [Google Scholar]
- Ismail, S.M.; Al-qurashi, A.D.; Awad, M.A. Optimizing of irrigation water use, yield and quality of ‘Nabbut-saif’ date palm under dry land conditions. Irrig. Drain. 2014, 63, 29–37. [Google Scholar] [CrossRef]
- Alikhani-Koupaei, M.; Fatahi, R.; Zamani, Z.; Salimi, S. Effects of deficit irrigation on some physiological traits, production and fruit quality of ‘Mazafati’ date palm and the fruit wilting and dropping disorder. Agric. Water Manag. 2018, 209, 219–227. [Google Scholar] [CrossRef]
- Gribaa, A.; Dardelle, F.; Lehner, A.; Rihouey, C.; Burel, C.; Ferchichi, A.; Driouich, A.; Mollet, J.C. Effect of water deficit on the cell wall of the date palm (Phoenix dactylifera ‘Deglet nour’, Arecales) fruit during development. Plant. Cell Environ. 2013, 36, 1056–1070. [Google Scholar] [CrossRef]
- Naor, A. Irrigation scheduling of peach-deficit irrigation at different phenological stages and water stress assessment. Acta Hortic. 2006, 339–350. [Google Scholar] [CrossRef]
- Al-Yahyai, R.; Al-Kharusi, L. Sub-optimal irrigation affects chemical quality attributes of dates during fruit development. Afr. J. Agric. Res. 2012, 7, 1498–1503. [Google Scholar]
- Syvertsen, J.P.; Lloyd, J.; Kriedemann, P.E. Salinity and drought stress effects on foliar ion concentration, water relations, and photosynthetic characteristics of orchard citrus. Aust. J. Agric. Res. 1988, 39, 619–627. [Google Scholar] [CrossRef]
- Pérez-Pérez, J.G.; Syvertsen, J.P.; Botía, P.; García-Sánchez, F. Leaf water relations and net gas exchange responses of salinized carrizo citrange seedlings during drought stress and recovery. Ann. Bot. 2007, 100, 335–345. [Google Scholar] [CrossRef] [Green Version]
- Pedrero, F.; Maestre-Valero, J.F.; Mounzer, O.; Alarcón, J.J.; Nicolás, E. Physiological and agronomic mandarin trees performance under saline reclaimed water combined with regulated deficit irrigation. Agric. Water Manag. 2014, 146, 228–237. [Google Scholar] [CrossRef]
- Pedrero, F.; Maestre-Valero, J.F.; Mounzer, O.; Nortes, P.A.; Alcobendas, R.; Romero-Trigueros, C.; Bayona, J.M.; Alarcón, J.J.; Nicolás, E. Response of young ‘Star Ruby’ grapefruit trees to regulated deficit irrigation with saline reclaimed water. Agric. Water Manag. 2015, 158, 51–60. [Google Scholar] [CrossRef]
- Ayers, R.S.; Westcot, D.W. Water Quality for Agriculture; FAO Irrigation and Drainage Paper 29, Rev. 1; FAO: Rome, Italy, 1994. [Google Scholar]
- EPA. Guidelines for Wastewater Reuse; WASH Technical Report No. 81; U.S. Agency for International Development Washington, D.C.: Washington, DC, USA, September 1992. [Google Scholar]
- Allen, R.G.; Pereira, L.S.; Raes, D.; Smith, M. Crop Evapotranspiration: Guidelines for Computing Crop Water Requirements; FAO Irrigation and Drainage Paper 56; FAO: Rome, Italy, 1998. [Google Scholar]
- Alamoud, A.I.; Mohammad, F.S.; Al-Hamed, S.A.; Alabdulkader, A.M. Reference evapotranspiration and date palm water use in the kingdom of Saudi Arabia. Int. Res. J. Agric. Sci. Soil Sci. 2012, 2, 155–169. [Google Scholar]
- Liu, J.; Lindstrom, O.M.; Chavez, D.J. Deferential thermal analysis of ‘Elberta’ and ‘Flavorich’ peach fower buds to predict cold hardiness in Georgia. Hortic. Sci. 2019, 54, 676–683. [Google Scholar]
- Lal, R.; Shukla, M.K. Principles of Soil Physics; Marcel Dekker: New York, NY, USA, 2004. [Google Scholar]
- Rowell, D.L. Soil Science: Methods and Applications; Pearson Education Limited: Essex, England, 1994. [Google Scholar]
- Kijne, J.W. Water Productivity Under Saline Conditions. In Water Productivity in Agriculture: Limits and Opportunities for Improvement; Kijne, J.W., Barker, R., Molden, D., Eds.; CABI Publishing: Wallingford, UK, 2003; pp. 89–102. [Google Scholar]
- Shaaban, S.H.A.; Soliman, S.S.; Hamouda, H.A. Nutrient removal and physical, chemical properties in Samany date palm as influenced by different pruning treatments. J. Appl. Sci. Res. 2006, 2, 1142–1150. [Google Scholar]
- Association of Official Agricultural Chemists. Official Methods of Analysis, 15th ed.; AOAC: Washington, DC, USA, 1995. [Google Scholar]
- CoStat, Version 6.303 Copyright 1998–2004 CoHort Software; 798 Lighthouse Ave. PMB 320: Monterey, CA, 93940, USA.
- Al-Darby, A.M.; Al-Amoud, A.I.; Bacha, M.A. Water and salt distribution patterns for different irrigation systems and water regimes under date palms in central region, Saudi Arabia. J. Saudi Soc. Agric. Sci. 2004, 3, 18–38. [Google Scholar]
- Nicolás, E.; Alarcón, J.J.; Mounzer, O.; Pedrero, F.; Nortes, P.A.; Alcobendas, R.; Romero-Trigueros, C.; Bayona, J.M.; Maestre-Valero, J.F. Long-term physiological and agronomic responses of mandarin trees to irrigation with saline reclaimed water. Agric. Water Manag. 2016, 166, 1–8. [Google Scholar] [CrossRef]
- Homaee, M.; Schmidhalter, U. Water integration by plants root under non-uniform soil salinity. Irrig. Sci. 2008, 27, 83–95. [Google Scholar] [CrossRef]
- Levy, Y.; Syvertsen, J. Irrigation water quality and salinity effects in citrus trees. Hortic. Rev. 2010, 30, 37–82. [Google Scholar]
- Mounzer, O.; Pedrero-Salcedo, F.; Nortes, P.A.; Bayona, J.M.; Nicolás-Nicolás, E.; Alarcón, J.J. Transient soil salinity under the combined effect of reclaimed water and regulated deficit drip irrigation of Mandarin trees. Agric. Water Manag. 2013, 120, 23–29. [Google Scholar] [CrossRef]
- Hussain, G.; Al-Saati, A.J. Wastewater quality and its reuse in agriculture in Saudi Arabia. Desalination 1999, 123, 241–251. [Google Scholar] [CrossRef]
- Nakayama, F.S.; Bucks, D.A. Trickle Irrigation for Crop Production: Design, Operation and Management; Elsevier: New York, NY, USA, 1986. [Google Scholar]
- Bezborodov, G.A.; Shadmanov, D.K.; Mirhashimov, R.T.; Yuldashev, T.; Qureshi, A.S.; Noble, A.D.; Qadir, M. Mulching and water quality effects on soil salinity and sodicity dynamics and cotton productivity in Central Asia. Agric. Ecosyst. Environ. 2010, 138, 95–102. [Google Scholar] [CrossRef]
- Plaut, Z.; Edelstein, M.; Ben-Hur, M. Overcoming Salinity Barriers to Crop Production Using Traditional Methods. Crit. Rev. Plant Sci. 2013, 32, 250–291. [Google Scholar] [CrossRef]
- Schoups, G.; Hopmans, J.W.; Young, C.A.; Vrugt, J.A.; Wallender, W.W.; Tanji, K.K.; Panday, S. Sustainability of irrigated agriculture in the San Joaquin Valley, California. Proc. Natl. Acad. Sci. USA 2005, 102, 15352–15356. [Google Scholar] [CrossRef] [Green Version]
- Aragüés, R.; Medina, E.T.; Zribi, W.; Clavería, I.; Álvaro-Fuentes, J.; Faci, J. Soil salinization as a threat to the sustainability of deficit irrigation under present and expected climate change scenarios. Irrig. Sci. 2015, 33, 67–79. [Google Scholar] [CrossRef] [Green Version]
- Al-qurashi, A.D.; Ismail, S.M.; Awad, M.A. Effect of water regimes and palm coefficient on growth parameters, date yield and irrigation water use of tissue culture-regenerated ‘Barhee’ date palms grown in a newly established orchard: Date palm water requirement. Irrig. Drain. 2016, 65, 491–501. [Google Scholar] [CrossRef]
- Plaut, Z.; Grieve, C.M. Photosynthesis of salt-stressed maize as influenced by Ca: Na ratios in the nutrient solution. Plant Soil 1988, 105, 283–286. [Google Scholar] [CrossRef]
- Tester, M.; Davenport, R. Na+ Tolerance and Na+ transport in higher plants. Ann. Bot. 2003, 91, 503–527. [Google Scholar] [CrossRef] [PubMed]
- Wilkinson, S.; Hartung, W. Food production: Reducing water consumption by manipulating long-distance chemical signalling in plants. J. Exp. Bot. 2009, 60, 1885–1891. [Google Scholar] [CrossRef] [PubMed] [Green Version]
- Alrasbi, S.A.R.; Hussain, N.; Schmeisky, H. Evaluation of the growth of date palm seedlings irrigated with saline water in the sultanate of Oman. Acta Hortic. 2010, 882, 233–246. [Google Scholar] [CrossRef]
- Youssef, T.; Awad, M.A. Mechanisms of enhancing photosynthetic gas exchange in date palm seedlings (Phoenix dactylifera L.) under salinity stress by a 5-aminolevulinicacid-based fertilizer. J. Plant Growth Regul. 2008, 27, 1–9. [Google Scholar] [CrossRef]
- Domingo, R.; Ruiz-Sánchez, M.C.; Sánchez-Blanco, M.J.; Torrecillas, A. Water relations, growth and yield of Fino lemon trees under regulated deficit irrigation. Irrig. Sci. 1996, 16, 115–123. [Google Scholar] [CrossRef]
- McCarthy, M.G.; Loveys, B.R.; Dry, P.R. Regulated Deficit Irrigation and Partial Root-Zone Drying as Irrigation Management Techniques for Grapevines. In Deficit Irrigation Practices. Water Reports Publication, N. 22; FAO: Rome, Italy, 2002; pp. 79–87. [Google Scholar]
- Romero-Trigueros, C.; Parra, M.; Bayona, J.M.; Nortes, P.A.; Alarcón, J.J.; Nicolás, E. Effect of deficit irrigation and reclaimed water on yield and quality of grapefruits at harvest and postharvest. LWT Food Sci. Technol. 2017, 85, 405–411. [Google Scholar] [CrossRef] [Green Version]
- Tripler, E.; Shani, U.; Mualem, Y.; Ben-Gal, A. Long-term growth, water consumption and yield of date palm as a function of salinity. Agric. Water Manag. 2011, 99, 128–134. [Google Scholar] [CrossRef]
- Salamati, N.; Dehghanisanij, H.; Bayat, P. The effect of surface and subsurface drip irrigation system on qualitative and quantitative characteristics of dates of Kabkab cultivar. Irrig. Sci. Eng. 2019, 42, 153–165. [Google Scholar]
- Mohebi, A.H. Effects of Water Use in Drip Irrigation and Surface Irrigation Methods on Yield and Vegetative Characteristics on Date Palm. In Proceedings of the International Conference on Mango and Date Palm: Culture and Export, University of Agriculture, Faisalabad, Pakistan, 20–23 June 2005. [Google Scholar]
- Navarro, J.M.; Pérez-Pérez, J.G.; Romero, P.; Botía, P. Analysis of the changes in quality in mandarin fruit, produced by deficit irrigation treatments. Food Chem. 2010, 119, 1591–1596. [Google Scholar] [CrossRef]
- Prior, L.D.; Grieve, A.M.; Bevington, K.B.; Slavich, P.G. Long-term effects of saline irrigation water on ‘Valencia’ orange trees: Relationships between growth and yield, and salt levels in soil and leaves. Aust. J. Agric. Res. 2007, 58, 349–358. [Google Scholar] [CrossRef]
- Cohen, A.; Goell, A. Fruit growth and dry matter accumulation in grapefruit during periods of water withholding and after reirrigation. Aust. J. Plant Physiol. 1988, 15, 633–639. [Google Scholar] [CrossRef]
- Cuevas, J.; Pinillos, V.; Cañete, M.L.; González, M.; Alonso, F.; Fernández, M.D.; Hueso, J.J. Optimal levels of postharvest deficit irrigation for promoting early flowering and harvest dates in loquat (Eriobotrya japonica Lindl.). Agric. Water Manag. 2009, 96, 831–838. [Google Scholar] [CrossRef]
- Cui, N.; Du, T.; Li, F.; Tong, L.; Kang, S.; Wang, M.; Liu, X.; Li, Z. Response of vegetative growth and fruit development to regulated deficit irrigation at different growth stages of pear-jujube tree. Agric. Water Manag. 2009, 96, 1237–1246. [Google Scholar] [CrossRef]
- Abd El-Mageed, T.A.; Semida, W.M. Effect of deficit irrigation and growing seasons on plant water status, fruit yield and water use efficiency of squash under saline soil. Sci. Hortic. 2015, 186, 89–100. [Google Scholar] [CrossRef]
- Horner, J.D. Nonlinear effects of water deficits on foliar tannin concentration. Biochem. Syst. Ecol. 1990, 18, 211–213. [Google Scholar] [CrossRef]
- Shao, H.B.; Chu, L.Y.; Jaleel, C.A.; Zhao, C.X. Water-deficit stress-induced anatomical changes in higher plants. C. R. Biol. 2008, 331, 215–225. [Google Scholar] [CrossRef]
- Besset, J.; Génard, M.; Girard, T.; Serra, V.; Bussi, C. Effect of water stress applied during the final stage of rapid growth on peach trees (cv. Big-Top). Sci. Hortic. 2001, 91, 289–303. [Google Scholar] [CrossRef]
- Rahmati, M.; Vercambre, G.; Davarynejad, G.; Bannayan, M.; Azizi, M.; Génard, M. Water scarcity conditions affect peach fruit size and polyphenol contents more severely than other fruit quality traits. J. Sci. Food Agric. 2015, 95, 1055–1065. [Google Scholar] [CrossRef]
- Laribi, A.I.; Palou, L.; Intrigliolo, D.S.; Nortes, P.A.; Rojas-Argudo, C.; Taberner, V.; Bartual, J.; Pérez-Gago, M.B. Effect of sustained and regulated deficit irrigation on fruit quality of pomegranate cv. ‘Mollar de Elche’ at harvest and during cold storage. Agric. Water Manag. 2013, 125, 61–70. [Google Scholar] [CrossRef]
- Pérez-Pérez, J.G.; Robles, J.M.; Botía, P. Effects of deficit irrigation in different fruit growth stages on ‘Star Ruby’ grapefruit trees in semi-arid conditions. Agric. Water Manag. 2014, 133, 44–54. [Google Scholar] [CrossRef]
- Pérez-Pérez, J.G.; García-Sánchez, F.; Robles, J.M.; Botía, P. ‘Star Ruby’ grapefruit and ‘Clemenules’ mandarin trees show different physiological and agronomic responses to irrigation with saline water. Irrig. Sci. 2015, 33, 191–204. [Google Scholar] [CrossRef]
- Galindo, A.; Calín-Sánchez, Á.; Griñán, I.; Rodríguez, P.; Cruz, Z.N.; Girón, I.F.; Corell, M.; Martínez-Font, R.; Moriana, A.; Carbonell-Barrachina, A.A.; et al. Water stress at the end of the pomegranate fruit ripening stage produces earlier harvest and improves fruit quality. Sci. Hortic. 2017, 226, 68–74. [Google Scholar] [CrossRef]
- Maestre-Valero, J.F.; Martínez-Alvarez, V.; Jódar-Conesa, F.J.; Acosta, J.A.; Martin-Gorriz, B.; Robles, J.M.; Pérez-Pérez, J.G.; Navarro, J.M. Short-term response of young mandarin trees to desalinated seawater irrigation. Water 2020, 12, 159. [Google Scholar] [CrossRef] [Green Version]
- Romero, P.; Navarro, J.M.; Pérez-Pérez, J.; García-Sánchez, F.; Gómez-Gómez, A.; Porras, I.; Martinez, V.; Botía, P. Deficit irrigation and rootstock: Their effects on water relations, vegetative development, yield, fruit quality and mineral nutrition of Clemenules mandarin. Tree Physiol. 2006, 26, 1537–1548. [Google Scholar] [CrossRef] [PubMed]
- Intrigliolo, D.S.; Castel, J.R. Response of plum trees to deficit irrigation under two crop levels: Tree growth, yield and fruit quality. Irrig. Sci. 2010, 28, 525–534. [Google Scholar] [CrossRef]


| ECw, dS m−1 | pH | Cations, meq L−1 | Anions, meq L−1 | ||||||
|---|---|---|---|---|---|---|---|---|---|
| Ca | Mg | Na | K | HCO3 | Cl | SO4 | |||
| FR | 0.18 | 7.20 | 0.23 | 0.14 | 0.90 | 0.02 | 0.1 | 0.68 | 0.44 |
| RW | 2.06 | 7.01 | 4.84 | 3.96 | 7.75 | 0.51 | 3.0 | 9.87 | 4.40 |
| WE | 3.94 | 6.44 | 10.96 | 8.97 | 17.55 | 1.15 | 6.79 | 22.35 | 9.96 |
| Kc 1 | Number of Irrigations | Water Applied 2, m3 per Tree | GDD, °C Day | |||||||
|---|---|---|---|---|---|---|---|---|---|---|
| 2017 | 2018 | |||||||||
| I50 | I100 | I150 | I50 | I100 | I150 | 2017 | 2018 | |||
| Pollination stage | ||||||||||
| (from 1 Feb–1 Mar) | 0.83 | 4 | 3.8 | 3.8 | 3.8 | 3.91 | 3.91 | 3.91 | 42 | 187.6 |
| Hababouk stage | ||||||||||
| (from 2 Mar–15 Apr) | 0.93 | 18 | 4.94 | 9.87 | 14.81 | 5.08 | 10.16 | 15.24 | 537.6 | 315.25 |
| Kimri stage | ||||||||||
| (from 16 Apr–30 Jun) | 0.94 | 30 | 11.81 | 23.63 | 35.44 | 12.17 | 24.34 | 36.51 | 1630.15 | 1412.2 |
| Khalal stage | ||||||||||
| (from 1 Jul–25 Aug) | 0.97 | 21 | 9.43 | 18.86 | 28.29 | 9.71 | 19.42 | 29.13 | 1353.9 | 1327.65 |
| Rutab stage | ||||||||||
| (from 26 Aug–30 Sep) | 0.93 | 15 | 4.96 | 9.91 | 14.87 | 5.11 | 10.21 | 15.32 | 743.4 | 797.1 |
| Reproductive growth | ||||||||||
| (4 months) | 0.82-0.92 | 16 | 15.86 | 15.86 | 15.86 | 16.35 | 16.35 | 16.35 | 1014.8 | 1044.5 |
| Total (year) | - | 104 | 50.8 | 81.93 | 113.07 | 52.33 | 84.39 | 116.46 | 5321.85 | 5084.3 |
| Factor | BW (kg) | Yield (kg per Tree) | WP (kg m−3) | Physical Characteristics | Chemical Characteristics | ||||||||||
|---|---|---|---|---|---|---|---|---|---|---|---|---|---|---|---|
| FW (g) | SW (g) | FlW (g) | FS (cm3) | FL (cm) | FD (cm) | TSS (%) | Acidity (%) | M (%) | Total Sugar (%) | Re. Sugar (%) | Non-re. Sugar (%) | ||||
| Year (Y) | |||||||||||||||
| p-value | 0.432 ns | 0.412 ns | 0.006 ** | 0.009 ** | 0.009 ** | 0.021 * | 0.002 ** | 0.526 ns | <0.001 *** | <0.001 *** | 0.706 ns | 0.843 ns | <0.001 *** | 0.015 * | 0.010 ** |
| LSD 0.05 | - | - | 0.03 | 0.15 | 0.03 | 0.14 | 0.15 | - | 0.02 | 1.91 | - | - | 1.59 | 1.53 | 1.94 |
| Water quality (WQ) | |||||||||||||||
| p-value | <0.001 *** | <0.001 *** | <0.001 *** | <0.001 *** | <0.001 *** | 0.005 ** | <0.001 *** | <0.001 *** | <0.001 *** | 0.003 ** | 0.004 ** | <0.001 *** | <0.001 *** | 0.004 ** | 0.003 ** |
| LSD 0.05 | 1.09 | 2.33 | 0.03 | 0.19 | 0.04 | 0.17 | 0.18 | 0.05 | 0.03 | 2.33 | 0.02 | 0.46 | 1.95 | 1.88 | 2.37 |
| Irrigation level (IL) | |||||||||||||||
| p-value | <0.001 *** | <0.001 *** | <0.001 *** | <0.001 *** | 0.008 ** | <0.001 *** | <0.001 *** | <0.001 *** | <0.001 *** | 0.017 * | 0.015 * | 0.001 *** | <0.001 *** | 0.047 * | <0.001 *** |
| LSD 0.05 | 1.08 | 2.33 | 0.03 | 0.19 | 0.04 | 0.17 | 0.18 | 0.05 | 0.03 | 2.33 | 0.02 | 0.46 | 1.95 | 1.88 | 2.37 |
| Y × WQ | 0.012 * | <0.001 *** | <0.001 *** | 0.016 * | 0.087 * | 0.026 * | 0.012 * | 0.029 * | <0.001 *** | 0.004 ** | 0.571 ns | <0.001 *** | <0.001 *** | 0.143 ns | <0.001 *** |
| Y × IL | 0.104 ns | <0.001 *** | <0.001 *** | 0.180 ns | 0.649 ns | 0.123 ns | 0.010 ** | 0.650 ns | 0.850 ns | 0.910 ns | 0.696 ns | 0.429 ns | 0.235 ns | 0.484 ns | 0.130 ns |
| WQ × IL | 0.618 ns | <0.001 *** | <0.001 *** | <0.001 *** | <0.001 *** | <0.001 *** | <0.001 *** | <0.001 *** | <0.001 *** | 0.378 ns | 0.048 * | 0.001 *** | 0.111 ns | 0.195 ns | 0.012 * |
| Y × WQ × IL | 0.006 ** | <0.001 *** | <0.001 *** | 0.294 ns | 0.353 ns | 0.338 ns | 0.028 * | 0.998 ns | 0.053 ns | 0.078 ns | 0.972 ns | 0.097 ns | 0.008 ** | 0.029 * | 0.068 ns |
| CV, % | 21.79 | 3.32 | 3.33 | 3.33 | 5.14 | 3.48 | 3.34 | 2.47 | 1.82 | 4.72 | 16.84 | 4.00 | 4.39 | 7.39 | 12.50 |
| Treatment | BW (kg) | Yield (kg per Tree) | WP (kg m−3) | |
|---|---|---|---|---|
| 2017 | ||||
| FR | I50 | 12.80 (±1.26) | 102.40 (±1.36) d | 2.02 (±0.03) a |
| I100 | 17.70 (±1.37) | 141.60 (±1.69) a | 1.73 (±0.02) b | |
| I150 | 14.50 (±0.63) | 116.00 (±2.32) c | 1.03 (±0.02) e | |
| RW | I50 | 9.50 (±0.78) | 76.00 (±1.81) h | 1.50 (±0.04) c |
| I100 | 11.38 (±0.71) | 91.00 (±1.56) f | 1.11 (±0.02) d | |
| I150 | 14.44 (±1.46) | 130.00 (±3.35) b | 1.15 (±0.03) d | |
| WE | I50 | 9.44 (±0.89) | 85.00 (±1.15) g | 1.67 (±0.02) b |
| I100 | 11.44 (±1.35) | 91.50 (±1.25) f | 1.12 (±0.02) d | |
| I150 | 12.09 (0.57) | 96.75 (±1.29) e | 0.86 (±0.01) f | |
| p-value | 0.048 ns | <0.001 *** | <0.001 *** | |
| LSD 0.05 | - | 5.11 | 0.06 | |
| 2018 | ||||
| FR | I50 | 10.60 (±0.85) | 84.80 (±1.89) e | 1.62 (±0.04) b |
| I100 | 12.25 (±1.00) | 98.00 (±1.52) d | 1.16 (±0.02) d | |
| I150 | 16.31 (±0.97) | 130.50 (±2.00) a | 1.12 (±0.02) de | |
| RW | I50 | 9.72 (±0.62) | 97.20 (±2.05) d | 1.86 (±0.04) a |
| I100 | 11.78 (±0.68) | 106.00 (±1.56) c | 1.26 (±0.02) c | |
| I150 | 12.30 (±0.96) | 123.00 (±2.39) b | 1.06 (±0.02) ef | |
| WE | I50 | 10.88 (±0.65) | 87.00 (±1.69) e | 1.66 (±0.03) b |
| I100 | 11.63 (±0.65) | 93.00 (±2.33) d | 1.10 (±0.03) de | |
| I150 | 14.72 (±0.66) | 117.75 (±2.42) b | 1.01 (±0.02) f | |
| p-value | 0.150 ns | <0.001 *** | 0.006 ** | |
| LSD 0.05 | - | 5.41 | 0.08 | |
| Treatment | FW (g) | SW (g) | FlW (g) | FS (cm3) | FL (cm) | FD (cm) | |
|---|---|---|---|---|---|---|---|
| 2017 | |||||||
| FR | I50 | 9.71 (±0.19) a | 1.16 (±0.04) | 8.55 (±0.17) a | 8.83 (±0.17) c | 3.00 (±0.06) bc | 2.40 (±0.01) bc |
| I100 | 8.10 (±0.11) c | 1.12 (±0.01) | 6.98 (±0.12) c | 7.13 (±0.09) de | 2.85 (±0.03) d | 2.18 (±0.02) e | |
| I150 | 7.77 (±0.05) cd | 1.14 (±0.01) | 6.63 (±0.05) cd | 7.52 (±0.13) d | 2.88 (±0.04) cd | 2.20 (±0.01) e | |
| RW | I50 | 9.33 (±0.29) ab | 1.26 (±0.08) | 8.07 (±0.23) b | 9.33 (±0.17) b | 3.42 (±0.06) a | 2.45 (±0.03) ab |
| I100 | 7.16 (±0.13) e | 1.26 (±0.02) | 5.90 (±0.15) e | 7.30 (±0.21) de | 3.05 (±0.03) b | 2.27 (±0.03) d | |
| I150 | 9.45 (±0.23) a | 1.39 (±0.07) | 8.06 (±0.17) b | 9.93 (±0.13) a | 3.32 (±0.04) a | 2.48 (±0.02) a | |
| WE | I50 | 7.78 (±0.16) cd | 0.99 (±0.04) | 6.79 (±0.12) c | 7.40 (±0.10) d | 2.80 (±0.06) d | 2.30 (±0.01) d |
| I100 | 7.31 (±0.18) de | 1.13 (±0.02) | 6.18 (±0.18) de | 6.97 (±0.15) e | 2.80 (±0.06) d | 2.20 (±0.01) e | |
| I150 | 8.88 (±0.12) b | 1.12 (±0.02) | 7.76 (±0.12) b | 8.43 (±0.22) c | 3.00 (±0.01) bc | 2.37 (±0.03) c | |
| p-value | <0.001 *** | 0.122 ns | <0.001 *** | <0.001 *** | 0.005 ** | <0.001 *** | |
| LSD 0.05 | 0.53 | - | 0.47 | 0.41 | 0.15 | 0.06 | |
| 2018 | |||||||
| FR | I50 | 9.15 (±0.13) a | 1.14 (±0.01) b | 8.01 (±0.12) a | 8.53 (±0.09) b | 2.93 (±0.03) cd | 2.33 (±0.03) cd |
| I100 | 7.73 (±0.15) b | 1.04 (±0.02) c | 6.69 (±0.13) de | 6.97 (±0.23) d | 2.82 (±0.02) d | 2.20 (±0.06) e | |
| I150 | 7.56 (±0.14) bc | 1.04 (±0.01) c | 6.53 (±0.14) de | 7.23 (±0.15) cd | 2.85 (±0.03) d | 2.20 (±0.01) e | |
| RW | I50 | 8.72 (±0.13) a | 1.17 (±0.07) b | 7.56 (±0.07) c | 8.17 (±0.09) b | 3.33 (±0.03) a | 3.33 (±0.03) a |
| I100 | 7.28 (±0.07) c | 1.26 (±0.01) a | 6.03 (±0.06) f | 7.57 (±0.07) c | 3.00 (±0.01) bc | 3.03 (±0.03) b | |
| I150 | 8.85 (±0.14) a | 1.26 (±0.02) a | 7.59 (±0.12) bc | 9.23 (±0.15) a | 3.27 (±0.03) a | 3.27 (±0.03) a | |
| WE | I50 | 7.76 (±0.13) b | 0.99 (±0.02) c | 6.77 (±0.12) d | 7.37 (±0.17) cd | 2.83 (±0.07) d | 2.30 (±0.01) cd |
| I100 | 7.43 (±0.06) bc | 1.12 (±0.01) b | 6.31 (±0.06) ef | 7.07 (±0.23) cd | 2.87 (±0.03) d | 2.27 (±0.03) de | |
| I150 | 9.13 (±0.24) a | 1.15 (±0.01) b | 7.98 (±0.24) ab | 8.47 (±0.23) b | 3.10 (±0.06) b | 2.38 (±0.02) c | |
| p-value | <0.001 *** | <0.001 *** | <0.001 *** | <0.001 *** | <0.001 *** | <0.001 *** | |
| LSD 0.05 | 0.43 | 0.08 | 0.40 | 0.52 | 0.12 | 0.09 | |
| Treatment | TSS (%) | Acidity (%) | M (%) | Total Sugar (%) | Reducing Sugar (%) | Non-Reducing Sugar (%) | |
|---|---|---|---|---|---|---|---|
| 2017 | |||||||
| FR | I50 | 76.00 (±1.74) | 0.14 (±0.01) | 17.92 (±0.14) bc | 71.80 (±0.58) b | 39.94 (±0.60) | 31.86 (±0.94) bc |
| I100 | 82.60 (±3.29) | 0.13 (±0.01) | 19.37 (±0.33) a | 80.10 (±4.86) a | 41.54 (±1.51) | 38.56 (±4.12) a | |
| I150 | 73.73 (±1.53) | 0.10 (±0.01) | 16.81 (±0.69) d | 68.08 (±1.59) bc | 36.77 (±0.86) | 31.31 (±1.24) bcd | |
| RW | I50 | 76.80 (±1.83) | 0.18 (±0.01) | 14.62 (±0.04) f | 63.46 (±1.03) c | 35.13 (±0.49) | 28.33 (±0.96) bcde |
| I100 | 76.00 (±2.00) | 0.18 (±0.01) | 15.57 (±0.09) e | 64.44 (±0.31) c | 39.60 (±1.14) | 24.84 (±1.12) e | |
| I150 | 74.00 (±2.00) | 0.13 (±0.03) | 14.9 (±0.26) ef | 62.98 (±1.00) c | 38.13 (±2.90) | 24.85 (±2.05) e | |
| WE | I50 | 78.00 (±3.46) | 0.14 (±0.03) | 18.53 (±0.32) ab | 72.20 (±3.22) b | 39.19 (±2.20) | 33.01 (±3.91) ab |
| I100 | 76.00 (±1.44) | 0.17 (±0.01) | 17.82 (±0.20) bc | 64.12 (±0.61) c | 38.37 (±0.64) | 25.75 (±0.99) cde | |
| I150 | 77.20 (±0.80) | 0.17 (±0.01) | 17.53 (±0.44) cd | 63.26 (±0.64) c | 37.84 (±0.76) | 25.42 (±1.07) de | |
| p-value | 0.231 ns | 0.276 ns | 0.004 ** | 0.013 * | 0.189 ns | 0.043 * | |
| LSD 0.05 | - | - | 0.92 | 6.44 | - | 6.21 | |
| 2018 | |||||||
| FR | I50 | 66.80 (±0.80) | 0.14 (±0.01) | 18.57 (±0.21) a | 63.64 (±1.17) | 36.79 (±2.71) | 26.85 (±2.03) bc |
| I100 | 66.00 (±2.77) | 0.15 (±0.01) | 18.97 (±0.60) a | 60.58 (±1.35) | 37.41 (±2.47) | 23.17 (±2.04) cd | |
| I150 | 65.60 (±3.12) | 0.12 (±0.01) | 17.98 (±0.38) a | 55.88 (±0.78) | 39.80 (±1.36) | 16.08 (±2.14) e | |
| RW | I50 | 67.20 (±0.69) | 0.17 (±0.01) | 15.94 (±0.20) b | 62.78 (±0.70) | 31.76 (±1.11) | 31.02 (±1.56) ab |
| I100 | 72.20 (±0.87) | 0.17 (±0.03) | 18.03 (±0.43) a | 58.98 (±0.39) | 33.54 (±0.85) | 25.44 (±1.11) cd | |
| I150 | 64.40 (±2.23) | 0.13 (±0.01) | 16.12 (±0.37) b | 56.44 (±0.50) | 35.53 (±1.54) | 20.91 (±1.03) de | |
| WE | I50 | 76.40 (±0.40) | 0.14 (±0.01) | 15.79 (±0.13) b | 72.46 (±1.16) | 36.56 (±1.03) | 35.90 (±1.76) a |
| I100 | 74.00 (±1.44) | 0.18 (±0.01) | 15.29 (±0.54) b | 70.52 (±1.13) | 42.76 (±1.94) | 27.76 (±2.41) bc | |
| I150 | 71.60 (±0.40) | 0.17 (±0.01) | 16.05 (±0.78) b | 68.40 (±0.60) | 35.00 (±1.29) | 33.40 (±1.00) a | |
| p-value | 0.169 ns | 0.276 ns | 0.035 * | 0.258 ns | 0.075 ns | 0.024 * | |
| LSD 0.05 | - | - | 1.30 | - | - | 5.34 | |
Publisher’s Note: MDPI stays neutral with regard to jurisdictional claims in published maps and institutional affiliations. |
© 2021 by the authors. Licensee MDPI, Basel, Switzerland. This article is an open access article distributed under the terms and conditions of the Creative Commons Attribution (CC BY) license (https://creativecommons.org/licenses/by/4.0/).
Share and Cite
Mattar, M.A.; Soliman, S.S.; Al-Obeed, R.S. Effects of Various Quantities of Three Irrigation Water Types on Yield and Fruit Quality of ‘Succary’ Date Palm. Agronomy 2021, 11, 796. https://doi.org/10.3390/agronomy11040796
Mattar MA, Soliman SS, Al-Obeed RS. Effects of Various Quantities of Three Irrigation Water Types on Yield and Fruit Quality of ‘Succary’ Date Palm. Agronomy. 2021; 11(4):796. https://doi.org/10.3390/agronomy11040796
Chicago/Turabian StyleMattar, Mohamed A., Said S. Soliman, and Rashid S. Al-Obeed. 2021. "Effects of Various Quantities of Three Irrigation Water Types on Yield and Fruit Quality of ‘Succary’ Date Palm" Agronomy 11, no. 4: 796. https://doi.org/10.3390/agronomy11040796