Article

Allometric Individual Leaf Area Estimation in Chrysanthemum

by
Dimitrios Fanourakis
*,
Filippos Kazakos
and
Panayiotis A. Nektarios
Laboratory of Quality and Safety of Agricultural Products, Landscape and Environment, Department of Agriculture, School of Agricultural Sciences, Hellenic Mediterranean University, Estavromenos, 71004 Heraklion, Greece
*
Author to whom correspondence should be addressed.
Agronomy 2021, 11(4), 795; https://doi.org/10.3390/agronomy11040795
Submission received: 18 March 2021 / Revised: 14 April 2021 / Accepted: 16 April 2021 / Published: 18 April 2021

Abstract

:
A model for estimating the area of individual leaves (LA) by employing their dimensions was developed for chrysanthemum. Further hypotheses were tested: (a) LA estimation is improved by considering blade length (Lb) rather than leaf length (L), and (b) a reasonable LA estimation can be attainable by considering L in conjunction to a shape trait, which is cultivar dependent. For the model development, six cultivars were employed (1500 leaves in total), while for model validation, an independent set of nine cultivars was utilized (1125 leaves in total). Several characteristics were digitally assessed in fully expanded leaves which included petiole length, leaf L, width (W), perimeter, shape traits (aspect ratio, circularity, roundness, solidity), together with LA. LA estimation was more accurate by considering both L and W, as compared to a single dimension. A linear model, employing the product of L by W as independent variable, provided the most accurate LA estimation (R2 = 0.84). The model validation indicated a highly significant correlation between computed and measured LA (R2 = 0.88). Replacing L by Lb reasonably predicted LA (R2 = 0.832) but at some expense of accuracy. Contrary to expectation, considering L (or W) and a cultivar-specific shape trait generally led to poor LA estimations.

1. Introduction

Light capture, gas exchange, and thermal regulation mainly take place through leaves [1,2,3]. In this context, plant leaf area (LA) is amongst the most important determinants of crop growth and productivity [4,5]. Whole plant LA is regulated by the interaction of genotype and environmental conditions [6,7]. Interest in the methods that accurately assess plant LA is sourced from crop breeders, agricultural industry, and academia [5,8,9]. Studying its dynamic response to a changing environment is of significant interest to several fields including those of breeding, agricultural management practices, as well as yield forecasting [8,10,11].
Whole plant LA is generally obtained by summing the LA of individual leaves [4,5,6,7]. Various destructive and non-destructive methods have been documented earlier to evaluate the LA of individual leaves, though in situ measurements or measurements under remote field conditions remain a difficult task to undertake [8,12,13]. The conventional approach is generally precise and reliable, though it necessitates excision of the leaf, which thus cannot be retained afterwards [14,15]. This classical method is also time-consuming and requires costly equipment [16]. In addition, considerable measuring errors may be easily introduced when using very small or very narrow leaves, or ones undergoing lamina curvature (incurved or reflexed) [17]. To compound the problem, non-destructive techniques are employed. The most frequent one relies on observations of leaf dimensions (length (L), and width (W)), which are then used as inputs in mathematical models [18,19]. Typically, such prediction models are considered to be strongly species specific, and must encompass several cultivars, representing a wide variation in leaf shape [14,18].
By using the aforementioned models, more accurate LA estimations are generally achieved by using both leaf dimensions [4,20]. The potential for employing a single leaf dimension has been exploited, though the associated reduction in prediction accuracy often outweighs the benefit of reduced labor [21]. The LA estimation based on one-dimensional leaf trait would be accurate, if changes in L would be proportional to changes in W among replicate leaves as well as the leaf shape is not otherwise changing [16]. In most cases, however, there is a strong intraspecific variation in leaf shape [18,19]. Hence, considering a single leaf dimension in combination with a cultivar-specific shape factor is expected to improve the accuracy of LA estimation. In case that such an initiative proves to be successful, it is expected to reduce the required labor and provide leaf shape information, which is unfortunately still uncommon in the relevant literature.
Apart for the aforementioned leaf characteristics, the petiole is a relatively overlooked factor, even though its length is typically included in L determination [17]. Although petiole is generally a small contributor to total LA, its length varies considerably within species [22,23]. Improvements in the accuracy of LA estimation might be therefore attainable through considering blade length (Lb) rather than solely L.
The goal of the present study was to develop a mathematical prediction model for LA estimation by using leaf dimensions in chrysanthemum. The focus of this work extends into considering the potential of exploiting leaf shape information and blade length as possible targets that might permit the improvement of LA estimation accuracy. Chrysanthemum was employed as model species, since it is one of the most popular ornamental plants in the world, hosting a great diversity of flower forms and cultivars, its leaves have irregular shape [24,25], and previous research on non-destructive LA determination is absent.

2. Materials and Methods
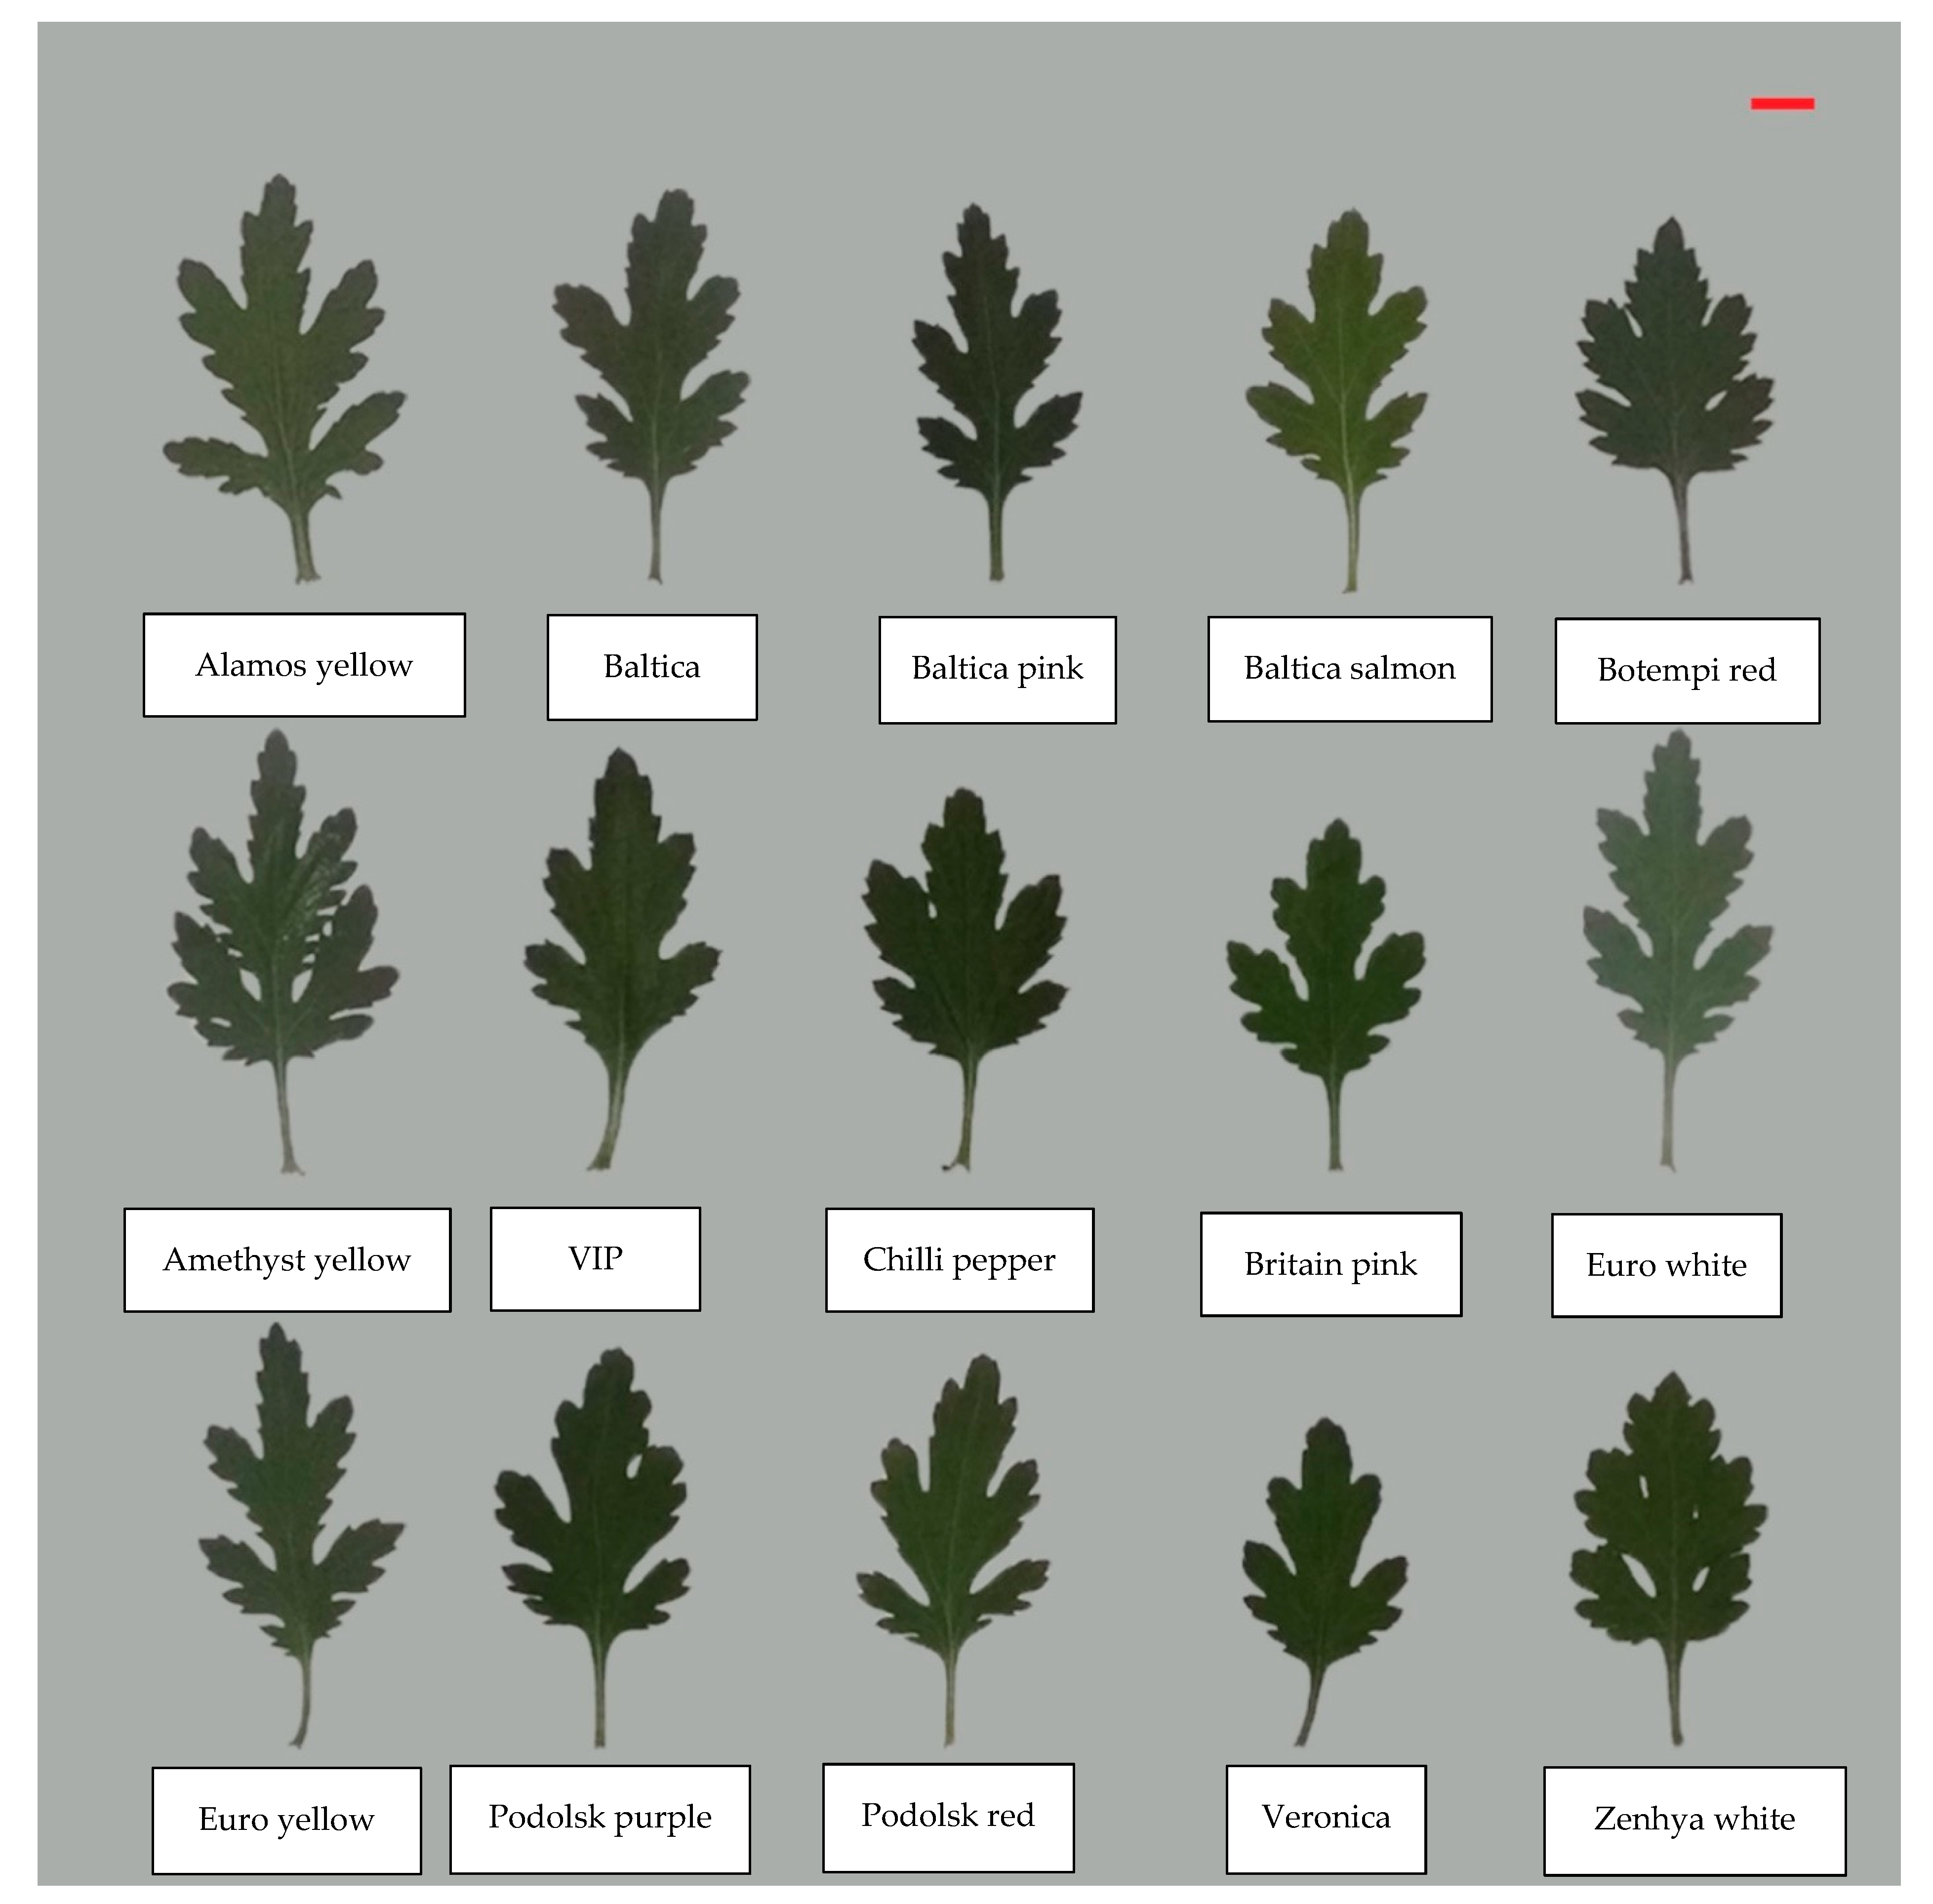
2.1. Plant Material

Two sets of Chrysanthemum morifolium L. cultivars were employed for the current study. The first set was utilized for the development of the LA prediction model and included six cultivars (Alamos yellow, Amethyst yellow, Baltica, Baltica pink, Baltica salmon, and Botempi red), which were collected on 9 June, 2020, from a commercial greenhouse (35°11′0″ N, 25°17′0″ E; Thrapsano, Crete, Greece). The second set was utilized to validate the LA prediction model and involved another nine cultivars (Britain pink, Chili pepper, Euro white, Euro yellow, Podolsk purple, Podolsk red, Veronica, VIP, and Zenhya white), which were collected on 15 June 2020 from another commercial greenhouse (35°0′31″ N, 25°44′23″ E; Ierapetra, Crete, Greece). In both cases, single-stem plants were grown in a multispan plastic greenhouse. Based on preliminary measurements, these 15 cultivars were selected in order to obtain the largest possible variation in leaf L, W and their ratio.
Fully expanded leaves from mature flowering plants without obvious symptoms of pathogen infection or insect damage were randomly sampled throughout the canopy. To retain turgidity, excised leaves were enclosed in plastic envelopes immediately after excision, which were continuously kept under shade. In all cases, the time between sampling and refrigeration (4 °C) did not exceed 30 min.
For each cultivar, 250 and 125 leaves (2–3 leaves/plant) were sampled from the first and second cultivar set, respectively, summing to a total of 2625 leaves.

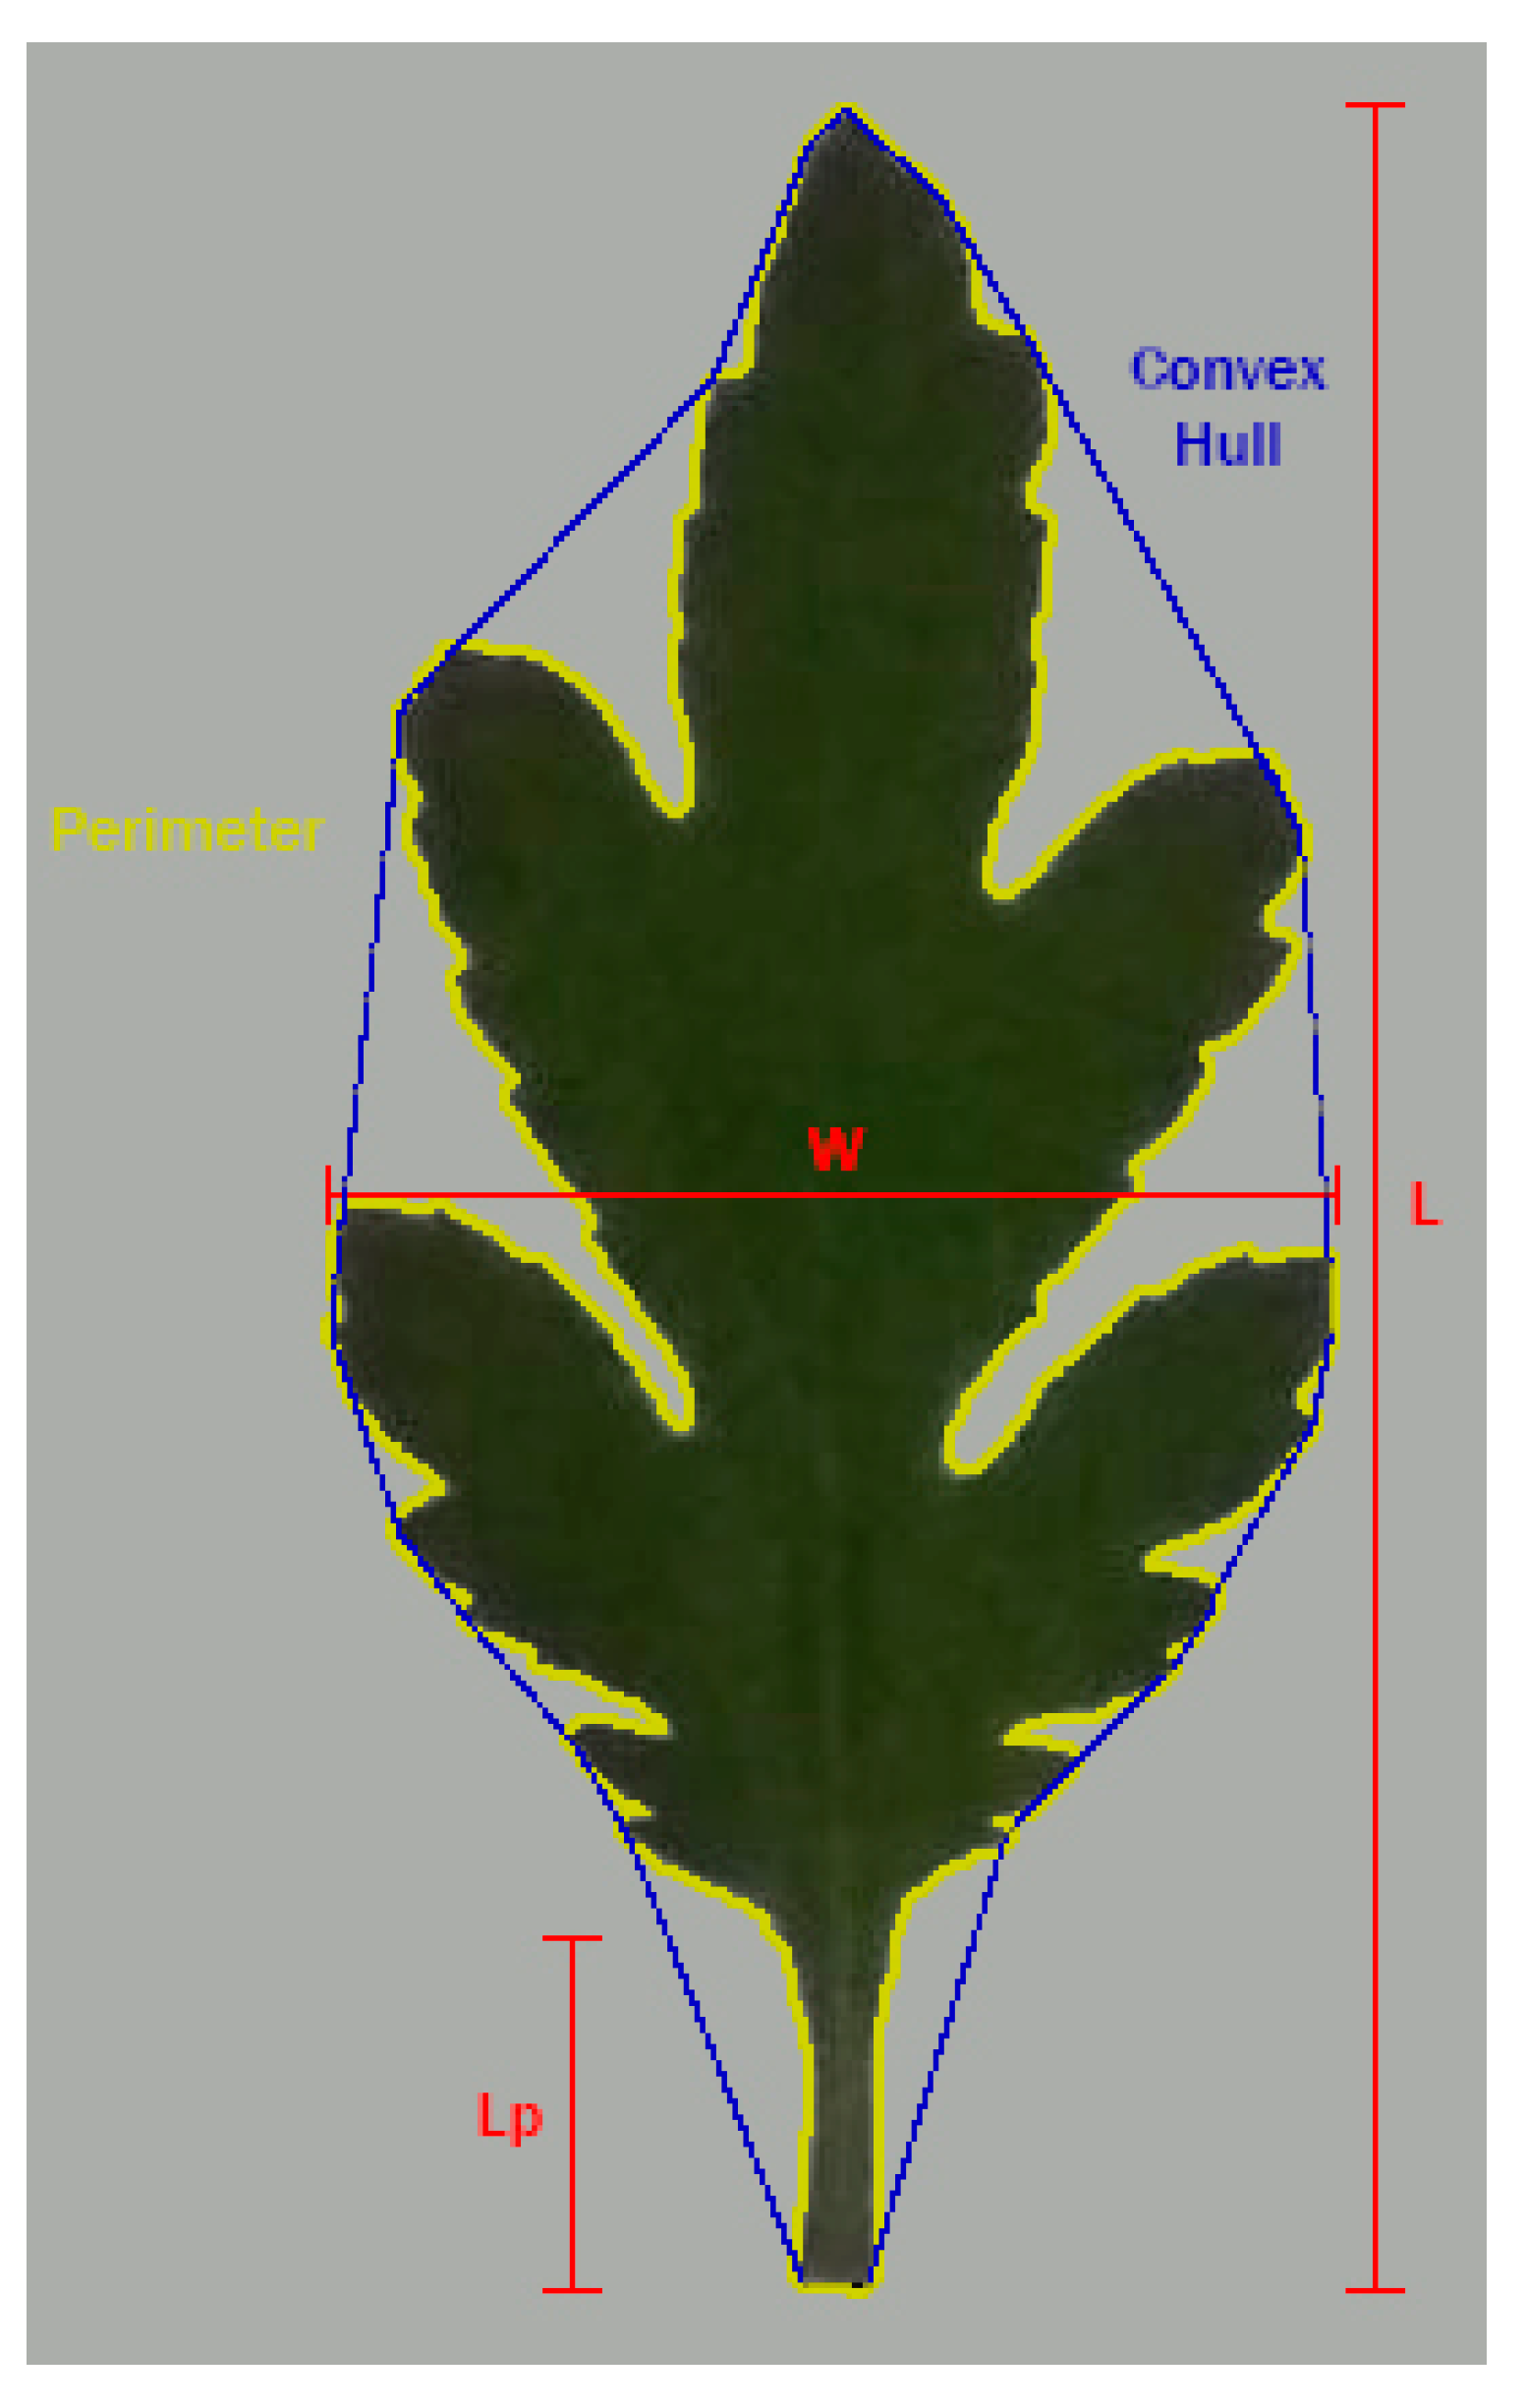
2.2. Morphometric Analysis

Petiole (stalk) length (Lp; from the base to the leaf joint), together with L (midvein length; major axis), W (widest point perpendicular to the leaf major axis; minor axis), leaf perimeter, and LA (one-sided surface area) were digitally assessed in fully expanded leaves (Figure 1). Dimension values were recorded to the nearest 0.1 mm, and LA values to 1 mm2. All traits were derived from images acquired by a digital camera (Sony DSC-W830, Sony Corporation, Tokyo, Japan) under non-reflective glass from a distance of 50 cm, employing a copy stand. Images included two rulers as scale indicators.
Using specialized software (ImageJ; Wayne Rasband/NIH, Bethesda, MD, USA), leaf lamina outlines were also processed to calculate the following four (dimensionless) metrics of leaf form: (a) aspect ratio [(major axis)/(minor axis); axes of the best-fitted ellipse], (b) circularity [(4π × area)/(perimeter)2], (c) roundness [(4 × area)/[4π × (major axis)2]], and (d) solidity [(area)/(convex area)] [26].
Each metric captures a distinct aspect of leaf shape. Aspect ratio and roundness are influenced by the L to W ratio, while circularity and solidity are sensitive to serration and lobing [27]. Aspect ratio ranges from 1 (circle) to a value without an upper bound (infinitely narrow). Roundness ranges from 0 (infinitely narrow) to 1 (circle). Circularity ranges from 0 (infinitely narrow) to 1 (circle). Solidity ranges from 0 to 1, being inversely related to boundary irregularities. Solidity is sensitive to leaves with deep lobes or a distinct petiole and can be used to detect leaves lacking such structures [27]. Solidity, unlike circularity, is not greatly affected by serrations and minor lobings [27].

2.3. Statistical Analysis

For trait comparison among cultivars, a one-way analysis of variance (ANOVA) was performed, and statistically significant differences were based on Tukey’s HSD (honestly significant difference) test.
In order to detect whether or not co-linearity between L and W exists, which would compromise model reliability, both the variance inflation factor [ VIF = 1 1 r 2 ; [28]] and the tolerance value [ T = 1 VIF ; [29]] were calculated. The factor r represents the correlation coefficient between L and W. In case that either the VIF was higher than 10 or the T value was lower than 0.1, then co-linearity would have affected the LA estimation, and consequently, one of these two parameters (L or W) should have been excluded from the model [29].
For the estimation of LA based on leaf dimensions, eight linear and non-linear regression models between the dependent variable (LA) and the independent variables ([L], [Lb], [W], [L and W] and [Lb and W]) were first tested for each cultivar, and then for the whole data set (i.e., all the cultivars were pooled). The equations that were acquired based on the first set of cultivars during model development were further tested on the second set as a model validation procedure. In addition, three (linear and non-linear) regression models between the dependent variable (LA) and the independent variable (L or W) combined with a (cultivar-specific) shape factor were tested for each cultivar of the first set. Least squares regression was employed. The results of the regressions were assessed by comparing both the coefficient of determination (R2), and the mean square errors (MSE). The SPSS software (SPSS Inc., Chicago, IL, USA) was used for data analysis.

3. Results

3.1. Genetic Variation in Leaf Morphological Traits

A large variation was detected in the leaf morphological traits among the 15 cultivars under study (Figure 2). The range of Lp was 2.27–3.50 cm, of L was 10.89–14.09 cm, and of W was 5.57–7.31 cm (Table 1 and Table 2). LA varied between 28.6 and 46.4 cm2.
All parameters related to leaf shape (Lp/L (18.2–27.5%), aspect ratio (1.46–2.09), circularity (0.129–0.216), and roundness (0.485–0.692)) varied by at least 43% among the cultivars under study, except for solidity (0.628–0.720) where the respective difference was 15% (Table 1 and Table 2). Leaf shape parameters were independent of LA both within and among cultivars (data not shown).

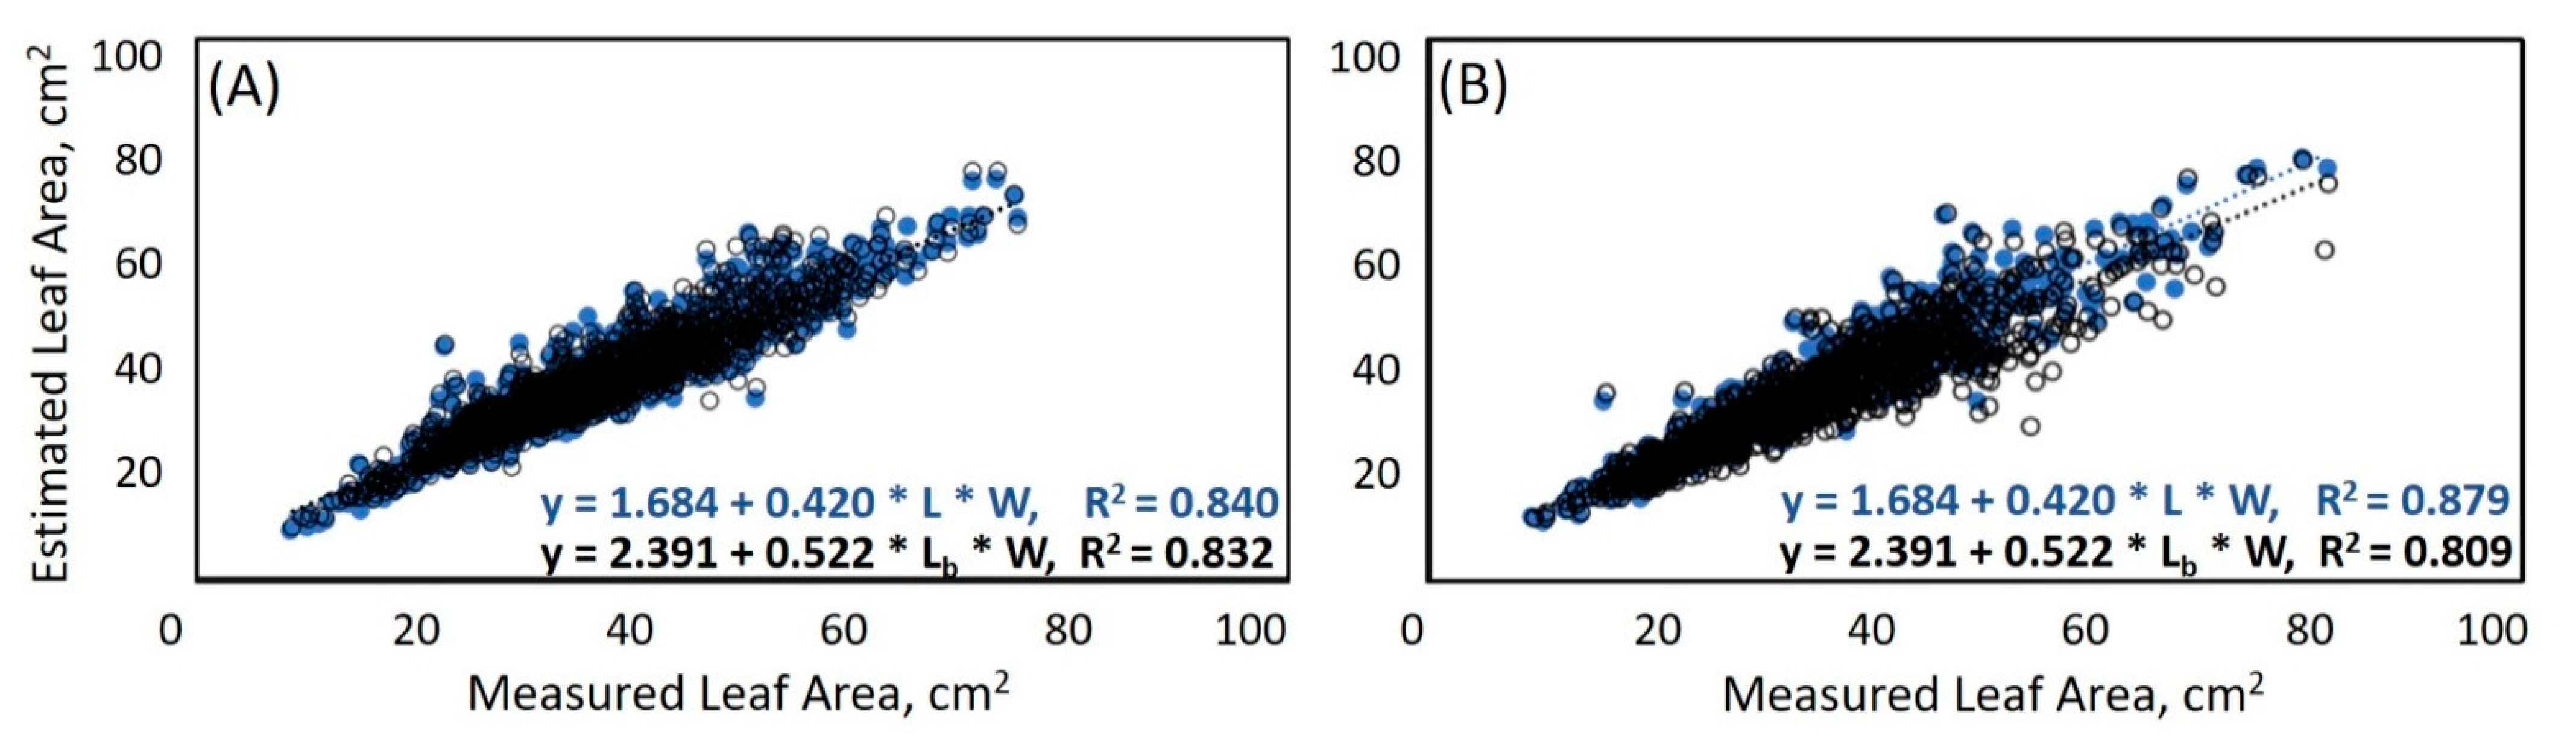
3.2. Calculation of LA Based on Leaf Morphological Traits

The degree of co-linearity between L and W was evaluated by employing the VIF and T parameters. The former was 2.1 and 2.7 for the six and nine cultivars’ set, respectively, while the latter was 0.48 and 0.37. Both parameters indicated that the co-linearity between L and W can be considered insignificant [29] and thus both variables may be included in the LA estimation model.
Each cultivar of the first set was initially assessed separately by employing eight model equations (Supplementary Table S1). LA was estimated by using either a single (L or W; Models 1–4) or both (L and W; Models 5–8) leaf dimensions. In all six cultivars, LA was best estimated (i.e., higher R2 and lower MSE) by using L alone, as compared to W alone (Supplementary Table S1). When both leaf dimensions (L and W) were employed, LA estimation was always improved in all six cultivars, as compared to using a single leaf dimension (Supplementary Table S1). By employing both leaf dimensions, the R2 between measured and estimated LA was reasonably high in all six cultivars, ranging between 0.773 and 0.884. Variation in R2 between Models 5–8 was generally minor (≤3.6% difference), with the exception of one cultivar (Baltica pink), where Model 5 (LA = a + b · L · W) performed less accurately as compared to Models 6–8 (Supplementary Table S1). In four out of six cultivars, Model 7 [LA = a + b (L + W)2] performed marginally better than the remaining ones (Supplementary Table S1), except for cultivar Alamos yellow.
Further analysis included pooling the data of all six cultivars together for model development (Table 3). Similarly to the within cultivar analysis (Supplementary Table S1), taking into consideration both leaf dimensions (L and W) resulted in more accurate LA estimation, as compared to a single leaf dimension (Table 3). Variation in the R2 between Models 5–8 was generally small, with Models 5 (LA = a + b · L · W) and 7 [LA = a + b (L + W)2] performing slightly better (Table 3). By employing both dimensions and Models 5 (Figure 3A) or 7, LA could be accurately estimated (R2 = 0.84 and 0.839, respectively).
The application of the developed models, obtained by the analysis of the first set of six cultivars (model development), was then tested against the data acquired by the second set of nine cultivars, in order to validate the model. In all models, the accuracy of LA estimation was comparable to the one obtained by the first cultivar set (Table 4; Figure 3B).
Since Lp is a significant portion of L in chrysanthemum leaves (Figure 1 and Figure 2) and at the same time petiole is a small contributor to LA, it was hypothesized that considering Lb (i.e., L–Lp) in place of L would improve LA estimation accuracy. Therefore, in this analysis, Models 2 and 4 (including only W) were not tested. Against expectations, the afore-mentioned hypothesis was not supported by the present measurements, since LA estimation became slightly less accurate when using Lb (Figure 3; Table 5 and Table 6). For instance, LA estimation using Model 5 showed a R2 of 0.84 by employing L (Table 3), which decreased to 0.832 when using Lb (Table 5).
Another hypothesis tested in this study was whether or not considering a cultivar-specific shape factor alongside a single leaf dimension would improve the accuracy of one-dimensional LA estimation. In this analysis, therefore, Models 5–8 (including both L and W) were not tested. Regrettably, considering the aspect ratio together with L led to a considerably less accurate LA estimation (Supplementary Table S2). For example, the LA estimation of cultivar Alamos yellow exhibited a R2 of 0.702 by employing L (Model 1; Supplementary Table S1), which was drastically decreased to 0.125 when AR was also considered in LA computation (Supplementary Table S2). Considering another shape indicator (circularity, roundness or solidity) or W (in place of L) resulted in an even lower LA estimation accuracy (data not shown).

4. Discussion

A wide range of agronomic and physiological studies require accurate, simple (rapid and at low-cost), non-invasive methods for LA assessment [30,31,32]. In this study, a validated estimation model of individual LA by considering leaf dimensions (L, W) is presented for chrysanthemum (Table 3). It is probably useful to re-emphasize here that our aim was not to upgrade LA estimation for a standard cultivar, which would require a model for every genotype, but a robust generic model for the species under study.
Within-cultivar analysis was conducted to indicate which leaf dimension alone leads to better LA estimations. In this scenario, the model taking into account L exhibited a better ability to estimate LA as compared to W, in all six cultivars under investigation (Supplementary Table S1). However, when this within-cultivar analysis was performed in the second cultivar set, considering L alone was preferable in terms of LA estimation accuracy as compared to W, in five (out of nine) cultivars (data not shown). The better efficacy of L as a LA indicator, compared to W in most but not all instances, is also reflected by analyzing all cultivars together (Table 3 and Table 4). A similar trend has been reported in Vitis vinifera L. [33] and Olea europaea L. [34], whereas in other taxa, a more accurate LA estimation has been obtained by using W rather than L [Lycopersicon esculentum Mill. [35]; Rubus idaeus L., Ribes rubrum L., Rubus fruticosus L., Ribes grossularia L., Vaccinium corymbosum L. [20]; Malus domestica Borch. [21]). It was determined that using a single leaf dimension may be justified only in cases where the number of evaluations has to be restricted, since it comes at the expense of accuracy (Table 3 and Table 4). In these cases, our results and those of earlier studies [20,21] suggest that for the selection of the leaf dimension with the primary importance to LA estimation, the species of interest must be considered.
By using a single leaf dimension, the accuracy of LA estimation is compromised by the fact that changes in L and W are generally not proportional among replicate leaves, in combination with other changes in leaf shape [16]. Indeed, the L to W ratio (the so-called aspect ratio), and the remaining shape indicators (Lp/L, circularity, roundness, solidity) strongly varied among cultivars (Table 1 and Table 2; see also Figure 2). Considerable within-taxa differences in leaf shape have also been reported in previous studies (V. vinifera [36]; Rosa hybrida L. [37]). We hypothesized that considering a (cultivar-specific) shape factor alongside with a single leaf dimension would overcome the aforementioned bottleneck in LA assessment. Against expectations, this hypothesis was not validated (Supplementary Table S2).
Although leaf shape is considered as a cultivar-specific trait, since variation is more profound in-between rather than within cultivars, a within-cultivar variation is also present [16,18]. More importantly, although single-shape factors are powerful tools for evaluating a specific leaf trait, they are limited in effectively quantifying overall shape [27,38]. Thus, future endeavors may consider a combination of shape parameters for more effective shape description. As a next step, a shape parameter combination may be included in LA estimation models to ensure improved accuracy.
Since petiole is considered part of the leaf, Lp is inherently included in L assessments (i.e., L = Lp + Lb; [17]). Although Lp can be a significant portion of L (18.2–27.5%; Table 1 and Table 2), petiole area is generally rather small (Figure 2; [23]). Therefore, we considered the potential of replacing L with Lb as a target for improvement of LA estimation accuracy. By using Lb (rather than L), LA estimation became slightly less accurate (Figure 3; Table 3, Table 4, Table 5 and Table 6). This small deviation (<4%) in accuracy is explained by the strong positive correlation between Lb and L (R2 = 0.809). Therefore, for LA estimation in chrysanthemum leaves considering either L or Lb exerts a minor impact on accuracy, as long as the respective equations are used for the computation.
However, for obtaining reliable LA estimations, caution ought to be generally exercised for selecting Lb or L. This is because L and Lb are differentially affected by the growth environment, and thus their correlation may not be sustained under specific environmental conditions. For instance, soil submergence [39] or weak light (the so-called shade-avoidance syndrome; [40]) result in increased Lp and decreased Lb.
Environmental conditions during growth were not considered in the current study. However, in order to reinforce and broaden the applicability of the derived LA prediction models, the two cultivar sets were sampled from different growers. Although the period of growth coincided, subtle environmental variation most probably occurred between the two greenhouse cultivations. Therefore, the derived prediction models were validated against phenotypic differences in leaf size and form as an interaction of genetic traits and growth environment. The capacity of the derived models to accommodate cultivars which were produced elsewhere, compared to those which were utilized for model development (Table 3, Table 4, Table 5 and Table 6), reinforces their broad applicability. Earlier work also manifests that the relation between estimated and measured LA was not affected by growing system, salinity level (L. esculentum; [35]) or irrigation regime (O. europaea; [34]), whereas changes in this relation have been previously documented by other environmental factors (altitudinal transect; Saussurea stoliczkai Clarke; [18]). Therefore, the LA estimation model based on leaf dimensions quoted in the current study is expected to show adequate accuracy for various chrysanthemum cultivars grown under the greenhouse cultivation system.
In commercial horticulture, year-round chrysanthemum production is only attainable in protected cultivation through an effective day-length control. Instead, outdoor production is feasible in a rather limited part of the year. The extent to which LA estimation models based on greenhouse-grown plants sustain accuracy in those cultivated under field conditions has not been currently addressed. Environmental conditions differ excessively between indoor and outdoor setups, and this variation may impede sensible greenhouse-to-field extrapolation [41].

5. Conclusions

A model for LA estimation by employing leaf dimensions (L, W) was developed for chrysanthemum. By implementing this model, LA can be readily and non-invasively approximated, without the deployment of highly specialized staff or costly apparatus. Model development was based on six cultivars (1500 leaves), while the model was validated utilizing another nine cultivars (1125 leaves). The selected cultivars included a large variation in both leaf size and shape, as captured by several metrics of leaf form including Lp/L, aspect ratio, circularity, roundness and solidity. An accurate, low cost and easily performed LA estimation is feasible by determining both L and W. Minor differences in estimation accuracy were noted when considering L or Lb, since these two leaf traits were highly correlated. In contrast, considering a single leaf dimension and a shape trait resulted in poor LA estimations.

Supplementary Materials

The following are available online at https://www.mdpi.com/article/10.3390/agronomy11040795/s1, Table S1. Fitted coefficient (b) and constant (a) values of the regression models developed to estimate chrysanthe-mum leaf area (LA) of single leaves from length (L) and width (W) measurements. For each cultivar, 250 leaves were sampled (2–3 leaves/plant). Data were analyzed per cultivar. Morphological parameters of the employed leaves are provided in Table 1. Table S2. Fitted coefficient (b) and constant (a) values of the regression models used to estimate chrysanthemum leaf area (LA) of single leaves from leaf length (L) and the mean aspect ratio (AR) value per cultivar. For each cultivar (Alamos yellow, Amethyst yellow, Baltica pink, Baltica salmon, Baltica, and Botempi red), 250 leaves were sampled (2–3 leaves/plant). Data were analyzed per cultivar. Morphological parameters of the employed leaves are provided in Table 1.

Author Contributions

D.F. conceived and designed the study, carried out the data analysis and interpretation, and wrote the manuscript. F.K. performed the measurements. P.A.N. assisted the data interpretation, edited the manuscript and supervised the study. All authors have read and agreed to the published version of the manuscript.

Funding

This work was funded by the Hellenic Mediterranean University, through an internal post-doctoral research grant to Dimitrios Fanourakis.

Data Availability Statement

The data presented in this study are available on request from the corresponding author. The data are not publicly available due to the possible re-evaluation for future use.

Acknowledgments

We are grateful to the laboratory staff for their contributions, continued diligence, and dedication to their craft. The authors also wish to thank Antonios Stroubakis and Michalis Viannitakis for the donation of the plant material, as well as Georgios Tsaniklidis and Georgios Koubouris for critically reviewing the manuscript. Authors also greatly acknowledge the valuable comments of the editor and three anonymous reviewers.

Conflicts of Interest

The authors declare that they have no known competing financial interests or personal relationships that could have appeared to influence the work reported in this paper.

Abbreviations

Lleaf length
LAleaf area
Lbblade length
Lppetiole length
Ttolerance
VIFvariance inflation factor
Wleaf width

References

  1. Fanourakis, D.; Hyldgaard, B.; Giday, H.; Bouranis, D.; Körner, O.; Nielsen, K.L.; Ottosen, C.O. Differential effects of elevated air humidity on stomatal closing ability of Kalanchoë blossfeldiana between the C3 and CAM states. Environ. Exp. Bot. 2017, 143, 115–124. [Google Scholar] [CrossRef]
  2. Fauset, S.; Freitas, H.C.; Galbraith, D.R.; Sullivan, M.J.P.; Aidar, P.M.; Joly, C.A.; Gloor, M.U. Differences in leaf thermoregulation and water use strategies between three co-occurring Atlantic forest tree species. Plant Cell Environ. 2018, 41, 1618–1631. [Google Scholar] [CrossRef] [PubMed] [Green Version]
  3. Zou, J.; Zhang, Y.; Zhang, Y.; Bian, Z.; Fanourakis, D.; Yang, Q.; Li, T. Morphological and physiological properties of indoor cultivated lettuce in response to additional far-red light. Sci. Hortic. 2019, 257, 108725. [Google Scholar] [CrossRef]
  4. Keramatlou, I.; Sharifani, M.; Sabouri, H.; Alizadeh, M.; Kamkar, B. A simple linear model for leaf area estimation in persian walnut (Juglans Regia L.). Sci. Hortic. 2015, 184, 36–39. [Google Scholar] [CrossRef]
  5. Li, S.; van der Werf, W.; Zhu, J.; Guo, Y.; Li, B.; Ma, Y.; Evers, J.B. Estimating the contribution of plant traits to light partitioning in simultaneous maize/soybean intercropping. J. Exp. Bot. 2021, erab077. [Google Scholar] [CrossRef]
  6. Honnaiah, P.A.; Sridhara, S.; Gopakkali, P.; Ramesh, N.; Mahmoud, E.A.; Alkallas, F.H.; Abdelmohsen, S.A.M.; El-Ansary, D.O.; Elansary, H.O. Influence of sowing windows and genotypes on growth, radiation interception, conversion efficiency and yield of guar. Saudi J. Biol. Sci. 2021. [Google Scholar] [CrossRef]
  7. Jo, W.J.; Shin, J.H. Effect of leaf-area management on tomato plant growth in greenhouses. Hortic. Environ. Biotechnol. 2020, 61, 981–988. [Google Scholar] [CrossRef]
  8. Fiorani, F.; Schurr, U. Future scenarios for plant phenotyping. Annu. Rev. Plant Biol. 2012, 64, 1–17. [Google Scholar] [CrossRef] [Green Version]
  9. Fanourakis, D.; Giday, H.; Hyldgaard, B.; Bouranis, D.; Körner, O.; Ottosen, C.O. Low air humidity during growth promotes stomatal closure ability in roses. Eur. J. Hortic. Sci. 2019, 84, 245–252. [Google Scholar] [CrossRef] [Green Version]
  10. Huang, J.; Tian, L.; Liang, S.; Becker-Reshef, I.; Su, W.; Zhang, X.; Zhu, D.; Wu, W. Improving winter wheat yield estimation by assimilation of the leaf area index from Landsat TM and MODIS data into the WOFOST model. Agric. For. Meteorol. 2015, 204, 106–121. [Google Scholar] [CrossRef] [Green Version]
  11. Fanourakis, D.; Bouranis, D.; Tsaniklidis, G.; Rezaei Nejad, A.; Ottosen, C.O.; Woltering, E.J. Genotypic and phenotypic differences in fresh weight partitioning of cut rose stems: Implications for water loss. Acta Physiol. Plant. 2020, 42, 48. [Google Scholar] [CrossRef]
  12. Fanourakis, D.; Briese, C.; Max, J.F.J.; Kleinen, S.; Putz, A.; Fiorani, F.; Ulbrich, A.; Schurr, U. Rapid determination of leaf area and plant height by using light curtain arrays in four species with contrasting shoot architecture. Plant Methods 2014, 10, 9. [Google Scholar] [CrossRef] [PubMed] [Green Version]
  13. Das Choudhury, S.; Bashyam, S.; Qiu, Y.; Samal, A.; Awada, T. Holistic and component plant phenotyping using temporal image sequence. Plant Methods 2018, 14, 35. [Google Scholar] [CrossRef] [PubMed]
  14. Antunes, W.C.; Pompelli, M.F.; Carretero, D.M.; Da Matta, F.M. Allometric models for non-destructive leaf area estimation in coffee (Coffea arabica and Coffea canephora). Ann. Appl. Biol. 2008, 153, 33–40. [Google Scholar] [CrossRef] [Green Version]
  15. Pompelli, M.F.; Antunes, W.C.; Ferreira, D.T.R.G.; Cavalcante, P.G.S.; Wanderley-Filho, H.C.L.; Endres, L. Allometric models for non-destructive leaf area estimation of Jatropha curcas. Biomass Bioenergy 2012, 36, 77–85. [Google Scholar] [CrossRef]
  16. Verwijst, T.; Wen, D.Z. Leaf allometry of Salix viminalis during the first growing season. Tree Physiol. 1996, 16, 655–660. [Google Scholar] [CrossRef]
  17. Cornelissen, J.H.C.; Lavorel, S.; Garnier, E.; Díaz, S.; Buchmann, N.; Gurvich, D.E.; Reich, P.B.; Ter Steege, H.; Morgan, H.D.; Van Der Heijden, M.G.A.; et al. A handbook of protocols for standardised and easy measurement of plant functional traits worldwide. Austr. J. Bot. 2003, 51, 335–380. [Google Scholar] [CrossRef] [Green Version]
  18. Wang, Z.; Zhang, L. Leaf shape alters the coefficients of leaf area estimation models for Saussurea stoliczkai in central Tibet. Photosynthetica 2012, 50, 337–342. [Google Scholar] [CrossRef]
  19. Yu, X.J.; Shi, P.J.; Schrader, J.; Niklas, K.J. Nondestructive estimation of leaf area for 15 species of vines with different leaf shapes. Am. J. Bot. 2020, 107, 1481–1490. [Google Scholar] [CrossRef]
  20. Fallovo, C.; Cristofori, V.; Mendoza-de Gyves, E.; Rivera, C.M.; Fanasca, S.; Bignami, C.; Sassine, Y.; Rouphael, Y. Leaf area estimation model for small fruits from linear measurements. HortScience 2008, 43, 2263–2267. [Google Scholar] [CrossRef] [Green Version]
  21. Sala, F.; Arsene, G.G.; Iordănescu, O.; Boldea, M. Leaf area constant model in optimizing foliar area measurement in plants: A case study in apple tree. Sci. Hortic. 2015, 193, 218–224. [Google Scholar] [CrossRef]
  22. Perez-Perez, J.M.; Serrano-Cartagena, J.; Micol, J.L. Genetic analysis of natural variations in the architecture of Arabidopsis thaliana vegetative leaves. Genetics 2002, 162, 893–915. [Google Scholar]
  23. Niinemets, Ü.; Al Afas, N.; Cescatti, A.; Pellis, A.; Ceulemans, R. Petiole length and biomass investment in support modify light interception efficiency in dense poplar plantations. Tree Physiol. 2004, 24, 141–154. [Google Scholar] [CrossRef] [PubMed]
  24. Gao, K.; Song, X.; Kong, D.; Dai, S. Genetic analysis of leaf traits in small-flower chrysanthemum (Chrysanthemum × morifolium Ramat.). Agronomy 2020, 10, 697. [Google Scholar] [CrossRef]
  25. Seif, M.; Aliniaeifard, S.; Arab, M.; Mehrjerdi, M.Z.; Shomali, A.; Fanourakis, D.; Li, T.; Woltering, E. Monochromatic red light during plant growth decreases the size and improves the functionality of stomata in chrysanthemum. Funct. Plant Biol. 2021, 48, 515–528. [Google Scholar] [CrossRef]
  26. Chitwood, D.H.; Kumar, R.; Ranjan, A.; Pelletier, J.M.; Townsley, B.; Ichihashi, Y.; Martinez, C.C.; Zumstein, K.; Harada, J.J.; Maloof, J.N.; et al. Light-induced indeterminacy alters shade avoiding tomato leaf morphology. Plant Physiol. 2015, 169, 2030–2047. [Google Scholar] [CrossRef] [Green Version]
  27. Gupta, S.; Rosenthal, D.M.; Stinchcombe, J.R.; Baucom, R.S. The remarkable morphological diversity of leaf shape in sweetpotato (Ipomoea batatas): The influence of genetics, environment, and G9E. New Phytol. 2020, 225, 2183–2195. [Google Scholar] [CrossRef]
  28. Marquaridt, D.W. Generalized inverses, ridge regression, biased linear estimation, and nonlinear estimation. Technometrics 1970, 12, 591–612. [Google Scholar] [CrossRef]
  29. Gill, J. Outliers, residuals, and influence in multiple regression. J. Anim. Breed. Genet. 1986, 103, 161–175. [Google Scholar] [CrossRef]
  30. Hassanvand, F.; Rezaei Nejad, A.; Fanourakis, D. Morphological and physiological components mediating the silicon-induced enhancement of geranium essential oil yield under saline conditions. Ind. Crops Prod. 2019, 134, 19–25. [Google Scholar] [CrossRef]
  31. Waldner, F.; Chen, Y.; Horan, H.; Hochan, Z. High temporal resolution of leaf area data improves empirical estimation of grain yield. Sci. Rep. 2019, 9, 1–4. [Google Scholar] [CrossRef] [Green Version]
  32. Sørensen, H.K.; Fanourakis, D.; Tsaniklidis, G.; Bouranis, D.; Rezaei Nejad, A.; Ottosen, C.O. Using artificial lighting based on electricity price without a negative impact on growth, visual quality or stomatal closing response in Passiflora. Sci. Hortic. 2020, 267, 109354. [Google Scholar] [CrossRef]
  33. Montero, F.J.; de Juan, J.A.; Cuesta, A.; Brasa, A. Nondestructive methods to estimate leaf area in Vitis vinifera L. HortScience 2000, 35, 696–698. [Google Scholar] [CrossRef]
  34. Koubouris, G.; Bouranis, D.; Vogiatzis, E.; Rezaei Nejad, A.; Giday, H.; Tsaniklidis, G.; Ligoxigakis, E.K.; Blazakis, K.; Kalaitzis, P.; Fanourakis, D. Leaf area estimation by considering leaf dimensions in olive tree. Sci. Hortic. 2018, 240, 440–445. [Google Scholar] [CrossRef]
  35. Schwarz, D.; Kläring, H.P. Allometry to estimate leaf area of tomato. J. Plant Nutr. 2001, 24, 1291–1309. [Google Scholar] [CrossRef]
  36. Chitwood, D.H.; Ranjan, A.; Martinez, C.C.; Headland, L.R.; Thiem, T.; Kumar, R.; Covington, M.F.; Hatcher, T.; Naylor, D.T.; Zimmerman, S.; et al. A modern ampelography: A genetic basis for leaf shape and venation patterning in grape. Plant Physiol. 2014, 164, 259–272. [Google Scholar] [CrossRef] [PubMed] [Green Version]
  37. Fanourakis, D.; Giday, H.; Li, T.; Kambourakis, E.; Ligoxigakis, E.K.; Papadimitriou, M.; Strataridaki, A.; Bouranis, D.; Fiorani, F.; Heuvelink, E.; et al. Antitranspirant compounds alleviate the mild-desiccation-induced reduction of vase life in cut roses. Postharvest Biol. Technol. 2016, 117, 110–117. [Google Scholar] [CrossRef]
  38. Backhaus, A.; Kuwabara, A.; Bauch, M.; Monk, N.; Sanguinetti, G.; Fleming, A. LEAFPROCESSOR: A new leaf phenotyping tool using contour bending energy and shape cluster analysis. New Phytol. 2010, 187, 251–261. [Google Scholar] [CrossRef] [PubMed]
  39. Wooten, J.W. Variations in leaf characteristics of six species of Sagittaria (Alismataceae) caused by various water levels. Aquatic Bot. 1986, 23, 321–327. [Google Scholar] [CrossRef]
  40. Tsukaya, H.; Kozuka, T.; Kim, G.T. Genetic control of petiole length in Arabidopsis thaliana. Plant Cell Physiol. 2002, 43, 1221–1228. [Google Scholar] [CrossRef] [PubMed] [Green Version]
  41. Poorter, H.; Fiorani, F.; Pieruschka, R.; Wojciechowski, T.; van der Putten, W.; Kleyer, M.; Schurr, U.; Postma, J. Pampered inside, pestered outside? Differences and similarities between plants growing in controlled conditions and in the field. New Phytol. 2016, 212, 838–855. [Google Scholar] [CrossRef] [PubMed]
Figure 1. Indicative types of measurements of chrysmanthemum leaves, including petiole length (Lp), leaf length (L) and width (W), as assessed in the current study.
Agronomy 11 00795 g001
Figure 2. Representative leaves of the cultivars under study. Leaves included in the figure were selected to present an area in proximity to the cultivar mean (Table 1 and Table 2). The scale bar refers to 20 mm length.
Agronomy 11 00795 g002
Figure 3. Estimated versus measured leaf area in six (model construction; A), and nine (model validation; B) cultivars. Estimation was based on either leaf length (L) and width (W) (statistics in Table 3 and Table 4) or blade length (Lb) and W (statistics in Table 5 and Table 6) by using Model 5 (LA = a + b · L · W and LA = a + b · Lb · W, respectively). Morphological parameters of the employed leaves are provided in Table 1 and Table 2. In insert A, one line is apparent, since the two lines overlap.
Agronomy 11 00795 g003
Table 1. Genetic variation of leaf morphological traits of the six chrysanthemum cultivars utilized for model development. Means (±SE) followed by different letters within each column indicate significant differences based on Tukey’s honest significant difference test at p ≤ 0.05. For each cultivar, 250 leaves were sampled (2–3 leaves/plant).
CultivarLength
(cm)
Width
(cm)
Petiole Length (cm)Petiole Length/Leaf Length (%)Leaf Area (cm2)Perimeter (cm)CircularityAspect RatioRoundnessSolidity
Alamos yellow13.01 b (±0.09)7.31 a (±0.08)2.37 c (±0.03)18.2 e (±0.2)41.7 b (±0.6)62.5 b (±0.6)0.136 c,d (±0.002)1.69 c (±0.01)0.596 b (±0.004)0.665 b (±0.004)
Baltica12.75 b,c (±0.08)5.98 c (±0.05)2.60 b (±0.03)20.4 d (±0.2)34.4 c (±0.4)56.6 c (±0.5)0.137 c,d (±0. 002)1.93 b (±0.01)0.522 c (±0.003)0.671 b (±0.002)
Baltica pink12.31 d (±0.08)5.62 d (±0.05)2.45 c (±0.02)20.0 d (±0.2)29.3 d (±0.4)49.2 e (±0.4)0.153 b (±0.001)2.04 a (±0.01)0.497 d (±0.004)0.628 c (±0.003)
Baltica salmon12.54 c,d (±0.09)5.74 c,d (±0.05)2.70 b (±0.03)21.6 c (±0.2)31.1 d (±0.5)52.9 d (±0.6)0.141 c (±0.002)2.09 a (±0.02)0.485 d (±0.004)0.635 c (±0.003)
Botempi red11.73 e (±0.10)6.31 b (±0.05)2.70 b (±0.04)22.9 b (±0.2)35.1 c (±0.5)50.6 d,e (±0.5)0.173 a (±0.002)1.51 d (±0.01)0.667 a (±0.003)0.706 a (±0.002)
Amethyst yellow14.09 a (±0.13)7.22 a (±0.07)3.35 a (±0.04)23.8 a (±0.3)46.4 a (±0.9)66.8 a (±0.8)0.133 d (±0.002)1.71 c (±0.03)0.609 b (±0.006)0.665 b (±0.006)
p0.0010.0010.0010.0010.0010.0010.0010.0010.0010.001
Table 2. Genetic variation of leaf morphological traits of the nine chrysanthemum cultivars utilized for model validation. Means (±SE) followed by different letters within each column indicate significant differences based on Tukey’s honest significant difference test at p ≤ 0.05. For each cultivar, 125 leaves were sampled (2–3 leaves/plant).
CultivarLength
(cm)
Width
(cm)
Petiole Length (cm)Petiole Length/Leaf Length (%)Leaf Area (cm2)Perimeter (cm)CircularityAspect RatioRoundnessSolidity
VIP12.83 b,c (±0.15)6.42 a,b (±0.11)3.50 a (±0.06)27.3 a (±0.4)37.5 a,b,c (±1.1)49.7 b (±0.8)0.190 b,c (±0.003)1.77 b,c (±0.02)0.571 c (±0.005)0.692 b,c (±0.004)
Chili pepper12.46 c,d (±0.17)6.54 a,b (±0.11)2.58 c (±0.06)20.7 c,d (±0.4)38.6 a,b,c (±1.1)51.7 b (±1.0)0.187 c (±0.004)1.64 d (±0.01)0.614 b (±0.005)0.701 b,c (±0.003)
Britain pink11.35 e,f (±0.14)5.97 c,d (±0.09)2.63 c (±0.04)23.4 b (±0.4)30.3 d,e (±0.9)42.2 c (±0.8)0.216 a (±0.004)1.69 c,d (±0.02)0.603 b (±0.007)0.689 b,c (±0.004)
Euro white14.09 a (±0.21)6.48 a,b (±0.12)3.33 a (±0.08)23.5 b (±0.4)39.0 a,b (±1.2)56.0 a (±1.0)0.156 d (±0.002)1.95 a (±0.02)0.517 d (±0.005)0.663 d (±0.003)
Euro yellow13.36 b (±0.16)6.47 a,b (±0.10)2.96 b (±0.05)22.2 b,c (±0.3)35.7 b,c (±0.8)58.7 a (±1.0)0.135 e (±0.003)1.94 a (±0.02)0.523 d (±0.006)0.634 e (±0.003)
Podolsk purple12.83 b,c (±0.14)6.30 a,b,c (±0.11)2.68 c (±0.05)21.0 c,d (±0.4)35.7 b,c (±1.0)59.5 a (±1.1)0.131 e (±0.003)1.82 b (±0.03)0.561 c (±0.007)0.663 d (±0.005)
Podolsk red12.83 b,c (±0.15)6.10 b,c (±0.09)2.53 c (±0.04)19.8 d (±0.3)34.5 c,d (±0.8)58.8 a (±1.1)0.129 e (±0.003)1.78 b (±0.02)0.570 c (±0.006)0.685 c (±0.004)
Veronica10.89 f (±0.16)5.57 d (±0.09)2.27 d (±0.03)21.0 c,d (±0.3)28.6 e (±0.8)42.9 c (±0.8)0.197 b,c (±0.003)1.81 b (±0.01)0.557 c (±0.004)0.702 b (±0.002)
Zenhya white12.01 d,e (±0.14)6.70 a (±0.09)3.29 a (±0.04)27.5 a (±0.3)40.5 a (±1.1)50.4 b (±0.8)0.204 a,b (±0.004)1.46 e (±0.01)0.692 a (±0.005)0.720 a (±0.004)
p0.0010.0010.0010.0010.0010.0010.0010.0010.0010.001
Table 3. Fitted coefficient (b) and constant (a) values of the regression models used to estimate chrysanthemum leaf area (LA) of single leaves from length (L) and width (W) measurements. For each cultivar (Alamos yellow, Amethyst yellow, Baltica pink, Baltica salmon, Baltica, and Botempi red), 250 leaves were sampled (2–3 leaves/plant). All data were pooled and analyzed together. Morphological parameters of the employed leaves are provided in Table 1.
ModelFitted Coefficient and ConstantR2, zMSE zPRESS zSSE z
ab
1LA = a + b · L−33.1075.4490.70635.295.9452858
2LA = a + b · W15.2028.0990.73232.245.6848300
3LA = a + b · L20.1420.2190.72433.125.7649614
4LA = a + b · W211.0110.6050.71833.875.8250741
5LA = a + b · L · W1.6840.4200.84019.254.3928841
6LA = a + b (L + W)−35.5153.7610.82720.764.5631102
7LA = a + b (L + W)2−0.4430.0990.83919.294.3928899
8LA = a (L + W)311.8740.0030.83320.094.4830090
z R2, coefficient of determination; MSE, mean square errors (cm2); PRESS, predicted residual error sum of squares; SSE, error sum of squares.
Table 4. Validation of the regression models developed to estimate chrysanthemum leaf area (LA) of single leaves from length (L) and width (W) measurements. The models were validated utilizing another set of nine cultivars (Britain pink, Chili pepper, Euro white, Euro yellow, Podolsk purple, Podolsk red, Veronica, VIP, and Zenhya white). For each cultivar, 125 leaves were sampled (2–3 leaves/plant). All data were pooled and analyzed together. Morphological parameters of the employed leaves are provided in Table 2.
ModelFitted Coefficient and ConstantR2, zMSE zPRESS zSSE z
ab
1LA = a + b · L−33.1075.4490.76330.875.5630803
2LA = a + b · W15.2028.0990.82422.924.7922870
3LA = a + b · L20.1420.2190.76430.825.5530762
4LA = a + b · W211.0110.6050.81624.064.9124011
5LA = a + b · L · W1.6840.4200.87915.743.9715706
6LA = a + b (L + W)−35.5153.7610.86018.214.2718168
7LA = a + b (L + W)2−0.4430.0990.86417.784.2217745
8LA = a (L + W)311.8740.0030.84520.194.4920153
z R2, coefficient of determination; MSE, mean square errors (cm2); PRESS, predicted residual error sum of squares; SSE, error sum of squares.
Table 5. Fitted coefficient (b) and constant (a) values of the regression models used to estimate chrysanthemum leaf area (LA) of single leaves from blade length (Lb) and width (W) measurements. For each cultivar (Alamos yellow, Amethyst yellow, Baltica pink, Baltica salmon, Baltica, and Botempi red), 250 leaves were sampled (2–3 leaves/plant). All data were pooled and analyzed together. Morphological parameters of the employed leaves are provided in Table 1.
ModelFitted Coefficient and ConstantR2, zMSE zPRESS zSSE z
ab
1LA = a + b · Lb−25.9126.1940.65241.736.4662466
3LA = a + b · Lb23.8810.3150.66640.086.3359997
5LA = a + b · Lb · W2.3910.5220.83220.124.4930119
6LA = a + b (Lb + W)−32.2724.1800.81721.914.6832802
7LA = a + b (Lb + W)21.3260.1270.82620.834.5631186
8LA = a (Lb + W)313.1150.0050.81722.004.6932939
z R2, coefficient of determination; MSE, mean square errors (cm2); PRESS, predicted residual error sum of squares; SSE, error sum of squares.
Table 6. Validation of the regression models developed to estimate chrysanthemum leaf area (LA) of single leaves from blade length (Lb) and width (W) measurements. The models were validated utilizing another set of nine cultivars (Britain pink, Chili pepper, Euro white, Euro yellow, Podolsk purple, Podolsk red, Veronica, VIP, and Zenhya white). For each cultivar, 125 leaves were sampled (2–3 leaves/plant). All data were pooled and analyzed together. Morphological parameters of the employed leaves are provided in Table 2.
ModelFitted Coefficient and ConstantR2, zMSE zPRESS zSSE z
ab
1LA = a + b · Lb−25.9126.1940.60154.217.3660818
3LA = a + b · Lb23.8810.3150.59654.927.4161623
5LA = a + b · Lb · W2.3910.5220.80925.995.1029159
6LA = a + b (Lb + W)−32.2724.1800.78529.265.4132831
7LA = a + b (Lb + W)21.3260.1270.78129.725.4533351
8LA = a (Lb + W)313.1150.0050.75932.835.7336839
z R2, coefficient of determination; MSE, mean square errors (cm2); PRESS, predicted residual error sum of squares; and SSE, error sum of squares.
Publisher’s Note: MDPI stays neutral with regard to jurisdictional claims in published maps and institutional affiliations.

