Article

Combining QTL Mapping and Gene Expression Analysis to Elucidate the Genetic Control of ‘Crumbly’ Fruit in Red Raspberry (Rubus idaeus L.)

Cell and Molecular Sciences, The James Hutton Institute, Dundee DD2 5DA, Scotland, UK
*
Author to whom correspondence should be addressed.
Agronomy 2021, 11(4), 794; https://doi.org/10.3390/agronomy11040794
Submission received: 15 February 2021 / Revised: 13 April 2021 / Accepted: 14 April 2021 / Published: 17 April 2021

Abstract

:
‘Crumbly’ fruit is a developmental disorder in raspberry that results in malformed and unsaleable fruits. For the first time, we define two distinct crumbly phenotypes as part of this work. A consistent crumbly fruit phenotype affecting the majority of fruits every season, which we refer to as crumbly fruit disorder (CFD) and a second phenotype where symptoms vary across seasons as malformed fruit disorder (MFD). Here, segregation of crumbly fruit of the MFD phenotype was examined in a full-sib family and three QTL (Quantitative Trait Loci) were identified on a high density GbS (Genotype by Sequencing) linkage map. This included a new QTL and more accurate location of two previously identified QTLs. A microarray experiment using normal and crumbly fruit at three different developmental stages identified several genes that were differentially expressed between the crumbly and non-crumbly phenotypes within the three QTL. Analysis of gene function highlighted the importance of processes that compromise ovule fertilization as triggers of crumbly fruit. These candidate genes provided insights regarding the molecular mechanisms involved in the genetic control of crumbly fruit in red raspberry. This study will contribute to new breeding strategies and diagnostics through the selection of molecular markers associated with the crumbly trait.

1. Introduction

A condition known as ‘crumbly’ fruit occurs to contrasting degrees in different raspberry varieties and is an indication of partial failure of the physiological processes of fruit development. Crumbly fruit has been linked to pollen abortion and embryo sac degeneration. Here, drupelet numbers are reduced but greatly enlarged in size. Even in the case of small reductions, the drupelets cohere imperfectly so the fruit crumbles when picked [1]. Such fruits are not commercially viable and represent a loss of yield for raspberry growers. Crumbly fruit is a generic term used to describe a specific fruit phenotype; however, two forms exist based on the levels of severity. This leads us to reclassify crumbly fruit as either ‘Crumbly Fruit Condition (CFC)’, defined as plants where all fruits are symptomatic every season, or ‘Malformed Fruit Disorder (MFD)’, defined as plants that display crumbly fruit, but symptoms are intermittent within a year or across seasons [2]. MFD can vary from being mild, where it occurs at the beginning of fruit production and mainly on the top lateral shoot with fewer symptoms observed as the season progresses, to being severe with malformed fruits observed throughout the entire fruiting season on most or all the laterals. CFC is genetically controlled, however MFD varies both genetically and also with environmental conditions that affect the expression of the symptoms across seasons. Many causes have been proposed. Virus infections may compromise the ability of pollen to induce fruit set. Viruses of concern include Raspberry Bushy Dwarf Virus (RBDV), Raspberry Leaf Mottle Virus (RLMV), and Raspberry Latent Virus (RpLV). These viruses alone, or in combination, can cause a severe form of crumbly fruit [3]. Repeated cycles of micropropagation, or too low or too high temperatures during specific periods of raspberry development can contribute to the appearance of crumbly symptoms [1]. MFD causes serious concern for growers as it appears intermittently and hence propagated material that may display MFD cannot be easily identified.
Previous genetic mapping of the crumbly trait in the bi-parental Latham x Glen Moy raspberry population identified two Quantitative Trait Loci (QTL) on linkage groups (LG) 1 and 3 [1], here named cr_JHI_1–15 and cr_JHI_3–15, respectively. The pollen borne RBDV virus, the most likely cause of crumbly fruit, was not detected in any of these plants [1].
Recently, a number of resources have become available to allow us to gain further insight into the control of MFD. A high-density GbS map linked to the genome sequences of Latham and Glen Moy has been developed [4] and here we re-analyze the data presented by Graham et al. [1] using this GbS map. This has allowed both greater precision in defining the previously identified loci and also identified a new locus (cr_JHI_3–20) associated with MFD. In addition, as the GbS map is linked to genome scaffolds of Latham and Glen Moy, gene content in any QTL regions identified can be examined. Furthermore, we conducted transcriptome analyses of crumbly and non-crumbly plants at three stages of development. The use of these resources provided greater knowledge of the cause and control of MFD. This combined analysis identified candidate genes underlying QTL for the crumbly phenotype and represents an important starting point for the development of strategies (i.e., molecular markers for diagnosis and marker assisted selection) to combat the occurrence of the crumbly fruit phenomenon.

2. Materials and Methods

2.1. Plant Material

The mapping population described previously [1], consists of a full sib family generated from a cross between the European red raspberry cultivar Glen Moy and the North American red raspberry cultivar Latham; with the latter exhibiting crumbly phenotype.

2.2. Genomic Analysis: Quantitative Trait Loci (QTL)

Data from Graham et al. [1] was re-analyzed on a Genotyping by Sequencing (GbS) map [4]. QTL positions were identified using a hidden Markov model (HMM) [5]. This is used as initial QTL identified using interval mapping in MapQTL 5 (Kyazma BV, Wageningen, The Netherlands) [6], gave logarithm of the odds (LOD) ratio profiles that were unexpectedly irregular, given the high-density map, which resulted in uncertainty in locating the peak LOD score. The highest LOD score was used to identify the most likely QTL position while the two LOD drop-off method was adopted for estimating the supporting interval for the identified QTL position [7].
Plots of the linkage groups and associated QTLs were produced in MapChart software version 2.32 (Wageningen University, Wageningen, The Netherlands).

2.3. Isolation of RNA

For each replicate sample, 70–90 mg of plant material was ground in liquid nitrogen and RNA extraction was performed using the RNeasy Plant Mini Kit (Qiagen, Hilden, Germany), with the RNAse free and DNAse I Set (Qiagen, Hilden, Germany), following the manufacturer’s instructions.

2.4. Microarray Experimental Design and Data Analysis

The Rubus idaeus L. microarray was developed using the Agilent platform (Agilent Technologies, USA, Santa Clara, CA, USA). The microarray contains in total 55,708 single 60-mer oligonucleotide probes representing unique transcripts across fruit development (design ID A-MEXP-2373; www.ebi.ac.uk/arrayexpress/). The samples analyzed consisted of 14 individual progeny from a Glen Moy x Latham mapping population, of which seven were labeled as the mostly crumbly phenotype since they consistently produced fruits with uneven shape across many years of scoring (though not in every season, thus the mostly crumbly designation), while the other seven progeny were labeled as the never crumbly phenotype since they always produce regular shape fruits. For each plant and phenotype, three different development stages were examined, closed bud (CB), open flower (OF), and green berry (GB). In total, four biological replicates (derived from each of four clonal plants per line) were collected for each stage, giving a total of 168 samples from which the RNA was extracted and processed. These 168 samples were pooled according to their phenotype, stage, and biological replicate in order to form 24 pools in total. In practice, the pools were named as A, B, C, and D for each of the four biological replicates. This specific design was chosen in order to reduce the effect of the environment and genetic differences not associated with the crumbly trait on the expression level. Although this creates an artificial level of expression, the ranking between the genes remains unchanged as the pooling effect is the same for all the genes [8].
In total, 24 microarrays were processed according to the One-Color Microarray-Based Gene Expression Analysis protocol (v 6.5; Agilent Technologies, Santa Clara, CA, USA) prior to scanning on a (G2505B Scanner; Agilent Technologies, Santa Clara, CA, USA). Data were extracted using Feature Extraction software (v. 12.0.3.2; Agilent Technologies, Santa Clara, CA, USA) and then imported into GeneSpring software (v. 7.3; Agilent Technologies, Santa Clara, CA, USA) for data pre-processing and normalization (default settings were performed). Probes with unreliable signals (flagged as absent in 21/24 samples) were filtered from the data prior to statistical analysis. Experimental design and procedures, along with raw datasets can be found in ArrayExpress (www.ebi.ac.uk/arrayexpress/), accession E-MTAB-10049.

2.5. Microarray Analysis

2.5.1. Selection of Microarray Probes Mapped Inside the Crumbly QTLs

All probes from the microarray were located in scaffold regions on the GbS map [4] to look for co-location with the three crumbly QTLs. A list with all these probes was produced by using the proprietary Rubus idaeus genome browser at The James Hutton Institute [9] to find the probe position within the genome scaffolds. An orientation file that identifies the position of genome scaffolds for each linkage group was then utilized.

2.5.2. Analysis of Variance (ANOVA)

Statistical analysis, using Genstat version 18th (VSN International, Hemel Hempstead, UK), was performed on the selected microarray probes mapped inside (two LOD drop-off supporting interval) the three crumbly QTLs. A two-way ANOVA with effects of stage (i.e., closed bud, open flower, and green berry), phenotype (i.e., mostly and never crumbly) and their interaction, was performed to test for the significant differences, using a p ≤ 0.001 level of significance, in the expression levels of the crumbly microarray probes. The expression levels were analyzed after a log10 transformation to normalize the data.

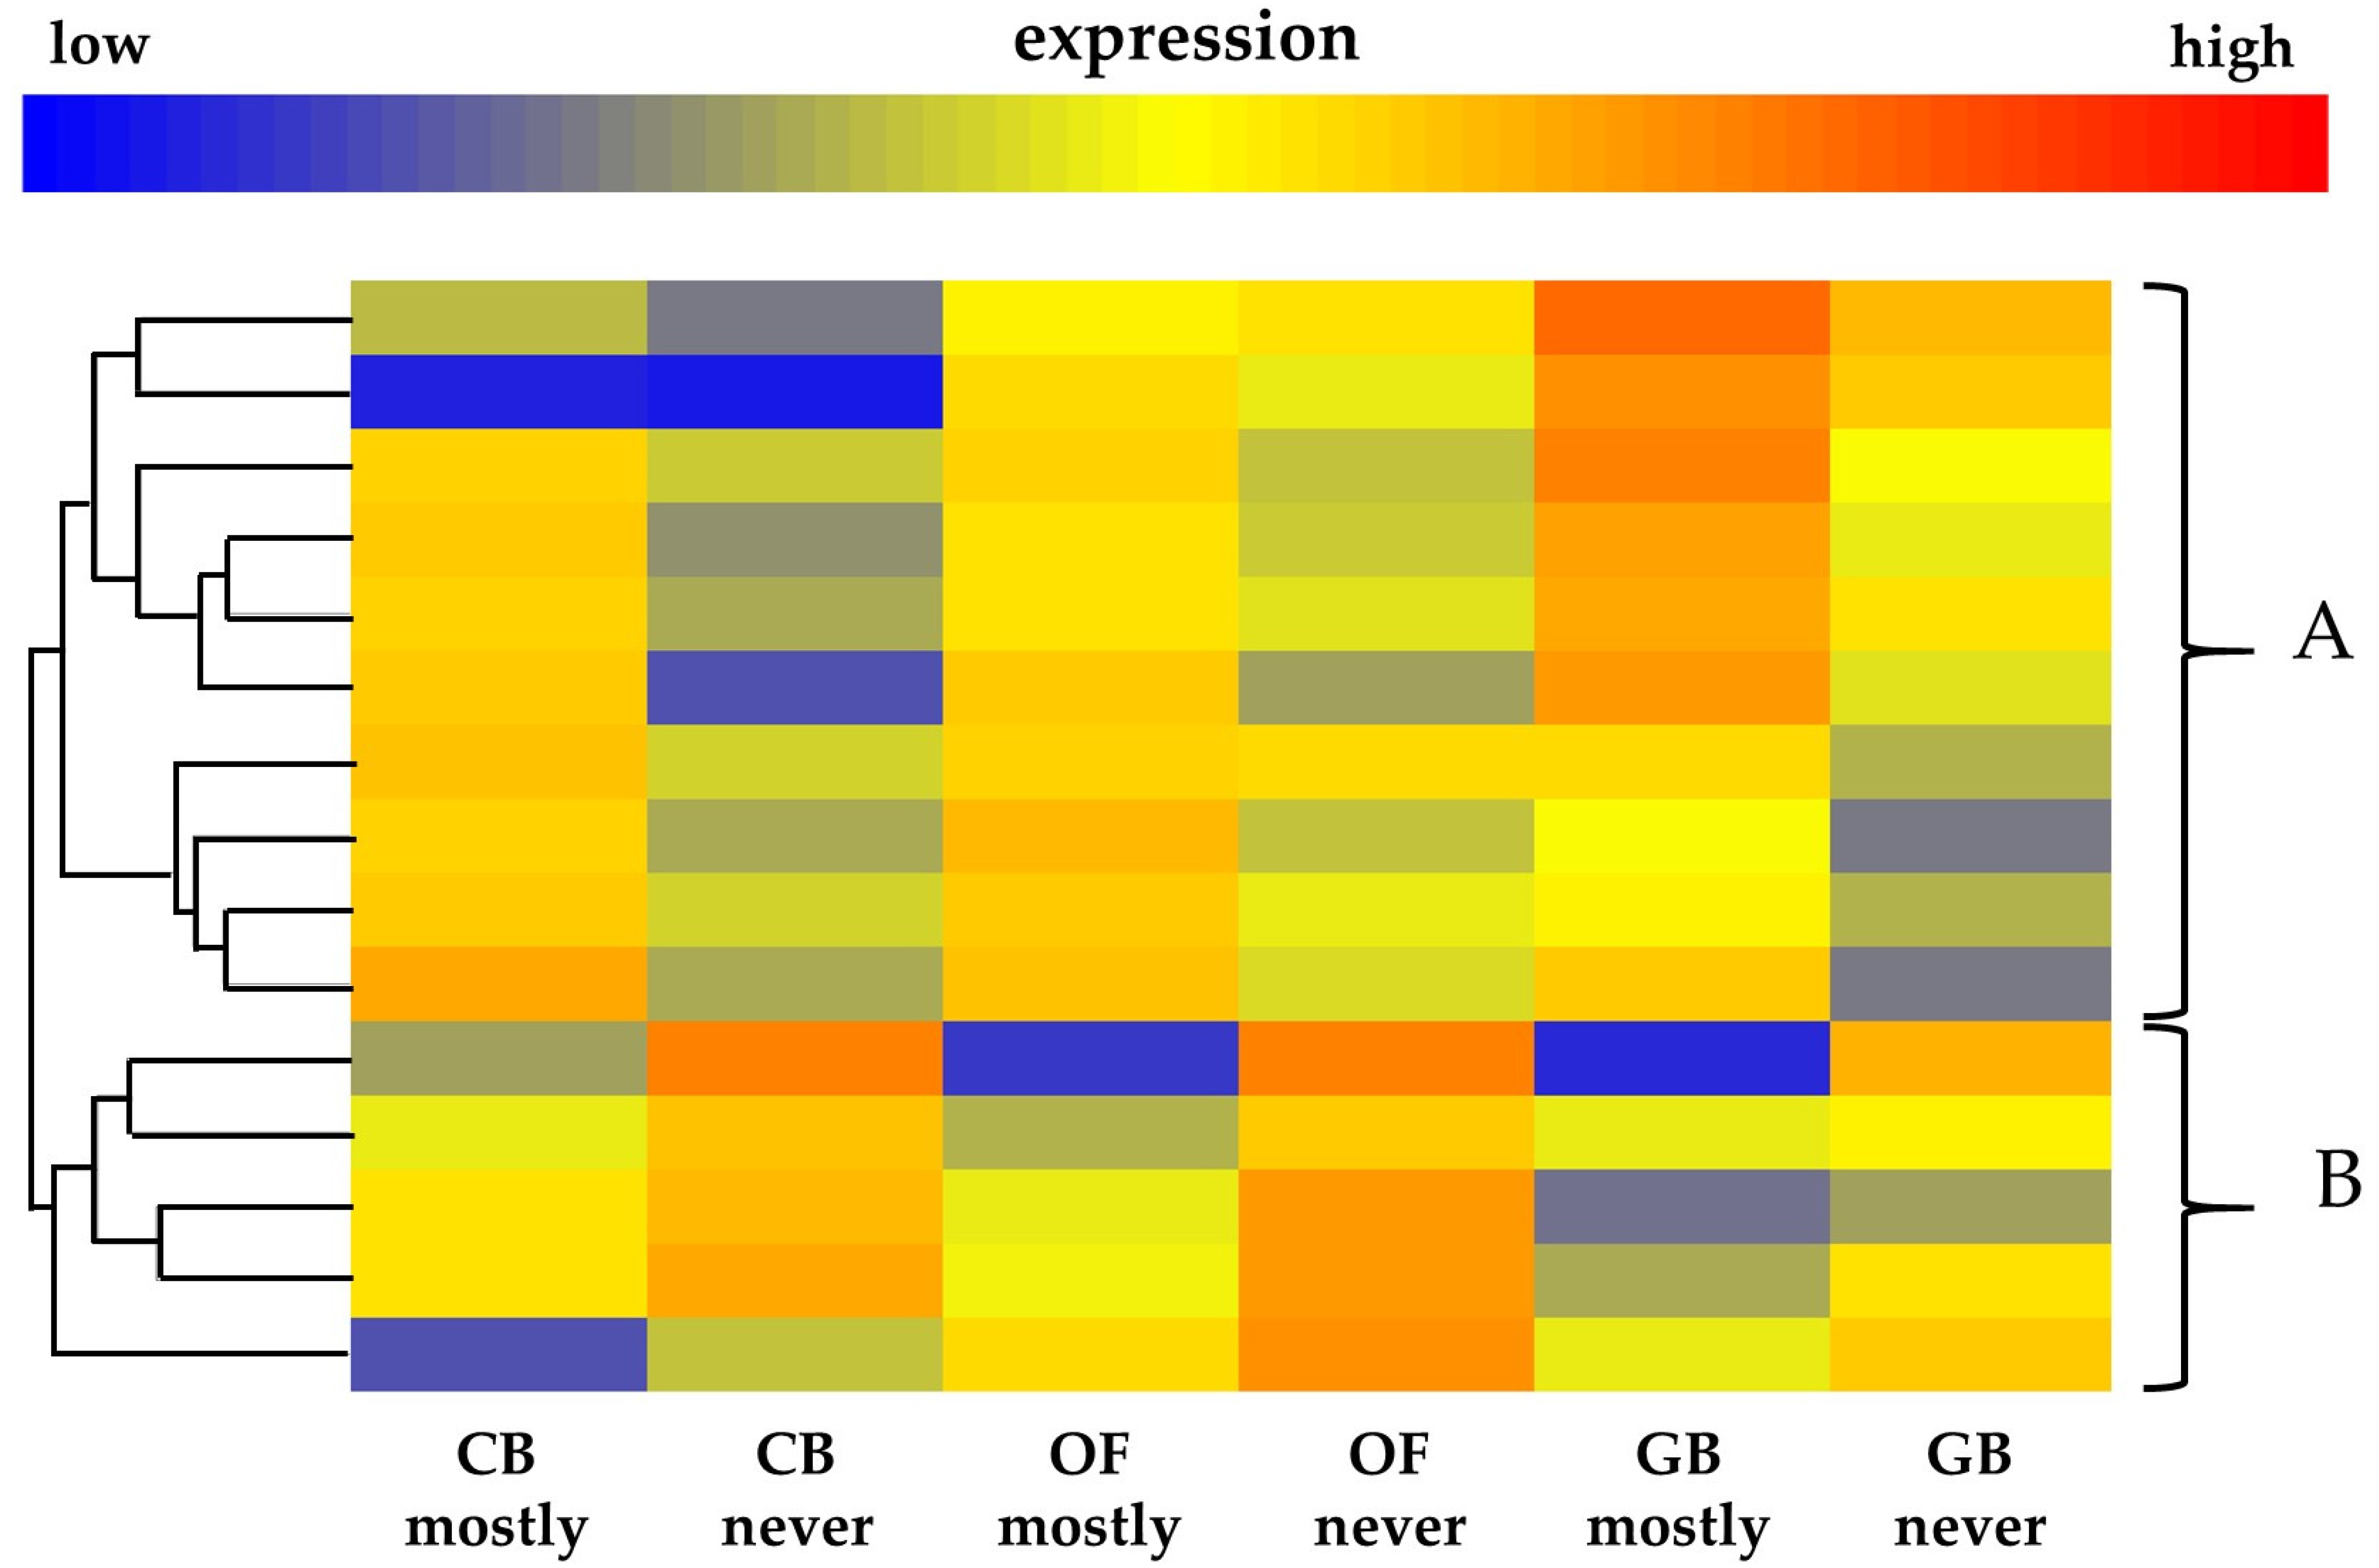
2.5.3. Heatmap Tree Clustering

Clustering of significant probe expression profiles was performed using GeneSpring software (v. 7.3; Agilent Technologies) using Pearson’s correlation with default clustering by average linkage.

2.5.4. BLAST Search

Similarities between the Rubus idaeus genes from the Glen Moy genome assembly database [9] and the Arabidopsis thaliana (L.) Heynh. genes were identified by using the Basic Local Alignment Search Tool (BLAST) in The Arabidopsis Information Resource (Phoenix Bioinformatics Corporation, Newark, CA, USA) [10]. Matches were considered significant when e-value was less than 0.01.

2.5.5. Functional Homology

In order to find insights into potential functions of the identified Rubus idaeus genes, their Arabidopsis thaliana orthologs were analyzed with the TAIR gene ontology (GO) bulk search tool (Phoenix Bioinformatics Corporation, Newark, CA, USA) [11].

3. Results

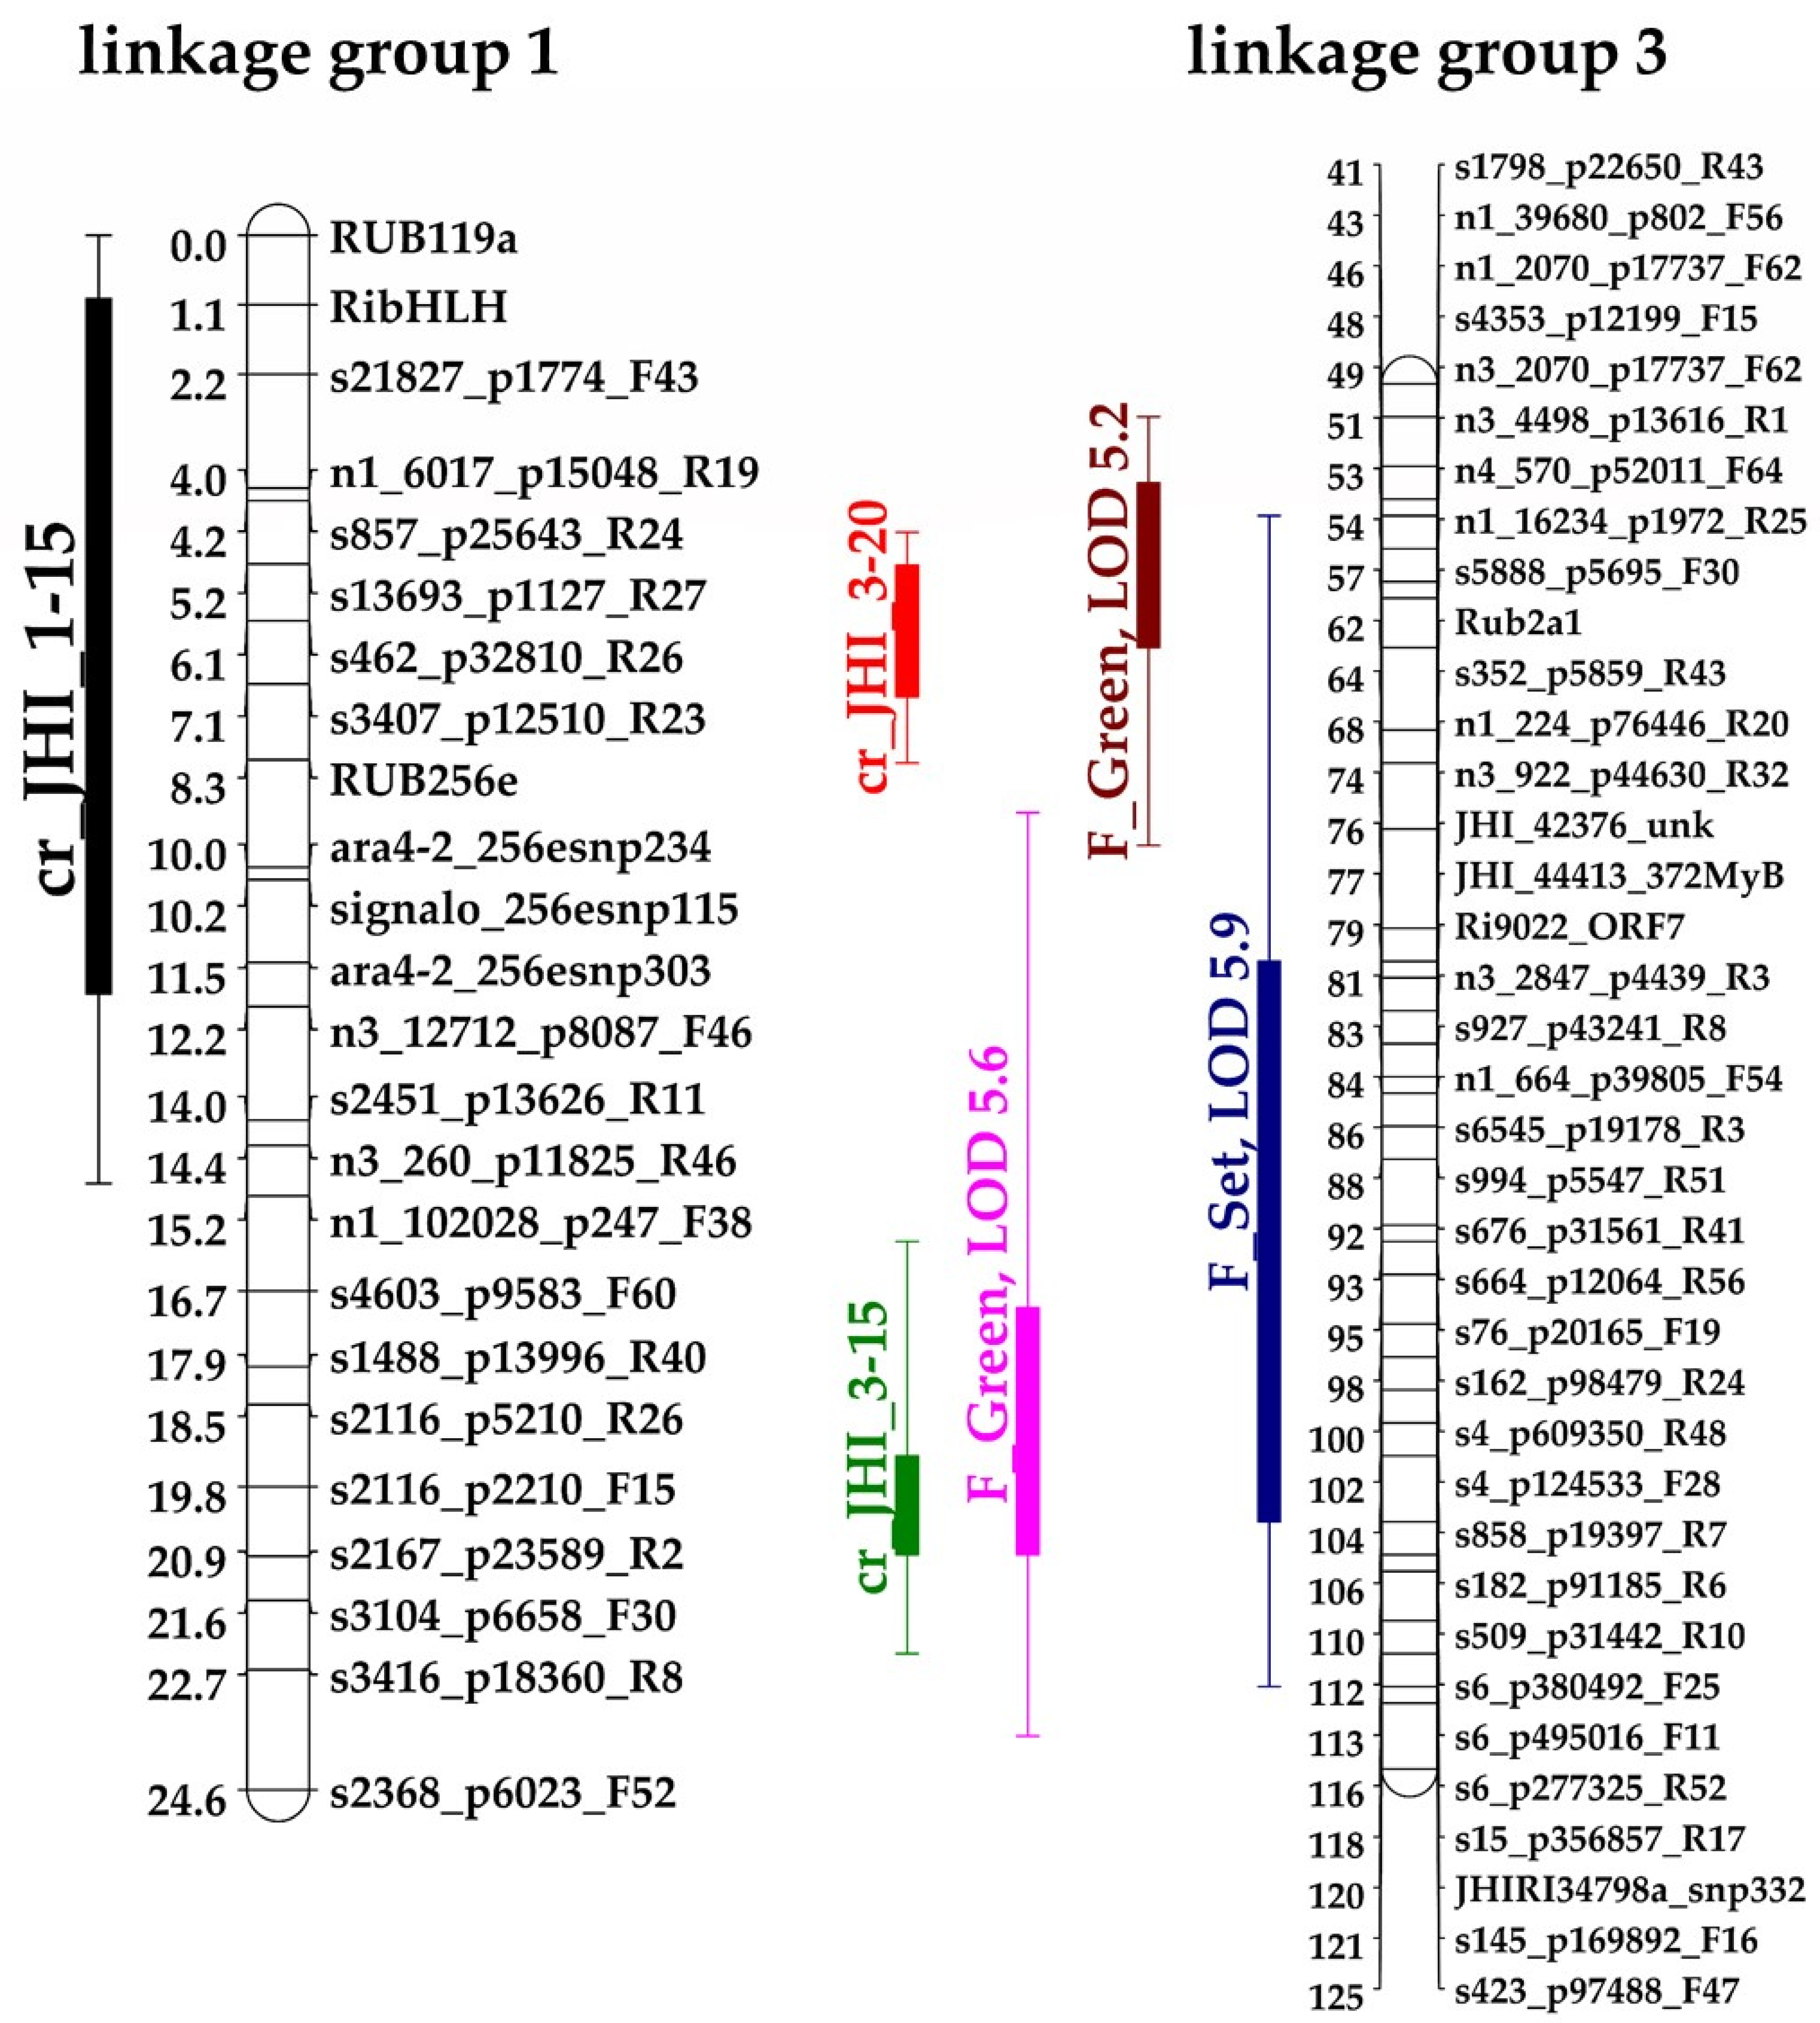
3.1. Crumbly Fruit QTL

The field scores for the crumbly phenotype used were those recorded over a period of seven fruiting seasons [1]. None of the progeny were scored as crumbly in every season; on average the crumbly phenotype was scored in circa 75% of the scoring times. However, some individuals never exhibited the crumbly phenotype in any of the seven seasons scored [1]. The results of the QTL analysis on the GbS linkage map confirmed the two QTLs, cr_JHI_1–15 on LG1 and cr_JHI_3–15 on LG3 (Figure 1), previously identified by Graham et al. [1], with s3407_p12510_R23 at 7.1 cM (centiMorgan) and s182_p91185_R6 at 106.4 cM, as the most representative markers for cr_JHI_1–15 and cr_JHI_3–15, respectively. An additional locus, cr_JHI_3–20, was identified in this study on LG3 (Figure 1) with the most representative marker, Rub2a1, at 62.4 cM. There were no interactions among the loci. All three markers have four alleles (‘ab’ in Latham and ‘cd’ in Glen Moy) and the significant markers always segregated in the Latham parent. The mean proportion of crumbly fruit was higher in the genotypes carrying the Latham ‘b’ allele for cr_JHI_1–15 and cr_JHI_3–15. For the newly identified QTL, cr_JHI_3–20, the allele combination ‘bc’ gave a higher occurrence of the crumbly phenotype, suggesting that both alleles were dominant and the most significant markers segregate in both parents (Table 1).

3.2. Gene Ontology Analysis of Differentially Expressed Genes

Gene sequences represented by the 120 probes (see full list on Supplementary Table S1), within the three crumbly QTLs, were analyzed individually through the GO bulk TAIR database to indicate gene function with a specific focus on the ontology terms flower development, hormones, and pollen. This choice was driven by literature that suggests that, in some varieties, the crumbly fruit phenotype might be caused by mutations producing the homozygous state for two recessive pairs of genes that retard the development of the embryo sac and reduce the production of fertile pollen [12]. Those genes affecting pollen production, as well as those involved in flower development, may therefore be important in causing the crumbly fruit phenotype. Additionally, as hormones are the main plant growth regulators [13,14,15], their putative role in fruit formation and development cannot be excluded. A total of 15 probes were selected using these criteria, 10 of these matched predicted Arabidopsis thaliana genes whose gene ontology terms are specifically related to hormone metabolism, signal transduction, and response. Transcripts associated with cytokinins and jasmonates were the most represented, with four separate transcripts associated with each, three transcripts were associated with salicylates and auxins, two with abscisic acid, and one each with gibberellins and steroids. The remaining five probes match A. thaliana genes having GO annotations related to flower development and pollen. While the functions associated with pollen are twofold (i.e., recognition of pollen and its development), three subcategories were related to flower development (i.e., carpel development, flower meristem determinacy, and embryo development ending in seed dormancy). Table 2 contains predicted A. thaliana genes matched by these 15 microarray probes which map inside the three crumbly QTLs, together with their corresponding gene ontology annotation. To determine the relationship in patterns of expression of the transcripts, a tree cluster heatmap of these 15 transcripts was constructed (Figure 2). Overall, two main clusters, named A and B, were clearly identified. The top cluster of 10 transcripts were more abundant in the mostly crumbly phenotype in all three stages (i.e., closed bud, open flower, and green berry), while the bottom cluster contains five transcripts all of which were less abundant in the mostly crumbly phenotype.
The two probes, CUST_10154_PI426541283 and CUST_22099_PI426541283, belonging to the top cluster (Figure 2) upregulated in the mostly crumbly plants matched two interesting A. thaliana genes AT5G52240.1 and AT3G63440.1. The first encodes MEMBRANE STEROID BINDING PROTEIN 1 (MSBP1) that functions as a negative regulator of cell elongation [16]. The gene AT3G63440.1 positively affects fruit elongation because it encodes a cytokinin dehydrogenase an important inhibitor of cell elongation during fruit development [17]. For both probes, CUST_10154_PI426541283 and CUST_22099_PI426541283, the analysis of variance showed significant differences (p < 0.001) for the stage*phenotype interaction, at closed bud and green berry for the first probe and only at closed bud for the second (see Table 2). Another probe (CUST_38657_PI426541283), belonging to the top cluster (Figure 2), matches the A. thaliana gene AT2G46410.1 that encodes a R3-type MYB transcription factor CAPRICE (CPC) that is expressed in hairless cells. The gene has a role in trichome development and Arabidopsis thaliana transgenic plants overexpressing CPC lacked trichomes on leaves, stems, and sepals [18]. For this probe, analysis of variance showed a significant stage*phenotype interaction only at the green berry stage (see Table 2).
Downregulated probes included CUST_44619_PI426541283, matching the Arabidopsis thaliana gene AT3G12110.1, and CUST_24407_PI426541283, matching AT5G12210.1. Analysis of variance showed significant stage*phenotype interaction at closed bud and green berry stages for CUST_44619_PI426541283, while for CUST_24407_PI426541283 the difference in the expression level was significant only at open flower stage (see Table 2). AT3G12110.1 encodes the reproductive actin ACT11 involved in the process leading to the protrusion of the pollen tube [19]. AT5G12210.1 encodes RGTB1 (Rab geranylgeranyl transferase subunit 1). Partial deficiency in the expression of this gene in Arabidopsis thaliana negatively affected polar growth of pollen tubes, compromising fertilization of the ovules [20].

3.3. Selection of A. thaliana Ortholog Genes Matching Those Probes That Are Significantly Differentially Expressed Having GO Terms Other Than Flower Development, Hormones, or Pollen

Analysis of the gene functions for all the remaining differentially expressed genes located within the three crumbly QTLs, but having GO annotations other than flower development, hormones, pollen, and transport, resulted in the identification of three genes whose products could play a role in the development of crumbly fruit in red raspberry. The two of these were located within the QTL cr_JHI_3–15 and one within cr_JHI_3–20. The A. thaliana genes matched by the R. idaeus microarray probes are: AT4G26840.1, AT5G08080.3, and AT2G21540.1. The first gene AT4G26840.1 encodes SUMO 1 a post translational modification small ubiquitin-like modifier [21]. The microarray probe CUST_6848_PI426541283, matching AT4G26840.1, is downregulated in the mostly crumbly samples with differences being statistically significant (p < 0.001) for the stage*phenotype interaction, only at open flower stage (see Supplementary Table S1).
The second gene, AT5G08080.3, encodes the SYNTAXIN OF PLANTS 132 (SYP132), a SNARE (soluble N-ethylmaleimide-sensitive factor attachment protein receptors) protein that controls the ultimate fusion of a secretory vesicle with its target compartment [22]. The microarray probe CUST_2371_PI426541283, matching AT5G08080.3, was downregulated in the mostly crumbly samples with differences being statistically significant (p < 0.001) at both open flower and green berry stages (see Supplementary Table S1).
The third gene, AT2G21540.1, encodes SEC14-LIKE 3 (SFH3) a phosphatidylinositol/phosphatidylcholine transfer protein (PITP). This class of proteins is ubiquitous and its function consists of binding and exchanging one molecule of phosphatidylinositide (PtdIns) or phosphatidylcholine (PtdCho) to facilitate the transfer of these phospholipids among the different membrane compartments of eukaryotic cells [23]. SFH3 may be involved in certain aspects of protein secretion and polarized membrane trafficking during the fertilization process [23]; examples of processes requiring polarized membrane trafficking include: germination of pollen grains on the stigma, guidance of pollen tubes in the style and delivery of the sperm nuclei to the ovule [23]. The microarray probe CUST_26373_PI426541283, matching AT2G21540.1, was downregulated in the mostly crumbly samples in all three stages tested (i.e., closed bud, open flower, and green berry) but the differences in expression levels were statistically significant (p < 0.001) only at open flower stage (see Supplementary Table S1).

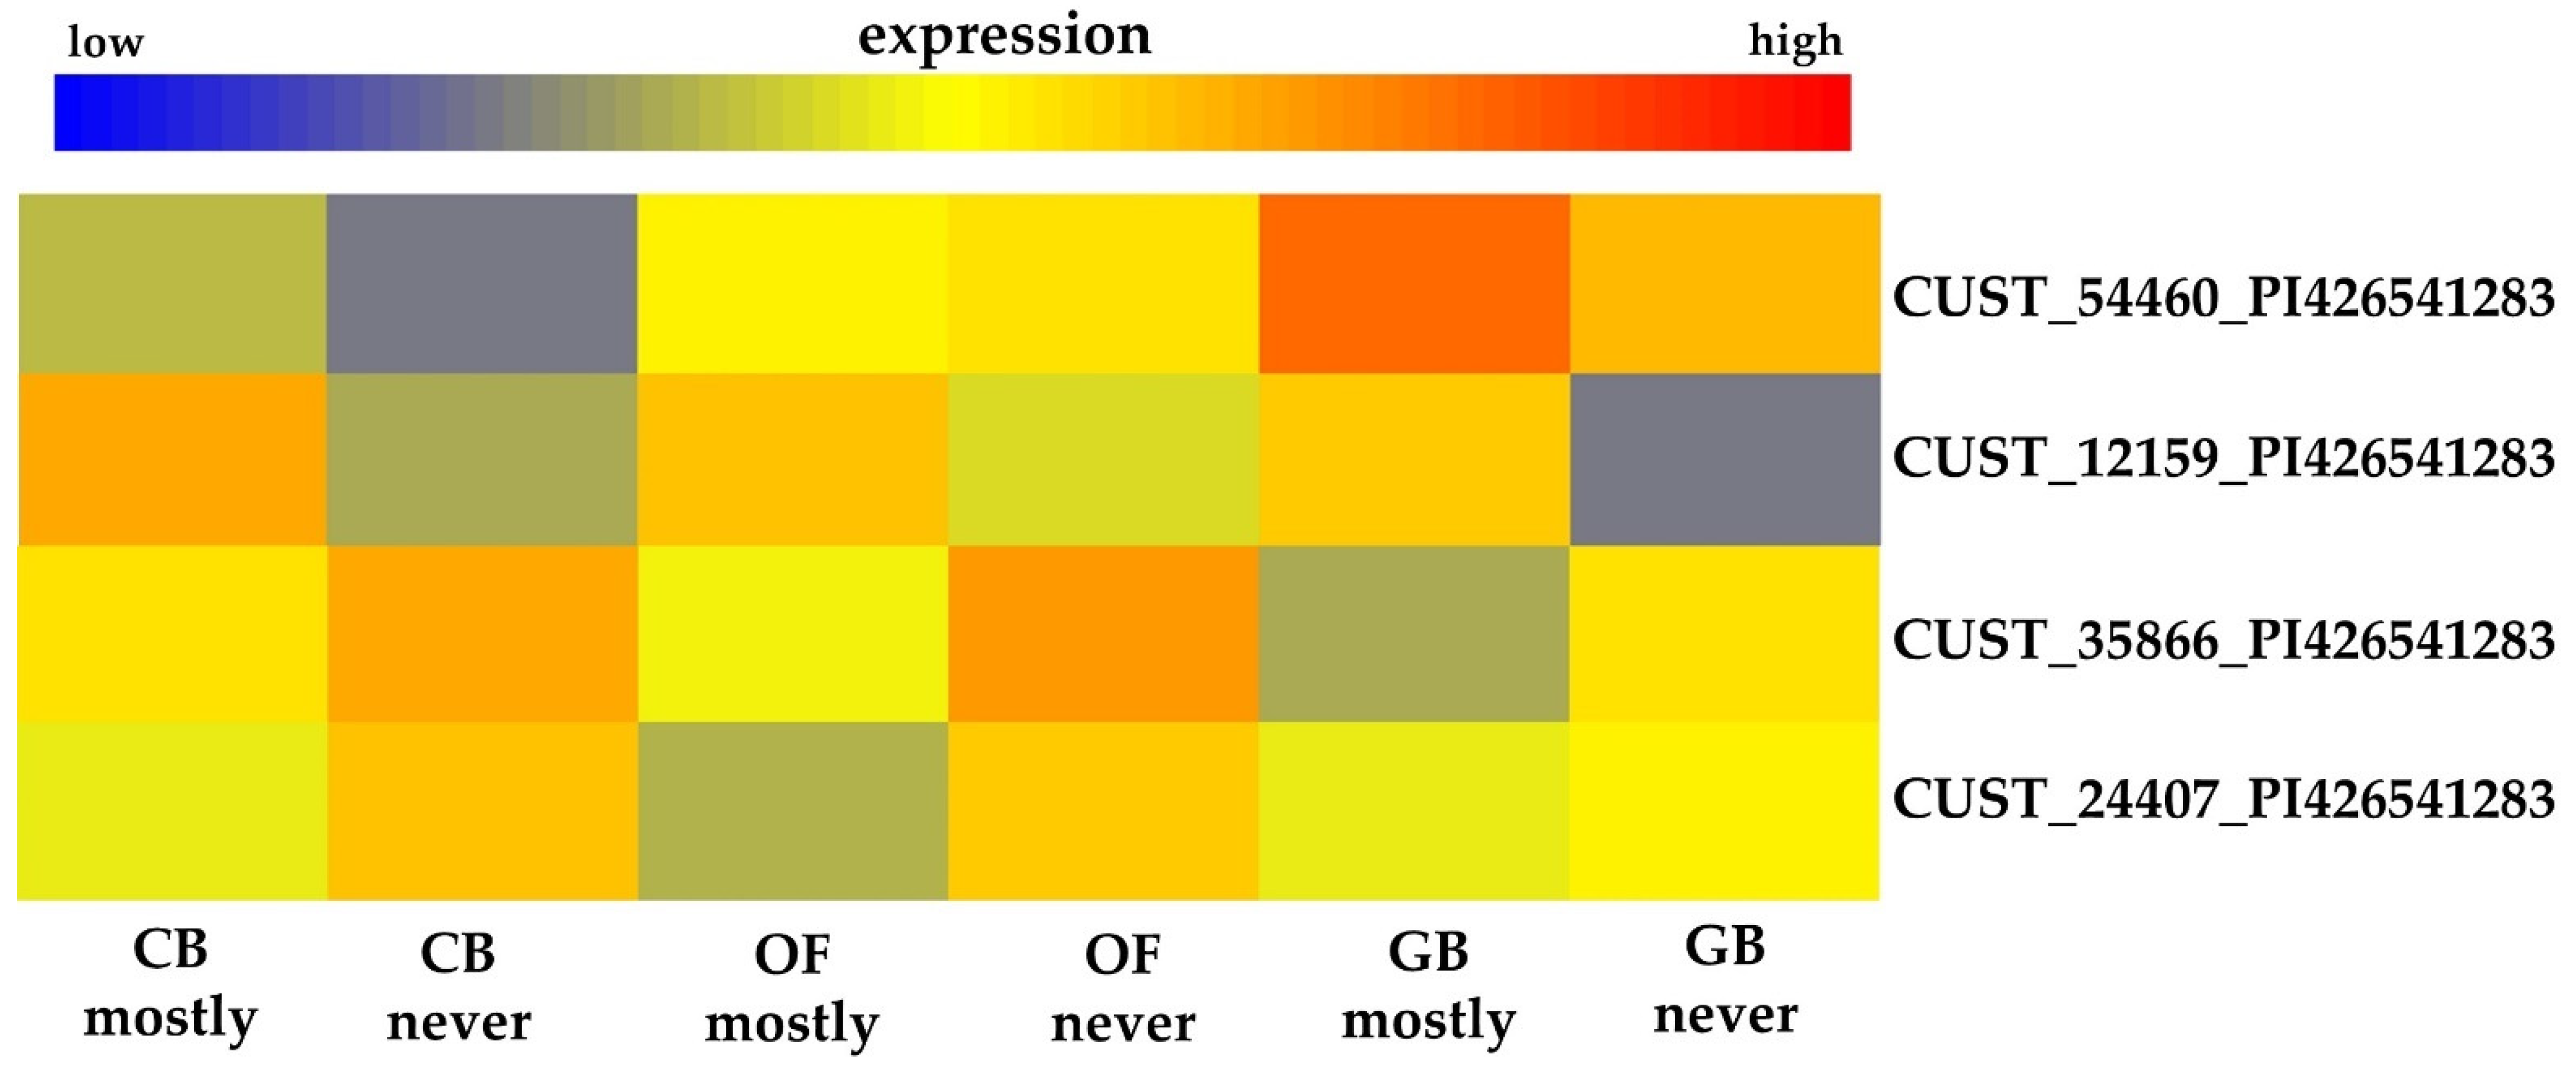
3.4. Relationship Between Crumbly Fruit and Ripening

In their work, Graham et al. [1] found significant (p < 0.05) correlations between the crumbly phenotypic scores and those related to the time to reach fruit set and green fruit; the longer the fruits take to get to fruit set and green fruit, the more likely they tend to be crumbly [1]. The same ripening scores were re-analyzed with the new GbS linkage map and 12 of these QTLs were confirmed [4]. The comparison of these fruit ripening QTLs with the three crumbly QTLs identified here highlights overlapping regions between the two crumbly QTLs and three of the fruit ripening ones on linkage group 3, as shown in Figure 1.
The crumbly QTL cr_JHI_3–20 overlaps two ripening QTLs (see Figure 1), representing the time to reach fruit set (76 cM) and that to reach green fruit (49 cM). The crumbly QTL cr_JHI_3–15 (Figure 1) overlaps two QTLs (i.e., fruit set, green fruit), respectively, at 102 and 105 cM [4]. The fruit ripening QTLs are mainly effects of the allele from the Latham parent [4]; the same applies to the crumbly QTLs cr_JHi_1–15 and cr_JHI_3–15 while for cr_JHI_3–20 there are effects from alleles of both parents (see Table 1).
Table 3 shows four microarray probes, differentially expressed with respect to the stage*phenotype interaction, matching predicted A. thaliana ortholog genes whose R. idaeus equivalent map within overlapping crumbly and fruit ripening (i.e., fruit set and green fruit) QTL. These four probes match A. thaliana predicted ortholog genes having gene ontology annotations related to flower development, hormones, or pollen. The probe CUST_54460_PI426541283 was upregulated (Figure 3) in the mostly crumbly phenotype, with the differences being statistically significant only at closed bud and green berry stages (see Table 2). The probe matches the predicted Arabidopsis thaliana gene AT1G62360.1 that encodes a class I knotted-like homeodomain protein, having a DNA binding transcription factor activity that is required for shoot apical meristem (SAM) formation [10].
The microarray probe CUST_35866_PI426541283 was downregulated (Figure 3) in the mostly crumbly phenotype, with significant stage*phenotype interaction effect; the full details for this probe are reported in Table 2. The probe match AT4G28210.1 that encodes EMBRYO DEFECTIVE 1923, a protein with molecular function involved in embryo development ending in seed dormancy [10].
The last two probes, CUST_24407_PI426541283 and CUST_12159_PI426541283 (Table 2) were downregulated in the mostly crumbly plants with significant stage*phenotype interaction effect (see Table 2). Probe CUST_24407_PI426541283, already described previously in this section, matches AT5G12210.1 that encodes the RAB geranylgeranyl transferase beta subunit 1 with Rab geranylgeranyl transferase activity, while probe CUST_12159_PI426541283 matches AT2G19130.1, encoding the S-locus lectin protein kinase family protein, an enzyme involved in pollen recognition [10].

4. Discussion

Abnormal development of the embryo sac and reduction in the production of fertile pollen have been proposed as putative causes of crumbly fruit in red raspberry [12]. Differentially expressed genes identified in this study and located within three crumbly QTLs from a Glen Moy x Latham segregating population, identify enzymes, proteins, and transcription factors controlling molecular processes that affect flower development and pollen formation, thus potentially compromising ovule fertilization and normal fruit growth. This was achieved using a raspberry microarray containing over 55K genes across developmental stages, some of which are unknowns. This proved to be a quick, cost effective, and efficient way of identifying genes differentially expressed between crumbly and normal fruit. The fact that a large number of these genes reside within QTL and support the abnormal development theory further validates the choice.
In total, three genes, AT5G52240.1, AT3G63440.1, and AT2G46410.1, all upregulated in the mostly crumbly plants (see Table 2), could influence normal fruit growth. The first gene encodes a Membrane Steroid Binding Protein 1 (MSBP1) that is expressed in flower, carpel, and pollen. The protein MSBP1 functions as a negative regulator of cell elongation, in Arabidopsis thaliana overexpression of MSBP1 affects the expression of specific genes involved in cell elongation and sterol metabolism [16]. The second gene encodes cytokinin oxidase 6 (CKX6) that catalyzes the irreversible inactivation of cytokinins (CK) which in fruit CKX6 degrades CKs inhibiting, indirectly, cell elongation [17]. The upregulation of these two genes could affect cell elongation and cause impairments in fruit growth leading to misshapen fruits. The third gene, AT2G46410.1, encodes a R3-type MYB transcription factor CAPRICE (CPC) that is expressed in hairless cells. Arabidopsis thaliana transgenic plants overexpressing CPC lacked trichomes on leaves, stems, and sepals [18]. It is worth noting that in raspberry the drupelets normally present abundant epidermal hairs (i.e., unicellular linear trichomes) at their base and side. The entanglement of these hairs provides the cohesion to the drupelets and the shape stability of the berry [12]. In raspberry, upregulation of this gene in the mostly crumbly plants, might cause the formation of drupelets with reduced number of trichomes, with consequent formation of fruit prone to crumble. This gene is also interesting in the context of crumbly fruit as it had been previously suggested that crumbly fruit is linked to Gene H in raspberry [12] which causes cane hairs. This was later shown not to be the case [1].
Another five A. thaliana ortholog genes (AT3G12110.1, AT5G12210.1, AT4G26840.1, AT5G08080.3, and AT2G21540.1), all downregulated in the mostly crumbly plants and with significant stage*phenotype interaction effect (see Supplementary Table S1), encode proteins controlling molecular processes that indirectly affect early stages of fertilization and potentially contribute to the formation of misshapen fruit with lower number of drupelets. Of these genes, two (i.e., AT4G26840.1 and AT5G08080.3) encode SUMO 1 and SYNTAXIN OF PLANTS 132 SYP 132, respectively. SUMO 1 is a post translational modification small ubiquitin-like modifier. In plants, reproductive processes such as flower development, mega- and micro-gametogenesis, fertilization, and embryogenesis are regulated by many factors including post translational protein modifications [21]. SUMO proteins are involved in important processes related to plant reproduction such as flowering time regulation, GA signaling, and gametophyte development [21]. SYP 132 is a SNARE (soluble N-ethylmaleimide-sensitive factor attachment protein receptors) protein that controls the ultimate fusion of a secretory vesicle with its target compartment [22]. The SYP132 protein is located inside the plasma membrane (PM) of many tissues including developing pollen. The gene is expressed in the early stages of pollen development and represents a putative candidate to mediate fusion processes during the mitotic divisions that are responsible for the formation of tricellular pollen [22]. Therefore, in raspberry, a significant reduction in the expression levels of these two genes could impede the normal development of pollen and then indirectly affect fertilization, potentially contributing to the formation of uneven fruit with reduced number of drupelets.
The other three genes (AT3G12110.1, AT5G12210.1, and AT2G21540.1) encode ACT11, AtRGTB1, and SFH3, respectively, which control molecular processes related to the three main phases of pollen fertilization (i.e., germination, pollen tube elongation, and delivery of sperm nuclei to the ovule). ACT11, a reproductive actin, is a component of the actin cytoskeleton involved in different physiological processes including polarized cell growth. Reproductive actins play a part in cytoskeleton rearrangement, where ACT11 plays an important role in pollen germination and pollen tube elongation. Loss of ACT11 reduces the amount of total actin in the cells with a consequent reduction or alteration of filamentous actin (F-actin) levels that negatively impact on both pollen germination and pollen tube growth elongation. Actin filaments are thought to form the molecular track, responsible for the transport of material indispensable for both membrane expansion and cell wall synthesis that allow the protrusion of the pollen tube [19]. In A. thaliana act11 mutants, the actin filaments do not converge properly at the germination aperture, causing delay of pollen germination [19]. AtRGTB1 is the β-subunit of the Rab geranylgeranyl transferase [24]. In A. thaliana, this enzyme is involved in the control of pollen tube elongation [20] and Rab proteins are abundant at the tip of pollen grains where they regulate cell polarity and control pollen tube elongation. Partial deficiency in the expression level of this gene compromises the fertilization of the ovules by affecting polar growth of pollen tubes [20]. Moreover, in A. thaliana, mutations in this gene always produce flowers that never fully open and present protuberant pistils, much longer than the stamens; a condition that prevents pollination from the same flower [20,24]. SFH3, a Phosphatidylinositol/phosphatidylcholine transfer protein (PITP), is involved in certain aspects of protein secretion and polarized membrane trafficking during the fertilization process [23]. Germination of pollen grains on the stigma, guidance of pollen tubes in the style and delivery of the sperm nuclei to the ovule are all examples of processes requiring polarized membrane trafficking [25]. In the mostly crumbly plants, the significant lower expression of these three genes could be responsible for anomalies in one or more of the three main processes of pollination, with the effect of compromising fertilization and contributing to the formation of misshapen fruits with lower number of drupelets.
The four transcripts map within the overlapping regions of crumbly and fruit ripening QTLs on linkage group 3. One of these four genes, AT5G12210.1, encoding ACT11, has already been described for its putative role in triggering crumbly fruit. For the other three genes (AT4G28210.1, AT2G19130.1, and AT1G62360.1), while the first two encode a protein and an enzyme controlling molecular processes with no clear relation with crumbly fruit, AT1G62360.1 encodes the KNOX transcription factor SHOOT MERISTEMLESS (STM) which could have a putative impact on crumbly fruit. STM is responsible for promoting carpel development and associated placental tissues [26]. In A. thaliana, experiments with RNA interference on the STM gene (STM-RNAi) show anatomical defects at the level of the floral meristem, ranging from flowers with malformed carpels, in the case of weak STM-RNAi, to abnormal flowers with no carpels at all, for severe STM-RNAi [26]. In A. thaliana, the model of flower differentiation involves STM together with other factors, the AGAMUS like protein (AG) and its repressors such as BELLRINGER [26]. In the mostly crumbly plants, the significant higher level of STM alters the balance between the different factors involved in flower differentiation and could cause formation of abnormal flowers with reduced or no carpels that could give rise to malformed crumbly-like fruits. A study counting carpel numbers would be valuable.
This work highlights the impact on key developmental processes in ripening that lead to crumbly fruit, with differences in gene expression of key developmental genes identified within QTL that are associated with the condition. This confirms a genetic component is part of the process but that it is also an environmentally triggered phenotype and at present we do not understand the seasonal nature of the condition, or what these environmental triggers might be that lead to the differences in trait expression across seasons. We can speculate that environmental conditions, such as rainfall or temperature, may have a role on plant development. For example, Latham an extremely cold-tolerant cultivar is known to be a donor of crumbly fruit and has been widely utilized in breeding programs [12]. This condition is much more widespread in Europe than in the colder North American climate. That being said however, the crumbly condition is also significantly less under protected cultivation [1]. It could also be temperature impacts indirectly on the crumbly phenotype through impacts on pollinators, viral vectors, or the viruses themselves that then affect key processes.

5. Conclusions

This study, using the raspberry Glen Moy x Latham mapping population highlights important genetic insights into the crumbly fruit phenomenon. This work identifies a new crumbly QTL on linkage group 3. The analysis of gene function within the crumbly QTLs highlights interesting molecular and physiological mechanisms, inducing flower anatomical defects, affecting fruit development, gametogenesis, and pollen action that may be causing the formation and development of misshapen fruits. A better understanding of the genetic control of crumbly fruit paves the way for the selection of molecular markers strongly associated with the condition that would find application in breeding and diagnostics.

Supplementary Materials

The following Table and Figure are available online at https://www.mdpi.com/article/10.3390/agronomy11040794/s1, Table S1. List of 120 microarray probes matching genes located within the three crumbly QTLs and significantly differentially expressed on a stage*phenotype basis. The two QTLs, cr_JHI_1–15 and cr_JHI_3–15, previously identified by Graham et al. [1] are located on linkage group 1 and 3, respectively. The third crumbly QTL, cr_JHI_3–20, is identified during this work on linkage group 3. For each probe, the gene ID of the matched A. thaliana gene and the scaffold of the Rubus (Glen Moy genome assembly) browser [9] to which the gene is located are reported. In the last column the A. thaliana name for each gene and where available a brief description of its function [10] are presented. In the fourth column (i.e., significant interaction effect), the stage/s to which the stage*phenotype interaction is significant (p < 0.001) are reported; the bold lowercase letters correspond to: a = only closed bud, b = open flower, c = green berry, d = closed bud and open flower, e = closed bud and green berry, f = open flower and green berry, and g = closed bud, open flower, and green berry. Figure S1. Genotype by Sequencing (GbS) linkage maps for linkage groups 1 and 3 of the Glen Moy x Latham mapping population [4]. Bars and whiskers (to the left of the chromosome) show one- and two-LOD support intervals for QTL locations. The linkage group 1 shows a crumbly fruit QTL in black color (cr_JHI_1–15 with LOD 6.1 and with 1–12 cM and 0–15 cM of one and two LOD supporting intervals). The linkage group 3 shows two crumbly fruit QTLs, one in red (cr_JHI_3–20 with LOD 6.3 and with 52–60 cM and 50–64 of one and two LOD supporting intervals) and one in green (cr_JHI_3–15 with LOD 6.0 and 106–112 cM and 93–118 of one and two LOD supporting intervals) color, and three fruit ripening QTLs [4] (i.e., fruit set, green fruit), in blue, purple, red, and pink, respectively.

Author Contributions

Conceptualization L.M.S., J.G., R.D.H., and P.E.H.; methodology, L.M.S., J.G. and P.E.H.; software, L.M.S. and P.E.H.; validation, L.M.S. and P.E.H.; formal analysis, L.M.S., K.S. and J.M.; investigation, L.M.S., J.G. and R.D.H.; resources, L.M.S. and J.G.; data curation, L.M.S. and P.E.H.; writing original draft preparation, L.M.S.; visualization, L.M.S. and J.G.; supervision, J.G. and R.D.H.; project administration, J.G.; funding acquisition, J.G. and R.D.H. All authors have read and approved the published version of the manuscript.

Funding

This work was funded by the Agricultural and Horticultural Development Board (AHDB) and the Mylnefield Trust. The funding body had no influence on, or role in the research process.

Institutional Review Board Statement

Not applicable.

Informed Consent Statement

Not applicable.

Data Availability Statement

The Moy x Latham GbS data are available at the European Nucleotide Archive. The accession number for the GbS “study” is PRJEB23168. Link to study: http://www.ebi.ac.uk/ena/data/view/PRJEB23168 (accessed on 16 April 2021). The raw data for the draft Moy genome has been submitted and has study accession number PRJEB23176. Link to study: http://www.ebi.ac.uk/ena/data/view/PRJEB23176 (accessed on 16 April 2021). Experimental design and procedures, along with raw datasets can be found in ArrayExpress (www.ebi.ac.uk/arrayexpress/), accession E-MTAB-10049 (accessed on 16 April 2021). The ripening and crumbly data are available from the authors upon request. The ATxGF population could be propagated and provided upon request.

Acknowledgments

We acknowledge the help of Christine Hackett of Biomathematics and Statistics Scotland with the QTL analysis. We acknowledge the JHI glasshouse and field teams for maintaining plant material and trials.

Conflicts of Interest

The authors declare no conflict of interest. The funders had no role in the design of the study; in the collection, analyses, or interpretation of data; in the writing of the manuscript, or in the decision to publish the results.

References

  1. Graham, J.; Smith, K.; McCallum, S.; Hedley, P.E.; Cullen, D.W.; Dolan, A.; Milne, L.; McNicol, J.W.; Hackett, C.A. Towards an understanding of the control of ‘crumbly’ fruit in red raspberry. SpringerPlus 2015, 4, 1–9. [Google Scholar] [CrossRef] [PubMed] [Green Version]
  2. Scolari, L.M. Understanding the Genetic and Physiology Controls of ‘Crumbly’ Fruit in Red Raspberry (Rubus Idaeus). Ph.D Thesis, Heriot-Watt University, Edinburgh, UK, February 2021. [Google Scholar]
  3. Quito-Avila, D.F.; Lightle, D.; Martin, R.R. Effect of Raspberry bushy dwarf virus, Raspberry leaf mottle virus, and Raspberry latent virus on Plant Growth and Fruit Crumbliness in ‘Meeker’ Red Raspberry. Plant Dis. 2014, 98, 176–183. [Google Scholar] [CrossRef] [PubMed] [Green Version]
  4. Hackett, C.A.; Milne, L.; Smith, K.; Hedley, P.; Morris, J.; Simpson, C.G.; Preedy, K.; Graham, J. Enhancement of Glen Moy x Latham raspberry linkage map using GbS to further understand control of developmental processes leading to fruit ripening. BMC Genet. 2018, 19, 59. [Google Scholar] [CrossRef] [PubMed]
  5. Hackett, C.A.; McLean, K.; Bryan, G.J. Linkage Analysis and QTL Mapping Using SNP Dosage Data in a Tetraploid Potato Mapping Population. PLoS ONE 2013, 8, e63939. [Google Scholar] [CrossRef] [PubMed] [Green Version]
  6. van Ooijen, J.W. MapQTL ® 5 Software for the mapping of quantitative trait loci in experimental populations of diploid species. Wageningen, 2004.
  7. van Ooijen, J.W. Accuracy of mapping quantitative trait loci in autogamous species. Theor. Appl. Genet. 1992, 84, 803–811. [Google Scholar] [CrossRef] [PubMed]
  8. Kloosterman, B.; Oortwijn, M.; Uitdewilligen, J.; America, T.; De Vos, R.; Visser, R.G.; Bachem, C.W. From QTL to candidate gene: Genetical genomics of simple and complex traits in potato using a pooling strategy. BMC Genom. 2010, 11, 158. [Google Scholar] [CrossRef] [PubMed] [Green Version]
  9. The James Hutton Institute Private Resource. Available online: http://camel.hutton.ac.uk/raspberry/ (accessed on 9 April 2021).
  10. The Arabidopsis Information Resource (TAIR). Available online: https://www.webcitation.org/query?id=1392515205347100&date=%400&fromform=1 (accessed on 16 February 2014).
  11. The Arabidopsis Information Resource (TAIR). Gene Ontology at TAIR. Available online: https://www.webcitation.org/5ElORcKdS (accessed on 16 November 2013).
  12. Jennings, D.L. Raspberries and Blackberries: Their Breeding, Diseases and Growth. Academic Press Limited: London, UK, 1988; p. 230. [Google Scholar]
  13. Ruan, Y.-L.; Patrick, J.W.; Bouzayen, M.; Osorio, S.; Fernie, A.R. Molecular regulation of seed and fruit set. Trends Plant Sci. 2012, 17, 656–665. [Google Scholar] [CrossRef] [PubMed] [Green Version]
  14. Kumar, R.; Khurana, A.; Sharma, A.K. Role of plant hormones and their interplay in development and ripening of fleshy fruits. J. Exp. Bot. 2013, 65, 4561–4575. [Google Scholar] [CrossRef] [PubMed] [Green Version]
  15. Azzi, L.; Deluche, C.; Gévaudant, F.; Frangne, N.; Delmas, F.; Hernould, M.; Chevalier, C. Fruit growth-related genes in tomato. J. Exp. Bot. 2015, 66, 1075–1086. [Google Scholar] [CrossRef] [PubMed] [Green Version]
  16. Yang, X.-H.; Xu, Z.-H.; Xue, H.-W. Arabidopsis Membrane Steroid Binding Protein 1 Is Involved in Inhibition of Cell Elongation. Plant Cell 2005, 17, 116–131. [Google Scholar] [CrossRef] [PubMed] [Green Version]
  17. Di Marzo, M.; Herrera-Ubaldo, H.; Caporali, E.; Novák, O.; Strnad, M.; Balanzà, V.; Ezquer, I.; Mendes, M.A.; de Folter, S.; Colombo, L. SEEDSTICK Controls Arabidopsis Fruit Size by Regulating Cytokinin Levels and FRUITFULL. Cell Rep. 2020, 30, 2846–2857.e3. [Google Scholar] [CrossRef] [PubMed] [Green Version]
  18. Wada, T.; Tachibana, T.; Shimura, Y.; Okada, K. Epidermal Cell Differentiation inArabidopsisDetermined by aMybHomolog, CPC. Science 1997, 277, 1113–1116. [Google Scholar] [CrossRef] [PubMed]
  19. Chang, M.; Huang, S. ArabidopsisACT11 modifies actin turnover to promote pollen germination and maintain the normal rate of tube growth. Plant J. 2015, 83, 515–527. [Google Scholar] [CrossRef] [PubMed]
  20. Gutkowska, M.; Wnuk, M.; Nowakowska, J.; Lichocka, M.; Stronkowski, M.M.; Swiezewska, E. Rab geranylgeranyl transferase β subunit is essential for male fertility and tip growth in Arabidopsis. J. Exp. Bot. 2015, 66, 213–224. [Google Scholar] [CrossRef] [PubMed]
  21. Liu, L.; Jiang, Y.; Zhang, X.; Wang, X.; Wang, Y.; Han, Y.; Coupland, G.; Jin, J.B.; Searle, I.; Fu, Y.-F.; et al. Two SUMO Proteases SUMO PROTEASE RELATED TO FERTILITY1 and 2 Are Required for Fertility in Arabidopsis. Plant Physiol. 2017, 175, 1703–1719. [Google Scholar] [CrossRef] [PubMed] [Green Version]
  22. Li, B.; Li, Y.; Liu, F.; Tan, X.; Rui, Q.; Tong, Y.; Qiao, L.; Gao, R.; Li, G.; Shi, R.; et al. Overexpressed Tomosyn Binds Syntaxins and Blocks Secretion during Pollen Development. Plant Physiol. 2019, 181, 1114–1126. [Google Scholar] [CrossRef] [PubMed]
  23. Mo, P.; Zhu, Y.; Liu, X.; Zhang, A.; Yan, C.; Wang, D. Identification of two phosphatidylinositol/phosphatidylcholine transfer protein genes that are predominately transcribed in the flowers of Arabidopsis thaliana. J. Plant Physiol. 2007, 164, 478–486. [Google Scholar] [CrossRef] [PubMed]
  24. Hála, M.; Soukupová, H.; Synek, L.; Žárský, V. Arabidopsis RAB geranylgeranyl transferase β-subunit mutant is constitutively photomorphogenic, and has shoot growth and gravitropic defects. Plant J. 2010, 62, 615–627. [Google Scholar] [CrossRef] [PubMed]
  25. Edlund, A.F.; Swanson, R.; Preuss, D. Pollen and Stigma Structure and Function: The Role of Diversity in Pollination. Plant Cell 2004, 16, S84–S97. [Google Scholar] [CrossRef] [PubMed] [Green Version]
  26. Scofield, S.; Dewitte, W.; Murray, J.A.H. The KNOX gene SHOOT MERISTEMLESS is required for the development of reproductive meristematic tissues in Arabidopsis. Plant J. 2007, 50, 767–781. [Google Scholar] [CrossRef] [PubMed] [Green Version]
Figure 1. Sections of the Genotype by Sequencing (GbS) linkage maps for linkage groups 1 and 3 of the Glen Moy x Latham mapping population [4]. Bars and whiskers (to the left of the chromosome) show one- and two- logarithm of the odds (LOD) support intervals for Quantitative Trait Loci (QTL) locations. The linkage group 1 shows a crumbly fruit QTL in black (cr_JHI_1–15 with LOD 6.1 and with 1–12 cM and 0–15 cM of one and two LOD supporting intervals). The linkage group 3 shows two crumbly fruit QTLs, one in red (cr_JHI_3–20 with LOD 6.3 and with 52–60 cM and 50–64 of one and two LOD supporting intervals) and one in green (cr_JHI_3–15 with LOD 6.0 and 106–112 cM and 93–118 of one and two LOD supporting intervals) and three fruit ripening QTLs (i.e., fruit set, green fruit), in blue, purple, red, and pink, respectively. The sections of the two linkages groups are drawn using a reduced number of markers to make a clear and neat image. In the Supplementary Materials, Figure S1, the two linkage groups with the complete list of markers are reported.
Agronomy 11 00794 g001
Figure 2. Tree cluster heatmaps of 15 microarray probes mapped inside the three crumbly QTLs. The 15 probes, all showing statistically significant difference for the stage*phenotype interaction effect, were selected because of their specific ontology terms (see Table 2 for details) related to flower development (3 probes), pollen (2 probes), and hormones (10 probes). In total, two clear clusters are highlighted with curled brackets at the right side of the heatmap. The top cluster contains 10 probes all upregulated in the mostly crumbly plants, is named (A) while the small cluster on the bottom with five probes, all downregulated in the mostly crumbly plants, is named (B). Mostly crumbly indicates those plants bearing mainly misshapen crumbly like fruit while those never crumbly are symptomless plants. The three different fruit development stages tested were: closed bud (CB), open flower (OF), and green berry (GB). High expression levels are indicated in red while low expression level in blue as per scale bar presented.
Agronomy 11 00794 g002
Figure 3. Tree cluster heatmaps of the five microarray probes (right end of the figure) mapped on linkage group 3 inside the crumbly QTL cr_JHI_3–15 and co-located in the fruit ripening QTLs identified by Hackett et al. [4]. The first two probes (i.e., CUST_54460_PI426541283 and CUST_12159_PI426541283) are upregulated in the mostly crumbly phenotype with the differences being statistically significant at closed bud (CB) and open flower (OF) the first probe and only at green berry (GB) stage the second probe. The third and fifth probes (i.e., CUST_37835_PI426541283 and CUST_24407_PI426541283) are downregulated in the mostly crumbly plants with differences being significant only at open flower (OF) stage while the forth probe (CUST_35866_PI426541283) is downregulated in the mostly crumbly phenotype but the difference are significant in all the three stages tested. High expression levels are indicated in red color while low expression level in blue color, as per scale bar presented.
Agronomy 11 00794 g003
Table 1. Crumbly QTL positions identified using a hidden Markov model for the five scoring seasons showing significant association with crumbliness as reported in Graham et al. [1]. For each scoring season (year) is reported the mean of the incidence and severity scores of the four offspring genotype classes ac, ad, bc, and bd (assuming a QTL model of Latham having genotype ab and Glen Moy having genotype cd), S.E. is the corresponding standard error and the %VAR is the percentage of the variance explained by the QTL. LG is the linkage group, POS. is the position of the maximum LOD (logarithm of the odd) in centimorgan (cM). The column (detected previously) indicates whether the QTL is reported by Graham et al. [1] while the last column (key parent) indicates whether one or both parents alleles are significant. The severity scores, here reported only for scoring season 2012, referred to a 0–4 scale of crumbliness with 0 (no crumbly) and 4 (severe crumbly condition).
YearLGPOS. (cM)Mean%VarLODS.E.Detected
Previously
Key
Parent
acadbcbdacadbcbd
2007 a160.03250.17170.440.38210.095.050.07350.05470.06930.0549yesLatham
2009 a170.05890.15410.45170.536516.628.120.07280.05560.06870.0562yesLatham
2010 a100.34440.15950.44390.54689.074.70.07680.060.07840.064yesLatham
2011 a190.77090.74151.5111.577614.566.450.16780.12790.16730.1271yesLatham
2012 a1100.44660.43910.82350.813913.465.160.08940.06960.0840.0643yesLatham
2012 b190.69130.63211.51161.629615.916.050.20790.15840.18980.148yesLatham
2007 a3590.2060.20140.53330.107511.86.050.05250.07040.06020.0638noc both
2009 a3590.26390.24430.59520.12912.326.310.0550.07370.06310.0668noc both
2010 a3570.25910.35170.59190.157210.335.250.06020.07820.06140.0803noc both
2011 a31070.78450.9481.59991.702813.436.040.12270.13820.15020.1868yesLatham
2012 a3540.54630.56770.88010.464510.194.440.06810.08770.06710.0906noc both
2012 b31060.73240.93981.6271.678611.964.750.15120.17120.17950.2165yesLatham
a incidence scores—b severity scores—c Latham and Glen Moy.
Table 2. List of 15 microarray probes within the Glen Moy genome scaffolds located within the three crumbly QTLs on linkage group 1 and 3. The 15 probes are listed in the same order of the tree cluster heatmap of Figure 2. These probes have A. thaliana ortholog gene ontology (GO) annotation related to hormones, pollen, or flower development. cr_JHI_3–20 indicates the crumbly QTL identified during this work on linkage group 3 while cr_JHI_1–15 and cr_JHI_3–15 indicate the original crumbly QTLs identified on linkage group 1 and 3 by Graham et al. [1]. The stage/s to which a significant difference (stage*phenotype interaction p < 0.001) between the two phenotypes tested is found, are indicated with bold lowercase letters as follows: a = only closed bud, b = open flower, c = green berry, d = closed bud and open flower, e = closed bud and green berry, f = open flower and green berry, and g = closed bud, open flower, and green berry.
Microarray ProbeSignificant Stage*Phenotype
Interaction
A. thaliana
Gene ID
QTLScaffoldGene Ontology (GO) Term
CUST_54460_PI426541283eAT1G62360.1cr_JHI_3-154GO:0009691 (cytokinin biosynthetic process)
GO:0048440 (carpel development)
GO:0010582 (floral meristem determinacy)
CUST_38171_PI426541283aAT3G57540.1cr_JHI_3-20419GO:0009737 (response to abscisic acid)
CUST_38657_PI426541283cAT2G46410.1cr_JHI_3-154GO:0009753 (response to jasmonic acid)
GO:0009751 (response to salicylic acid)
ƚ CUST_27324_PI426541283eAT3G63440.1cr_JHI_3-201500GO:0019139 (cytokinin dehydrogenase activity)
GO:0009690 (cytokinin metabolic process)
ƚ CUST_10154_PI426541283eAT3G63440.1cr_JHI_3-201500GO:0019139 (cytokinin dehydrogenase activity)
GO:0009690 (cytokinin metabolic process)
CUST_22099_PI426541283aAT5G52240.1cr_JHI_1-15260GO:0005496 (steroid binding)
CUST_33454_PI426541283eAT1G05180.1cr_JHI_3-154GO:0009734 (auxin activated signalling pathway)
GO:0010252 (auxin homeostasis)
GO:0009735 (response to cytokinin)
CUST_28007_PI426541283cAT3G29770.1cr_JHI_3-15509GO:0080030 (methyl indole-3-acetate esterase activity)
GO:0080031 (methyl salicylate esterase activity)
GO:0080032 (methyl jasmonate esterase activity)
GO:0009694 (jasmonic acid metabolic process)
GO:0009696 (salicylic acid metabolic process)
CUST_20489_PI426541283eAT1G11910.1cr_JHI_3-154GO:0009735 (response to cytokinin)
CUST_12159_PI426541283cAT2G19130.1cr_JHI_3-15858GO:0048544 (recognition of pollen)
CUST_44619_PI426541283eAT3G12110.1cr_JHI_3-203486GO:0010583 (response to cyclopentenone)
CUST_24407_PI426541283bAT5G12210.1cr_JHI_3-15734GO:0009555 (pollen development)
CUST_37835_PI426541283bAT1G30330.2cr_JHI_3-15664GO:0009733 (response to auxin)
GO:0009734 (auxin activated signalling pathway)
CUST_35866_PI426541283fAT4G28210.1cr_JHI_3-1565GO:0009793 (embryo development ending in seed dormancy)
CUST_13398_PI426541283dAT2G04240.1cr_JHI_3-15826GO:0009687 (abscisic acid metabolic process)
GO:0009739 (response to gibberellin)
ƚ probes matching the same A. thaliana ortholog gene.
Table 3. List of crumbly microarray probes matching A. thaliana ortholog genes that map in overlapping QTL regions containing crumbly and fruit ripening traits at position in centimorgans (cM) on linkage group (LG) 3. For each probe, the matched A. thaliana ortholog gene and the gene ontology (GO) terms associated with it are presented, together with the gene scaffold were the Rubus idaeus equivalent gene is located. The five probes are listed in the same order as Figure 3. The QTLs containing scaffold regions matched by the microarray probes are marked with uppercase “X”.
Trait
CrumblyFruit Ripening
Microarray ProbeA. thaliana
Gene ID
Position (cM)LGScaffoldQTLsGO Terms
CrumblyFruit SetGreen Fruit
CUST_54460_PI426541283AT1G62360.199.434XXXGO:0048440
GO:0009691
CUST_12159_PI426541283AT2G19130.11053858XX GO:0048544
CUST_35866_PI426541283AT4G28210.1103.3365XXXGO:0009793
GO:0009409
CUST_24407_PI426541283AT5G12210.11023734XXXGO:0009555
GO:0048440 (carpel development)—GO:0009691 (cytokinin biosynthesis)—GO:0048544 (recognition of pollen)—GO:0009793 (embryo development ending in seed dormancy)—GO:0009409 (response to cold)—GO:0009555 (pollen development).
Publisher’s Note: MDPI stays neutral with regard to jurisdictional claims in published maps and institutional affiliations.

