Article

Date of Planting and Nitrogen Management for Winter Malt Barley Production in the Northeast, USA

1
Stockbridge School of Agriculture, University of Massachusetts, Amherst, MA 01003, USA
2
Department of Plant and Soil Science, University of Vermont, St. Albans, VT 05478, USA
*
Authors to whom correspondence should be addressed.
Agronomy 2021, 11(4), 797; https://doi.org/10.3390/agronomy11040797
Submission received: 31 March 2021 / Revised: 15 April 2021 / Accepted: 16 April 2021 / Published: 18 April 2021

Abstract

:
There is an increasing market for locally grown malting barley (Hordeum vulgare L.) in the Northeast US. Malting barley must meet certain quality standards for acceptability in the brewing market. Up-to-date recommendations are needed regionally for adaptation to ongoing climate change. A two-year field experiment was conducted to assess the interactive influence of three dates of planting (5 September, 15 September, and 25 September), two levels of fall N (0 or 28 kg ha−1), and three levels of spring N (28, 50.5, and 73 kg ha−1). No significant difference was detected in grain yield amongst the treatments. The date of planting and fall N application mainly affected crop growth while spring N impacted grain quality. Delayed planting led to better winter survival and reduced lodging and foliar disease. Fall N application reduced winter survival for the early September planting but had minimal other agronomic impacts. An increased spring N application rate increased grain protein and lowered falling number, but there were no treatment differences in other quality parameters. Results indicated that late September planting, application of no fall N, and moderate spring N (28 kg ha−1) resulted in the highest agronomic N efficiency and grain quality for malting barley in Northeast.

1. Introduction

Malt barley (Hordeum vulgare L.) offers an attractive possibility to grain farmers in the Northeast United States [1,2]. While the quality standards needed for malting are high, there is a significant price premium compared to feed grains for malt barley [3,4]. Furthermore, regional malting and brewing businesses could offer opportunities for local sales and community connections, which can benefit farmers in multiple ways [5]. There is interest in regional ingredient sourcing for craft brewing, and both malt barley and hop production in the Northeast have increased in recent decades along with the increase in public demand for local and regional beers [5,6]. However, since malt barley has still not been widely grown in the region [7], the best methods for producing malt quality crops have not been fully explored [1]. This is especially true in the case of winter barley, where variety selection is limited by inconsistent winter survival [8]. However, winter barley offers several benefits over spring malt varieties in the Northeast. Winter barley competes much better against annual weeds [9], and herbicides are often not used. Timely planting of spring barley is very important to achieve malt quality [10,11], but spring planting can be delayed due to wet soil. Furthermore, winter barley can also provide environmental benefits as a cover crop over the winter months [12].
To be a viable crop, malt barley must perform well agronomically, have good inherent malting characteristics, and be properly harvested and handled to ensure proper sprouting during malting [13]. In order to produce good yields, the barley must overwinter well, resist pathogens, and remain upright during the ripening process. The grains must be large, low in protein, and very low in carcinogenic deoxynivalenol (DON) toxin [14]. Lastly, unlike most other grain crops, malting barley must sprout well during the malting process [15]. Maintaining malting quality from ripe grain to market can be difficult to achieve in the humid Northeast. Drying the crop in the field can create excessive risk of pre-sprouting [16]. This can be mitigated by harvesting barley as soon as it is ripe, regardless of moisture content and drying with forced air [2].
Barley quality can be measured in multiple ways to fully understand the grain quality. Grain size and potential malt energy can be assessed though the test weight, percent plump, and percent thin [13]. Higher test weights and percent plump indicate large energy-dense kernels, while high percent thin indicates many small kernels that will not malt well. Malt quality grains must germinate well during the malting process (greater than 95% germinative energy) and must not have begun to sprout before the malting process, either in the field or during storage (greater than 250 s falling number) [16,17]. Protein must be below 125 g kg−1, and DON content must be below 0.5 mg kg−1 [14].
These grain characteristics are affected by four major factors: (1) environmental conditions, (2) genetic characteristics of the barley variety, (3) harvest and handling techniques, and (4) farming decisions early in the growing season [2], all of which are essential for producing a malt-quality barley crop. Environmental conditions during the growing season play a major role in all aspects of the production of high-quality malt barley. Regional research has thus focused on the broadly applicable areas of variety performance [17,18,19] and to a lesser extent on agronomic management [1]. This research aims to contribute substantially to the latter.
Fall planting date can have important effects on the growth of barley. Later planting can increase winter survival and yield [8] and minimize Hessian fly damage [1].
Similarly, N (nitrogen) fertility timing and application rate have been shown to have many effects on malt barley production. Studies in the western United States have found increased N fertility associated with positive increases in yield [10,20,21,22], kernel size [2,10,20], and test weight [21,22], but also poorer malt quality in terms higher protein [10,20,21,22,23], lower N use efficiency [20,21,24], and higher potential for environmental N pollution [21,24]. However, this research was done in the dry northwestern areas of the United States, and the specific effects may be different in humid growing conditions.
Other agronomic practices like weed control [9], crop rotation [25], seeding rate [23,26], tillage methods [21,27], and irrigation [20] can also affect malt barley performance.
In order to complement variety development, farm-specific harvest decisions, and the scientific understanding of malt barley production in other areas, this study focused on the interaction between two of the most important agronomic management considerations of importance to potential malt barley growers: (1) fall planting date and (2) N fertilization rate and timing. The barley was assessed for malting quality characteristics and agronomic growth parameters to ascertain planting date and N application recommendations for fall malting barley in the Northeast US.

2. Materials and Methods

Experimental Site: This experiment was performed at the University of Massachusetts Agricultural Experiment Station Farm in South Deerfield, MA (42° N, 73° W) on fine Hadley loam soil. The barley was grown after buckwheat (Fagopyrum esculentum Moench) in 2014 and after faba bean (Vicia faba L.) in 2015. The winter of 2014–2015 was characterized by significant snow cover while the winter of 2015–2016 was warmer than average (Table 1). The top 15 cm of soil was analyzed before planting each year, and the fields were amended with mineral nutrients as recommended by the University of Massachusetts Soil and Plant Nutrient Testing Laboratory (Amherst, MA, USA) for barley production. The composite soil sample consisted of 20 sub-samples. The field sites were prepared using disk tillage immediately before the first planting date.
Experimental Layout: Four replications of each treatment were planted in a split-plot randomized complete block design with date of planting as main plots and N treatments as sub-plots. The 18 treatments consisted of balanced combinations of three planting dates (5, 15, and 25 September), two fall N rates (0 and 28 kg ha−1), and three spring N rates (28, 50.5, and 73 kg ha−1). Fall N was applied at each sowing corresponding to the planting date treatments, and spring N was applied at stem elongation (GS30); all N applications were in the form of calcium ammonium nitrate (CAN). Unfertilized plots (0 kg ha−1 fall N and 0 kg ha−1 spring N) were also grown in the 2015–2016 season to calculate agronomic N use efficiency (ANE) for that year only. ANE was calculated as the difference in yield relative to unfertilized plots divided by the amount of N applied: (fertilized grain yield—unfertilized grain yield)/N applied.
Planting and Field Assessment: Wintmalt 2-row barley was chosen as a model variety for this experiment due to its moderate winter hardiness and generally good performance regionally compared to other malting barley varieties [18]. The barley was planted 2 cm deep at 123 kg ha−1 using a custom-made plot-size cone seed drill with 17.8 cm between rows. Winter survival was determined by visual assessment on 29 April 2015 and 11 April 2016. Each plot was ranked on a 0–10 scale with 0 as completely dead and 10 as complete survival. Foliar disease was estimated on 17 June 2015 as a percentage of leaf surface area infected using the disease guides in the American Phytopathological Society’s “A Manual of Assessment Keys for Plant Disease” [28]. Due to rapid drought-induced foliar desiccation, foliar diseases were not measured in 2016. Heading date was declared when half of the tillers had emerged heads and is reported as Julian date. Plant height and lodging were only measured on 12 July 2016, one week before harvest. Lodging was visually evaluated as the proportion of plants with either bent over or broken stems.
Harvest and Laboratory Analyses: Barley was harvested using a 1995 ALMACO SPC20 plot combine on 11 August 2015 and 20 July 2016. A subsample of the grain was dried in a forced air oven at 38 °C to preserve kernel integrity. Germinative energy and test weight were determined using ASBC methods Barley-3A and Barley-2B [15]. Malt quality was assessed at the E.E. Cummings Crop Testing Laboratory at the University of Vermont (Burlington, VT, USA). Crude protein content as a proportion of dry matter was measured with a Perten Inframatic 8600 Flour Analyzer, and falling number was assessed using the AACC Method 56–81B [29] on a Perten FN 1500 Falling Number Machine. Deoxynivalenol (DON) content was evaluated in the subsamples using the NEOGEN Corp. Veratox DIN 2/3 Quantitative Test with a limit of detection of 0.1 mg kg−1.
Statistical Analysis: Data were analyzed using PROC MIXED in SAS version 9.4 [30] and orthogonal polynomials at p ≤ 0.05 to determine significant regressions in the fixed treatment effects and interactions of date of planting, spring N, and fall N. The random variables of year and block were combined into one random variable, and data from both years were combined and analyzed collectively as eight replications.

3. Results

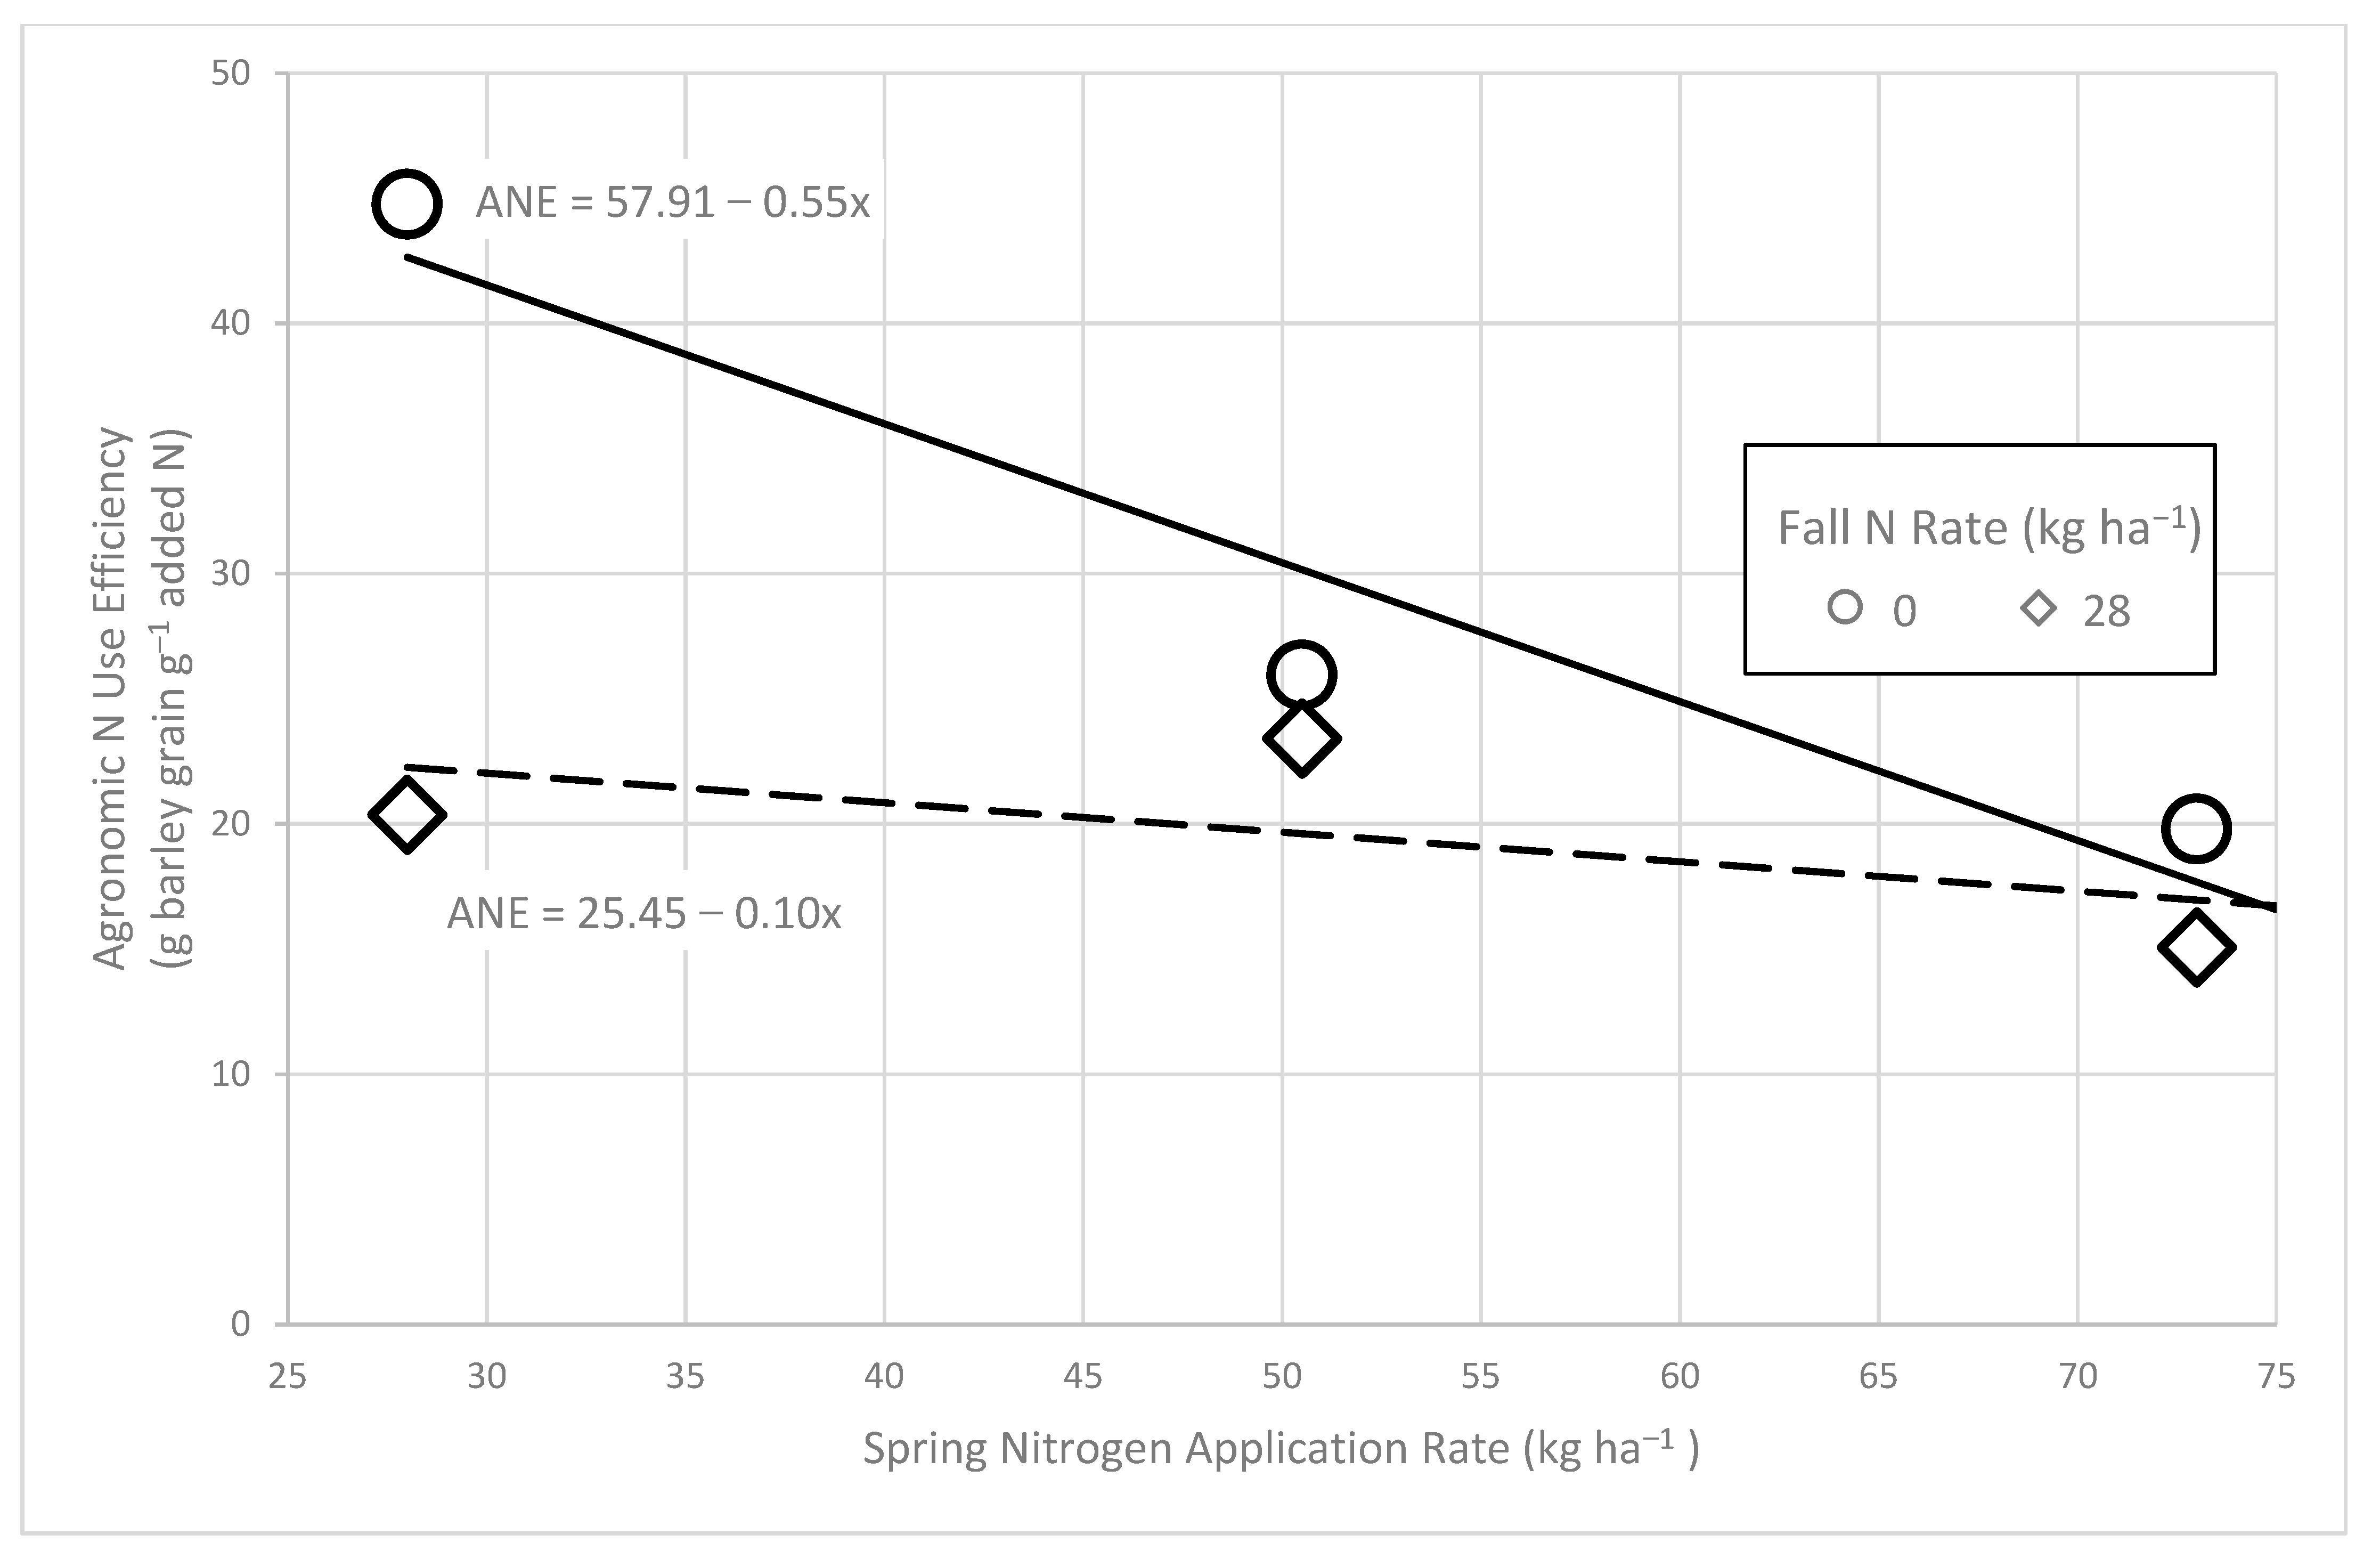
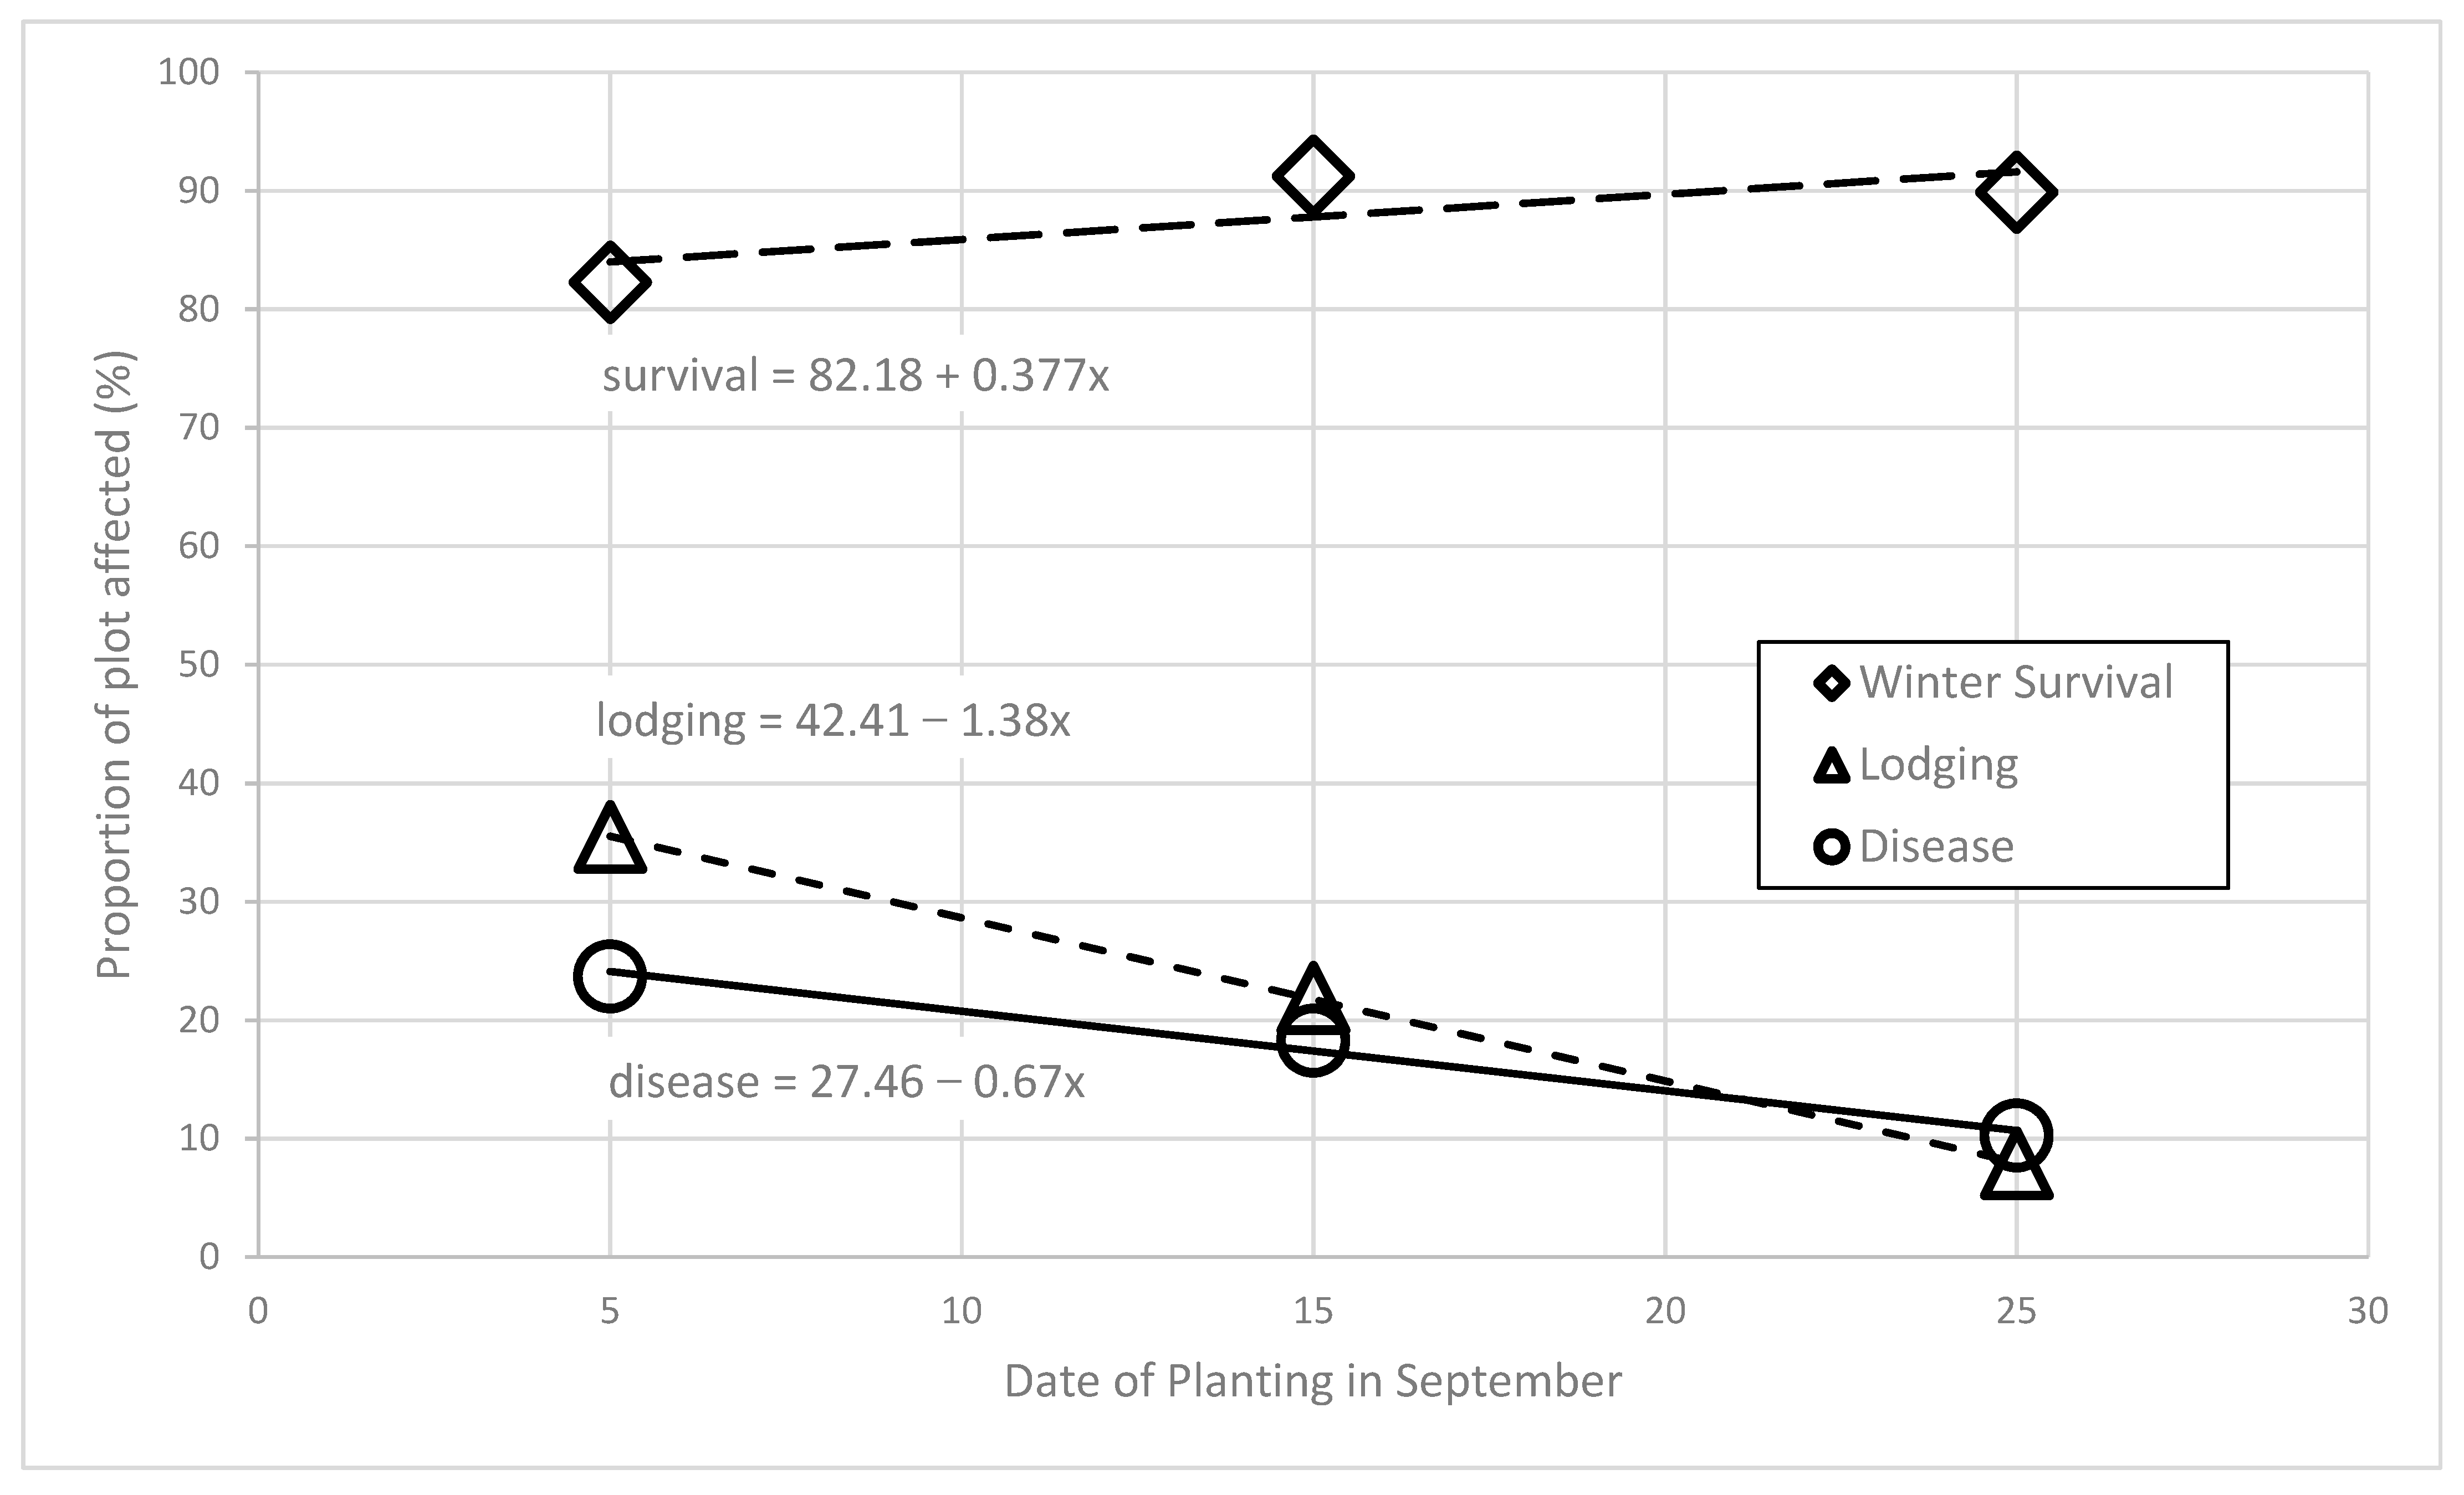
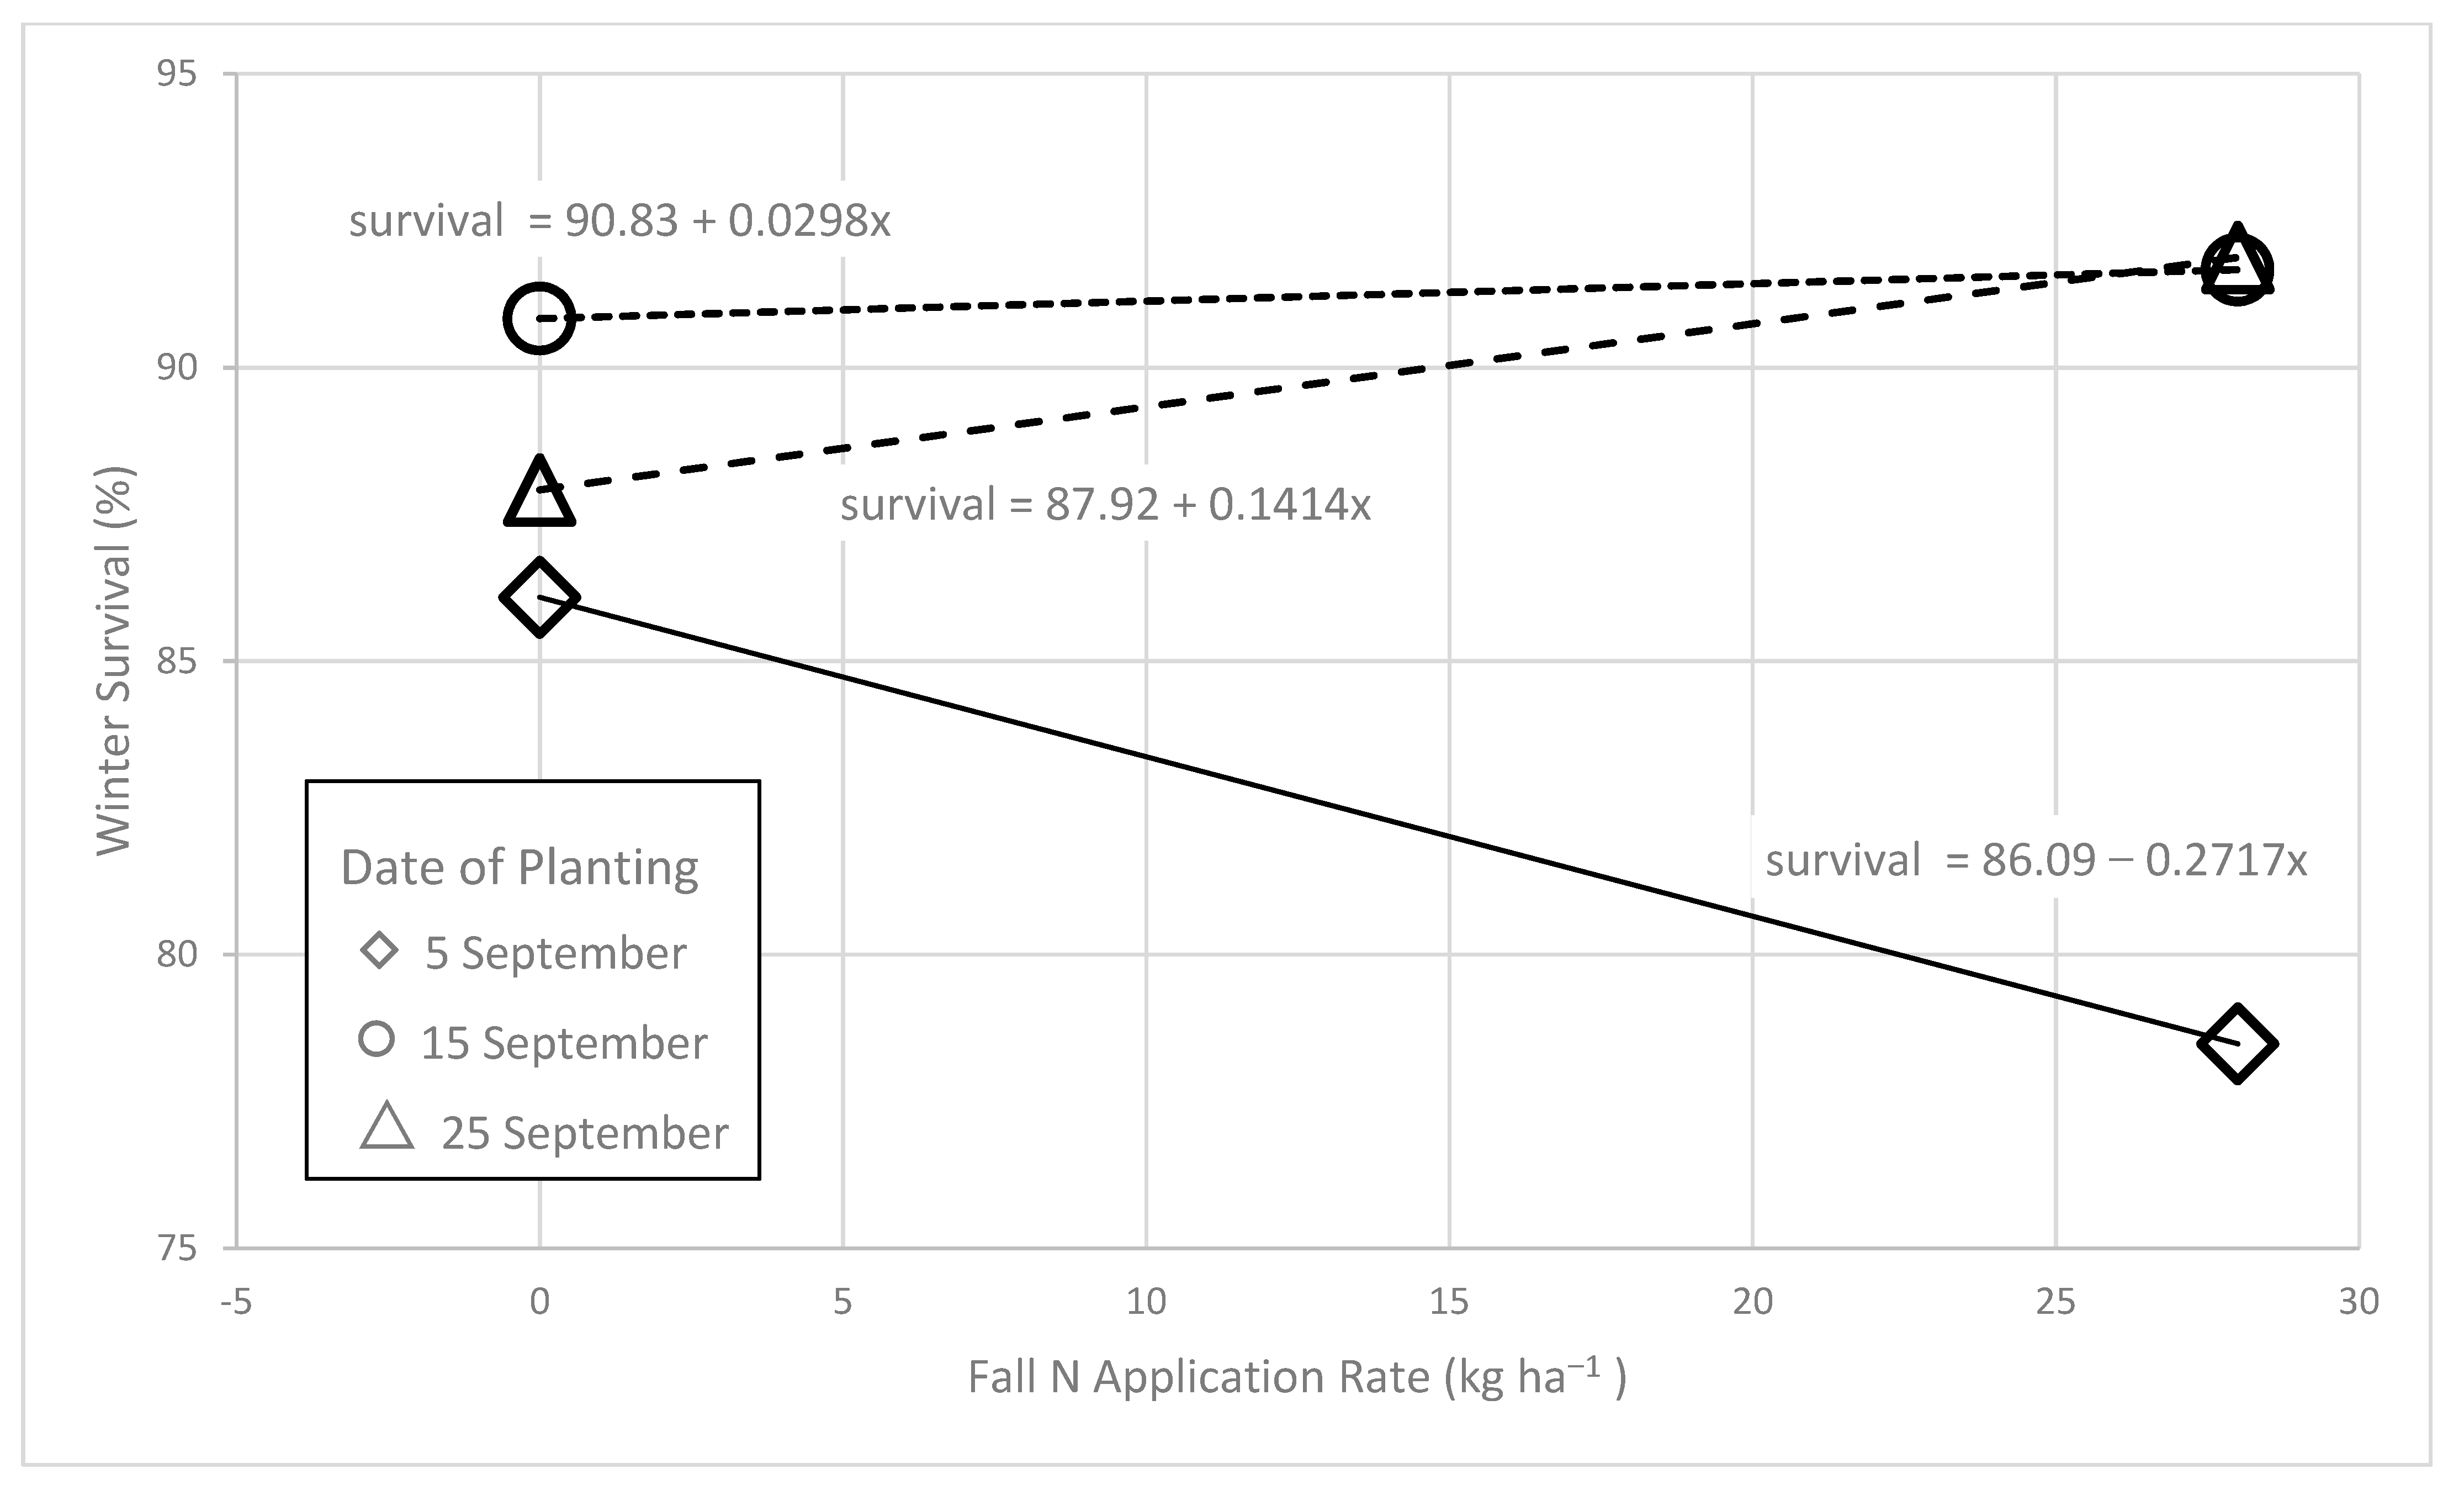
3.1. Yield and Phenological Characteristics

Neither the main effects of date of planting (DOP), application of fall N, and spring N rate, nor any of their interactions, had significant impact on grain yield (Table 2). The results indicated that barley planting can be delayed until late September, providing more opportunity for summer crops or later termination of cover crops to achieve more ecological services. Furthermore, since fall N also had no positive influence on the final grain yield, there is no benefit to N application at planting. This result is important since traditional application of N fertilizer in the fall often results in significant N loss to the environment, mainly through leaching. The loss of fall applied N resulted in 35% lower agronomic N use efficiency (ANE), when a low rate of N was applied in the spring after fall N application (Figure 1). However, at higher rates of spring N, the overall ANE was not impacted as greatly by winter N losses since a much larger proportion of the overall N was applied in the spring. Since the influence of either N application on grain yield was not significant, ANE demonstrated a declining trend with increases in N application rate. When N had been applied in the previous fall, the influence of spring N application on ANE was minimal with 20 g increase in barley grain yield for each g added N, regardless of the spring N rate. Conversely, when no N was applied at planting, the ANE was maximized when only 28 kg N ha−1 was applied in spring where ANE improved to 45 g grain yield per gram of N.
Planting date and fall N application significantly interacted to influence winter survival rate. Planting in early September decreased winter survival by 8%, compared with mid or late September plantings (Figure 2). Application of N at the time of planting in the fall intensified the negative influence of early planting on winter survival rate (Figure 3) where stand survival fell from 86% to 78%. However, when planting was delayed, the influence of fall N application on winter survival was less pronounced (Table 2 and Figure 3).
The influence of DOP, fall, and spring N application and their interactive effects on winter survival, lodging, foliar disease, and heading time are presented in Table 2. Regardless of fall N treatment, the difference in heading time and height of plants amongst the three planting dates was minimal (Table 2). While statistically insignificant, the application of N in the fall increased the lodging percentage. The influence of fall N application on heading time was significant, but the difference between treatments was less than two days (Table 2).
Delay in planting barley led to less foliar disease, primarily powdery mildew (Blumeria graminis f. sp. hordei) and lodging percentage in the spring and summer (Figure 2). When barley was planted in early September, almost 25% of stands were affected by the foliar disease and more than a third of stand lodged before the harvest in July. In contrast, only 10% of barley plants were infected by foliar diseases and less than 8% lodged when planted in late September. Mid-September plantings performed intermediately on both foliar disease and lodging traits. However, despite the higher lodging and disease occurrence in the earliest planting date, the final grain yield was not significantly affected, likely because the disease occurred late in the growing season and the barley plants were not entirely lodged, thus it was still possible to harvest grains with careful combining. The results indicated that delaying planting time until late September will not delay harvest, but it will provide additional benefits, including reduced rate of disease incident and lodging percentage.
Increased spring N application rate from 28 kg ha−1 to 73 kg ha−1 showed no significant impact on plant health or vegetative growth (Table 2).

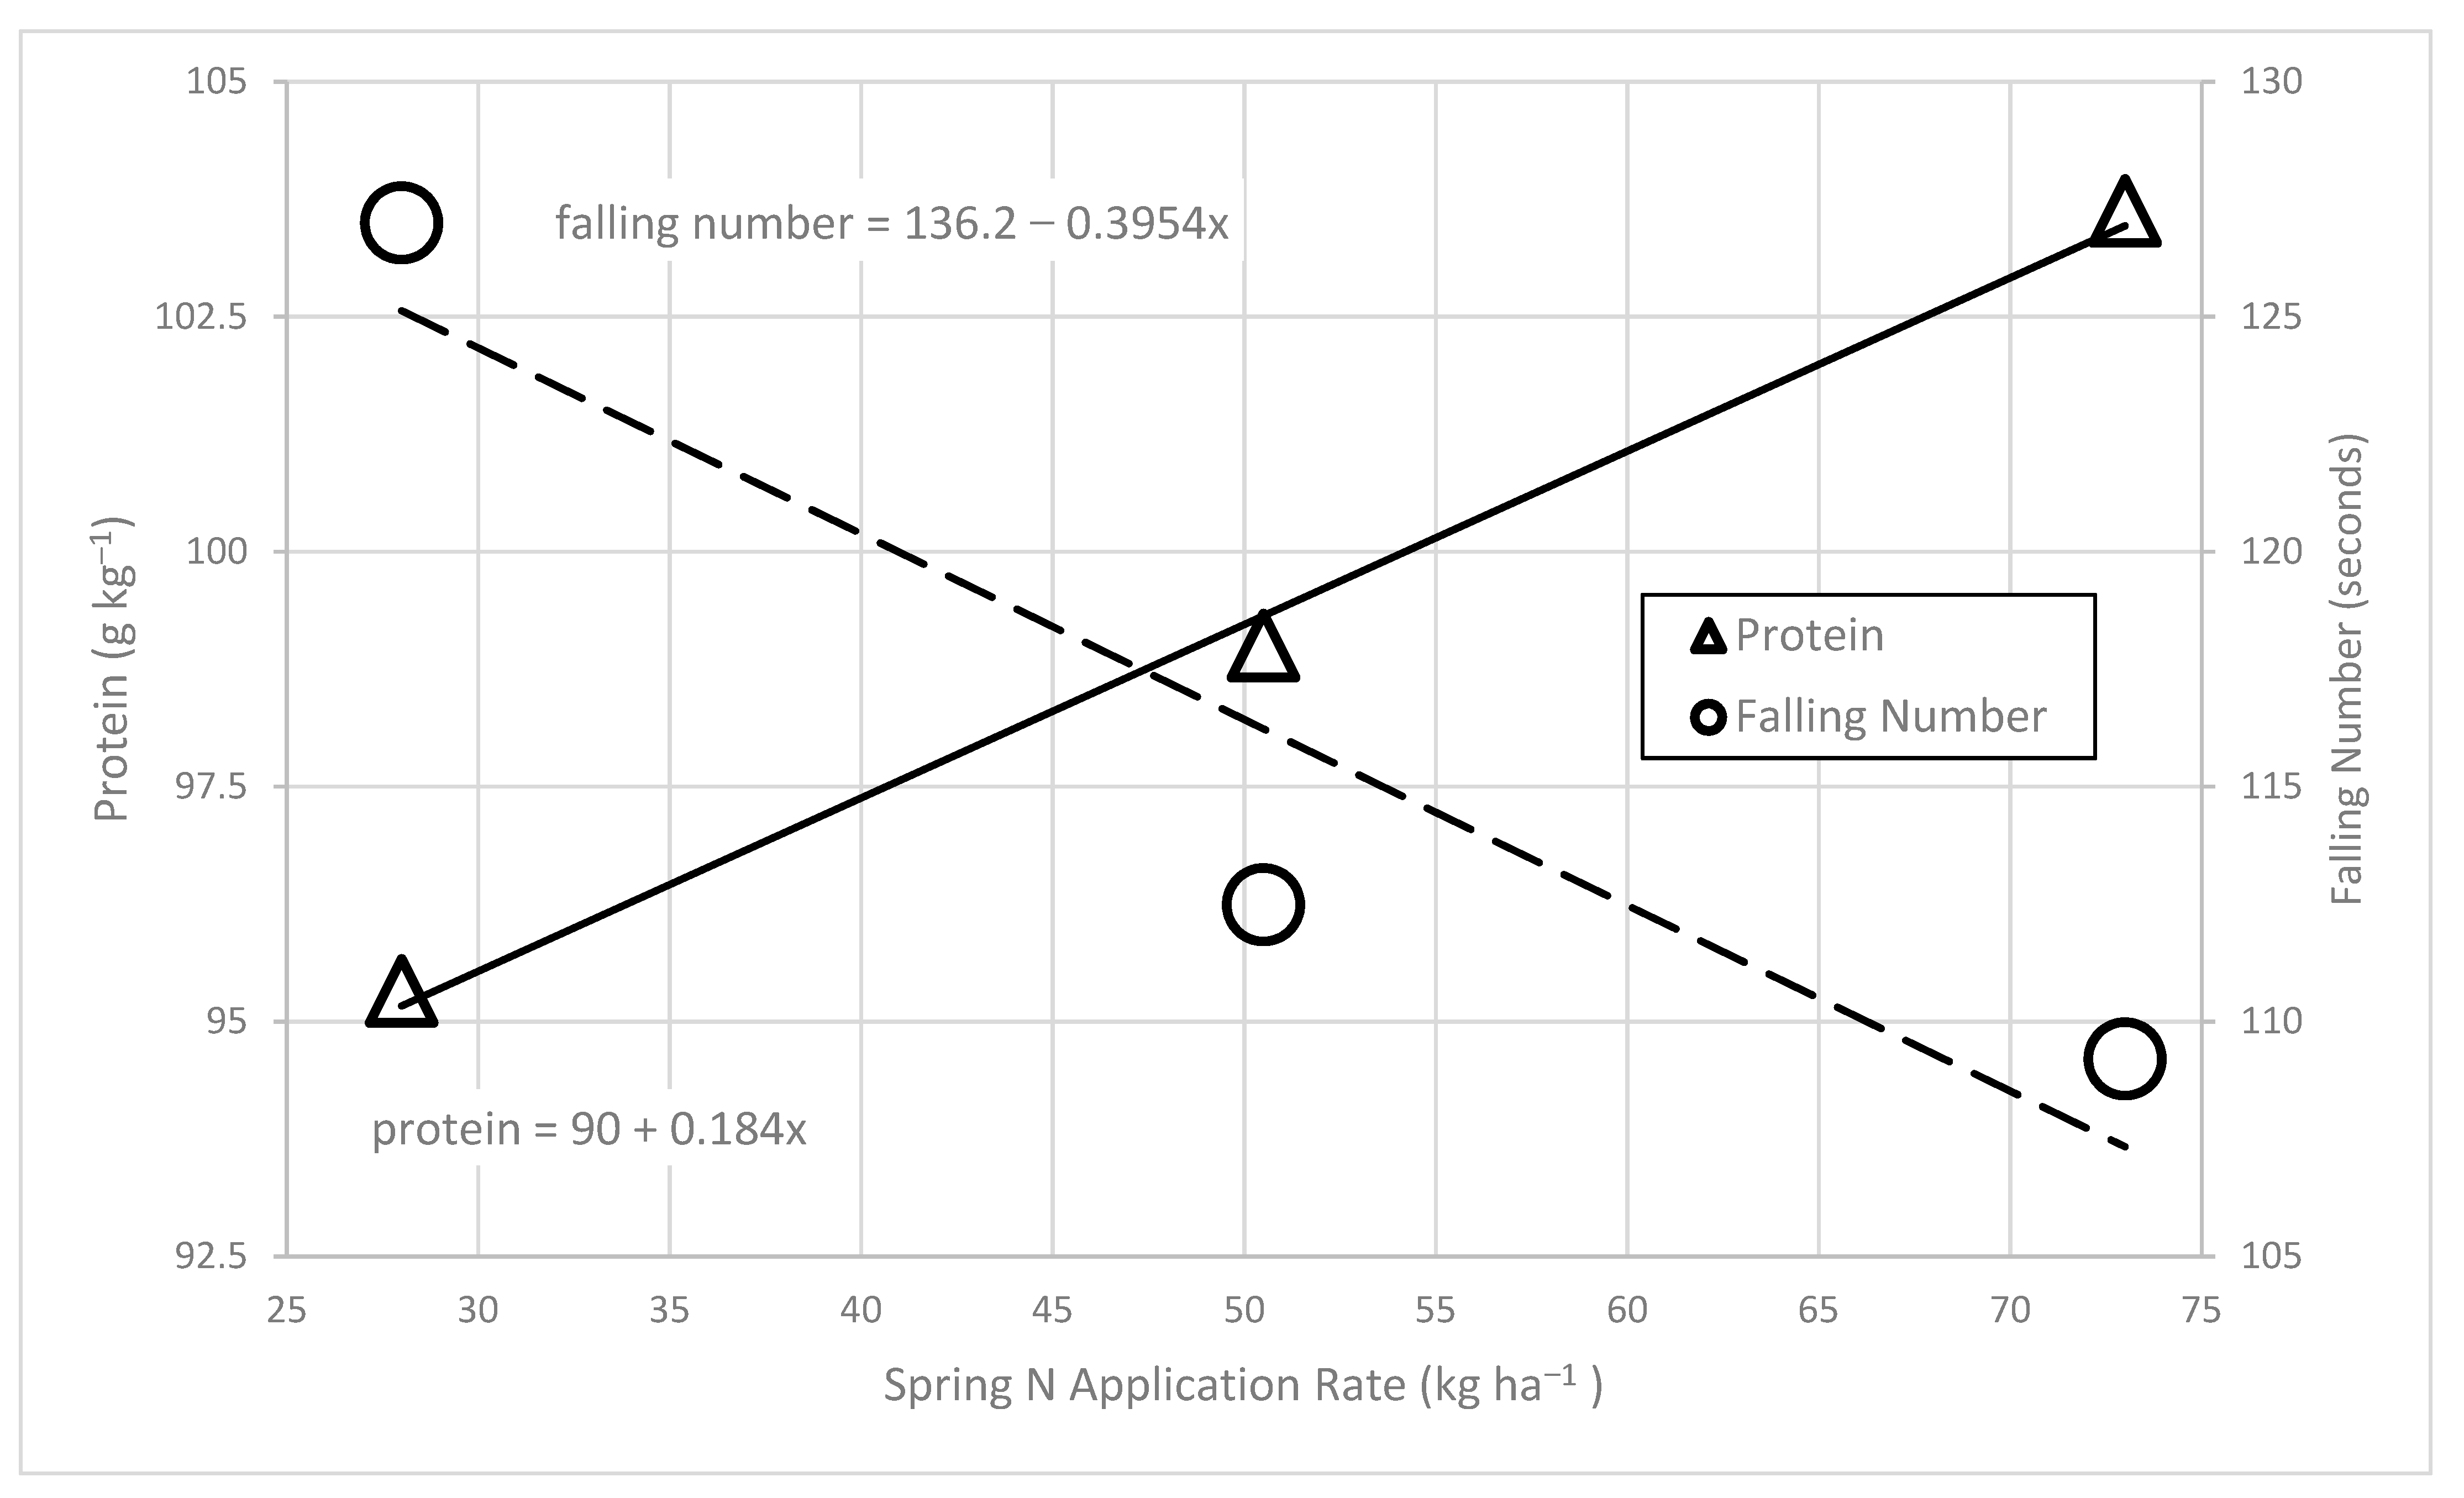
3.2. Malt Quality Characteristics

While grain yield and some malting quality characteristics, including DON, test weight, and germinative energy, did not differ significantly across treatments (Table 2 and Table 3), there was a non-significant increase in DON level at later planting dates, and grain protein and falling number were significantly influenced by the main effect of the rate of spring N application (Figure 4). Protein content increased from 95.3 g protein kg−1 dry matter to 103.6 g kg−1 when spring N application rate increased from 28 kg N ha−1 to 73 kg N ha−1. However, in all treatments, the protein level was below 125 g kg−1 dry matter, which is the acceptability threshold for brewing purpose [14]. Falling number decreased from 127 to 109 s with increased N application rate from 28 to 73 kg ha−1 (Figure 4). For both falling number and protein level, application of 50.5 kg N ha−1 in spring led to intermediate grain quality. Planting date also had a significant effect on protein content (Table 3) with mid-September planting leading to lower protein content (96.5 g kg−1) than either early or late September plantings. However, orthogonal polynomial regression did not show a significant linear regression and it seems unlikely that this type of relationship between date of planting and protein content would be replicated in future research trials or in farm production.

4. Discussion

Much of the research on brewing barley in North America has been done in the more arid climates of the Midwest and Northwest [20,21,22,23]. Little research has been published on the agronomic management of winter malt barley in the Northeast United States [1]. Furthermore, much of the existing scholarship focuses on spring-planted malt barley which has a different lifecycle [20,21], while other studies on winter barley were conducted in colder regions than Massachusetts [8,31,32]. Given the differences in growing conditions and barley type, it is unsurprising that the results of this experiment were somewhat different from prior studies.
Previous studies have identified planting date as a highly important factor in winter malt barley production in the Northeast US. This is especially important to explore currently since climate change has resulted in milder winters, and winter grain planting dates are typically later on farms than in the past. Results in this study (Figure 2) agree with Zhong et al. [8], who found that late September or early October led to better winter survival compared with either early September or late October. Studies performed in Vermont found inconsistent winter survival at different dates of planting with barley planted in late September showing worse winter survival relative to early and mid-September plantings in 2015 and better survival in 2017 [31,32]. While Hashemi et al. [18] did not explore planting dates, they found that most tested varieties survived well when planted in late September. Both Zhong et al. [8] and Hashemi et al. [18] found large differences between cultivars with some almost entirely winter killed. Overall winter survival was considerably lower in Minnesota [8] and Vermont [31] than in Massachusetts (Table 2), suggesting that particular care should be taken in genotype selection in colder areas of the Northeast US. Zhong et al. [8] did not explore the interactive effects of fall N and planting dates. The current study also found that untimely early planting damaged the overall health of the barley in the following summer when early planted barley was more prone to both powdery mildew infection and lodging prior to harvest (Figure 3). While the vegetative stress related to early planting did not significantly affect the final grain yield quality, it could prove meaningful in harsher weather conditions in other years.
In contrast to the current study, Stevens et al. [20], Sainju et al. [21], and MacKenzie et al. [10] reported an increase in yields from N fertilization in spring malt barley, and Darby et al. [31] and Castro et al. [22] showed similar increases in winter malt barley. However, all of these studies included 0 N treatment in their experiments, which almost certainly amplified the statistical significance of N fertilization in their analyses. While our study did not include unfertilized controls in the factorial experimental design, we grew unfertilized plots to calculate agronomic N use efficiency. The grain yield in these unfertilized plots had much lower yields (2.81 t ha−1) than any of the fertilized plots (Table 2). Thus, the rates of N fertilization between 28 and 101 kg ha−1 used in this experiment did not produce different barley yields and do not contradict other reports that showed that increasing N fertilization from a baseline of 0 kg ha−1 did increase yields. In fact, only one of these studies, by Castro et al. [22], found yield response to N rates greater than 67 kg ha−1. Taken in the context of previous work, the results presented here suggest that relatively low spring-applied N fertilizer rates (up to 28 kg ha−1) are sufficient to meet the N needs of current winter malt barley varieties in the Northeast. This is supported by the fact that agronomic N use was only half as efficient when more than 28 kg N ha−1 was applied, regardless of application timing (Figure 1). However, the timing of N fertilization had other effects on the spring and summer barley growth.
Fall N application of 28 kg N ha−1 reduced winter survival in early September planted barley and increased lodging, foliar disease, and plant height. Darby et al. [31] also examined the plant height but found small differences based on the combination of spring and fall N application rates rather than fall N in particular. Nevertheless, the differences in height were small in this study and earlier report by Darby et al. [31] and unlikely to be considered meaningful. However, the height may be an indicator of overall vegetative vigor. If this is the case, the correlation between increased height and increased lodging and disease may not be coincidental. Fall N application may increase the upward growth at the expense of both stem strength and immune function.
Regionally, achieving malting quality harvests for barley is challenging both for farmers [2] and in research trials [18,31,32]. In assessing the malting quality found in this experiment, it is worth distinguishing between quality measurements, which are wholly determined during plant growth (protein content, test weight, and DON content), and those that can be highly affected by weather conditions immediately before and during harvest (falling number and germinative energy). Protein content, test weight, and DON are thus more reliable metrics for assessing durable barley malting quality since they are less volatile when compared to the falling number and germinative energy. Taken as a whole, neither yield nor any of the malt quality parameters were significantly affected by date of planting of fall N fertilization. Similarly, yield and some quality characteristics (test weight, DON content, and germinative energy) were unaffected by spring N application rate. However, lower spring N fertilization (28 kg ha−1) improved the malt quality in both protein content and falling number.
These results confirm pervious findings that increases in N fertilization increased the protein content of both spring [10,20,21,23] and winter [22,31,32] brewing barley (Figure 4). While none of the barley in this trial exceeded malting threshold for protein content (<125 g kg−1 dry matter), it is still important to manage for relatively low protein since the variety used in this trial (Wintmalt) has lower protein than many other malting varieties [18]. Furthermore, excessive protein levels have been caused by high N fertilization in previous trials [10,20,21,22,23,31,32]. Given that greater levels of N than 0 fall N and 28 kg ha−1 spring N could risk producing protein levels in exceeding malt standards and are unlikely to greatly increase yield, N fertilization should only be applied in the spring at relatively low levels.
We found few other significant effects on malting quality from either N application or planting date with additional N only causing a decrease in falling number (Figure 4) and no effect on test weight, DON content, or germinative energy (Table 3). Castro et al. [22] assessed test weight as a malt barley characteristic in winter malt barley and found no association with N rate. In Vermont, Darby et al. [31] found small differences in test weight, DON content, falling number, and germinative energy at different N rates, but there was not a consistent trend based on application rate. Darby et al. [32] found no significant differences in malt quality at N rates between 0 and 112 kg N ha−1. In spring type malt barley, Stevens et al. [20] and Sainju et al. [21] found small decreases in test weight at higher N rates while Edney et al. [23] found minor decreases in germinative energy at high N application rates (120 kg ha−1) compared with no N fertilizer. It is possible that the quality of spring type malt barley is more sensitive to excessive N, but even so these effects are agronomically small and it seems clear that high N rates primarily damage barley malt quality by increasing the grain protein content rather than other quality parameters. The differences seen in the malting quality characteristics observed in this experiment did not change the acceptability of barley for malting purpose. The significant differences in protein and falling number, and non-significant trends in other parameters, should thus be understood as relative differences rather than as absolute values that would be seen in on-farm growing conditions or regardless of weather during the growing season. Furthermore, previous studies have found that similar growing conditions [18,31,32] can result in a wide range of malt quality characteristics and therefore farmers are likely to benefit from good management choices.

5. Conclusions

The quality standards for malt barley are high, and it is unlikely that a farmer will be able to meet them every year in the Northeast weather conditions. Thus, even small differences in quality and yield could be the difference between the high price for malt quality grain and selling a harvest for animal feed. Given these market conditions and uncertain future climate conditions, farmers need to be able to build their cropping decisions on high quality information. While there is certainly much more to explore in the production of malt barley for the fast-growing Northeast US market, this study shows that, along with proper variety selection, timely planting (late September in Massachusetts), no fall N application, and moderate spring N (28 kg ha−1) application provide the best results.

Author Contributions

Conceptualization, M.H. and H.D.; supervision, M.H.; investigation, C.W.; formal analysis, A.S. (Arthur Siller) and A.S. (Alexandra Smychkovich); writing—original draft preparation, A.S. (Arthur Siller); writing—review and editing, A.S. (Arthur Siller), M.H, H.D and A.S. (Alexandra Smychkovich). All authors have read and agreed to the published version of the manuscript.

Funding

This study was partially funded by Northeast Sustainable Agriculture Research and Education, projects numbers GNE 13-066 and RE 15-018.

Institutional Review Board Statement

Not applicable.

Informed Consent Statement

Not applicable.

Data Availability Statement

The data presented in this study are openly available from UMass.

Conflicts of Interest

The authors declare no conflict of interest. The funders had no role in the design of the study; in the collection, analyses, or interpretation of data; in the writing of the manuscript; or in the decision to publish the results.

References

  1. Shrestha, R.K.; Lindsey, L.E. Agronomic Management of Malting Barley and Research Needs to Meet Demand by the Craft Brew Industry. Agron. J. 2019, 111, 1570–1580. [Google Scholar] [CrossRef] [Green Version]
  2. Lazor, J. The Organic Grain Grower: Small-Scale, Holistic Grain Production for the Home and Market Producer; Chelsea Green Publishing: White River Junction, VT, USA, 2013. [Google Scholar]
  3. Surjawan, I.; Dougherty, M.P.; Camire, M.E.; Jemison, J.J. Malting Quality of Maine-Grown Barley; MR433: Onono, ME, USA, 2004; p. 433. Available online: https://digitalcommons.library.umaine.edu/cgi/viewcontent.cgi?article=1009&context=aes_miscreports (accessed on 17 April 2021).
  4. Robertson, L.D.; Wesenberg, D.M. Major uses of barley. In Idaho Spring Barley Production Guide; Bull 742; Robertson, L.D., Stark, J.C., Eds.; Ag Publications: Moscow, ID, USA, 2003; Available online: http://www.extension.uidaho.edu/publishing/pdf/BUL/BUL0742.pdf (accessed on 17 April 2021).
  5. Brewers Association. Malting Barley Characteristics for Craft Brewers; Brewers Publications: Boulder, CO, USA, 2020; Available online: https://cdn.brewersassociation.org/wp-content/uploads/2019/06/Malting_Barley_Characteristics_For_Craft_Brewers.pdf (accessed on 17 April 2021).
  6. Hmielowski, T. From Field to Pint Malting Barley in the Eastern U.S. Crop. Soils 2017, 50, 10–13. [Google Scholar] [CrossRef]
  7. USDA NASS (National Agricultural Statistics Service). Small Grains 2020 Summary 09/30/2020. 2020. Available online: https://downloads.usda.library.cornell.edu/usda-esmis/files/5t34sj573/7p88d6171/bn999x131/smgr0920.pdf (accessed on 17 April 2021).
  8. Zhong, B.H.W.; Wiersma, J.J.; Sheaffer, C.C.; Steffenson, B.J.; Smith, K.P. Assessment of Winter Barley in Minnesota: Relationships among Cultivar, Fall Seeding Date, Winter Survival, and Grain Yield. Crop Forage Turfgrass Manag. 2019, 5, 1–8. [Google Scholar] [CrossRef]
  9. Beres, B.L.; Harker, K.N.; Clayton, G.W.; Bremer, E.; Blackshaw, R.E.; Graf, R.J. Weed-Competitive Ability of Spring and Winter Cereals in the Northern Great Plains. Weed Technol. 2010, 24, 108–116. [Google Scholar] [CrossRef]
  10. McKenzie, R.H.; Middleton, A.B.; Bremer, E. Fertilization, Seeding Date, and Seeding Rate for Malting Barley Yield and Quality in Southern Alberta. Can. J. Plant Sci. 2005, 85, 603–614. [Google Scholar] [CrossRef] [Green Version]
  11. Weston, D.T.; Horsley, R.D.; Schwarz, P.B.; Goos, R.J. Nitrogen and Planting Date Effects on Low-Protein Spring Barley. Agron. J. 1993, 85, 1170–1174. [Google Scholar] [CrossRef]
  12. Clark, A. Managing Cover Crops Profitably, 3rd ed.; Sustainable Agriculture Network: Beltsville, MD, USA, 2008. [Google Scholar]
  13. Wrigley, C.; Batey, I.; Miskelly, D. Cereal Grains: Assessing and Managing Quality; Woodhead Publishing: Cambridge, UK, 2016. [Google Scholar]
  14. BMBRI (Brewing and Malting Barley Research Institute). Quality Factors in Malting Barley. 2010. Available online: http://bmbri.ca/wp-content/uploads/2016/10/Quality-Factors-in-Malting-Barley-May-2010.pdf (accessed on 17 April 2021).
  15. ASBC (American Society of Brewing Chemists). Methods of Analysis, 14th ed.; The Society: St. Paul, MN, USA, 2009. [Google Scholar]
  16. Mallett, J. Malt: A Practical Guide from Field to Brewhouse; Brewers Publications: Boulder, CO, USA, 2014. [Google Scholar]
  17. Darby, H.; Cummings, E.; Emick, H. Organic Winter Malt Barley Variety Trial; UVM Extension: Burlington, VT, USA, 2017; Available online: https://scholarworks.uvm.edu/cgi/viewcontent.cgi?article=1055&context=nwcsp (accessed on 17 April 2021).
  18. Hashemi, M.; Zandvakili, O.R.; Shureshjani, R.A.; Etemadi, F.; Darby, H. Evaluating Winter Barley Cultivar Using Data Envelopment Analysis Models. J. Autom. Sin. 2019, 11, 22. [Google Scholar] [CrossRef]
  19. Brouwer, B.O.; Schwarz, P.B.; Barr, J.M.; Hayes, P.M.; Murphy, K.M.; Jones, S.S. Evaluating Barley for the Emerging Craft Malting Industry in Western Washington. Agron. J. 2016, 108, 939–949. [Google Scholar] [CrossRef] [Green Version]
  20. Stevens, W.B.; Sainju, U.M.; Caesar-TonThat, T.; Iversen, W.M. Malt Barley Yield and Quality Affected by Irrigation, Tillage, Crop Rotation, and Nitrogen Fertilization. Agron. J. 2015, 107, 13. [Google Scholar] [CrossRef]
  21. Sainju, U.M.; Lenssen, A.W.; Barsotti, J.L. Dryland Malt Barley Yield and Quality Affected by Tillage, Cropping Sequence, and Nitrogen Fertilization. Agron. J. 2013, 105, 329–340. [Google Scholar] [CrossRef] [Green Version]
  22. Castro, A.; Petrie, S.; Budde, A.; Corey, A.; Hayes, P.; Kling, J.; Rhinhart, K. Variety and N Management Effects on Grain Yield and Quality of Winter Barley. Crop Manag. 2008, 7, 1–8. [Google Scholar] [CrossRef]
  23. Edney, M.J.; O’Donovan, J.T.; Turkington, T.K.; Clayton, G.W.; McKenzie, R.; Juskiw, P.; Lafond, G.P.; Brandt, S.; Grant, C.A.; Harker, K.N.; et al. Effects of Seeding Rate, Nitrogen Rate and Cultivar on Barley Malt Quality: Effects of Seeding Rate, Nitrogen Rate and Cultivar on Barley Malt Quality. J. Sci. Food Agric. 2012, 92, 2672–2678. [Google Scholar] [CrossRef] [PubMed]
  24. Delogu, G.; Cattivelli, L.; Pecchioni, N.; De Falcis, D.; Maggiore, T.; Stanca, A.M. Uptake and Agronomic Efficiency of Nitrogen in Winter Barley and Winter Wheat. Eur. J. Agron. 1998, 9, 11–20. [Google Scholar] [CrossRef]
  25. Turkington, T.K.; O’Donovan, J.T.; Edney, M.J.; Juskiw, P.E.; McKenzie, R.H.; Harker, K.N.; Clayton, G.W.; Xi, K.; Lafond, G.P.; Irvine, R.B.; et al. Effect of Crop Residue, Nitrogen Rate and Fungicide Application on Malting Barley Productivity, Quality, and Foliar Disease Severity. Can. J. Plant Sci. 2012, 92, 577–588. [Google Scholar] [CrossRef] [Green Version]
  26. O’Donovan, J.T.; Turkington, T.K.; Edney, M.J.; Clayton, G.W.; McKenzie, R.H.; Juskiw, P.E.; Lafond, G.P.; Grant, C.A.; Brandt, S.; Harker, K.N.; et al. Seeding Rate, Nitrogen Rate, and Cultivar Effects on Malting Barley Production. Agron. J. 2011, 103, 709–716. [Google Scholar] [CrossRef] [Green Version]
  27. Woźniak, A. Effect of various systems of tillage on winter barley yield, weed infestation and soil properties. Appl. Ecol. Environ. Res. 2020, 18, 3483–3496. [Google Scholar] [CrossRef]
  28. James, C. A Manual of Assessment Keys for Plant Diseases; American Phytopathological Society: St. Paul, MN, USA, 1971. [Google Scholar]
  29. AACC Approved Methods of Analysis, 11th ed.; Method 56-81.04 Determination of Falling Number; Cereals & Grains Association: St. Paul, MN, USA, 2000.
  30. SAS Institute. Base SAS 9.4 Procedures Guide, 5th ed.; SAS Institute: Cary, NC, USA, 2015. [Google Scholar]
  31. Darby, D.H.; Emick, H.; Jean, H. 2018 Winter Barley Planting Date and Nitrogen Amendment Trial; UVM Extension: Burlington, VT, USA, 2019; Available online: https://www.uvm.edu/sites/default/files/media/2018_Winter_Barley_PDxN_Report.pdf (accessed on 17 April 2021).
  32. Darby, H.; Emick, H.; Cummings, E. 2016 Winter Barley Planting Date and Nitrogen Amendment Trial; UVM Extension: Burlington, VT, USA, 2017; Available online: https://www.uvm.edu/sites/default/files/Northwest-Crops-and-Soils-Program/2016-ResearchReports/2016_Winter_Barley_PDxN_Report.pdf (accessed on 17 April 2021).
Figure 1. Interactive effect of spring N application with and without fall N application on Agronomic N use efficiency (ANE).
Agronomy 11 00797 g001
Figure 2. Winter survival, lodging, and disease (% of plot) as a function of date of planting.
Agronomy 11 00797 g002
Figure 3. Interactive effect of fall N application (kg ha−1) at planting dates of 5, 15, and 25 of September on winter survival (%).
Agronomy 11 00797 g003
Figure 4. Protein content (g kg−1 dry matter) and falling number (seconds) as a function of spring N application (kg ha−1).
Agronomy 11 00797 g004
Table 1. Weather Data for the Date of Planting and Nitrogen Trial for the University of Massachusetts Agricultural Research Farm, South Deerfield, MA *.
YearMonthAvg Temp (°C)Departure from avg. **Max Temp (°C)Departure from avg. Min Temp (°C)Departure from avg. Total Precipitation (cm)Departure from avg. GDD ***Departure from avg.
2014September16.30.130.70.83.72.34.1−6.6512.11.8
October11.62.324.3−0.3−0.44.116.05.1354.654.1
November3.2−0.717.7−1.0−10.2−0.18.91.3109.2−29.3
December0.41.911.8−2.8−11.95.011.73.348.40.7
2015January−6.7−1.54.4−6.4−20.92.38.41.50.6−21.7
February−10.3−6.73.7−7.2−27.6−7.63.8−2.80.1−20.7
March−1.4−2.412.7−5.3−20.3−4.34.3−4.629.1−62.2
April7.7−0.123.1−4.1−6.4−0.55.1−2.8225.6−25.4
May17.63.731.40.81.72.92.5−5.8541.892.3
June17.9−0.730.1−2.26.21.319.37.6549.8−27.7
July21.1−0.332.7−0.311.32.28.4−0.8676.3−5.9
August21.10.732.50.311.33.86.4−2.8679.421.7
September18.32.133.03.14.93.616.35.6580.570.3
October9.2−0.123.3−1.4−7.4−2.95.6−5.1289.1−11.49
November6.22.323.14.4−8.91.25.1−2.8193.755.3
December4.05.416.41.8−5.511.411.93.6139.191.3
2016January−2.72.411.00.2−15.57.73.8−3.019.1−3.2
February−1.91.814.94.1−26.1−6.210.44.155.634.8
March4.73.825.57.5−87.98.4−0.5172.681.3
April7.4−0.326.2−1.0−11−5.15.3−2.5230.0−20.9
May14.20.332.61.9−1.7−0.46.6−2.0448.6−0.8
June19.10.430.9−1.45.30.43.6−8.1577.3−0.2
July22.30.934.41.49.90.94.3−5.1702.220.0
* Weather data were recorded at the Orange, MA airport weather station, 37 km from the South Deerfield. ** Weather averages are based on the years 1981–2010. *** GDD =   Σ   T max   +   T min 2 T base   where   T max   and   T min   are   daily   maxiumum   and   minimum   temperatures   and   T base = 0   ° C .
Table 2. Mean yield and growth metrics for winter malt barley grown with different dates of planting and fall and spring N rates grown in South Deerfield MA in 2014–2015 and 2015–2016.
Date of PlantingFall NSpring NGrain Yield (13.5% Moisture)Agronomic N Use EfficiencyWinter SurvivalLodgingFoliar DiseaseHeightHeading Date
(kg ha−1)(kg ha−1)(t ha−1)(kg Increase in Yield kg−1 N)---- (Percent of Plants Affected) ----(cm)(Julian Day)
5 September028.03.9623.4084.316.725.857.36144.0
50.54.5022.2687.535.021.461.38144.0
73.04.2922.6086.337.529.263.18143.5
2828.04.4116.8778.123.822.662.97143.0
50.54.5817.5876.443.318.365.55143.9
73.04.3111.2080.653.824.864.19142.9
15 September028.04.1459.4990.016.314.960.85142.6
50.54.4027.9692.517.519.860.06142.1
73.05.0918.5390.018.818.360.59142.8
2828.04.0815.5091.330.020.359.69143.3
50.54.8426.9691.320.017.064.77143.4
73.04.7315.8792.528.819.264.98142.8
25 September028.03.7546.0485.02.59.659.80143.9
50.54.1027.6088.87.510.661.81143.0
73.03.5918.2490.010.08.162.39143.4
2828.04.1928.7191.33.810.762.55142.1
50.54.0824.2191.915.08.565.09142.6
73.04.6618.1292.58.814.262.39142.1
Date of Planting
5 September 4.3418.9882.235.023.762.44143.5
15 September 4.5527.3891.321.918.361.82142.8
25 September 4.0627.1689.97.910.362.34142.9
Fall N (kg ha−1)
0 4.2029.5788.318.017.560.82143.3
28 4.4319.4587.325.217.363.57142.9
Spring N (kg ha−1)
28 4.0931.6786.715.517.360.54143.1
50.5 4.4224.4388.123.115.963.11143.2
73 4.4417.4388.626.319.062.95142.9
Overall Experiment Mean4.3224.6287.921.417.462.22143.1
Effect
Date of Planting (DOP) nsns*****nsns
Fall N nsnsnsnsns*ns
Spring N ns*nsnsnsnsns
DOP × Fall N nsns**nsnsns**
DOP × Spring N nsnsnsnsnsnsns
Fall N × Spring N ns*nsnsnsnsns
Note. *, p ≤ 0.05; **, p ≤ 0.01; ***, p ≤ 0.001; ns, non-significant. All effects assessed as continuous effects and, when significant, analyzed with orthogonal polynomial regression.
Table 3. Mean grain quality metrics for winter malt barley grown with different dates of planting and fall and spring N rates in South Deerfield MA in 2014–2015 and 2015–2016.
Date of PlantingFall NSpring NProtein (0% Moisture)Test WeightFalling NumberDONGerminative Energy
(kg ha−1)(kg ha−1)(g kg−1)(kg hL−1)(seconds)(mg kg−1)(%)
5 September028.093.360.20123.10.2191.29
50.5102.159.1294.00.4886.63
73.0104.959.1788.40.2583.63
2828.097.557.86110.90.2388.38
50.5101.360.92100.30.1490.14
73.0106.060.3594.90.2486.25
15 September028.095.560.38121.80.3489.38
50.595.259.92122.30.3583.13
73.0100.060.24109.90.3978.88
2828.094.260.37128.40.1986.25
50.594.861.37115.90.3988.63
73.099.360.52115.50.3188.75
25 September028.096.860.46141.10.3884.88
50.5101.060.89124.60.3684.38
73.0104.761.33135.80.5783.63
2828.094.660.19136.30.4087.63
50.599.860.25116.40.4186.13
73.0107.059.38110.90.4082.25
Date of Planting
5 September 100.859.60101.90.2687.72
15 September 96.560.47118.90.3385.83
25 September 100.660.42127.50.4284.81
Fall N (kg ha−1)
0 99.360.19117.90.3785.09
28 99.460.13114.40.3087.15
Spring N (kg ha−1)
28 95.359.91126.90.2987.96
50.5 99.060.41112.20.3686.50
73 103.660.16109.20.3683.90
Overall Experiment Mean99.3560.16116.20.3486.06
Effect
Date of Planting (DOP) **nsnsnsns
Fall N nsnsnsnsns
Spring N ***ns**nsns
DOP × Fall N nsnsnsnsns
DOP × Spring N nsnsnsnsns
Fall N × Spring N nsnsnsnsns
Note. **, p ≤ 0.01; ***, p ≤ 0.001; ns, non-significant. All effects assessed as continuous effects and, when significant, analyzed with orthogonal polynomial regression.
Publisher’s Note: MDPI stays neutral with regard to jurisdictional claims in published maps and institutional affiliations.

