
Polypropylene Pipe Compounds with Varying Post-Consumer Packaging Recyclate Content

Abstract
:1. Introduction
2. Materials
3. Methods
3.1. Melt Flow Rate Measurements
3.2. Specimen Production
3.3. Density Measurements
3.4. Differential Scanning Calorimetry
3.5. Oxidation Induction Temperature (Dynamic OIT) Measurements
3.6. Tensile Tests
3.7. Charpy Impact Tests
3.8. Fatigue Crack Growth Experiments
4. Results
4.1. Introductory Results of the Recyclates
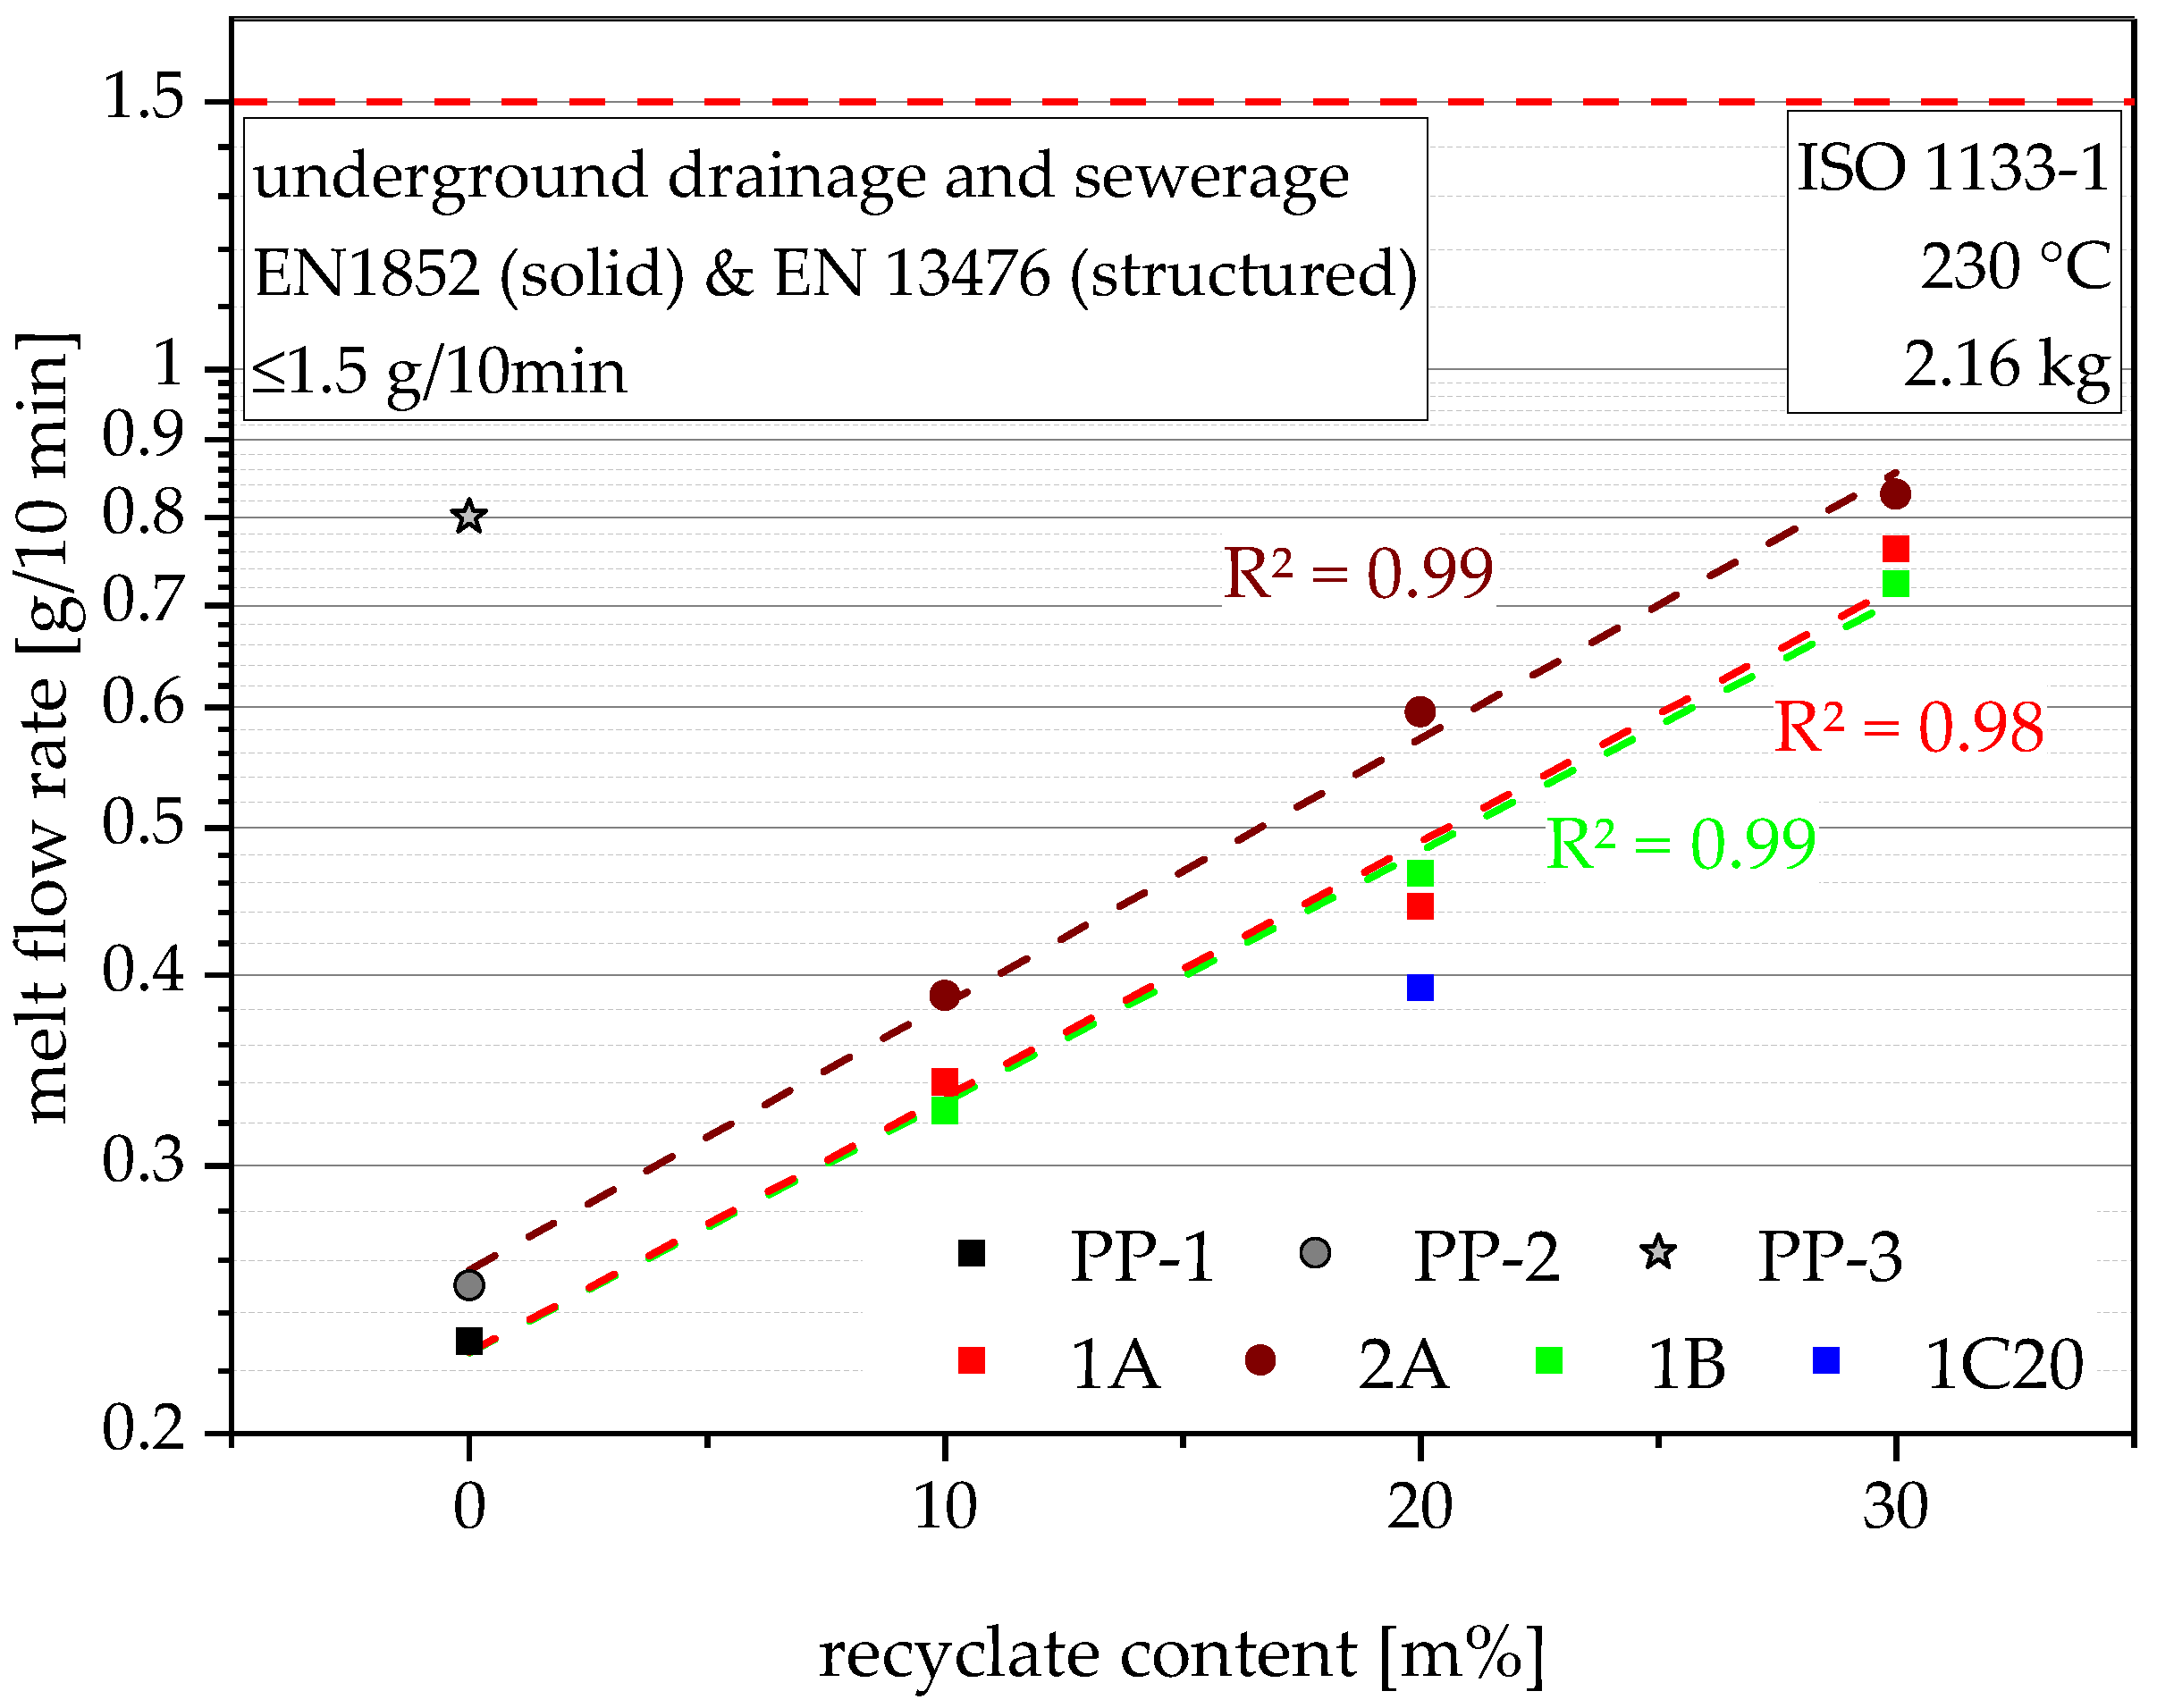
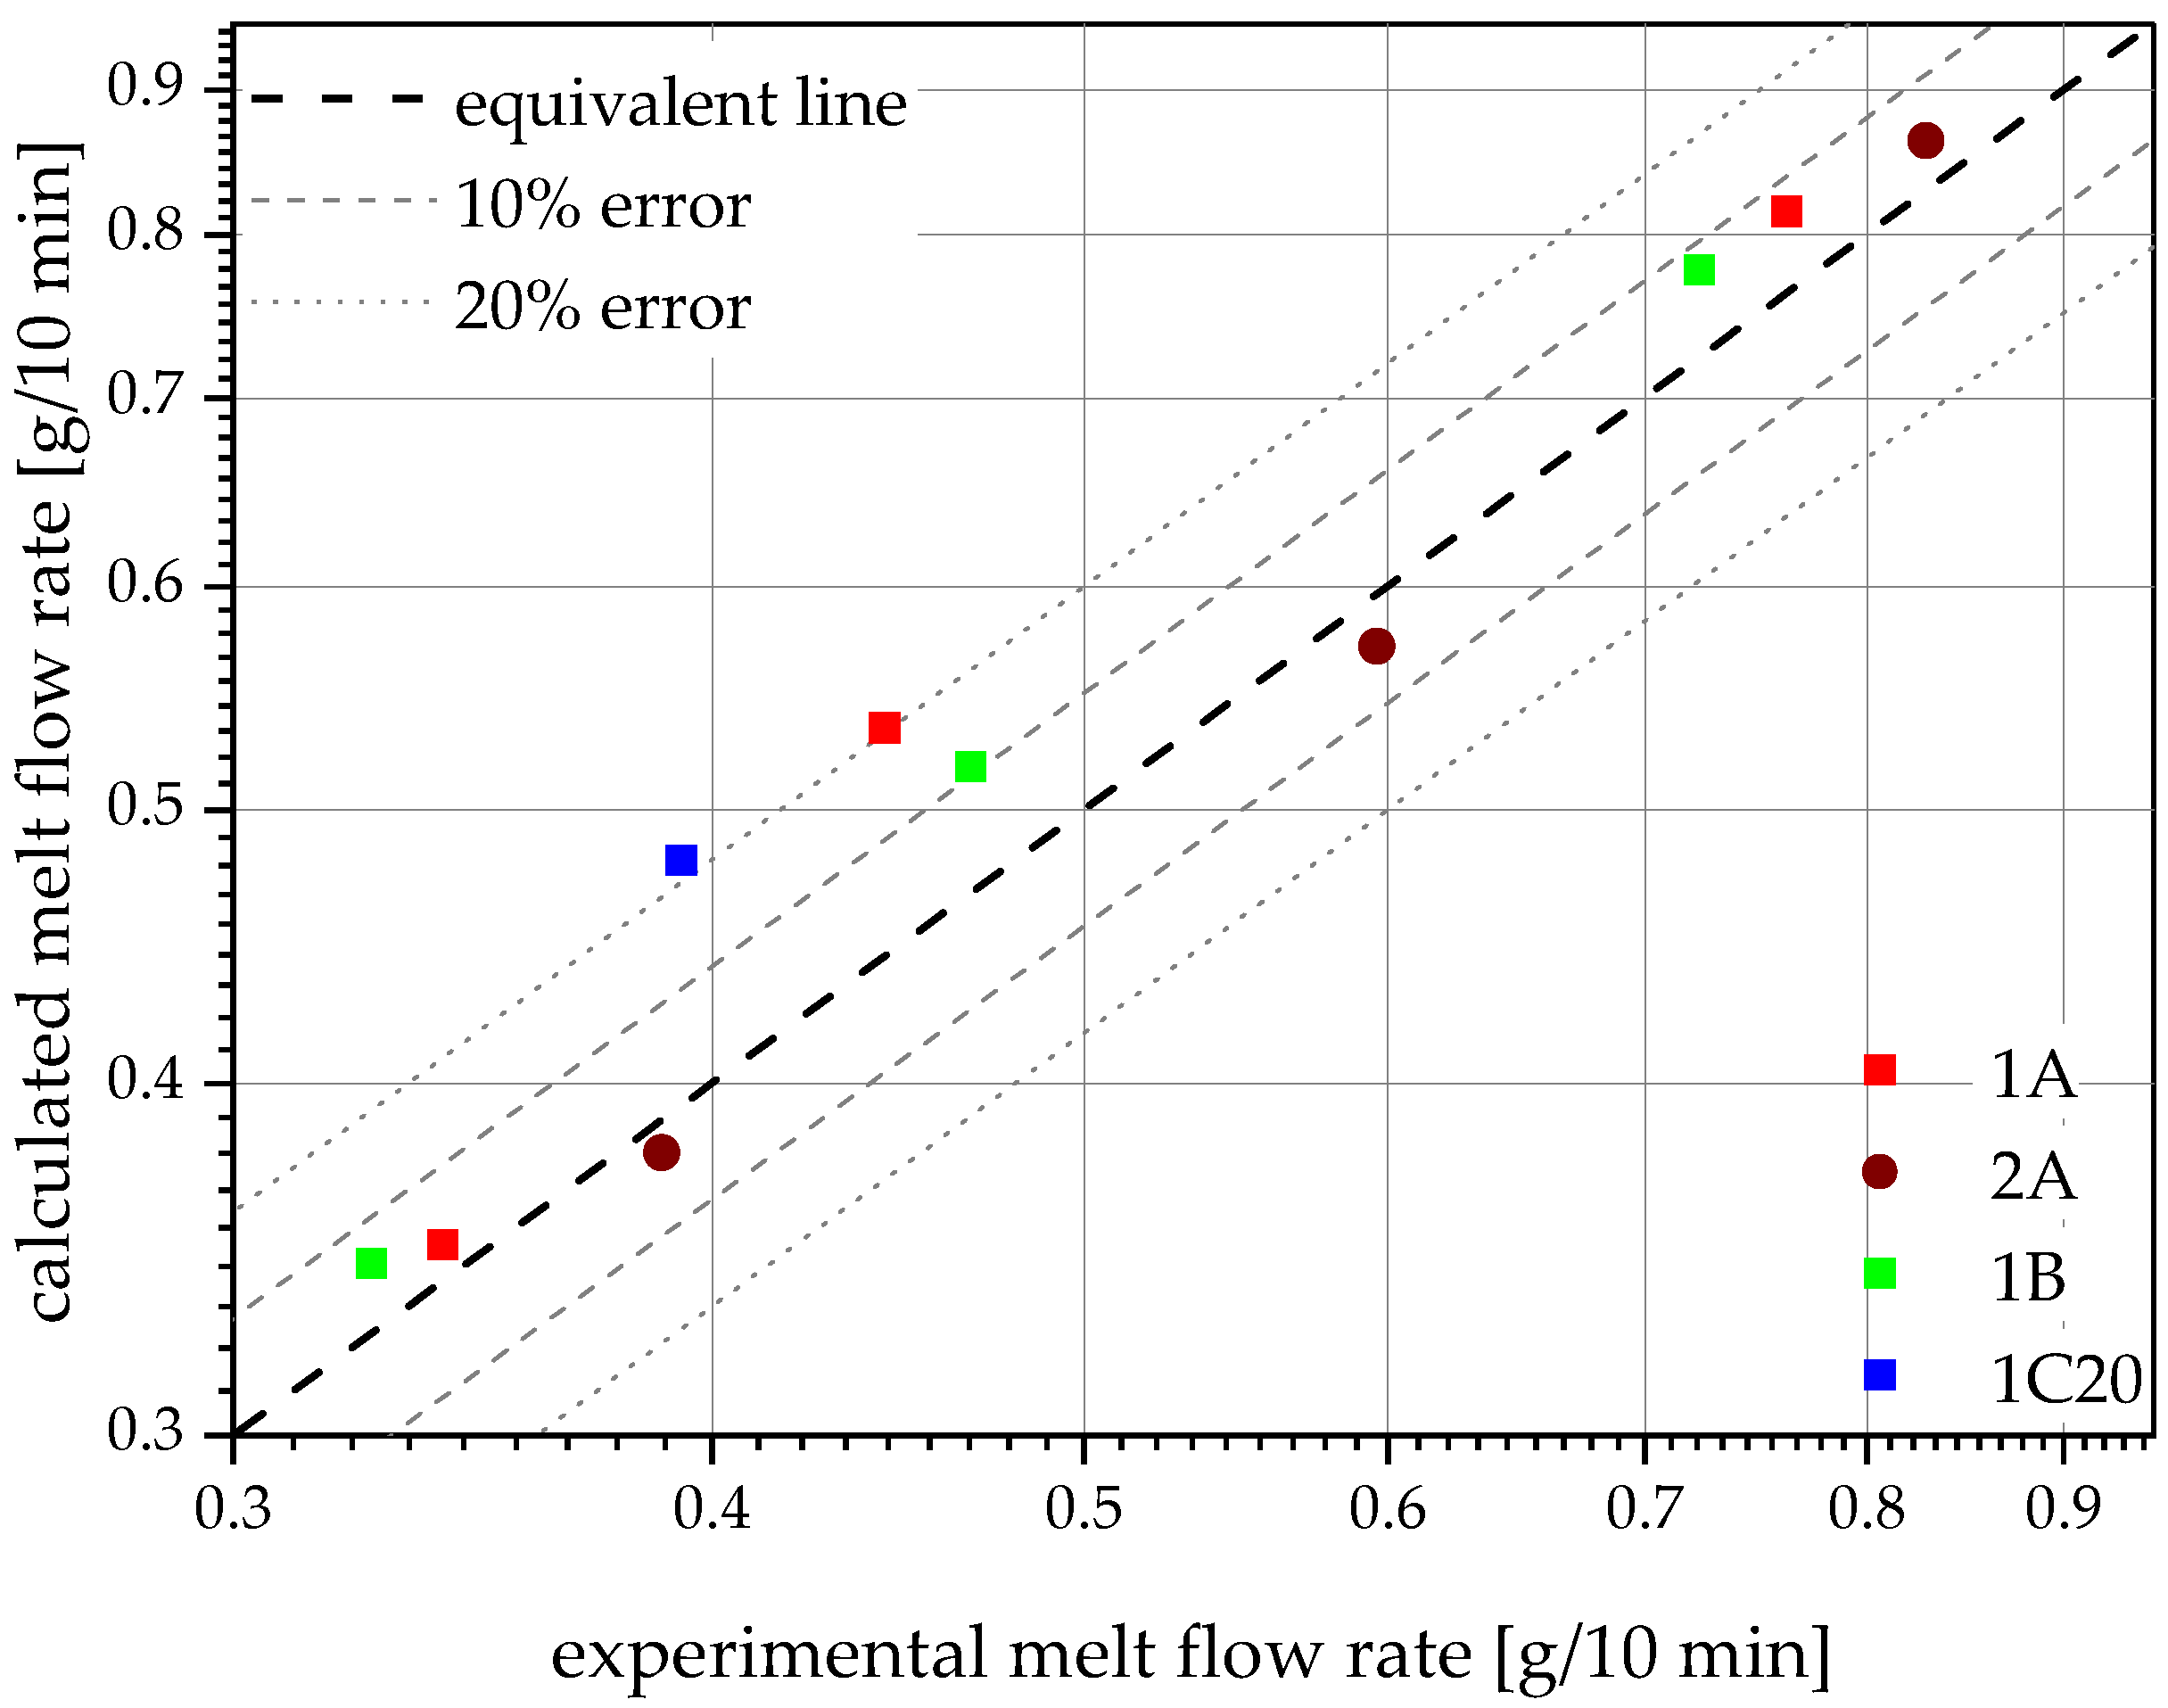
4.2. Melt Flow Rate
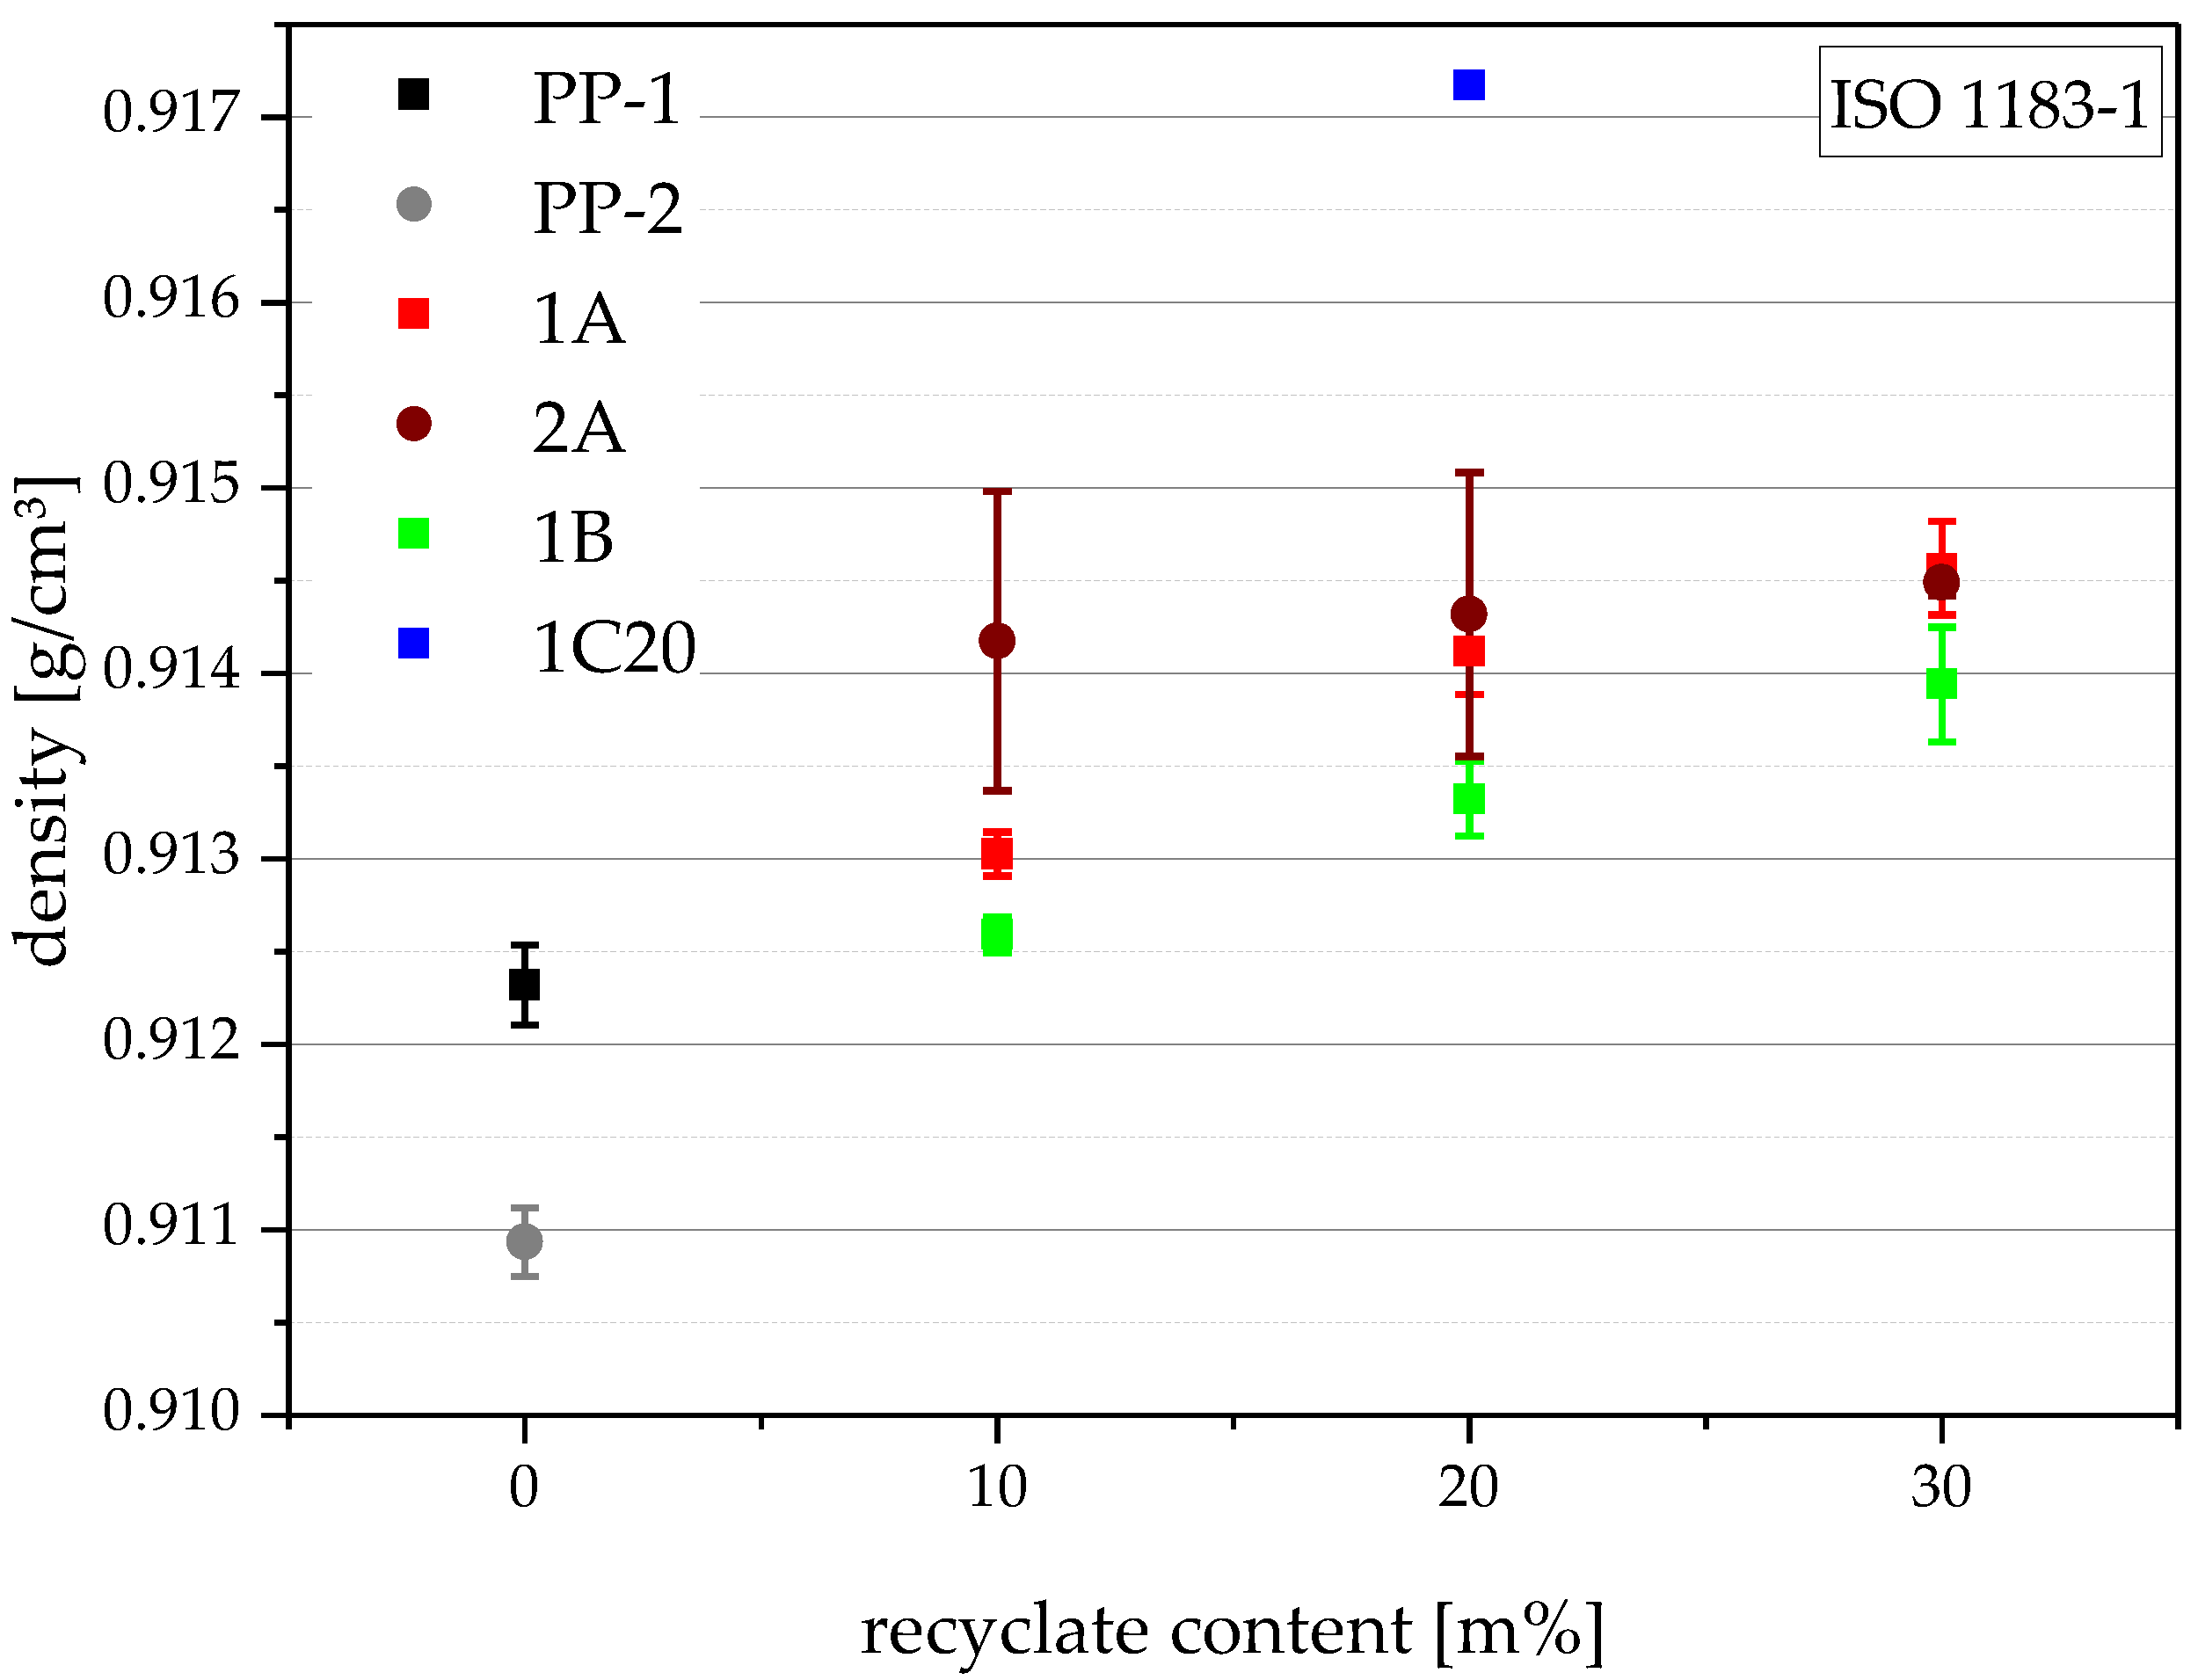
4.3. Density
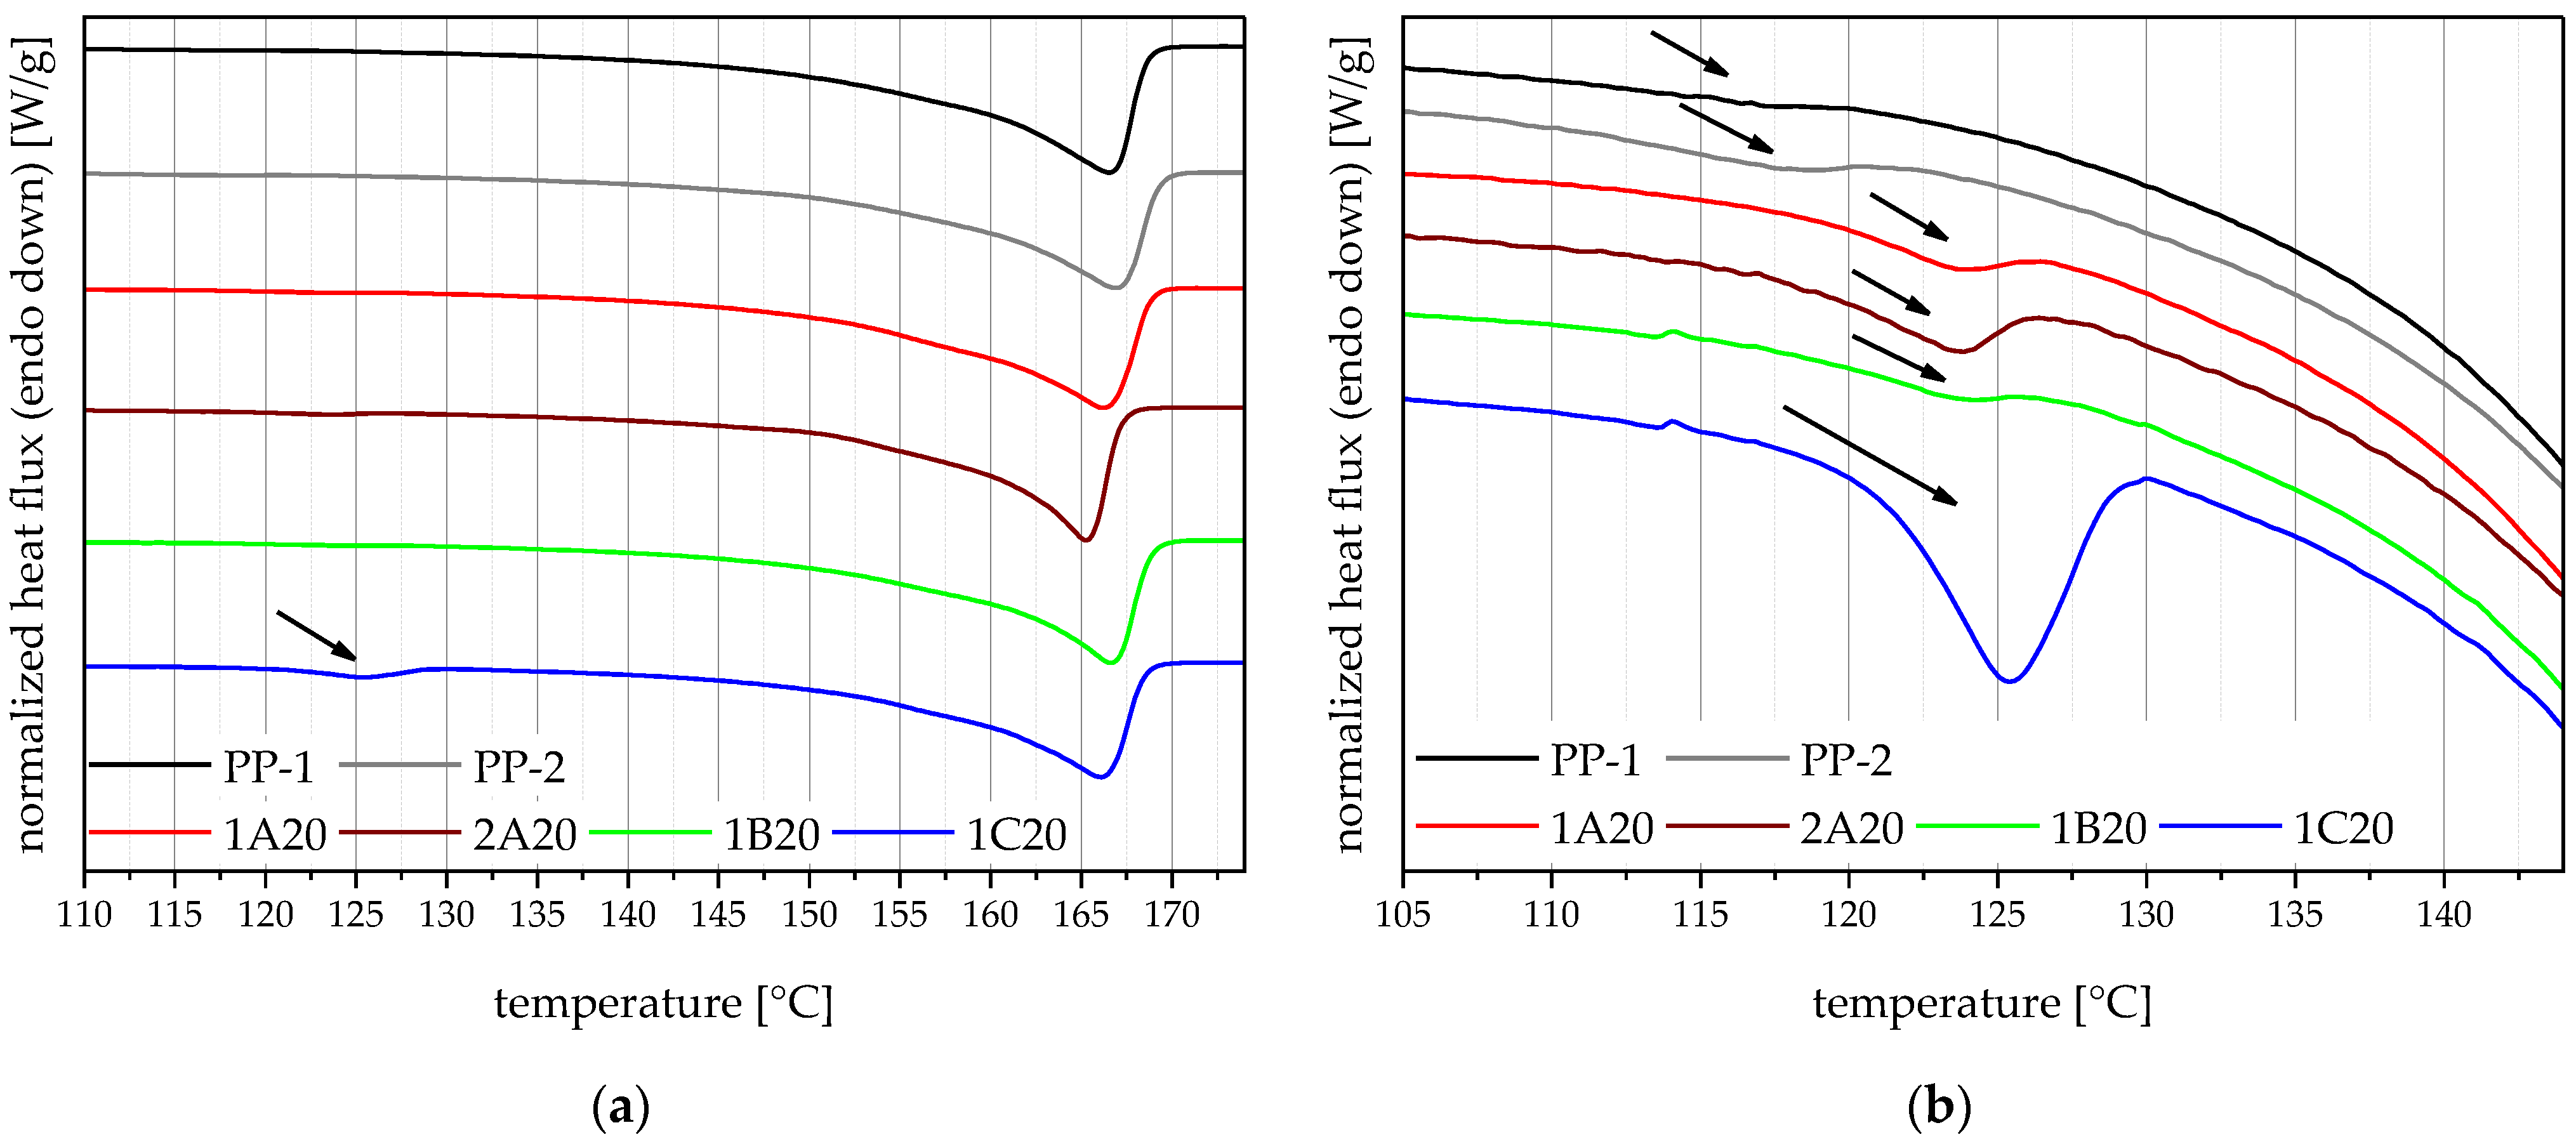
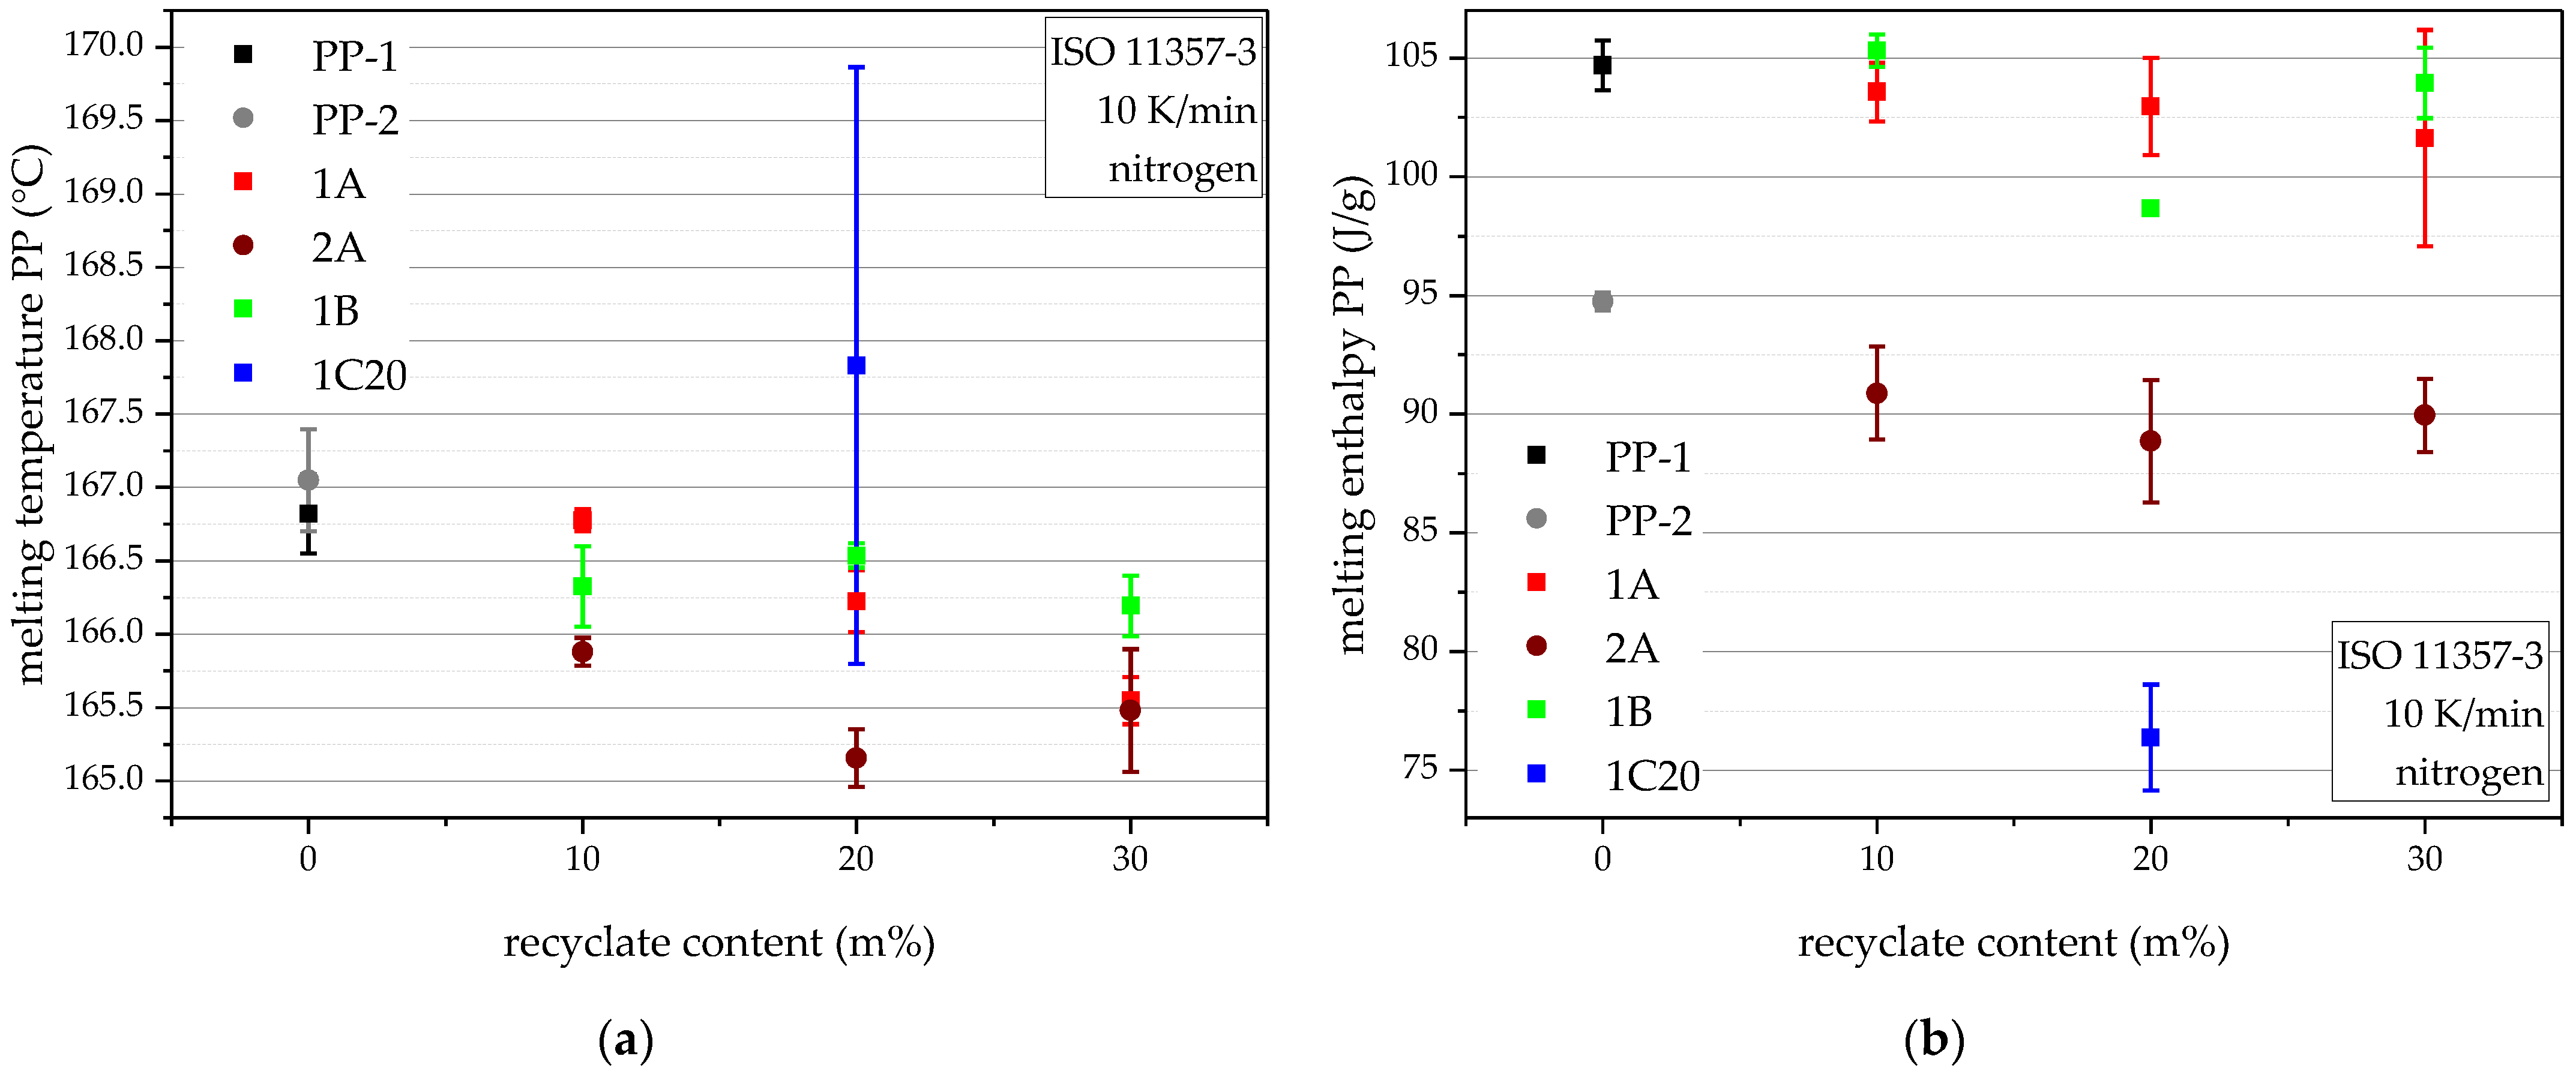
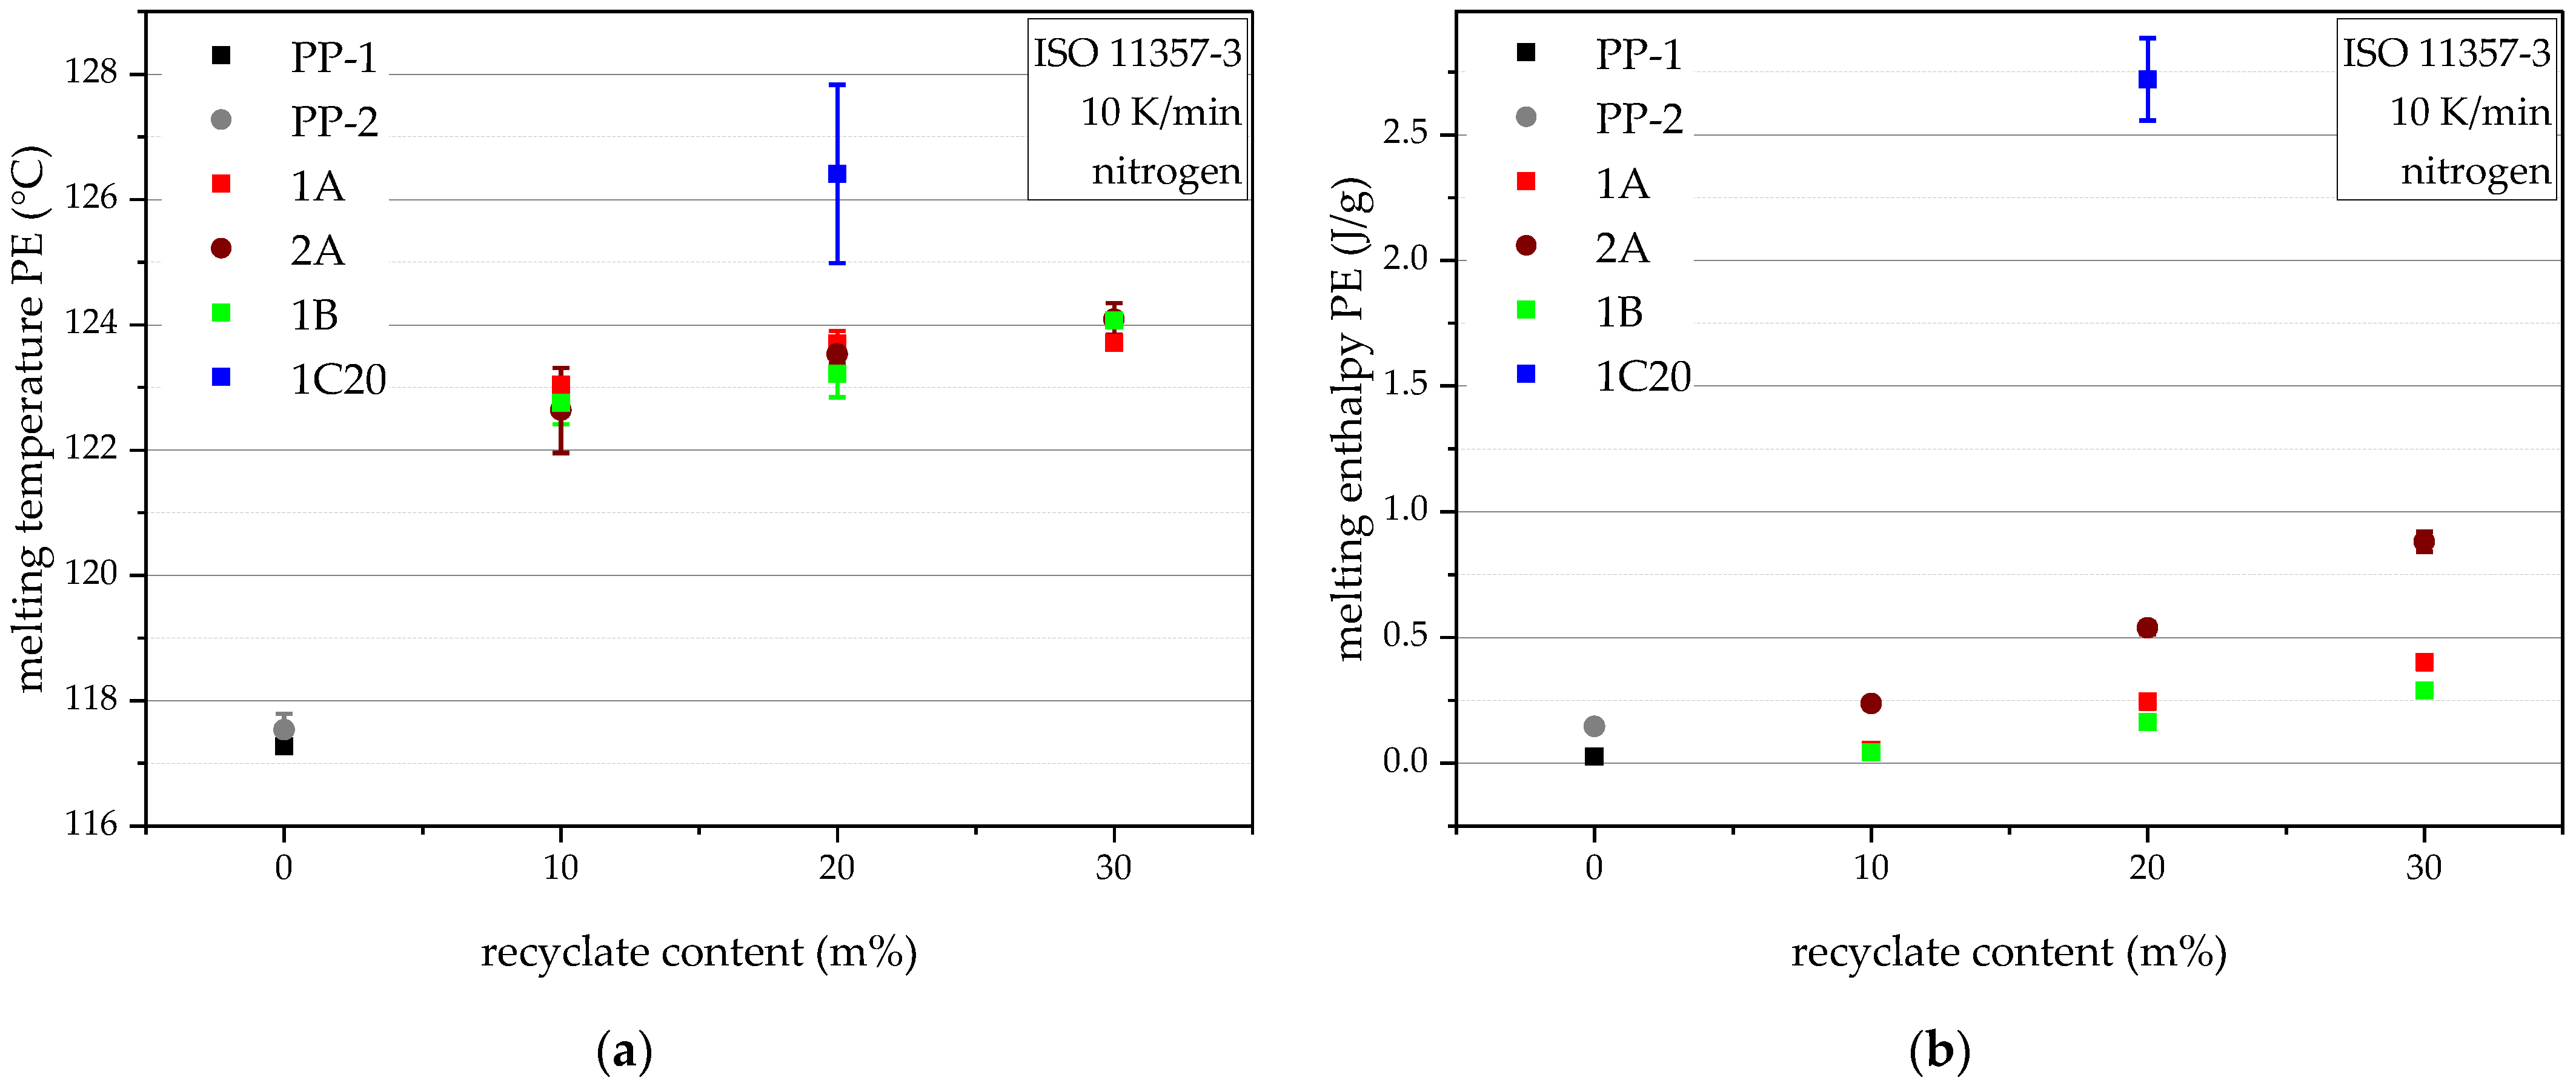
4.4. Melting Behaviour
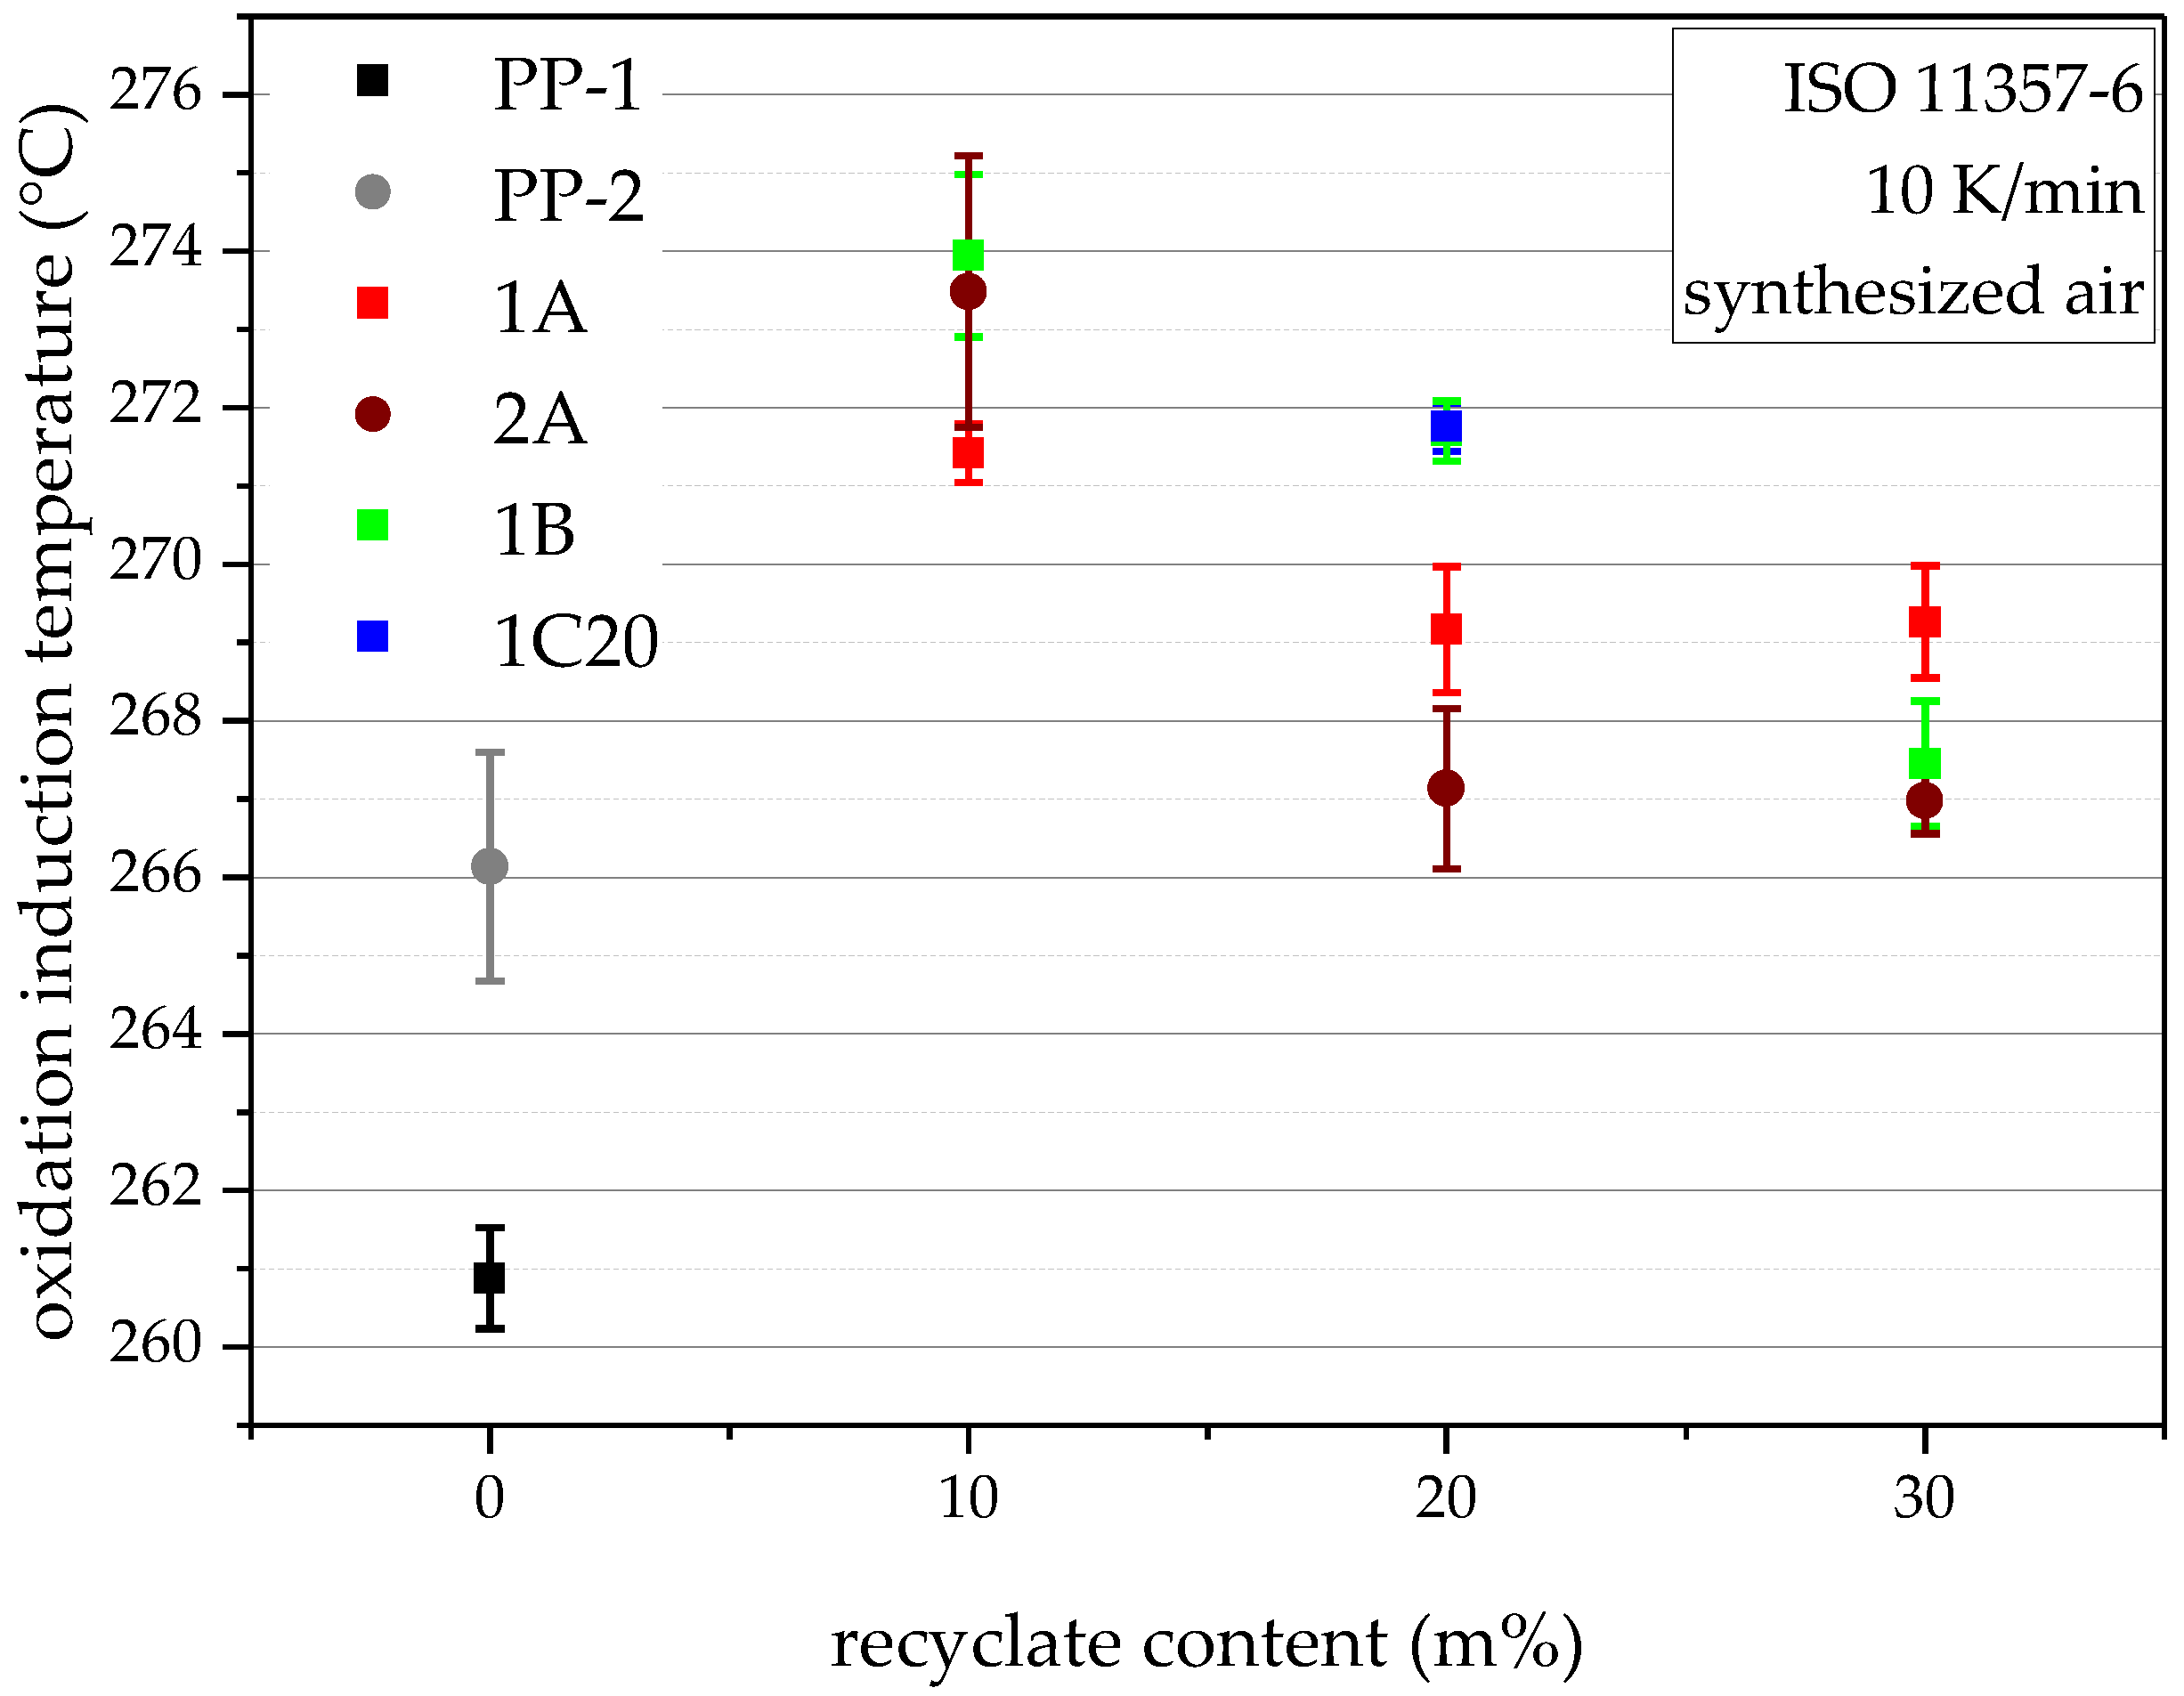
4.5. Oxidation Induction Temperature (Dynamic OIT)
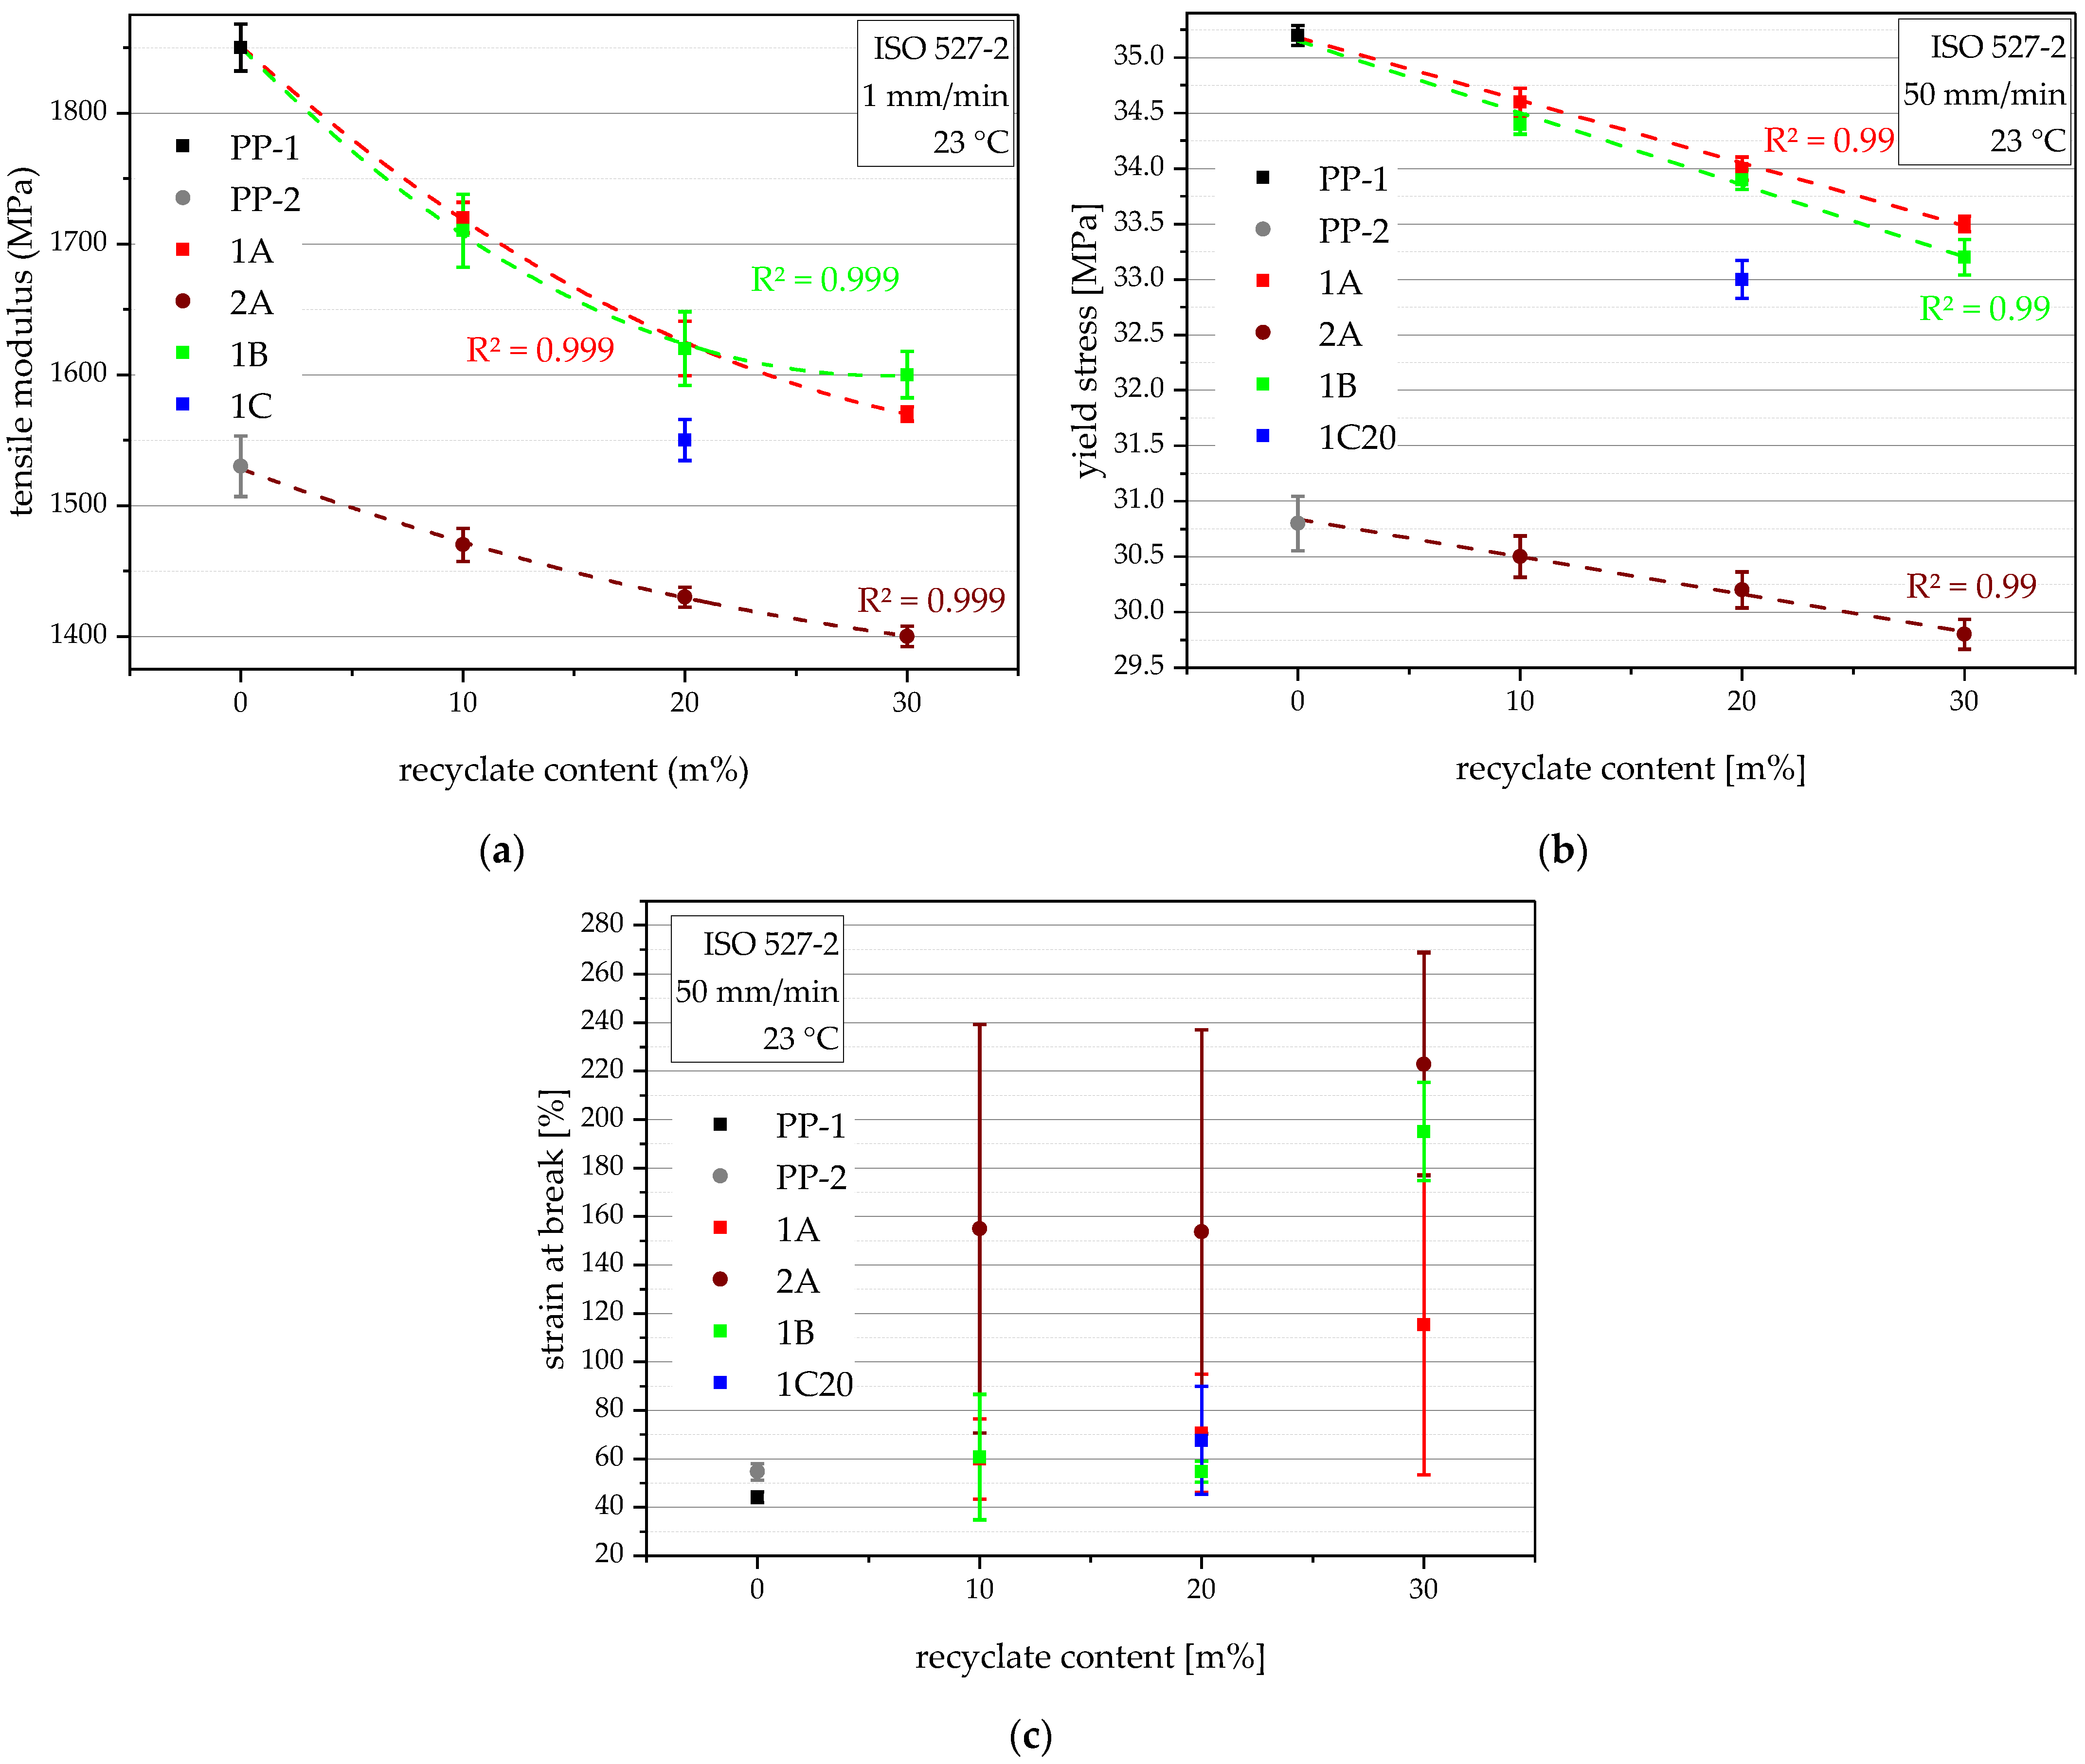
4.6. Tensile Properties
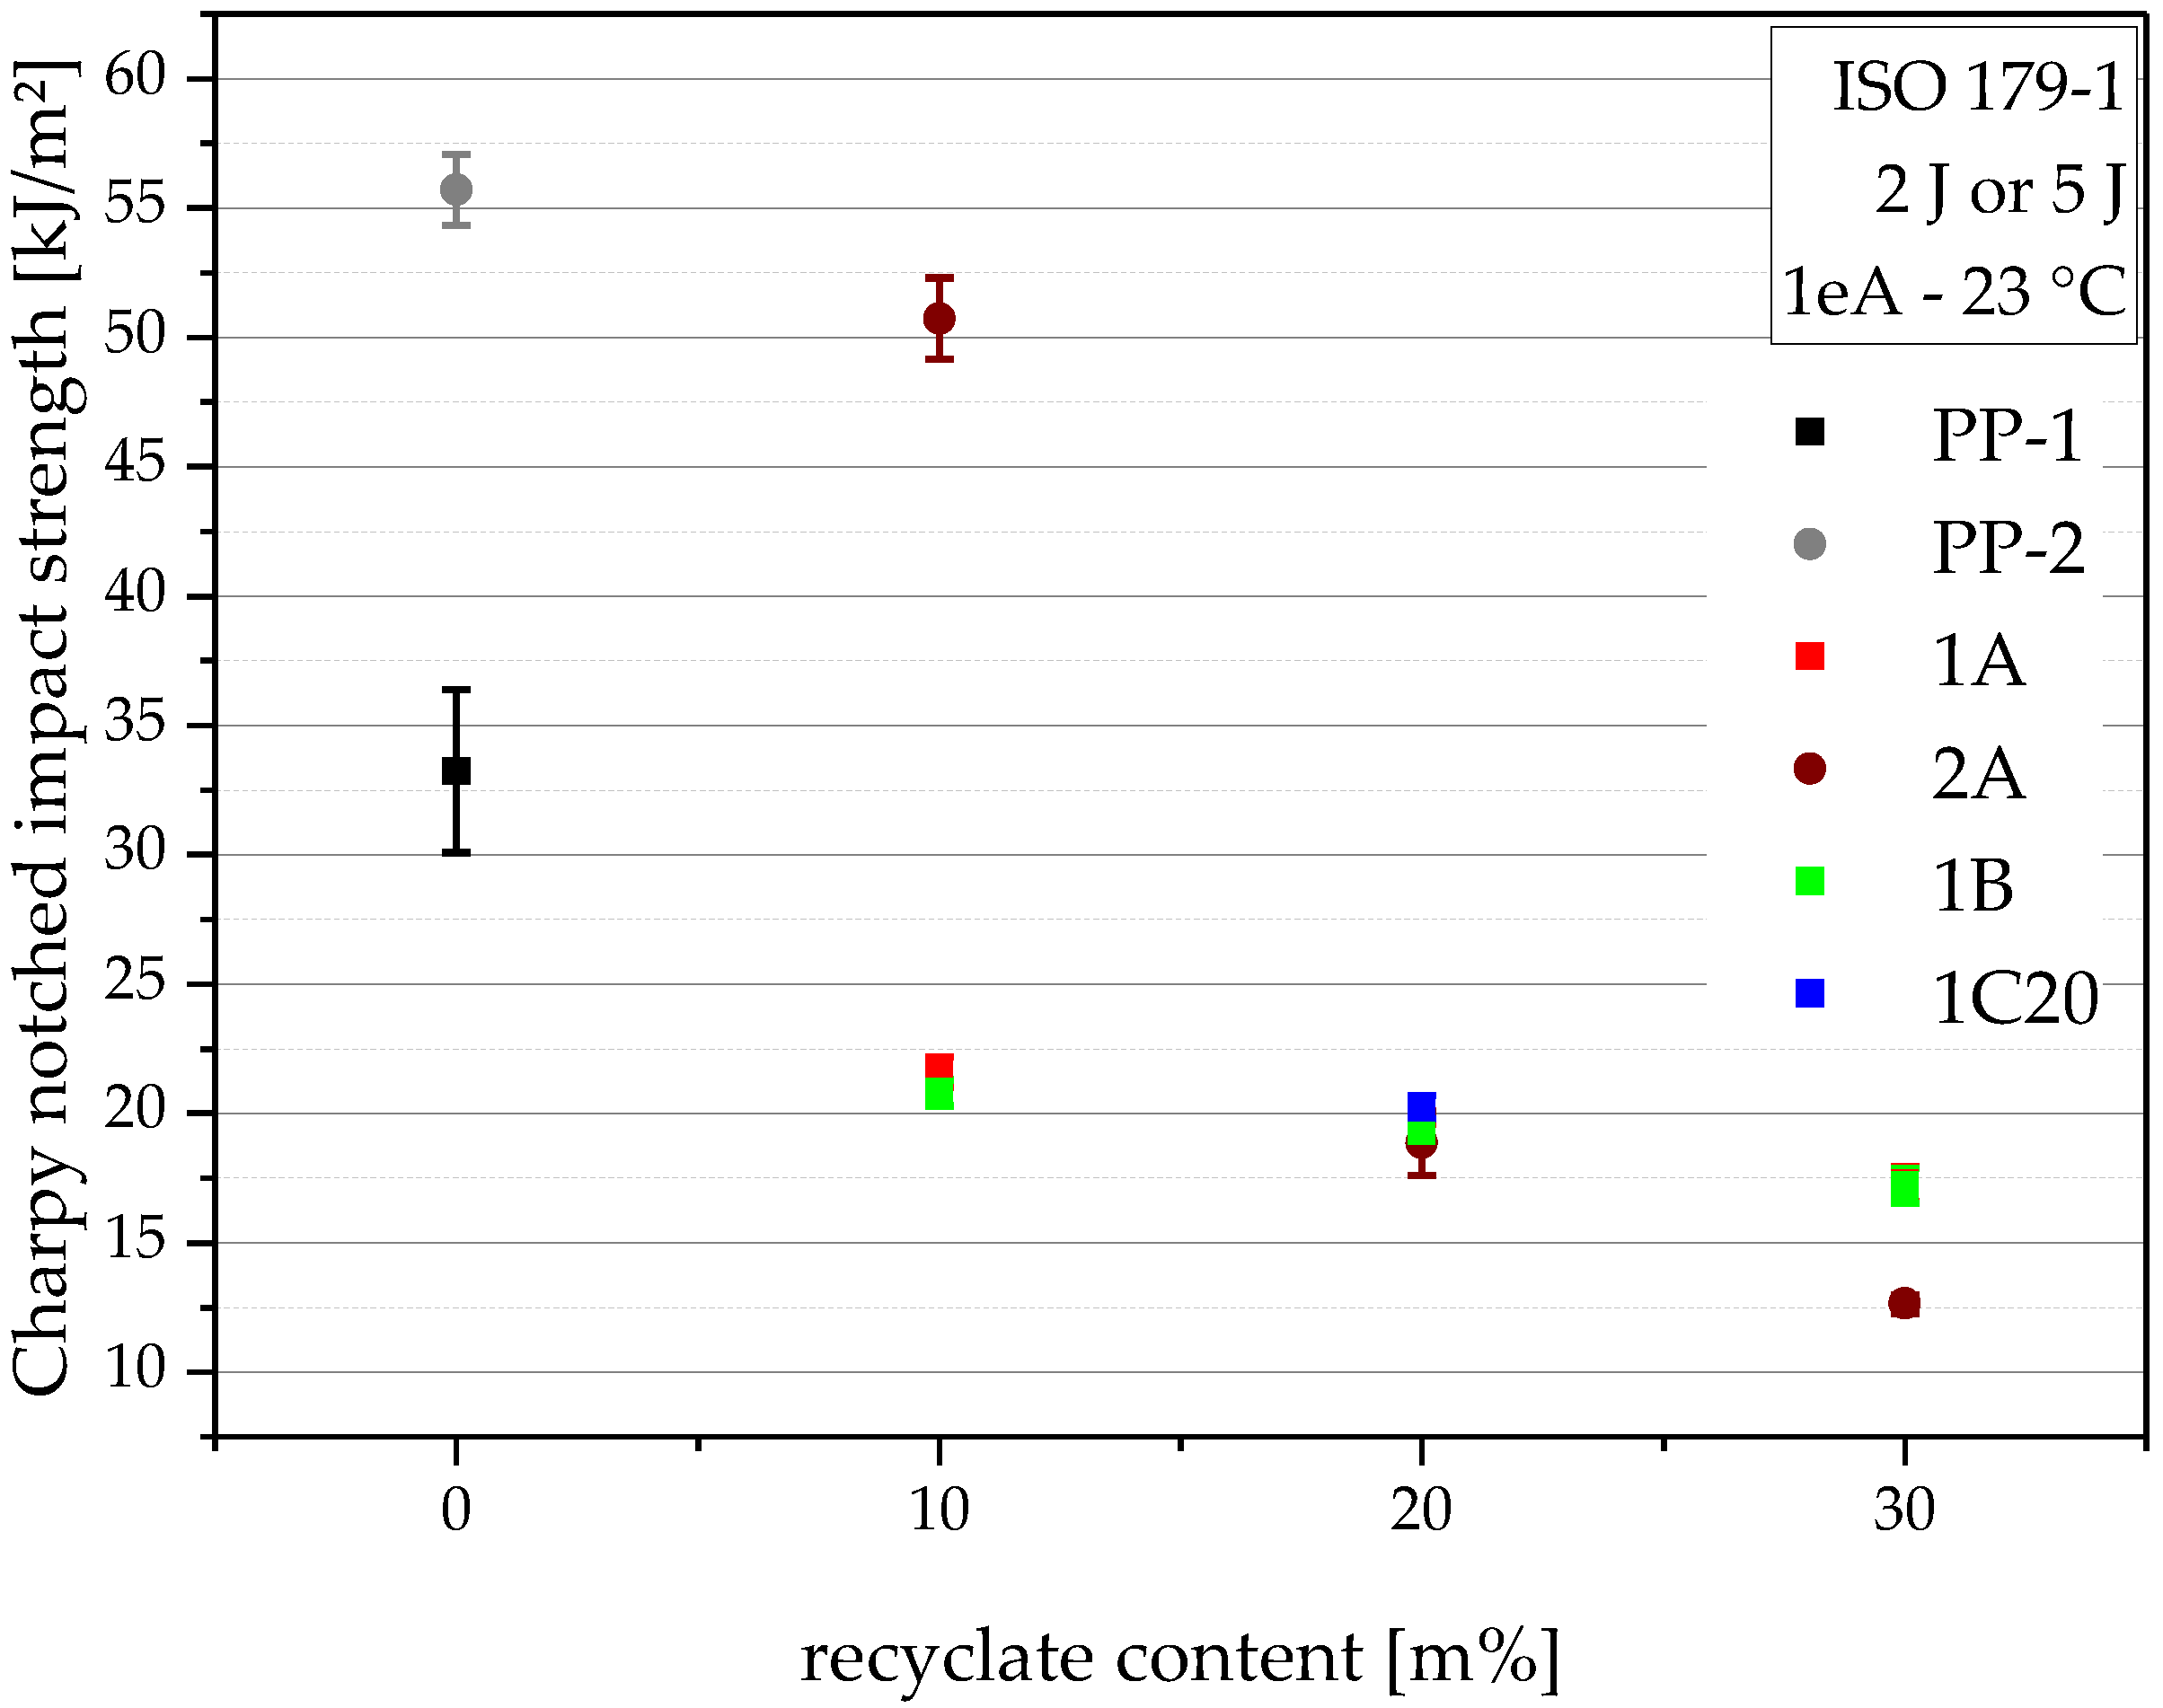
4.7. Charpy Notched Impact Strength
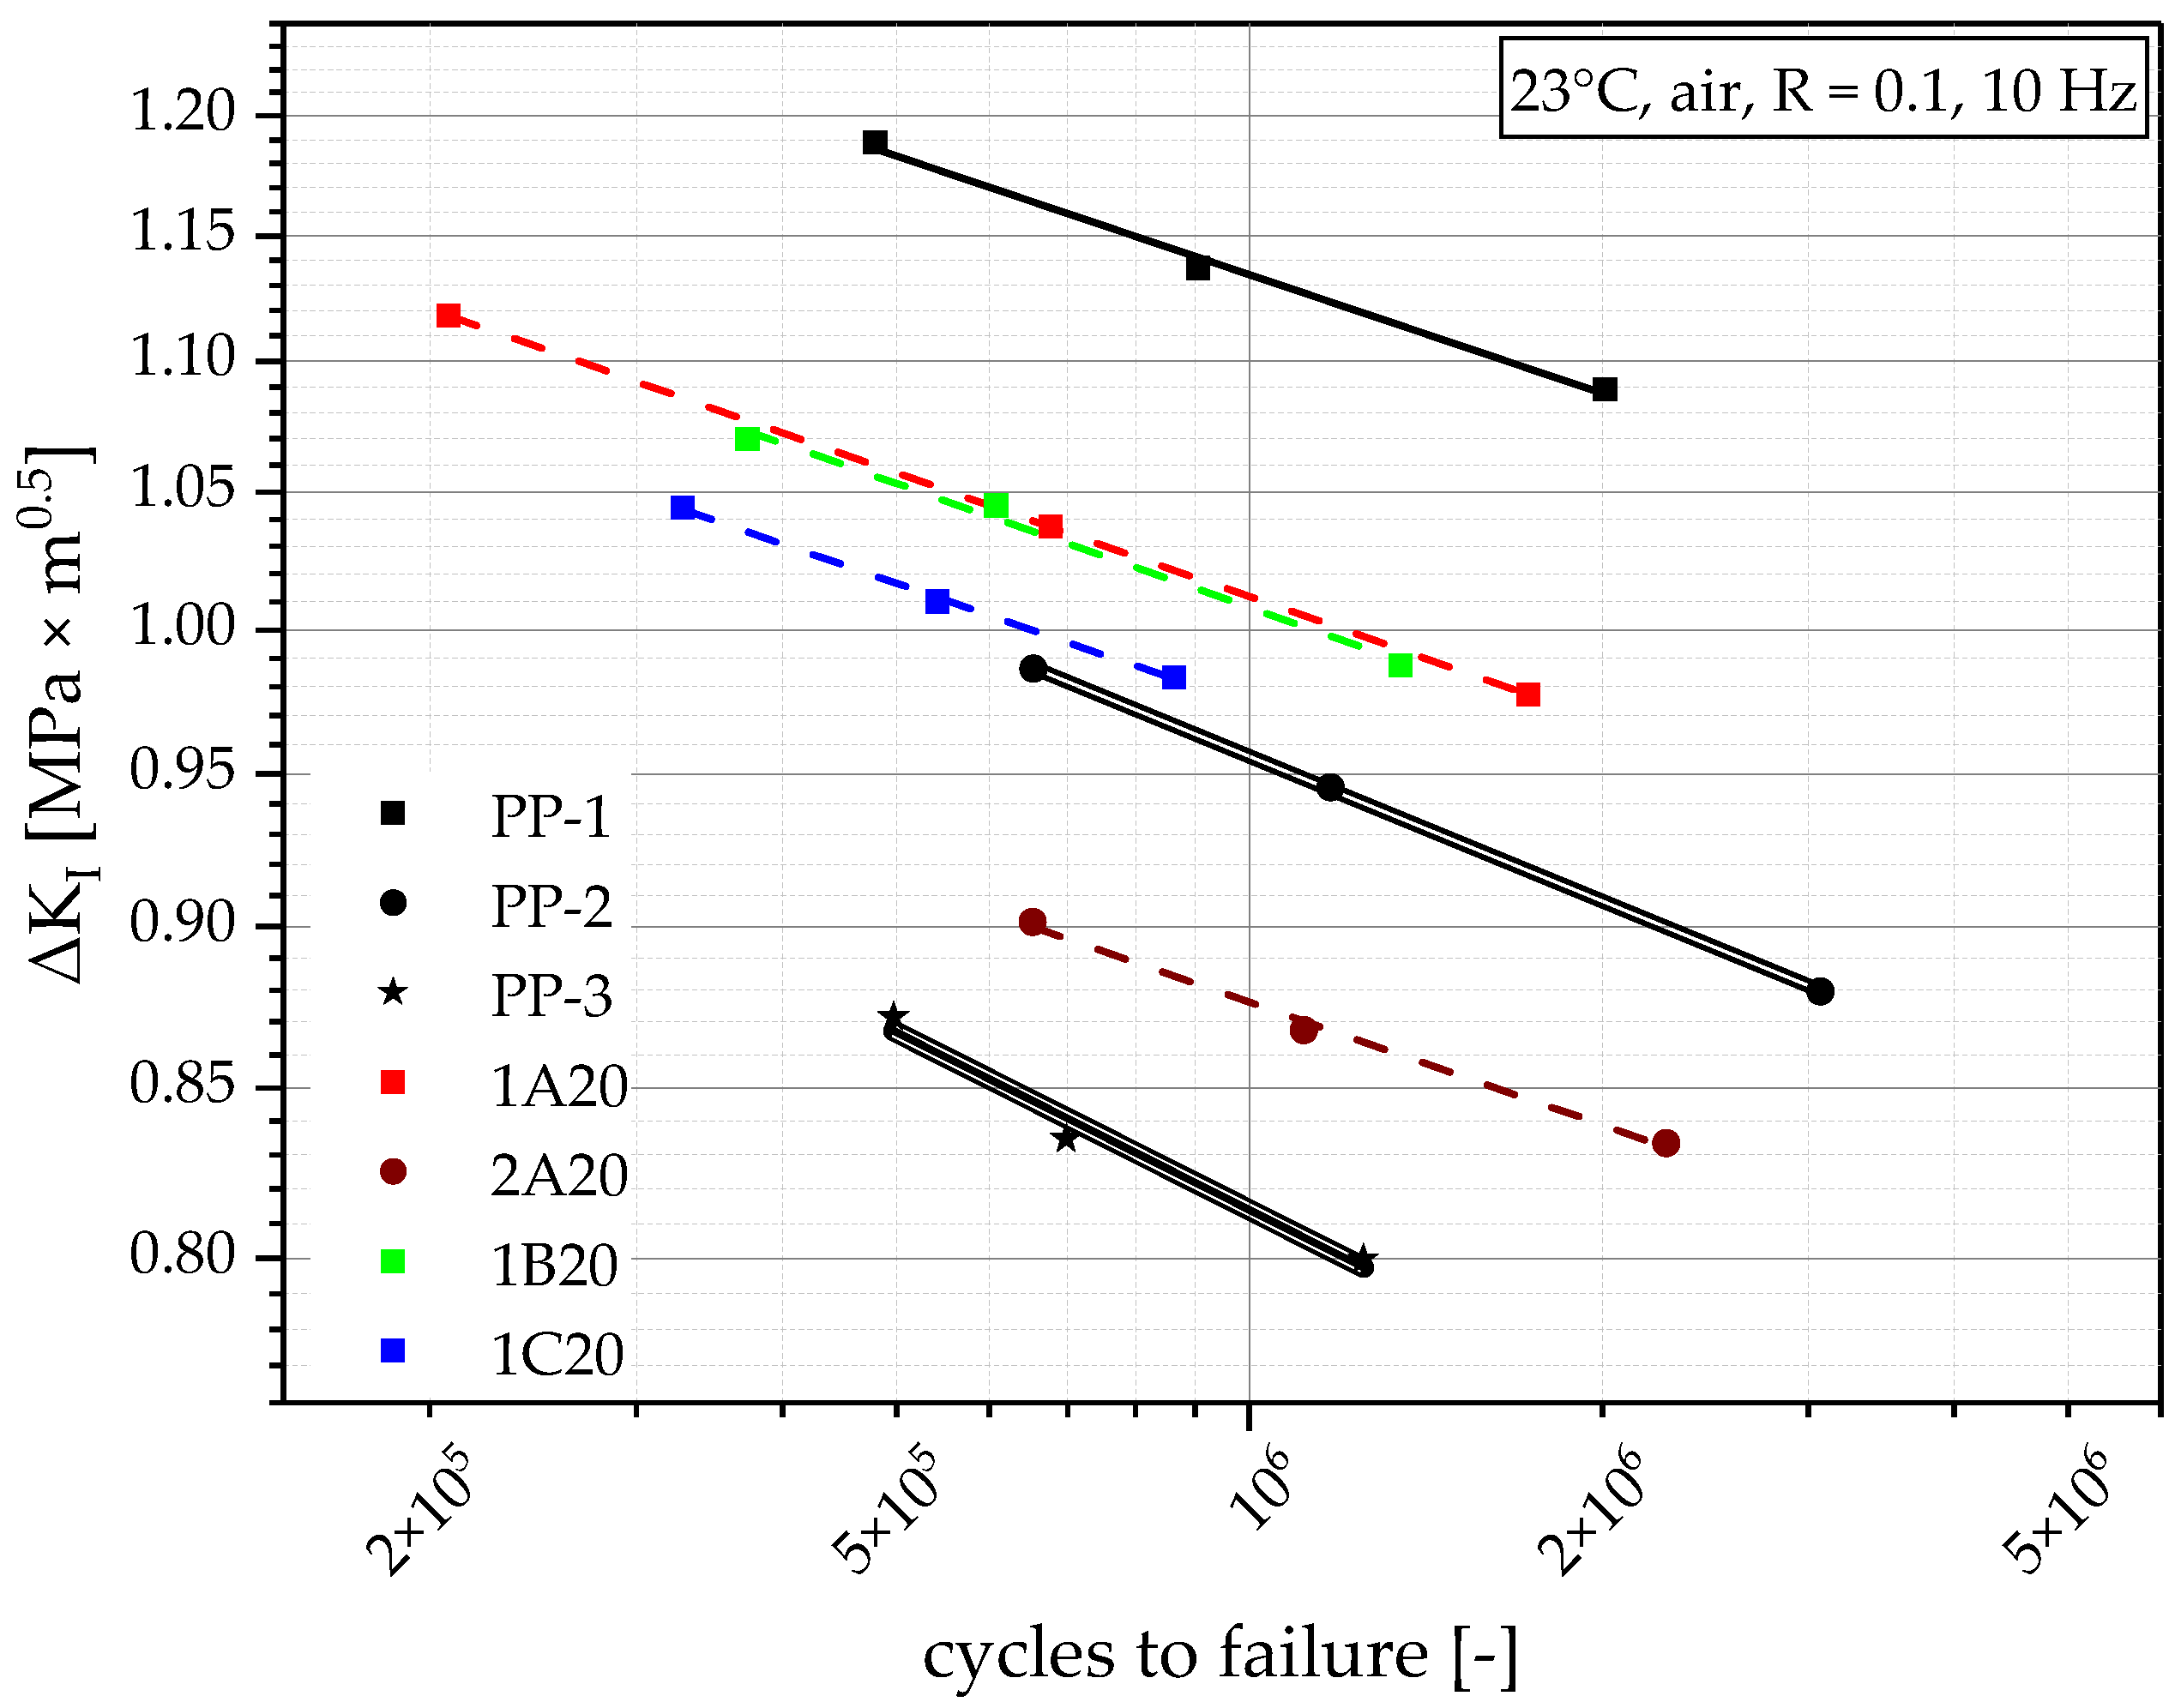
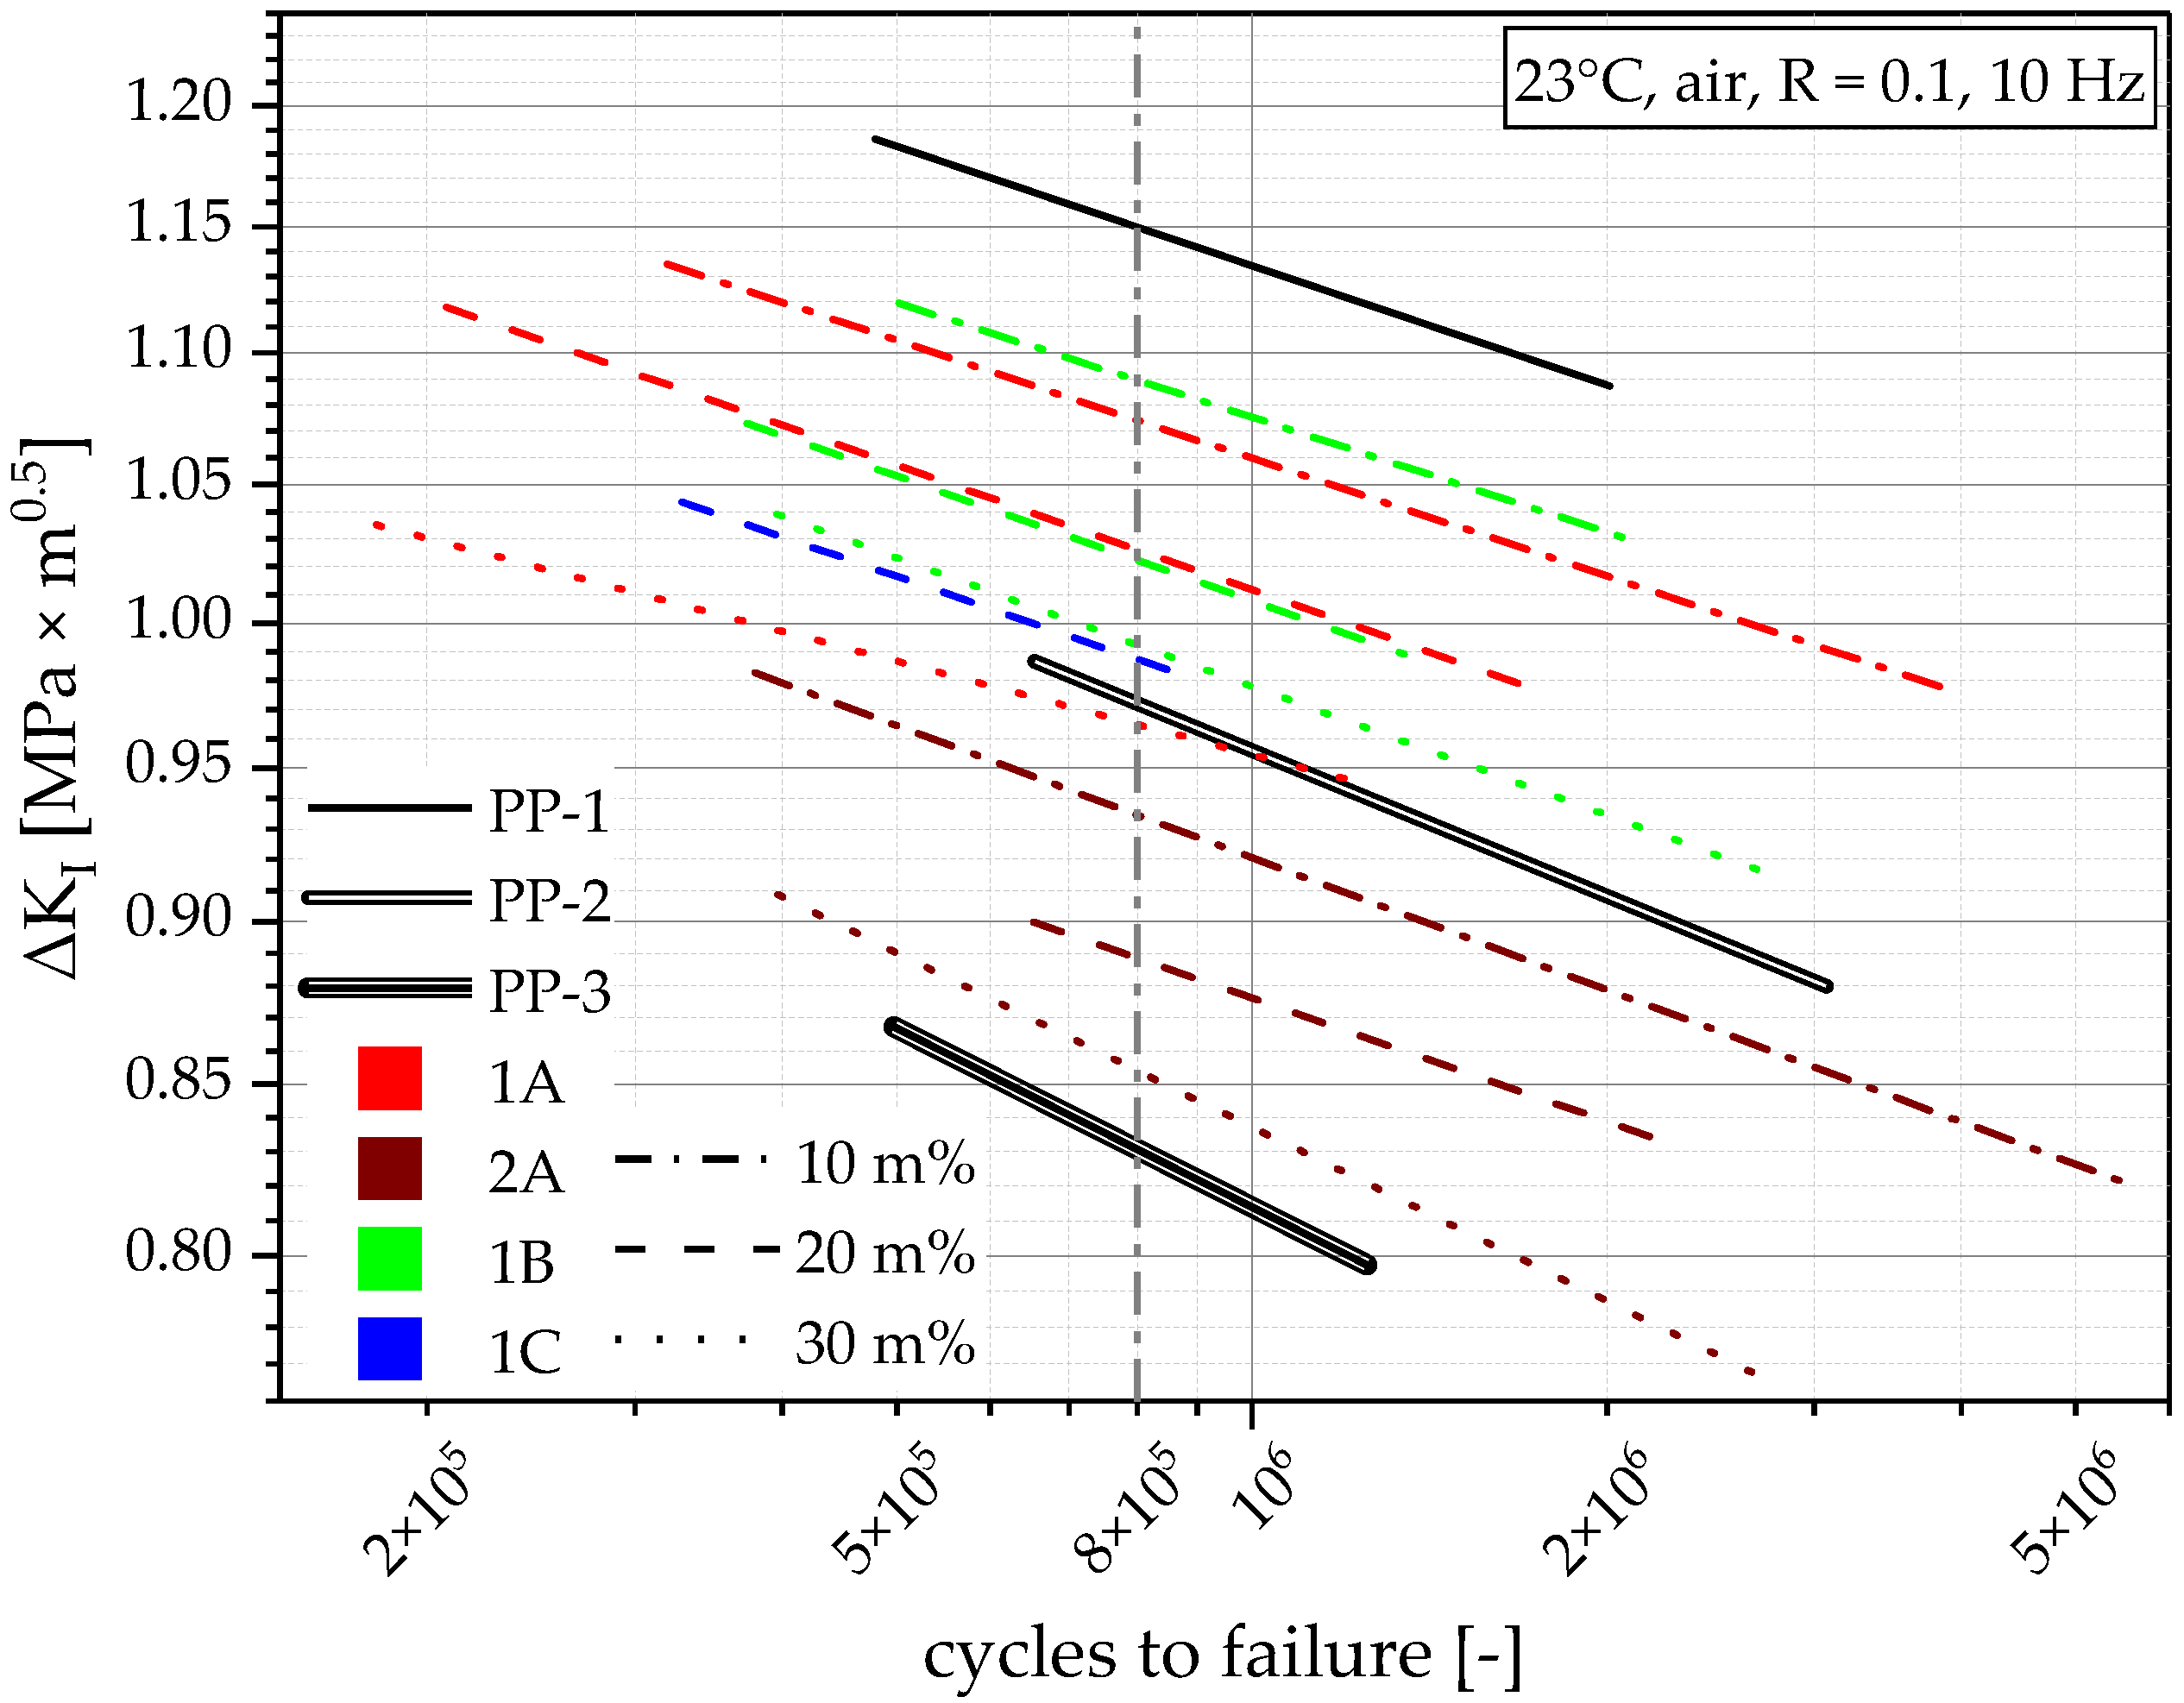
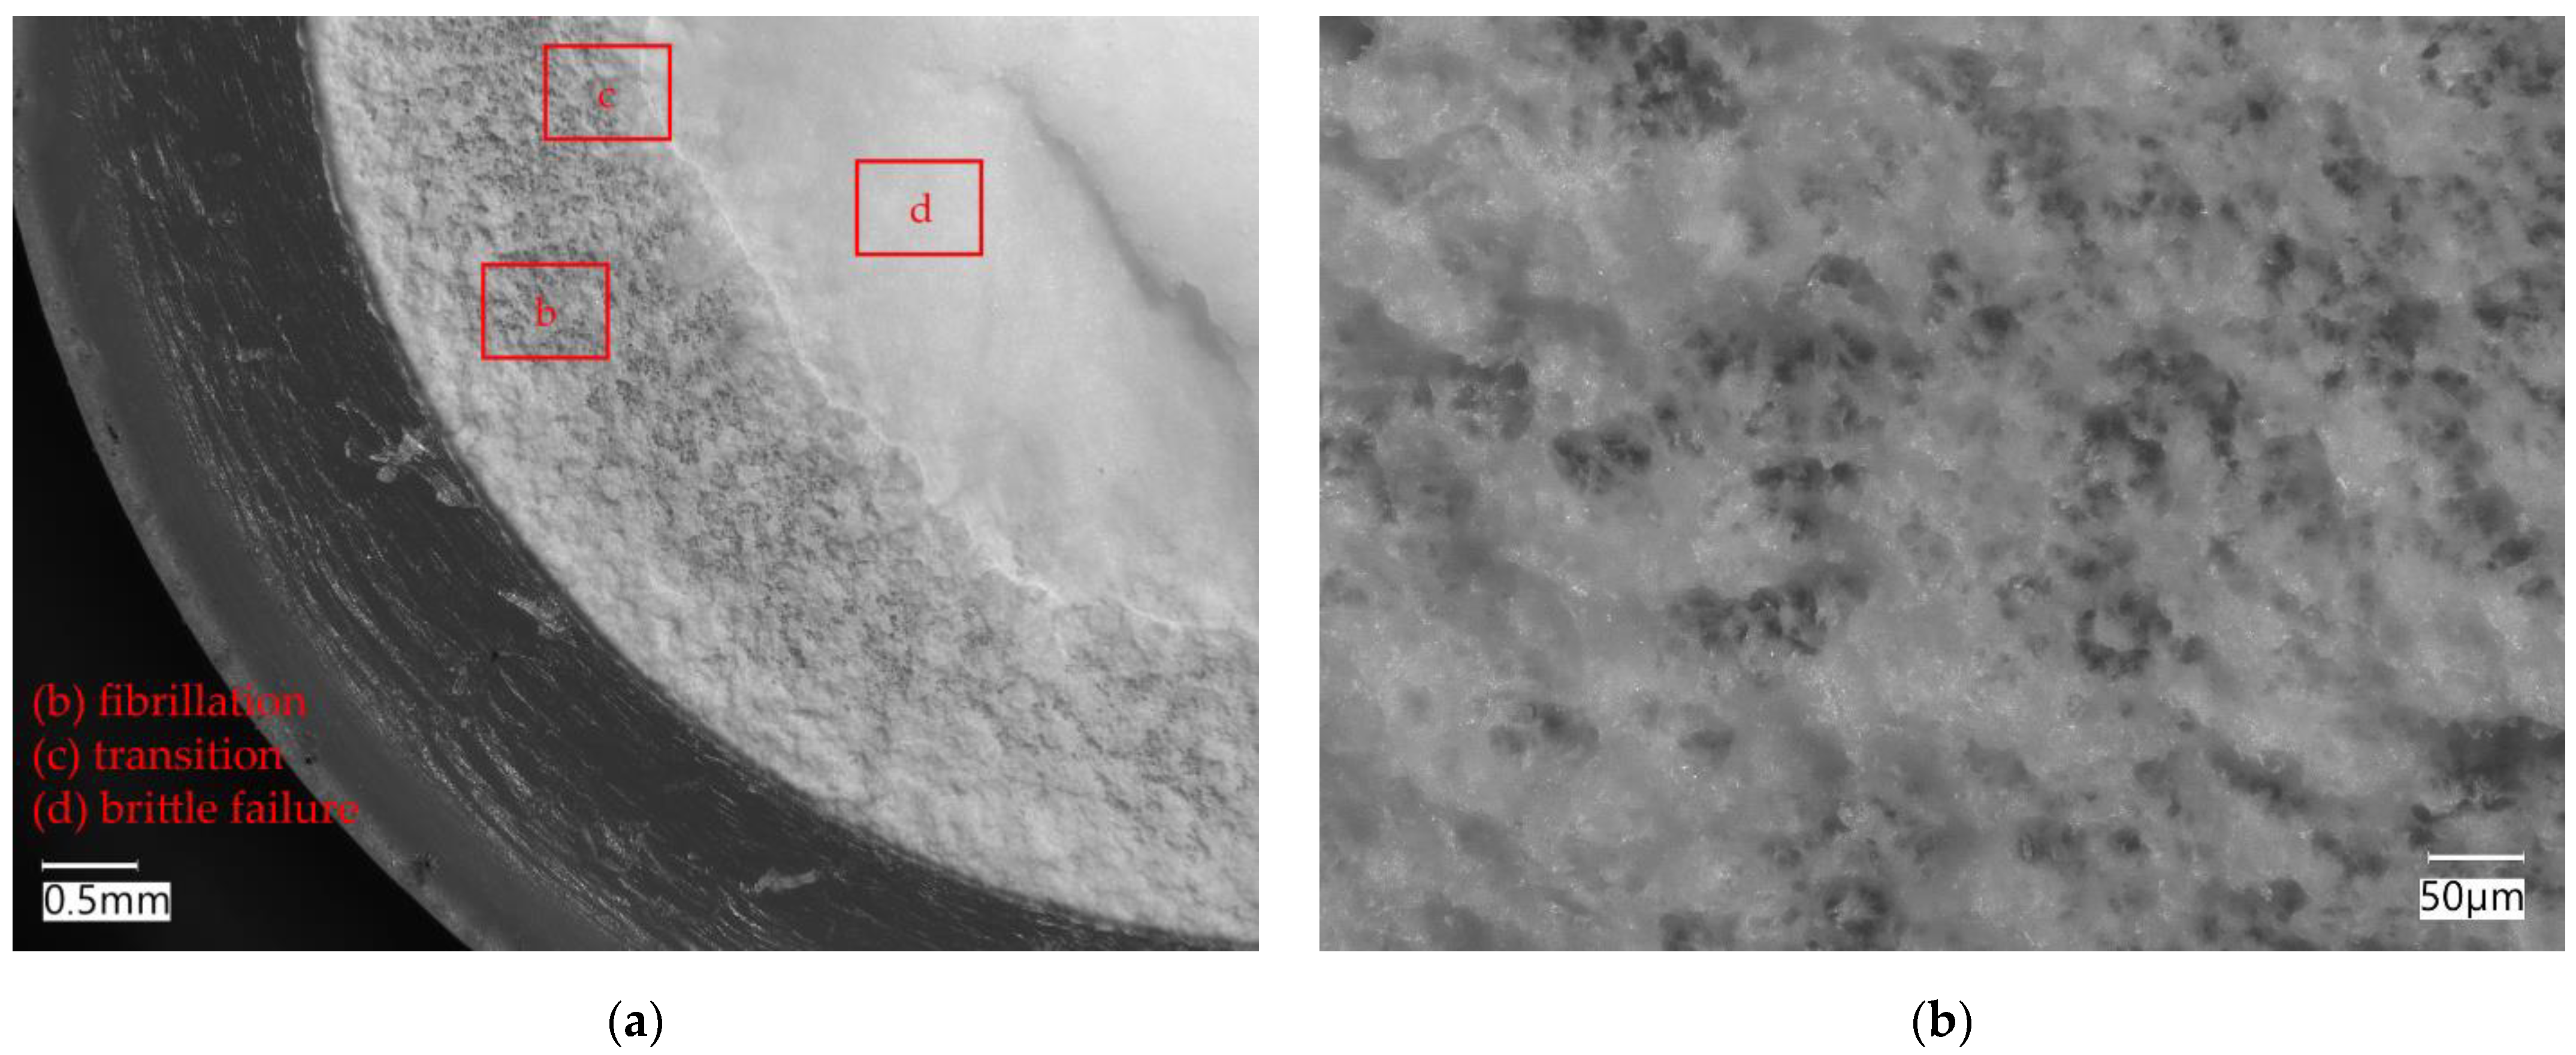
4.8. Fatigue Crack Growth Resistance
5. Discussion
6. Conclusions
Author Contributions
Funding
Data Availability Statement
Acknowledgments
Conflicts of Interest
References
- European Commission. A European Strategy for Plastics in a Circular Economy. Available online: https://eur-lex.europa.eu/legal-content/EN/TXT/?uri=COM:2018:28:FIN (accessed on 17 June 2022).
- European Parliament; Council of the European Union. Directive (EU) 2018/852 of the European Parliament and of the Council of 30 May 2018 Amending Directive 94/62/EC on Packaging and Packaging Waste: PE/12/2018/REV/2. Available online: https://eur-lex.europa.eu/eli/dir/2018/852/oj (accessed on 12 April 2022).
- European Parliament; Council of the European Union. Directive (EU) 2019/904 of the European Parliament and of the Council of 5 June 2019 on the Reduction of the Impact of Certain Plastic Products on the Environment: PE/11/2019/REV/1. Available online: https://eur-lex.europa.eu/eli/dir/2019/904/oj (accessed on 12 April 2022).
- CEN/TC 155 Plastics Piping Systems and Ducting Systems. In EN 1451-1:2017+AC:2018 Plastics Piping Systems for Soil and Waste Discharge (Low and High Temperature) within the Building Structure—Polypropylene (PP)—Part 1: Specifications for Pipes, Fittings and the System. 2018. Available online: https://www.beuth.de/de/norm/din-en-1451-1/294015109 (accessed on 26 November 2022).
- CEN/TC 155 Plastics Piping Systems and Ducting Systems. In EN 1852-1:2018 Plastics Piping Systems for Non-Pressure Underground Drainage and Sewerage—Polypropylene (PP)-Part 1: Specifications for Pipes, Fittings and the System. 2018. Available online: https://www.beuth.de/de/norm/din-en-1852-1/275834832 (accessed on 26 November 2022).
- CEN/TC 155 Plastics Piping Systems and Ducting Systems. In EN 13476-2:2018+A1:2020 Plastics Piping Systems for Non-Pressure Underground Drainage and Sewerage—Structured-Wall Piping Systems of Unplasticized Poly(vinyl Chloride) (PVC-U), Polypropylene (PP) and Polyethylene (PE)—Part 2: Specifications for Pipes and Fittings with Smooth Internal and External Surface and the System. 2020. Available online: https://www.beuth.de/de/norm/din-en-13476-2/323976389 (accessed on 26 November 2022).
- CEN/TC 155 Plastics Piping Systems and Ducting Systems. In EN 13476-3:2018+A1:2020 Plastics Piping Systems for Non-Pressure Underground Drainage and Sewerage—Structured-Wall Piping Systems of Unplasticized Poly(vinyl Chloride) (PVC-U), Polypropylene (PP) and Polyethylene (PE)—Part 3: Specifications for Pipes and Fittings with Smooth Internal and Profiled External Surface and the System. 2020. Available online: https://www.beuth.de/de/norm/din-en-13476-3/323982142 (accessed on 26 November 2022).
- ISO/TC 61/SC 5 Physical-Chemical Properties. In ISO 1133-1:2011 Plastics—Determination of the Melt Mass-Flow Rate (MFR) and Melt Volume-Flow Rate (MVR) of Thermoplastics—Part 1: Standard Method, 1st ed.; 2011; Available online: https://www.iso.org/standard/44273.html (accessed on 10 March 2022).
- ISO/TC 61/SC 5 Physical-Chemical Properties. In ISO 11357-6:2018 Plastics—Differential Scanning Calorimetry (DSC)—Part 6: Determination of Oxidation Induction Time (Isothermal OIT) and Oxidation Induction Temperature (Dynamic OIT), 3rd ed.; 2018; Available online: https://www.iso.org/standard/72461.html (accessed on 2 August 2022).
- ISO/TC 138/SC 5. In ISO 1167-1:2006 Thermoplastics Pipes, Fittings and Assemblies for the Conveyance of Fluids—Determination of the Resistance to Internal Pressure—Part 1: General Method, 1st ed.; 2006; Available online: https://www.iso.org/standard/33981.html (accessed on 2 August 2022).
- ISO/TC 138/SC 5 General Properties of Pipes, Fittings and Valves of Plastic Materials and Their Accessories—Test Methods and Basic Specifications. In ISO 9969:2016 Thermoplastics Pipes—Determination of Ring Stiffness, 3rd ed.; 2016; Available online: https://www.iso.org/standard/62370.html (accessed on 2 August 2022).
- ISO/TC 138/SC 5 General Properties of Pipes, Fittings and Valves of Plastic Materials and Their Accessories—Test Methods and Basic Specifications. In ISO 3127:1994 Thermoplastics Pipes—Determination of Resistance to External blows—Round-the-Clock Method, 2nd ed.; 1994; Available online: https://www.iso.org/standard/8285.html (accessed on 2 August 2022).
- ISO/TC 138/SC 5 General Properties of Pipes, Fittings and Valves of Plastic Materials and Their Accessories—Test Methods and Basic Specifications. In ISO 13968:2008 Plastics Piping and Ducting Systems—Thermoplastics Pipes—Determination of Ring Flexibility, 2nd ed.; 2008; Available online: https://www.iso.org/standard/43866.html (accessed on 2 August 2022).
- ISO/TC 61/SC 2 Mechanical Behavior. In ISO 527-1:2019 Plastics—Determination of Tensile Properties—Part 1: General Principles, 3rd ed.; 2019; Available online: https://www.iso.org/standard/75824.html (accessed on 2 August 2022).
- ISO/TC 61/SC 2 Mechanical Behavior. In ISO 179-1:2010 Plastics—Determination of Charpy Impact Properties—Part 1: Non-Instrumented Impact Test, 2nd ed.; 2010; Available online: https://www.iso.org/standard/44852.html (accessed on 2 August 2022).
- ISO/TC 138/SC 5 General Properties of Pipes, Fittings and Valves of Plastic Materials and Their Accessories—Test Methods and Basic Specifications. In ISO 18489:2015 Polyethylene (PE) Materials for Piping Systems—Determination of Resistance to Slow Crack Growth under Cyclic Loading—Cracked Round Bar Test Method, 1st ed.; ISO, 2016; Available online: https://www.iso.org/standard/62593.html (accessed on 2 August 2022).
- Juan, R.; Domínguez, C.; Robledo, N.; Paredes, B.; García-Muñoz, R.A. Incorporation of recycled high-density polyethylene to polyethylene pipe grade resins to increase close-loop recycling and Underpin the circular economy. J. Clean. Prod. 2020, 276, 124081. [Google Scholar] [CrossRef]
- Freudenthaler, P.J.; Fischer, J.; Liu, Y.; Lang, R.W. Short- and Long-Term Performance of Pipe Compounds Containing Polyethylene Post-Consumer Recyclates from Packaging Waste. Polymers 2022, 14, 1581. [Google Scholar] [CrossRef] [PubMed]
- Umweltbundesamt: Präsidialbereich/Presse- und Öffentlichkeitsarbeit, Internet. Verpackungen. Available online: https://www.umweltbundesamt.de/themen/abfall-ressourcen/produktverantwortung-in-der-abfallwirtschaft/verpackungen#undefined (accessed on 15 February 2022).
- SpecialChem, S.A. Irganox® 1010 Technical Datasheet Supplied by BASF. Available online: https://polymer-additives.specialchem.com/product/a-basf-irganox-1010#related-documents (accessed on 11 May 2022).
- SpecialChem, S.A. Irgafos® 168 Technical Datasheet Supplied by BASF. Available online: https://polymer-additives.specialchem.com/product/a-basf-irgafos-168#related-documents (accessed on 11 May 2022).
- ISO/TC 61/SC 9 Thermoplastic Materials. In ISO 19069-2:2016 Plastics—Polypropylene (PP) Moulding and Extrusion Materials—Part 2: Preparation of Test Specimens and Determination of Properties, 1st ed.; 2016; Available online: https://www.iso.org/standard/66828.html (accessed on 2 August 2022).
- ISO/TC 61/SC 2 Mechanical Behavior. In ISO 3167:2014 Plastics—Multipurpose Test Specimens, 5th ed.; 2014; Available online: https://www.iso.org/standard/65105.html (accessed on 2 August 2022).
- ISO/TC 61/SC 5 Physical-Chemical Properties. In ISO 1183-1:2019 Plastics—Methods for Determining the Density of Non-Cellular Plastics—Part 1: Immersion Method, Liquid Pycnometer Method and Titration Method, 3rd ed.; 2019; Available online: https://www.iso.org/standard/74990.html (accessed on 2 August 2022).
- ISO/TC 61/SC 5 Physical-Chemical Properties. In ISO 11357-1:2016 Plastics—Differential Scanning Calorimetry (DSC)—Part 1: General Principles, 3rd ed.; 2016; Available online: https://www.iso.org/standard/70024.html (accessed on 2 August 2022).
- ISO/TC 61/SC 5 Physical-Chemical Properties. In ISO 11357-3:2018 Plastics—Differential Scanning Calorimetry (DSC)—Part 3: Determination of Temperature and Enthalpy of Melting and Crystallization, 3rd ed.; 2018; Available online: https://www.iso.org/standard/72460.html (accessed on 2 August 2022).
- Fischer, J.; Freudenthaler, P.J.; Lang, R.W.; Buchberger, W.; Mantell, S.C. Chlorinated Water Induced Aging of Pipe Grade Polypropylene Random Copolymers. Polymers 2019, 11, 996. [Google Scholar] [CrossRef] [Green Version]
- Fischer, J.; Lang, R.W.; Bradler, P.R.; Freudenthaler, P.J.; Buchberger, W.; Mantell, S.C. Global and Local Aging in Differently Stabilized Polypropylenes Exposed to Hot Chlorinated Water with and without Superimposed Mechanical-Environmental Loads. Polymers 2019, 11, 1165. [Google Scholar] [CrossRef] [Green Version]
- ISO/TC 61/SC 2 Mechanical Behavior. In ISO 527-2:2012 Plastics—Determination of Tensile Properties—Part 2: Test Conditions for Moulding and Extrusion Plastics, 2nd ed.; 2012; Available online: https://www.iso.org/standard/56046.html (accessed on 2 August 2022).
- Arbeiter, F.; Pinter, G.; Frank, A. Characterisation of quasi-brittle fatigue crack growth in pipe grade polypropylene block copolymer. Polym. Test. 2014, 37, 186–192. [Google Scholar] [CrossRef]
- Arbeiter, F.; Schrittesser, B.; Frank, A.; Berer, M.; Pinter, G. Cyclic tests on cracked round bars as a quick tool to assess the long term behaviour of thermoplastics and elastomers. Polym. Test. 2015, 45, 83–92. [Google Scholar] [CrossRef]
- Benthem, J.P.; Koiter, W.T. Asymptotic approximations to crack problems. In Methods of Analysis and Solutions of Crack Problems: Recent Developments in Fracture Mechanics Theory and Methods of Solving Crack Problems; Sih, G.C., Ed.; Springer: Dordrecht, The Netherlands, 1973; pp. 131–178. ISBN 978-90-481-8246-6. [Google Scholar]
- Hertzberg, R.W.; Vinci, R.P.; Hertzberg, J.L. Deformation and Fracture Mechanics of Engineering Materials, 5th ed.; John Wiley & Sons, Inc.: Hoboken, NJ, USA, 2013; ISBN 9780470527801. [Google Scholar]
- Traxler, I.; Marschik, C.; Farthofer, M.; Laske, S.; Fischer, J. Application of Mixing Rules for Adjusting the Flowability of Virgin and Post-Consumer Polypropylene as an Approach for Design from Recycling. Polymers 2022, 14, 2699. [Google Scholar] [CrossRef]
- Mark, J.E. Physical Properties of Polymers Handbook, 2nd ed.; Springer: New York, NY, USA, 2007; ISBN 978-0-387-31235-4. [Google Scholar]
- Gall, M.; Freudenthaler, P.J.; Fischer, J.; Lang, R.W. Characterization of Composition and Structure–Property Relationships of Commercial Post-Consumer Polyethylene and Polypropylene Recyclates. Polymers 2021, 13, 1574. [Google Scholar] [CrossRef] [PubMed]
- Gahleitner, M.; Paulik, C. Polypropylene and Other Polyolefins. In Brydson’s Plastics Materials; Elsevier: Amsterdam, The Netherlands, 2017; pp. 279–309. [Google Scholar]


| PP-1 | PP-2 | rPP-A | rPP-B | rPO-C | |
|---|---|---|---|---|---|
| m% | m% | m% | m% | m% | |
| 1A10 | 90 | - | 10 | - | - |
| 1A20 | 80 | - | 20 | - | - |
| 1A30 | 70 | - | 30 | - | - |
| 1B10 | 90 | - | - | 10 | - |
| 1B20 | 80 | - | - | 20 | - |
| 1B30 | 70 | - | - | 30 | - |
| 1C20 | 80 | - | - | - | 20 |
| 2A10 | - | 90 | 10 | - | - |
| 2A20 | - | 80 | 20 | - | - |
| 2A30 | - | 70 | 30 | - | - |
| rPP-A | rPP-B | rPO-C | |
|---|---|---|---|
| melt flow rate [g/10 min] | 15.8 ± 0.1 | 13.3 ± 0.3 | 9.1 ± 0.1 |
| tensile modulus [MPa] | 1170 ± 13 | 1320 ± 45 | 1010 ± 0 |
| yield stress [MPa] | 27.2 ± 0.1 | 28.1 ± 0.3 | 22.3 ± 0.1 |
| strain at break [%] | 46.5 ± 15.2 | 38.9 ± 34.4 | 13.7 ± 0.5 |
| Charpy notched impact strength [MPa] | 6.2 ± 0.2 | 6.8 ± 0.3 | 5.5 ± 0.4 |
| oxidation induction temperature [°C] | 209.5 ± 2.5 | 211.6 ± 0.2 | 210.8 ± 0.5 |
Publisher’s Note: MDPI stays neutral with regard to jurisdictional claims in published maps and institutional affiliations. |
© 2022 by the authors. Licensee MDPI, Basel, Switzerland. This article is an open access article distributed under the terms and conditions of the Creative Commons Attribution (CC BY) license (https://creativecommons.org/licenses/by/4.0/).
Share and Cite
Freudenthaler, P.J.; Fischer, J.; Liu, Y.; Lang, R.W. Polypropylene Pipe Compounds with Varying Post-Consumer Packaging Recyclate Content. Polymers 2022, 14, 5232. https://doi.org/10.3390/polym14235232
Freudenthaler PJ, Fischer J, Liu Y, Lang RW. Polypropylene Pipe Compounds with Varying Post-Consumer Packaging Recyclate Content. Polymers. 2022; 14(23):5232. https://doi.org/10.3390/polym14235232
Chicago/Turabian StyleFreudenthaler, Paul J., Joerg Fischer, Yi Liu, and Reinhold W. Lang. 2022. "Polypropylene Pipe Compounds with Varying Post-Consumer Packaging Recyclate Content" Polymers 14, no. 23: 5232. https://doi.org/10.3390/polym14235232