
Enhanced Alkaline Hydrogen Evolution on Gd1.0/Ndx (x = 0.5, 1.0, 3.0, and 6.0%)-Doped TiO2 Bimetallic Electrocatalysts

 ,
,
Abstract
:1. Introduction
2. Results and Discussion
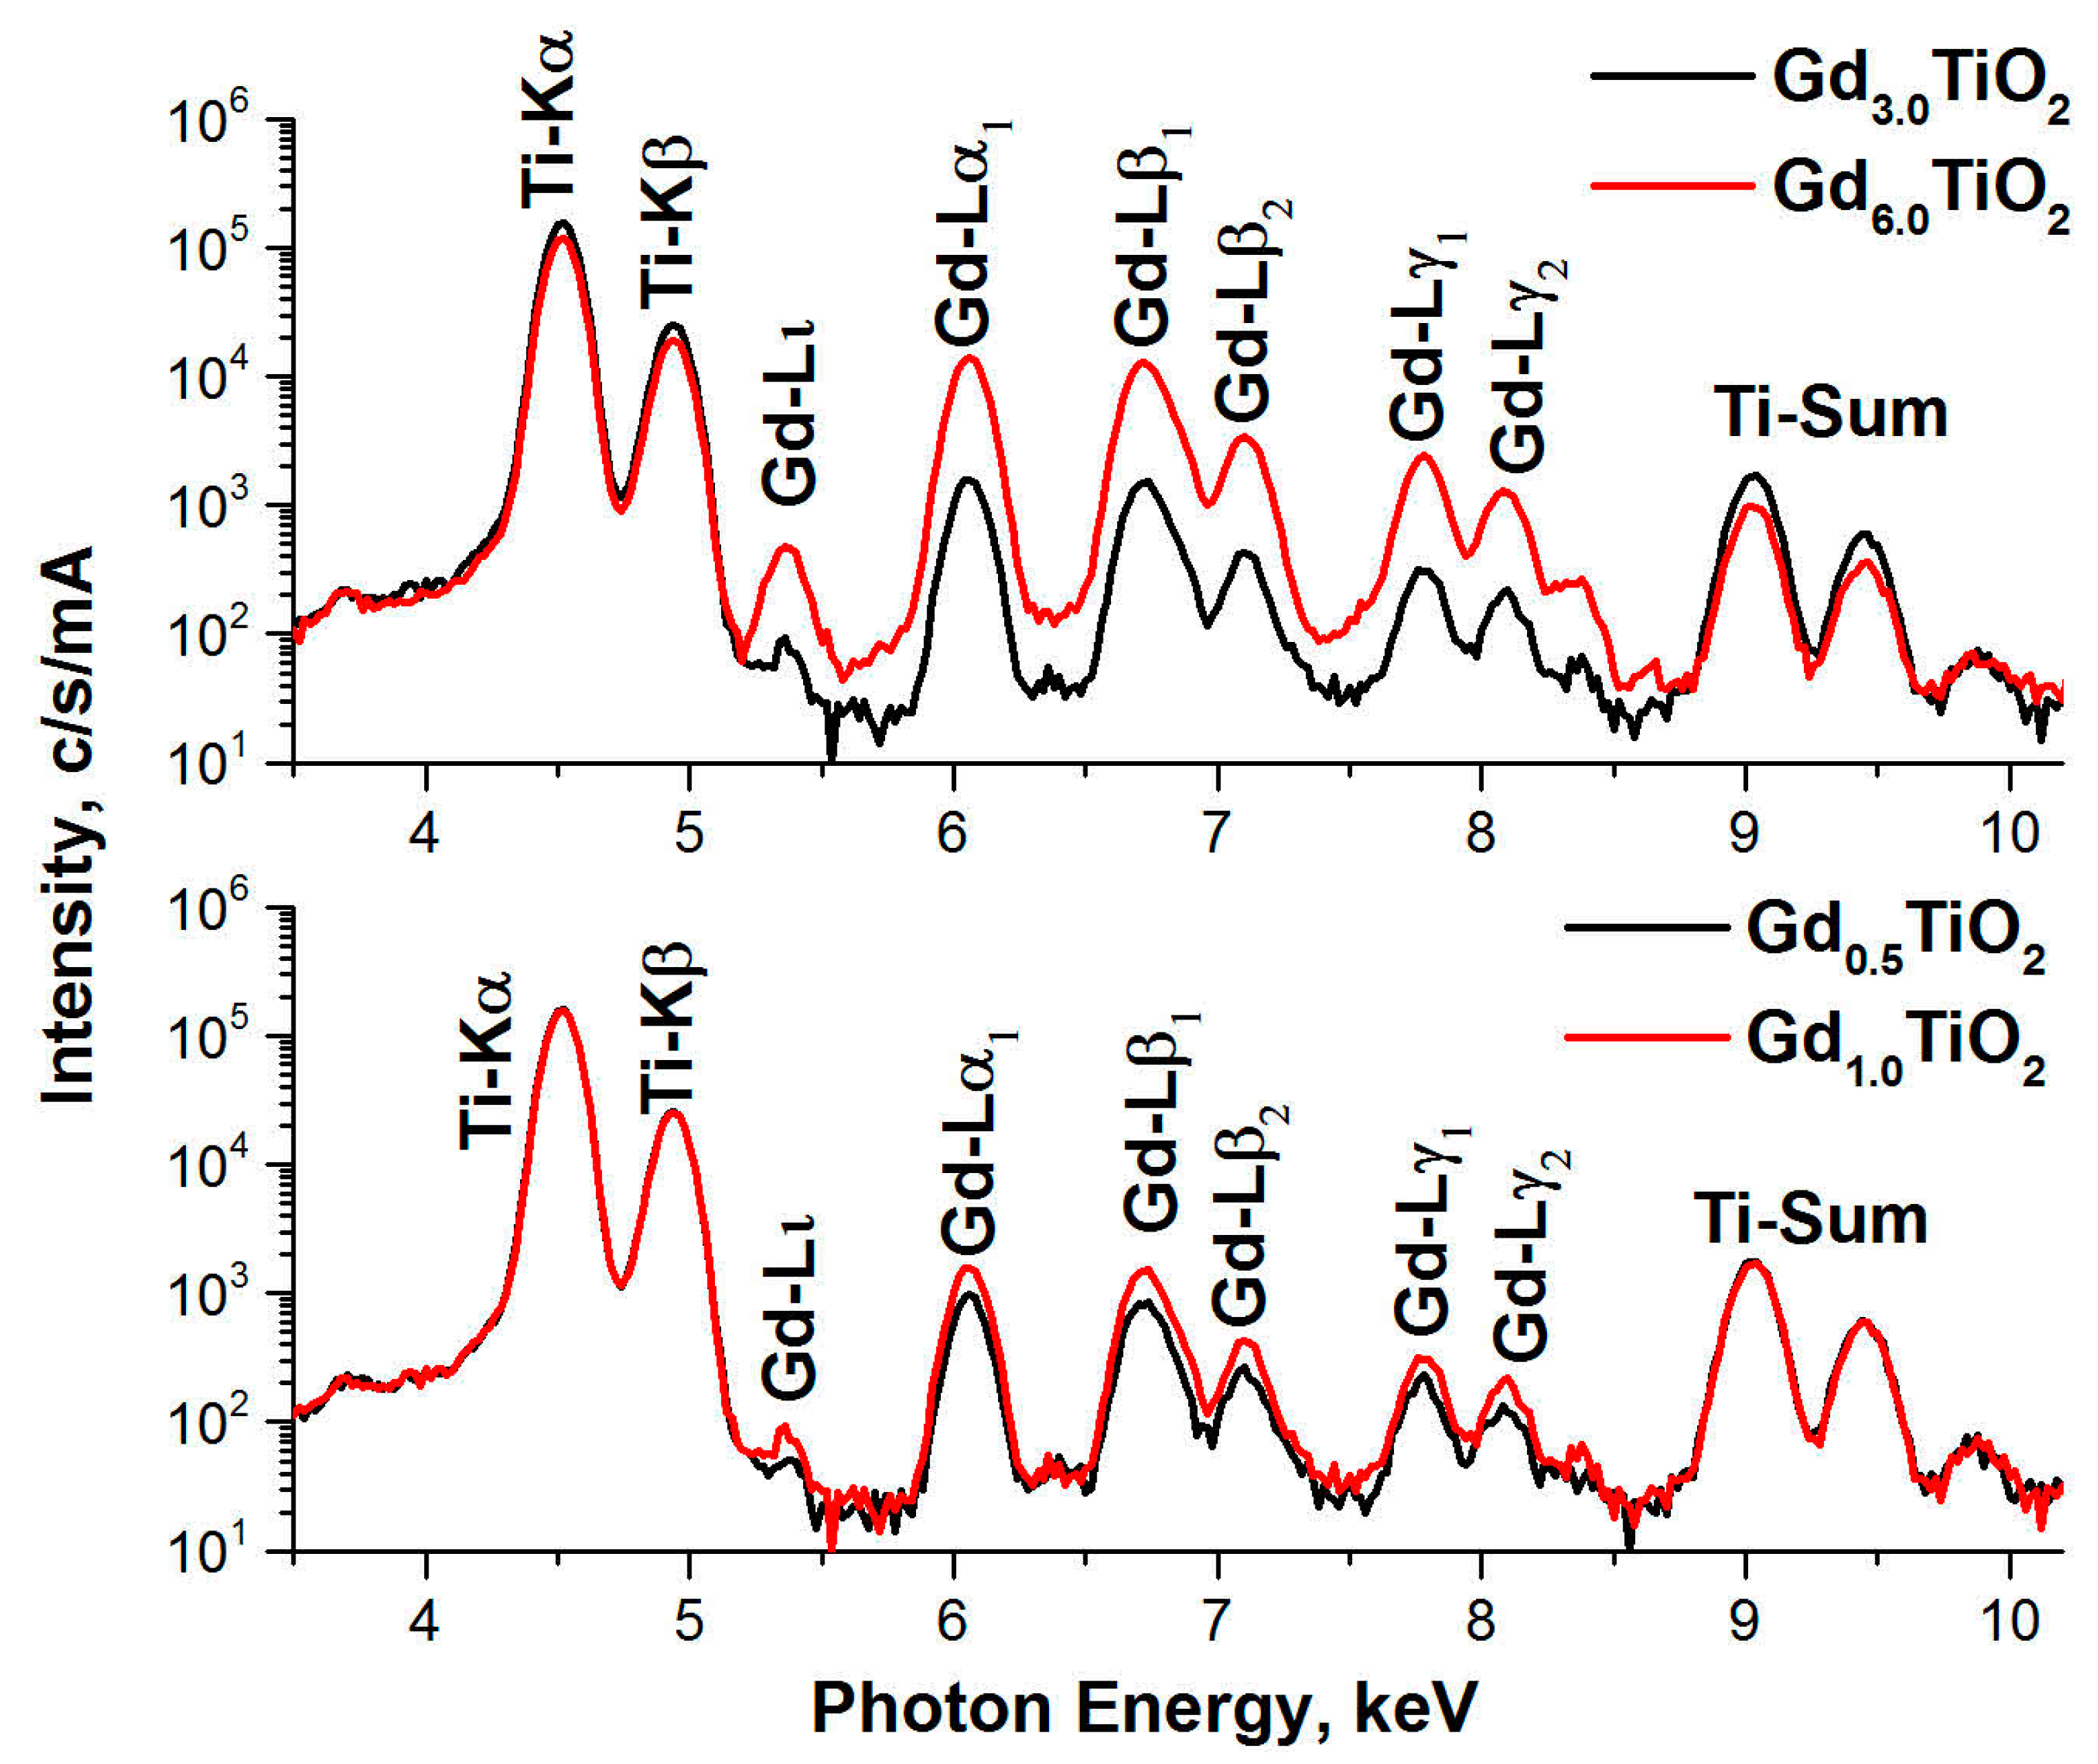
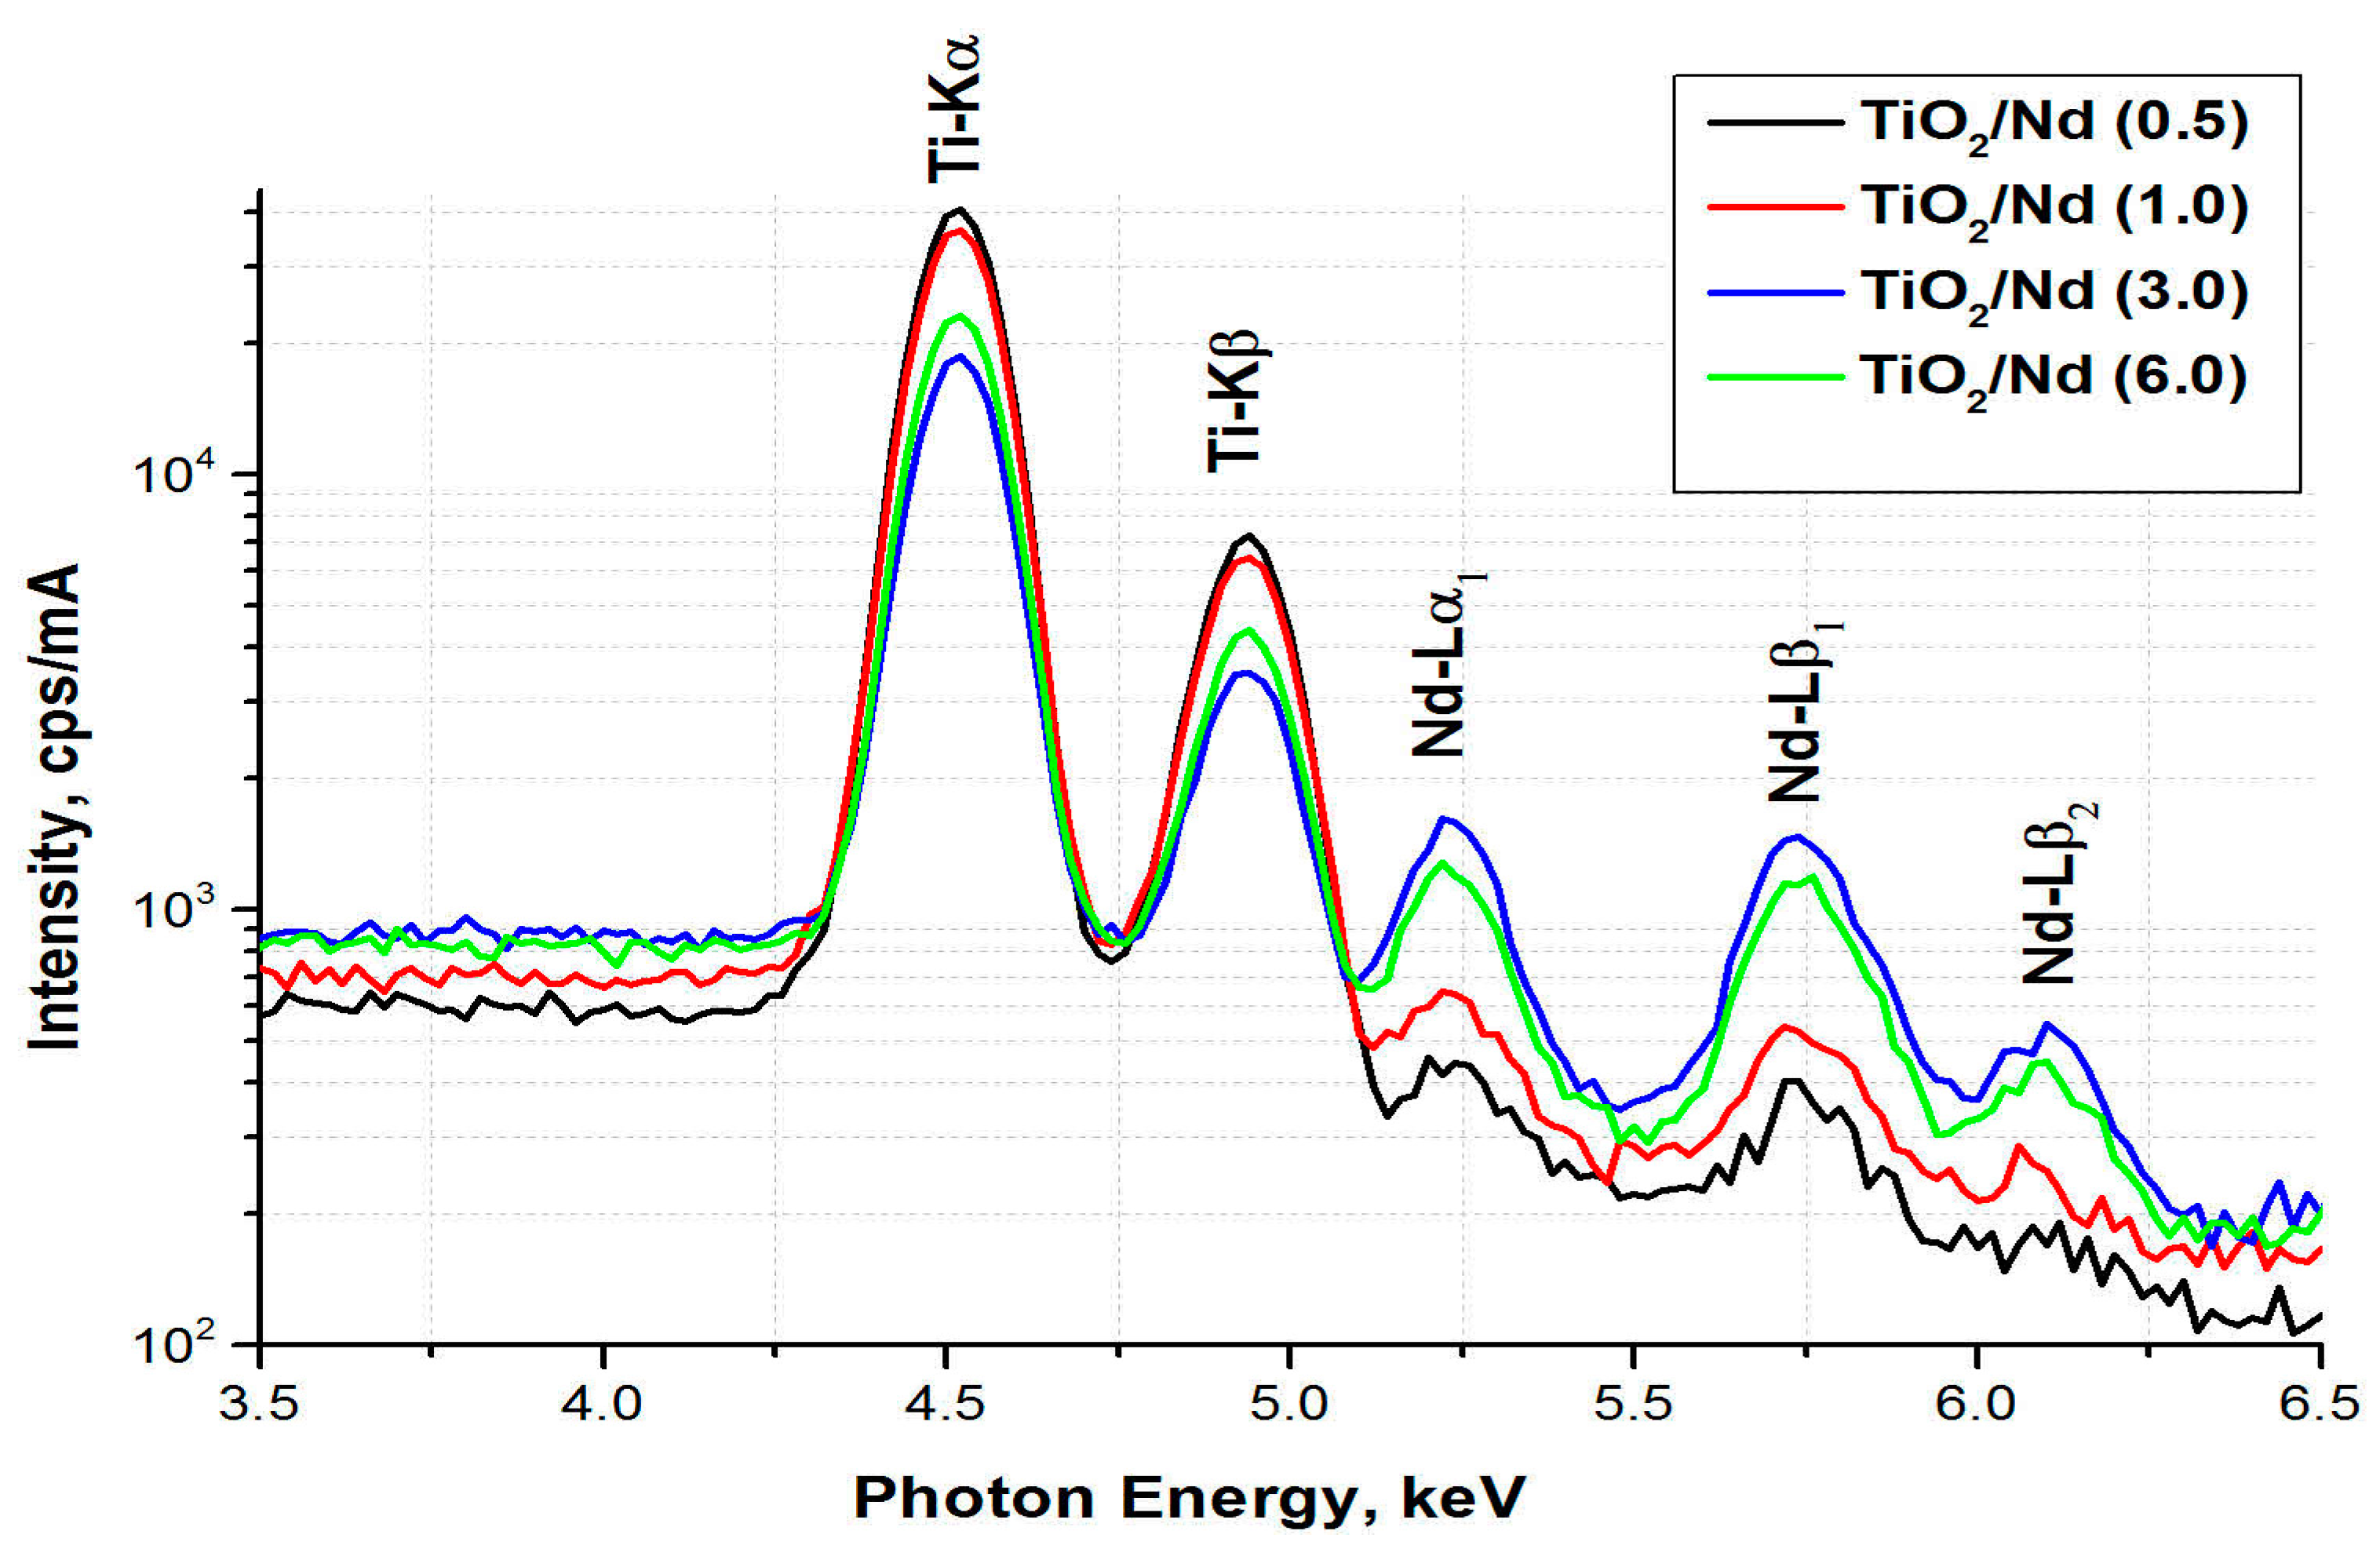
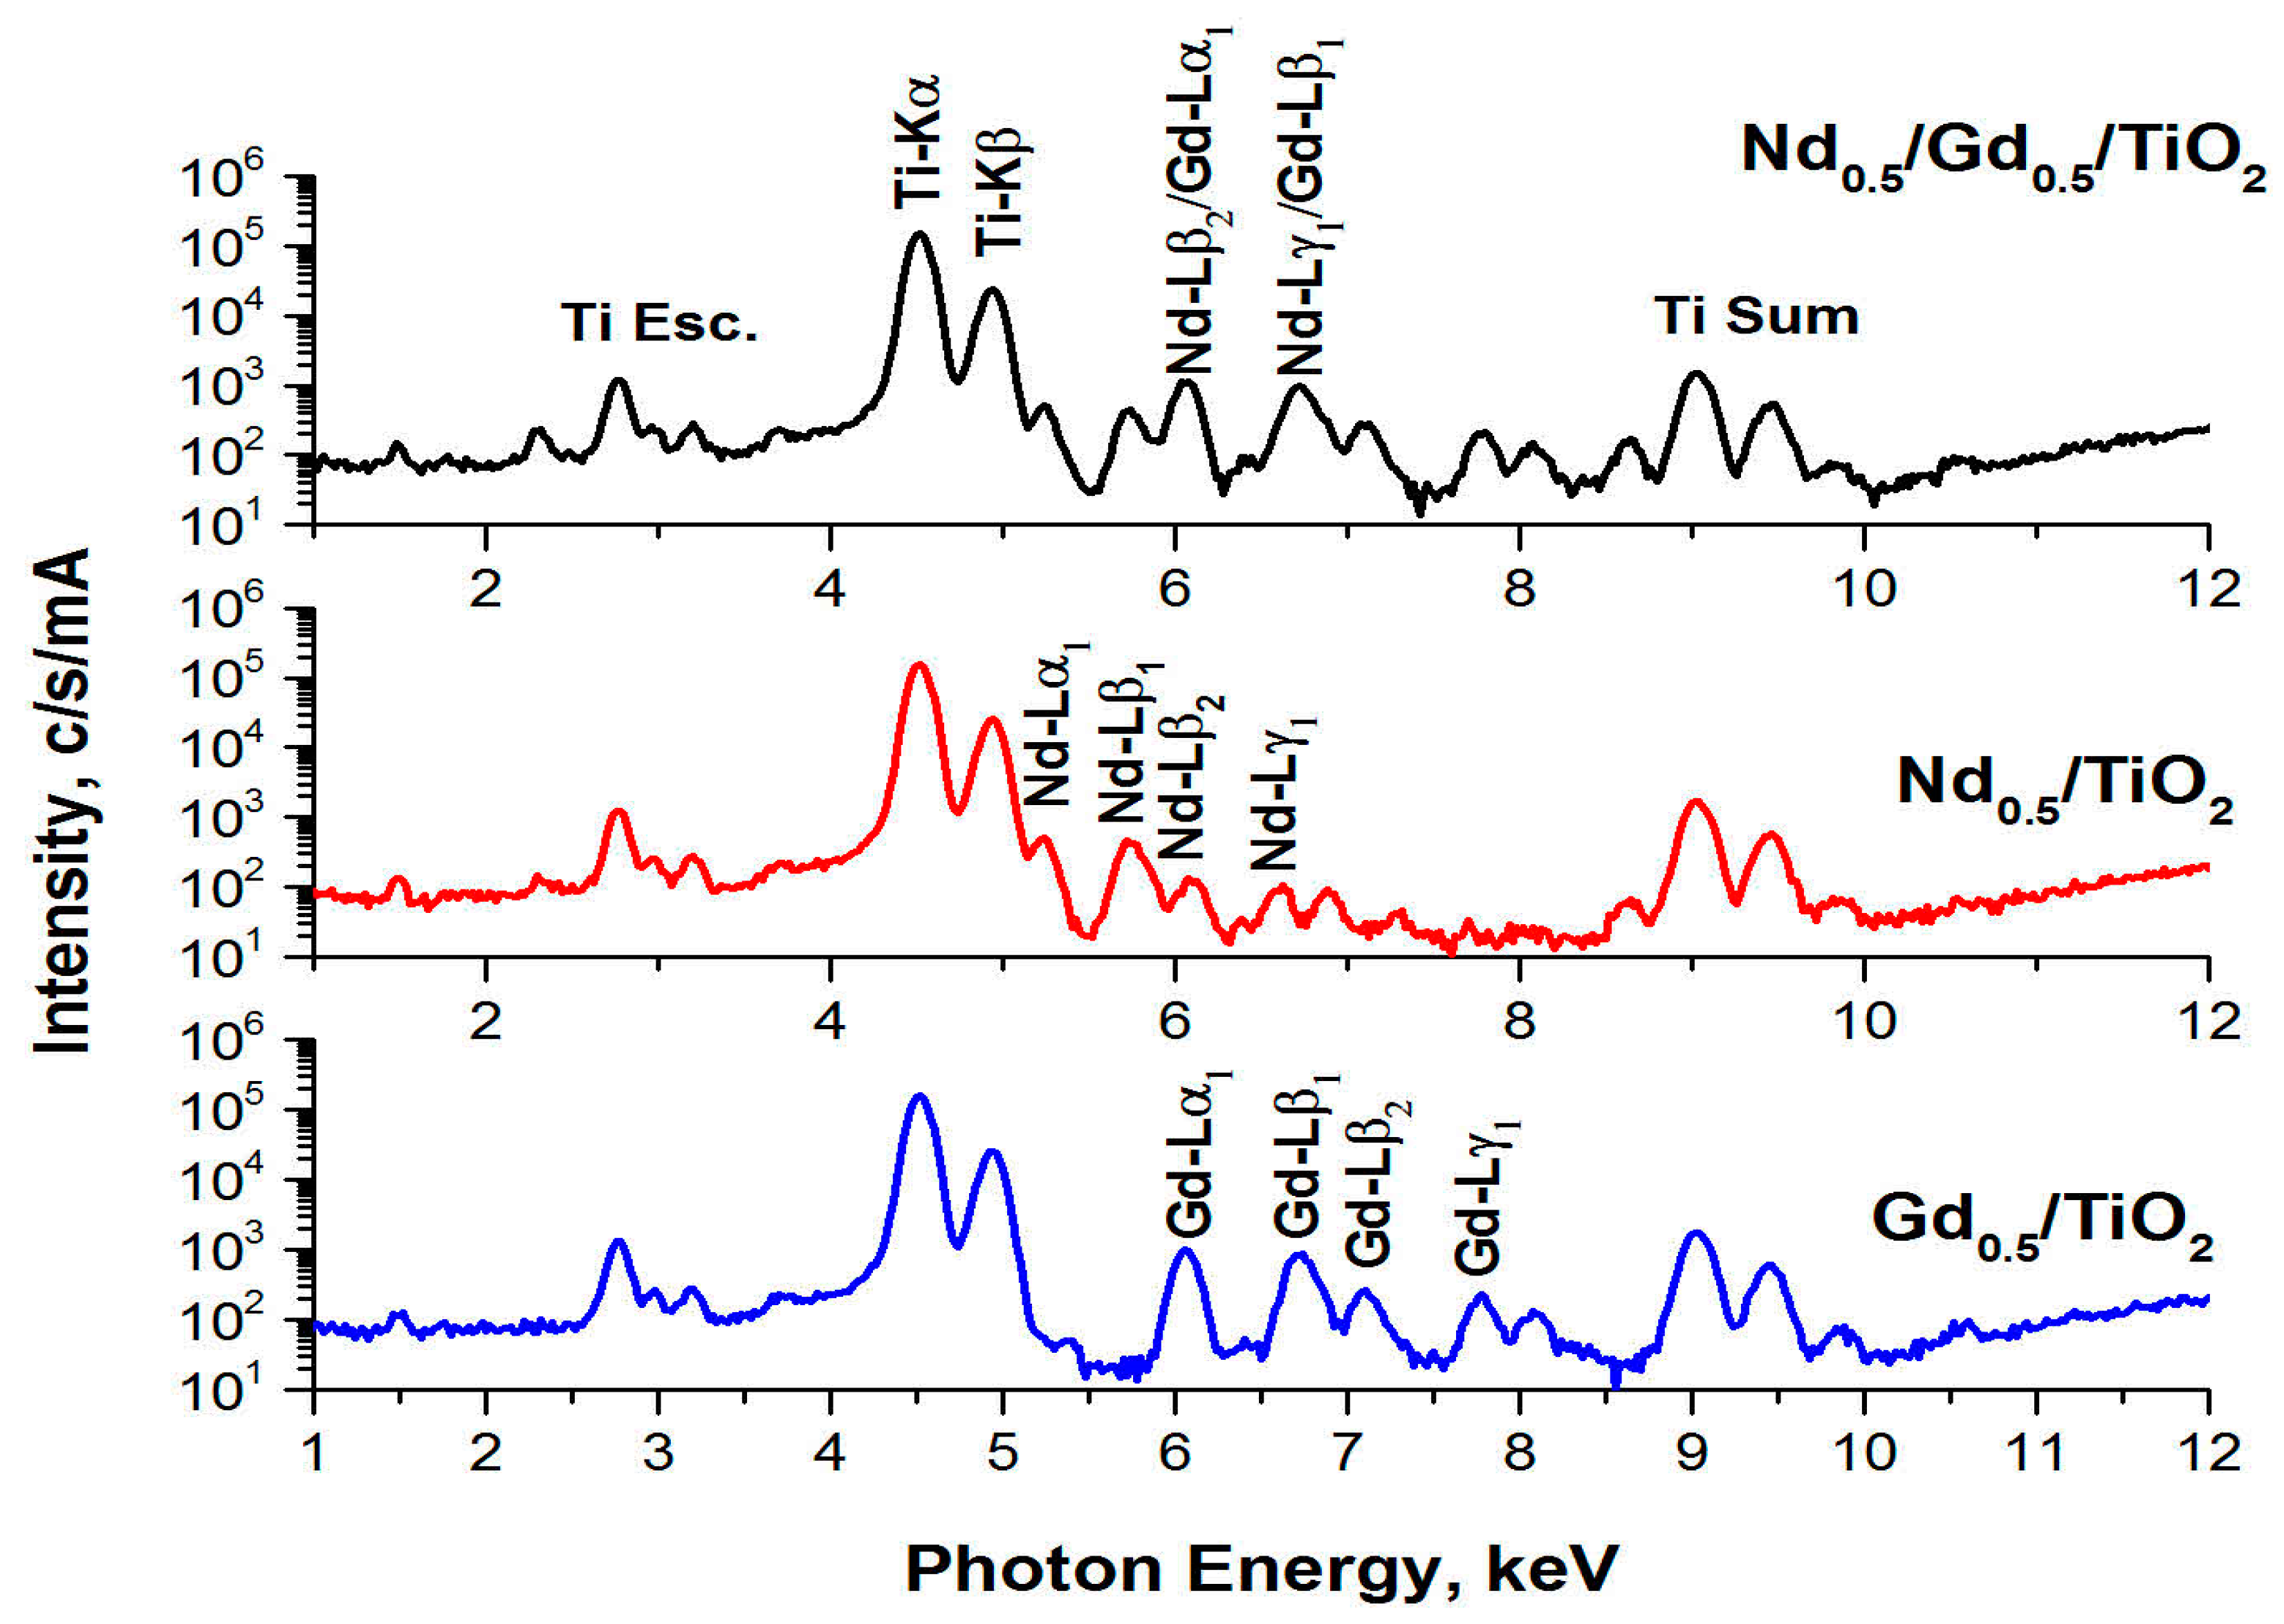
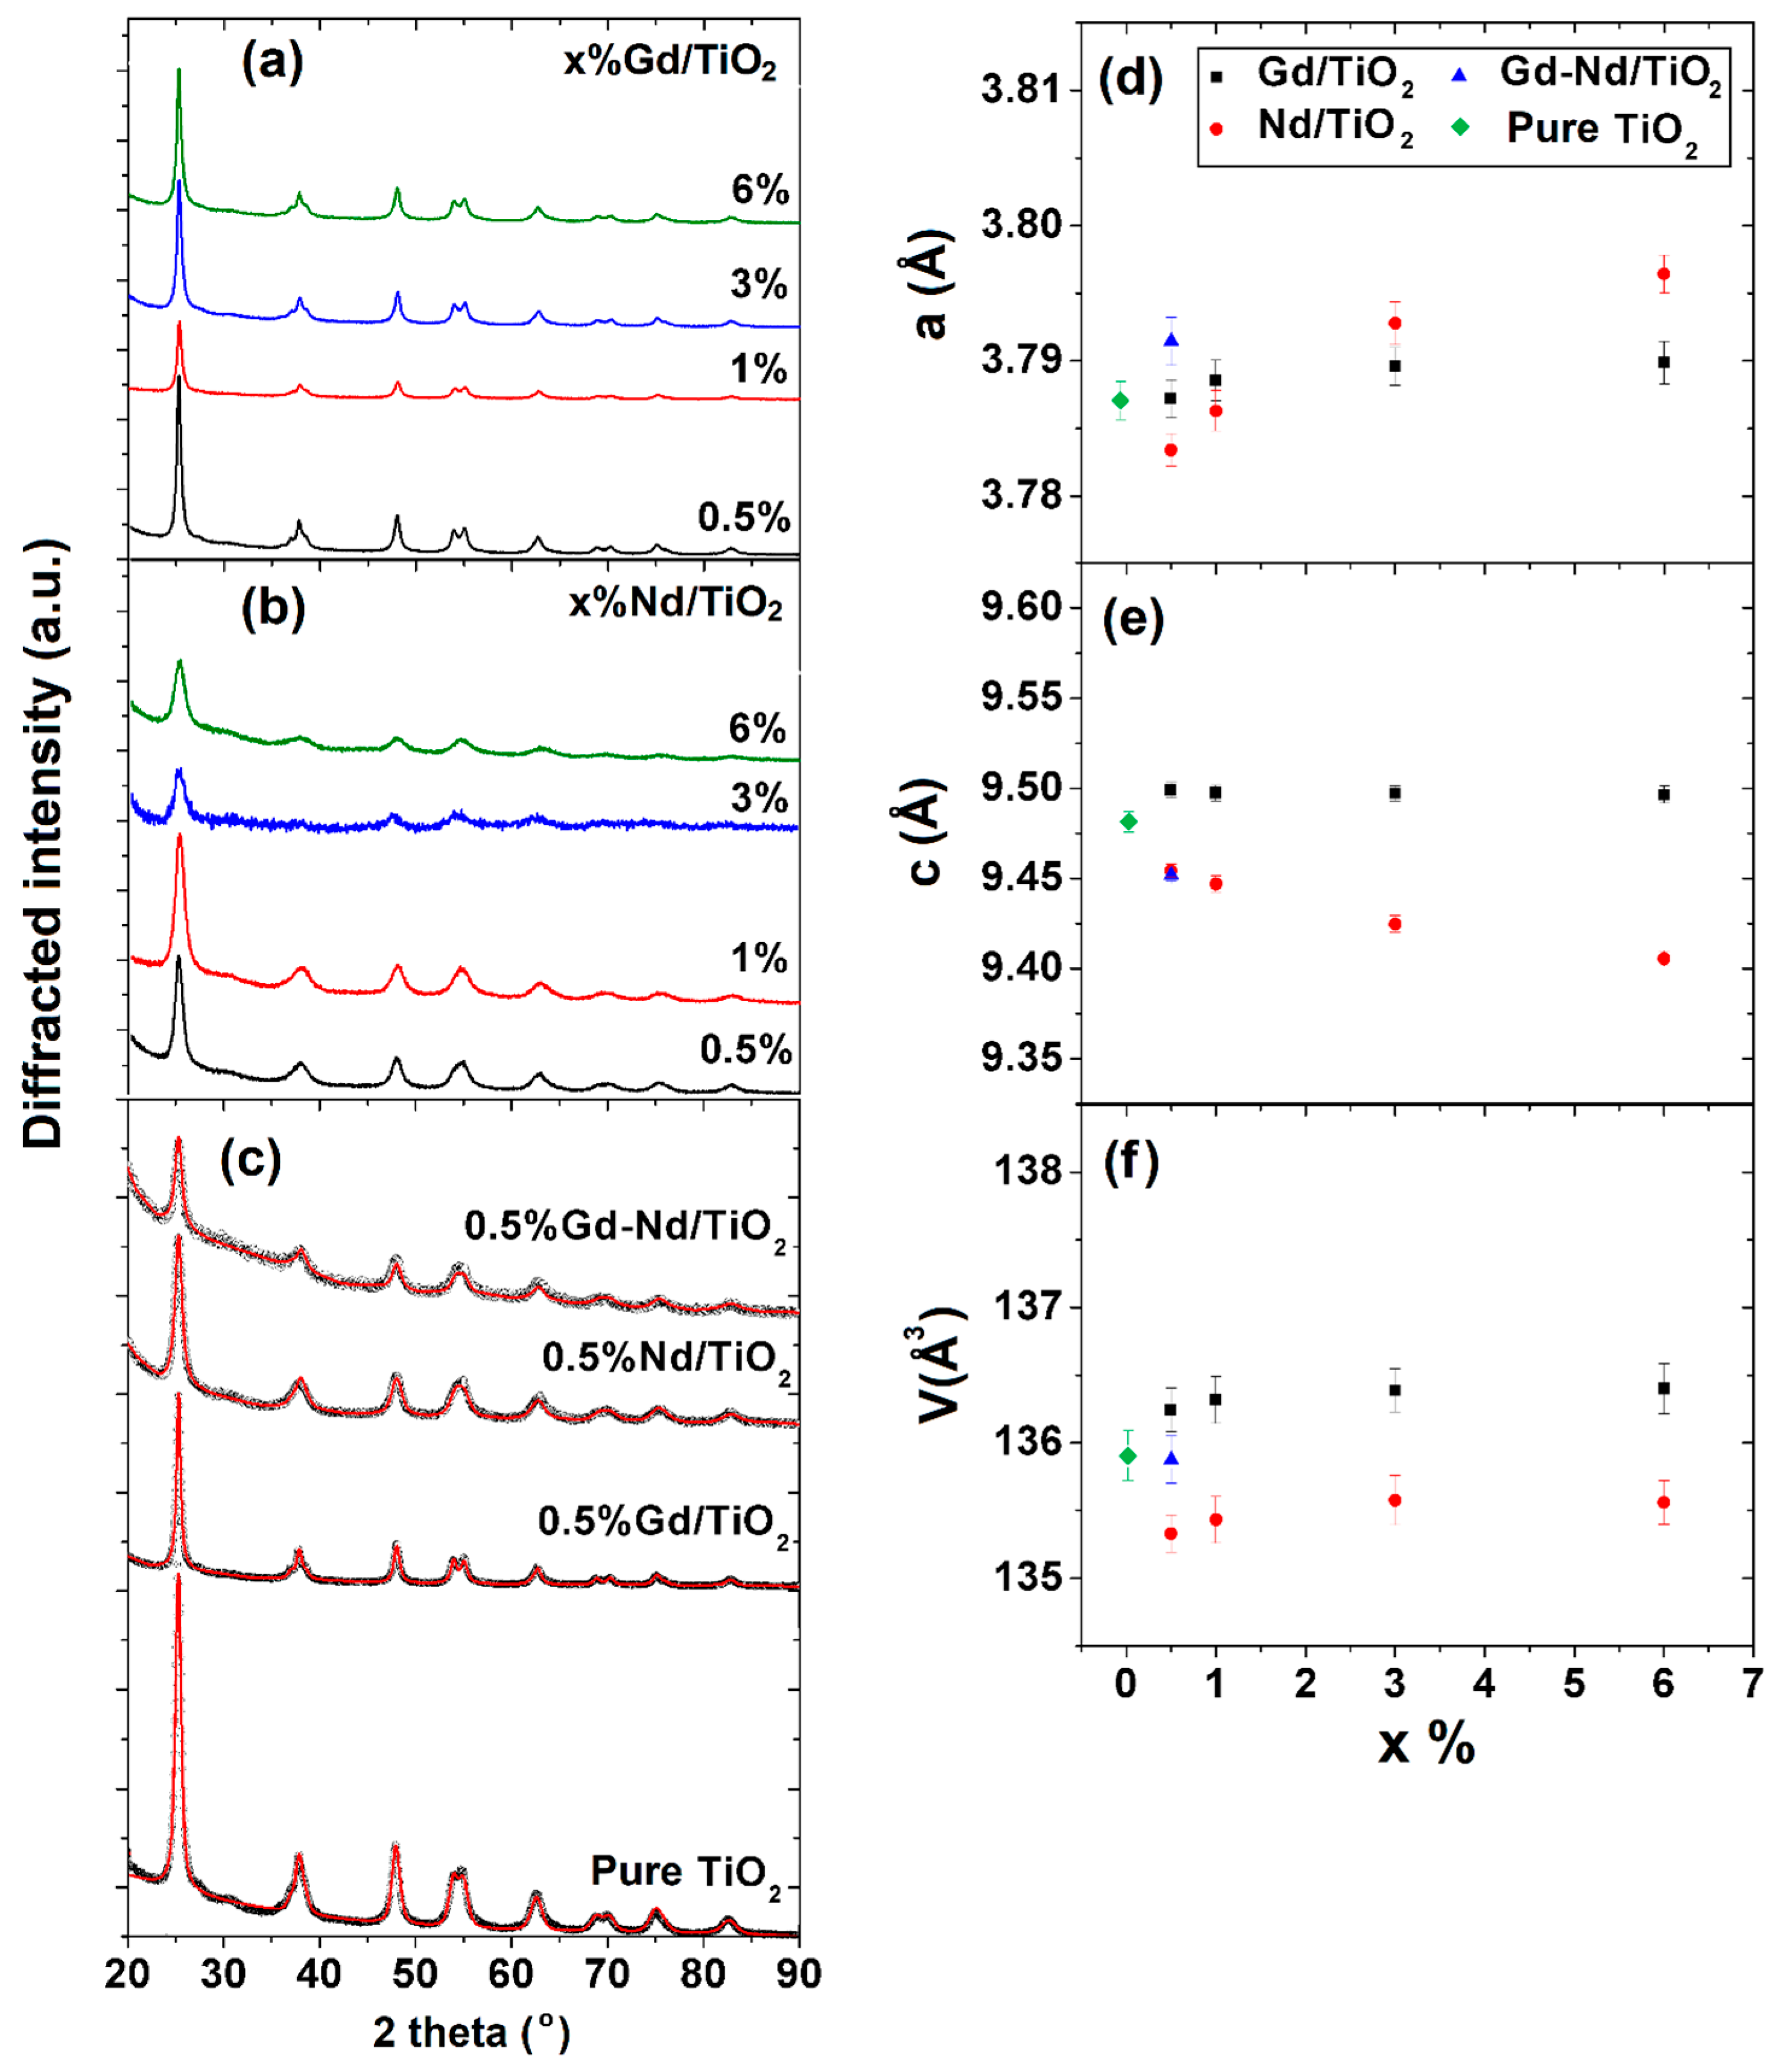
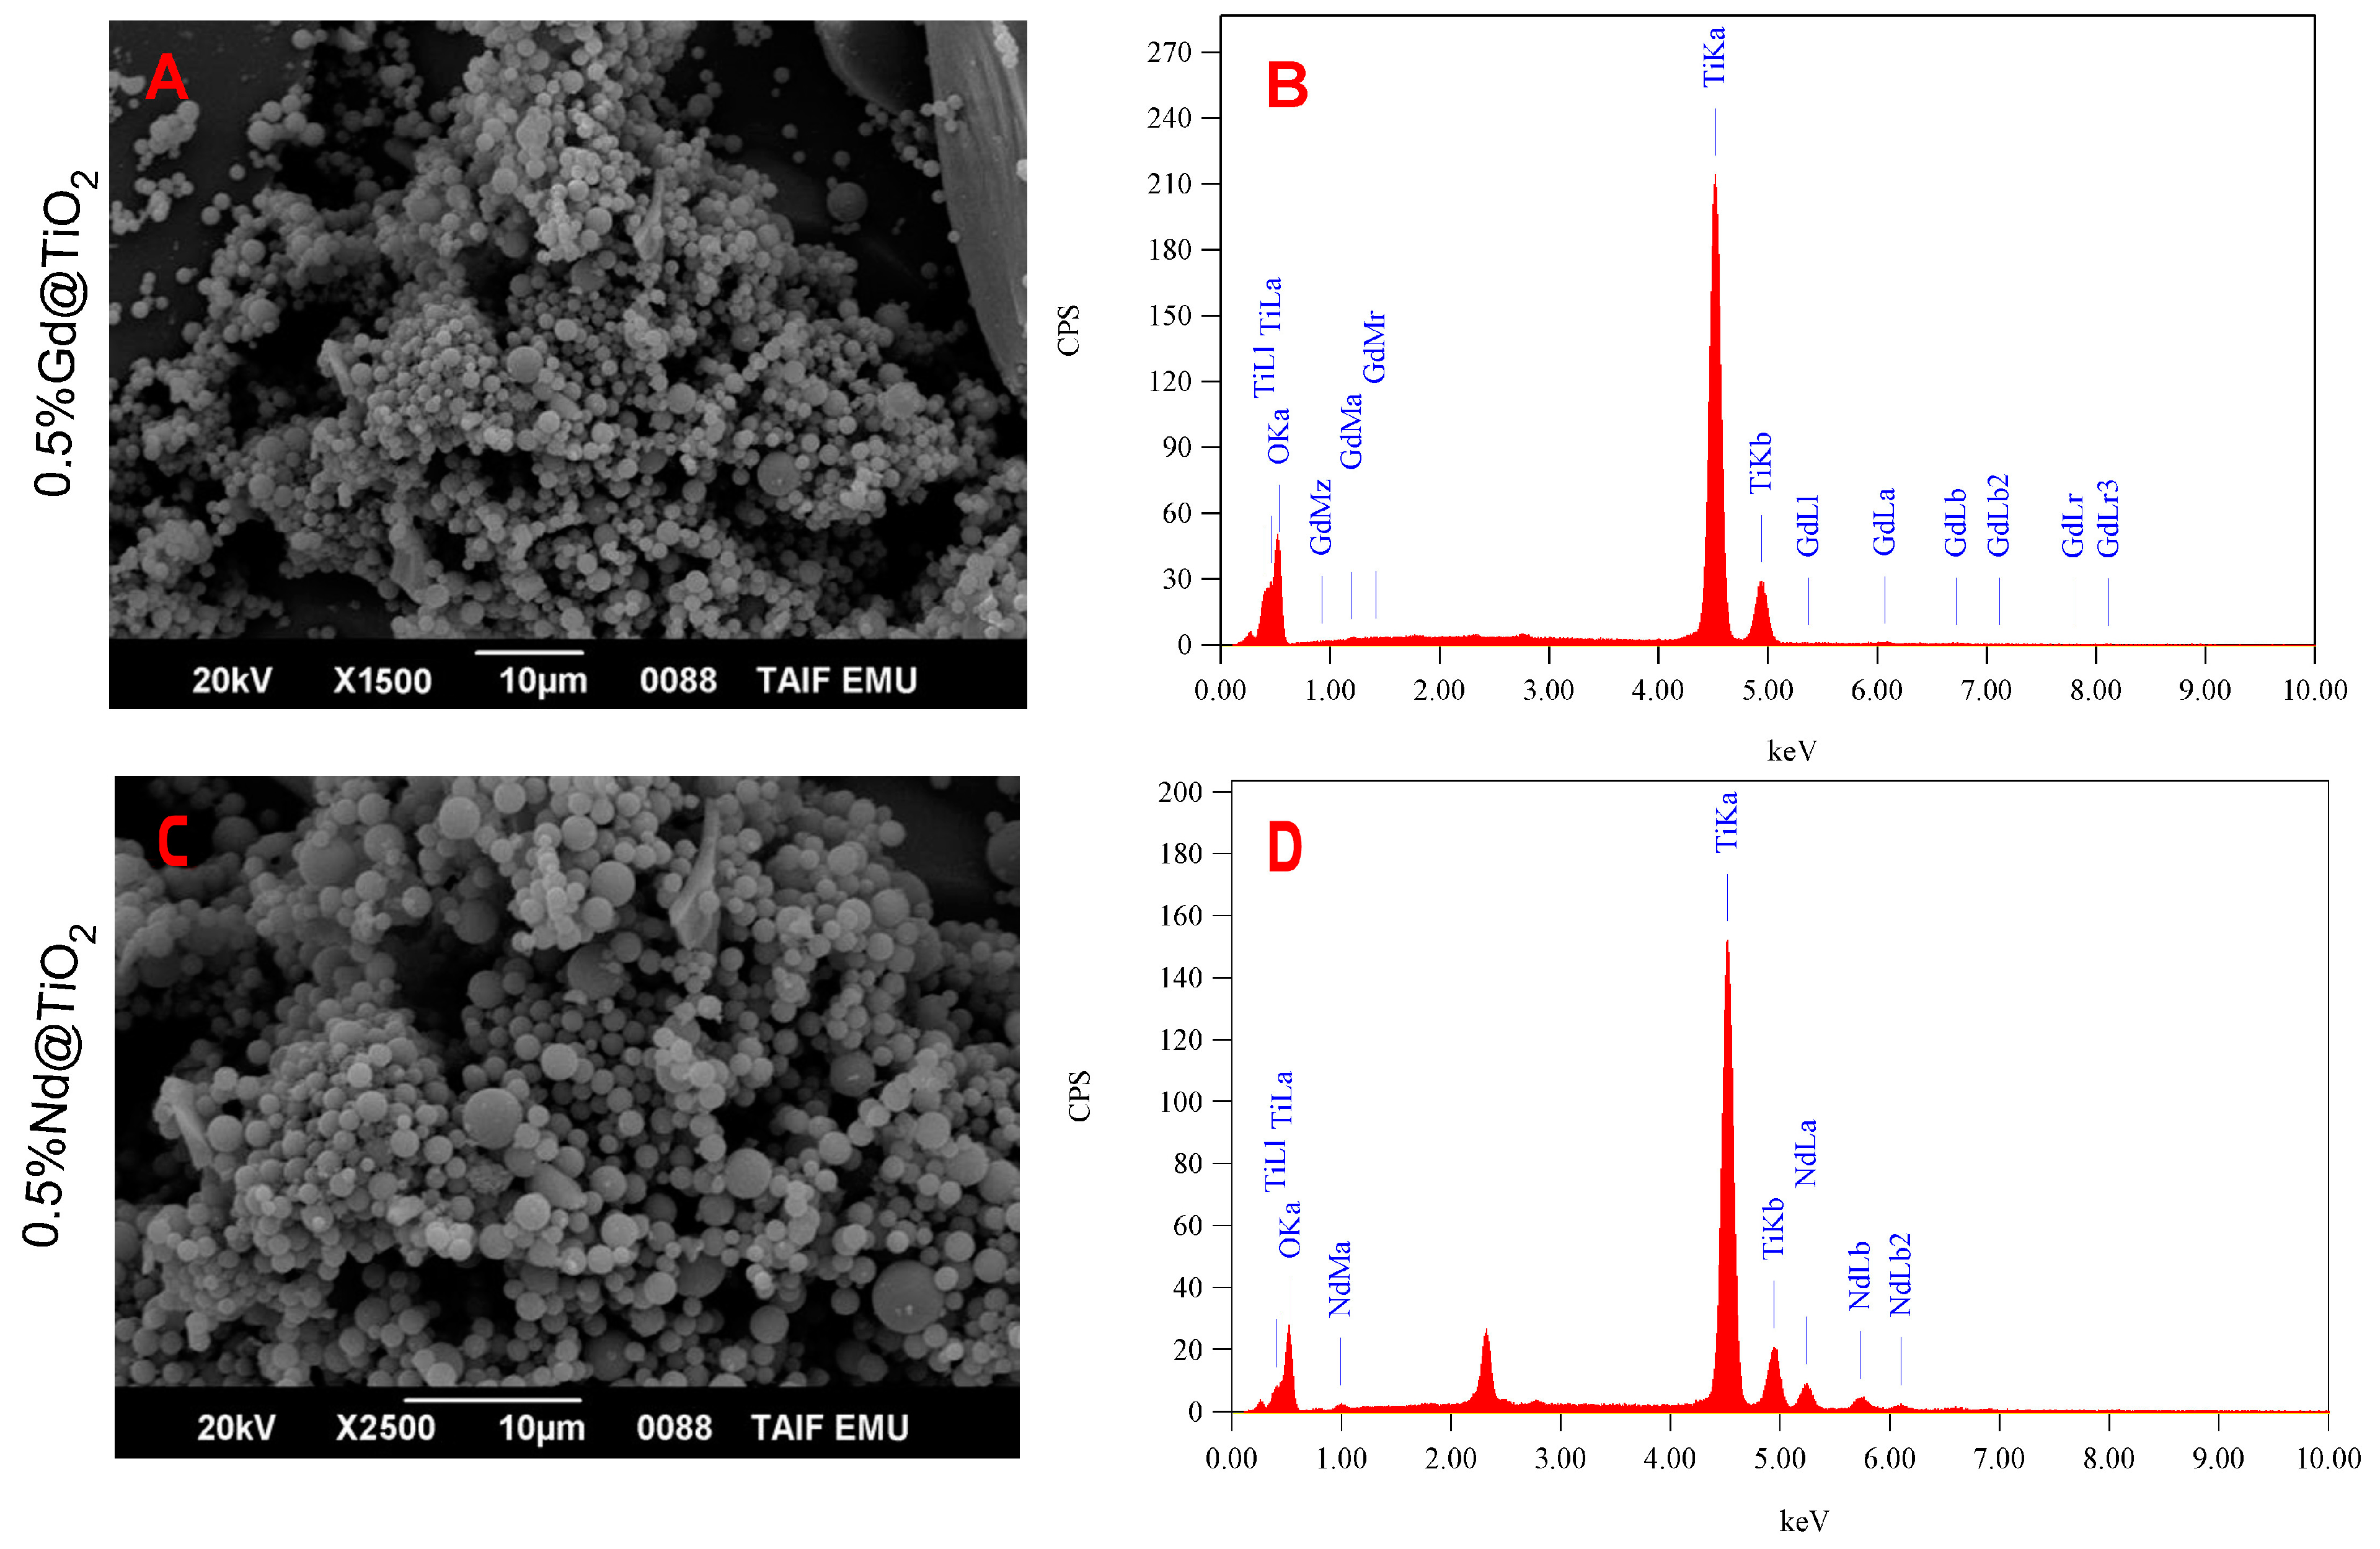
2.1. Characterization of Gdx/TiO2, Ndx/TiO2, and Gd0.5/Nd0.5/TiO2 NPs
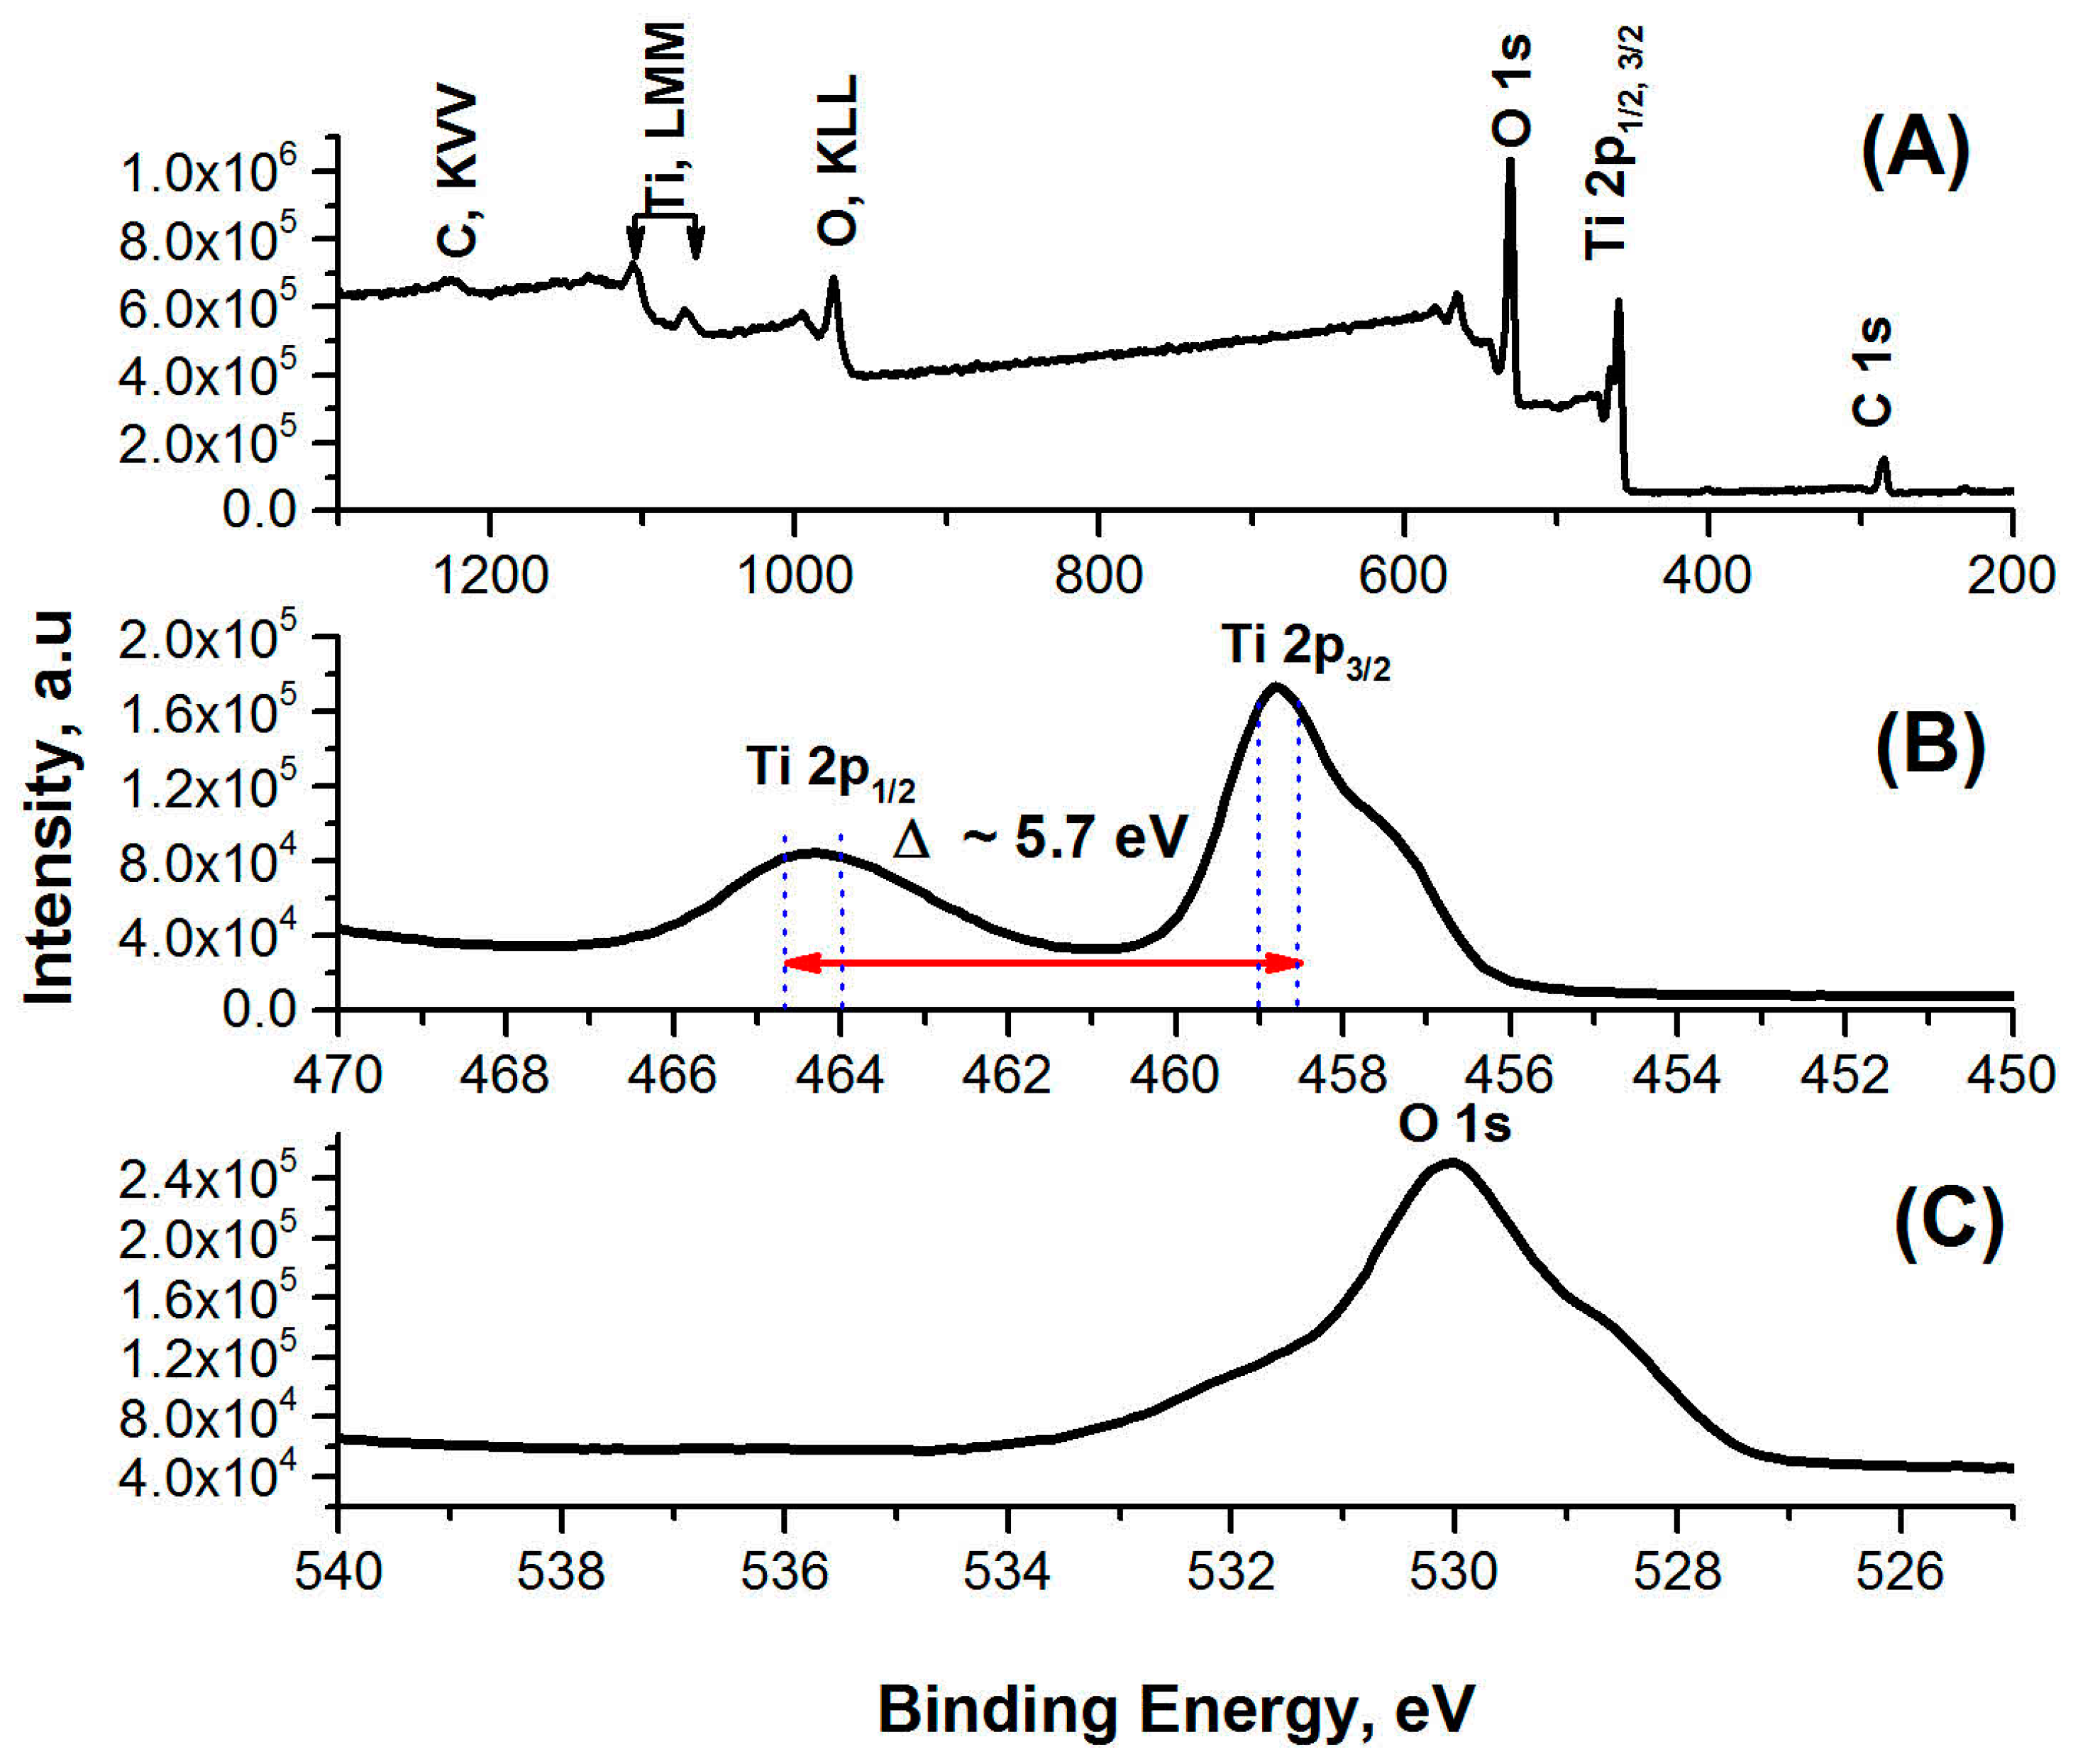
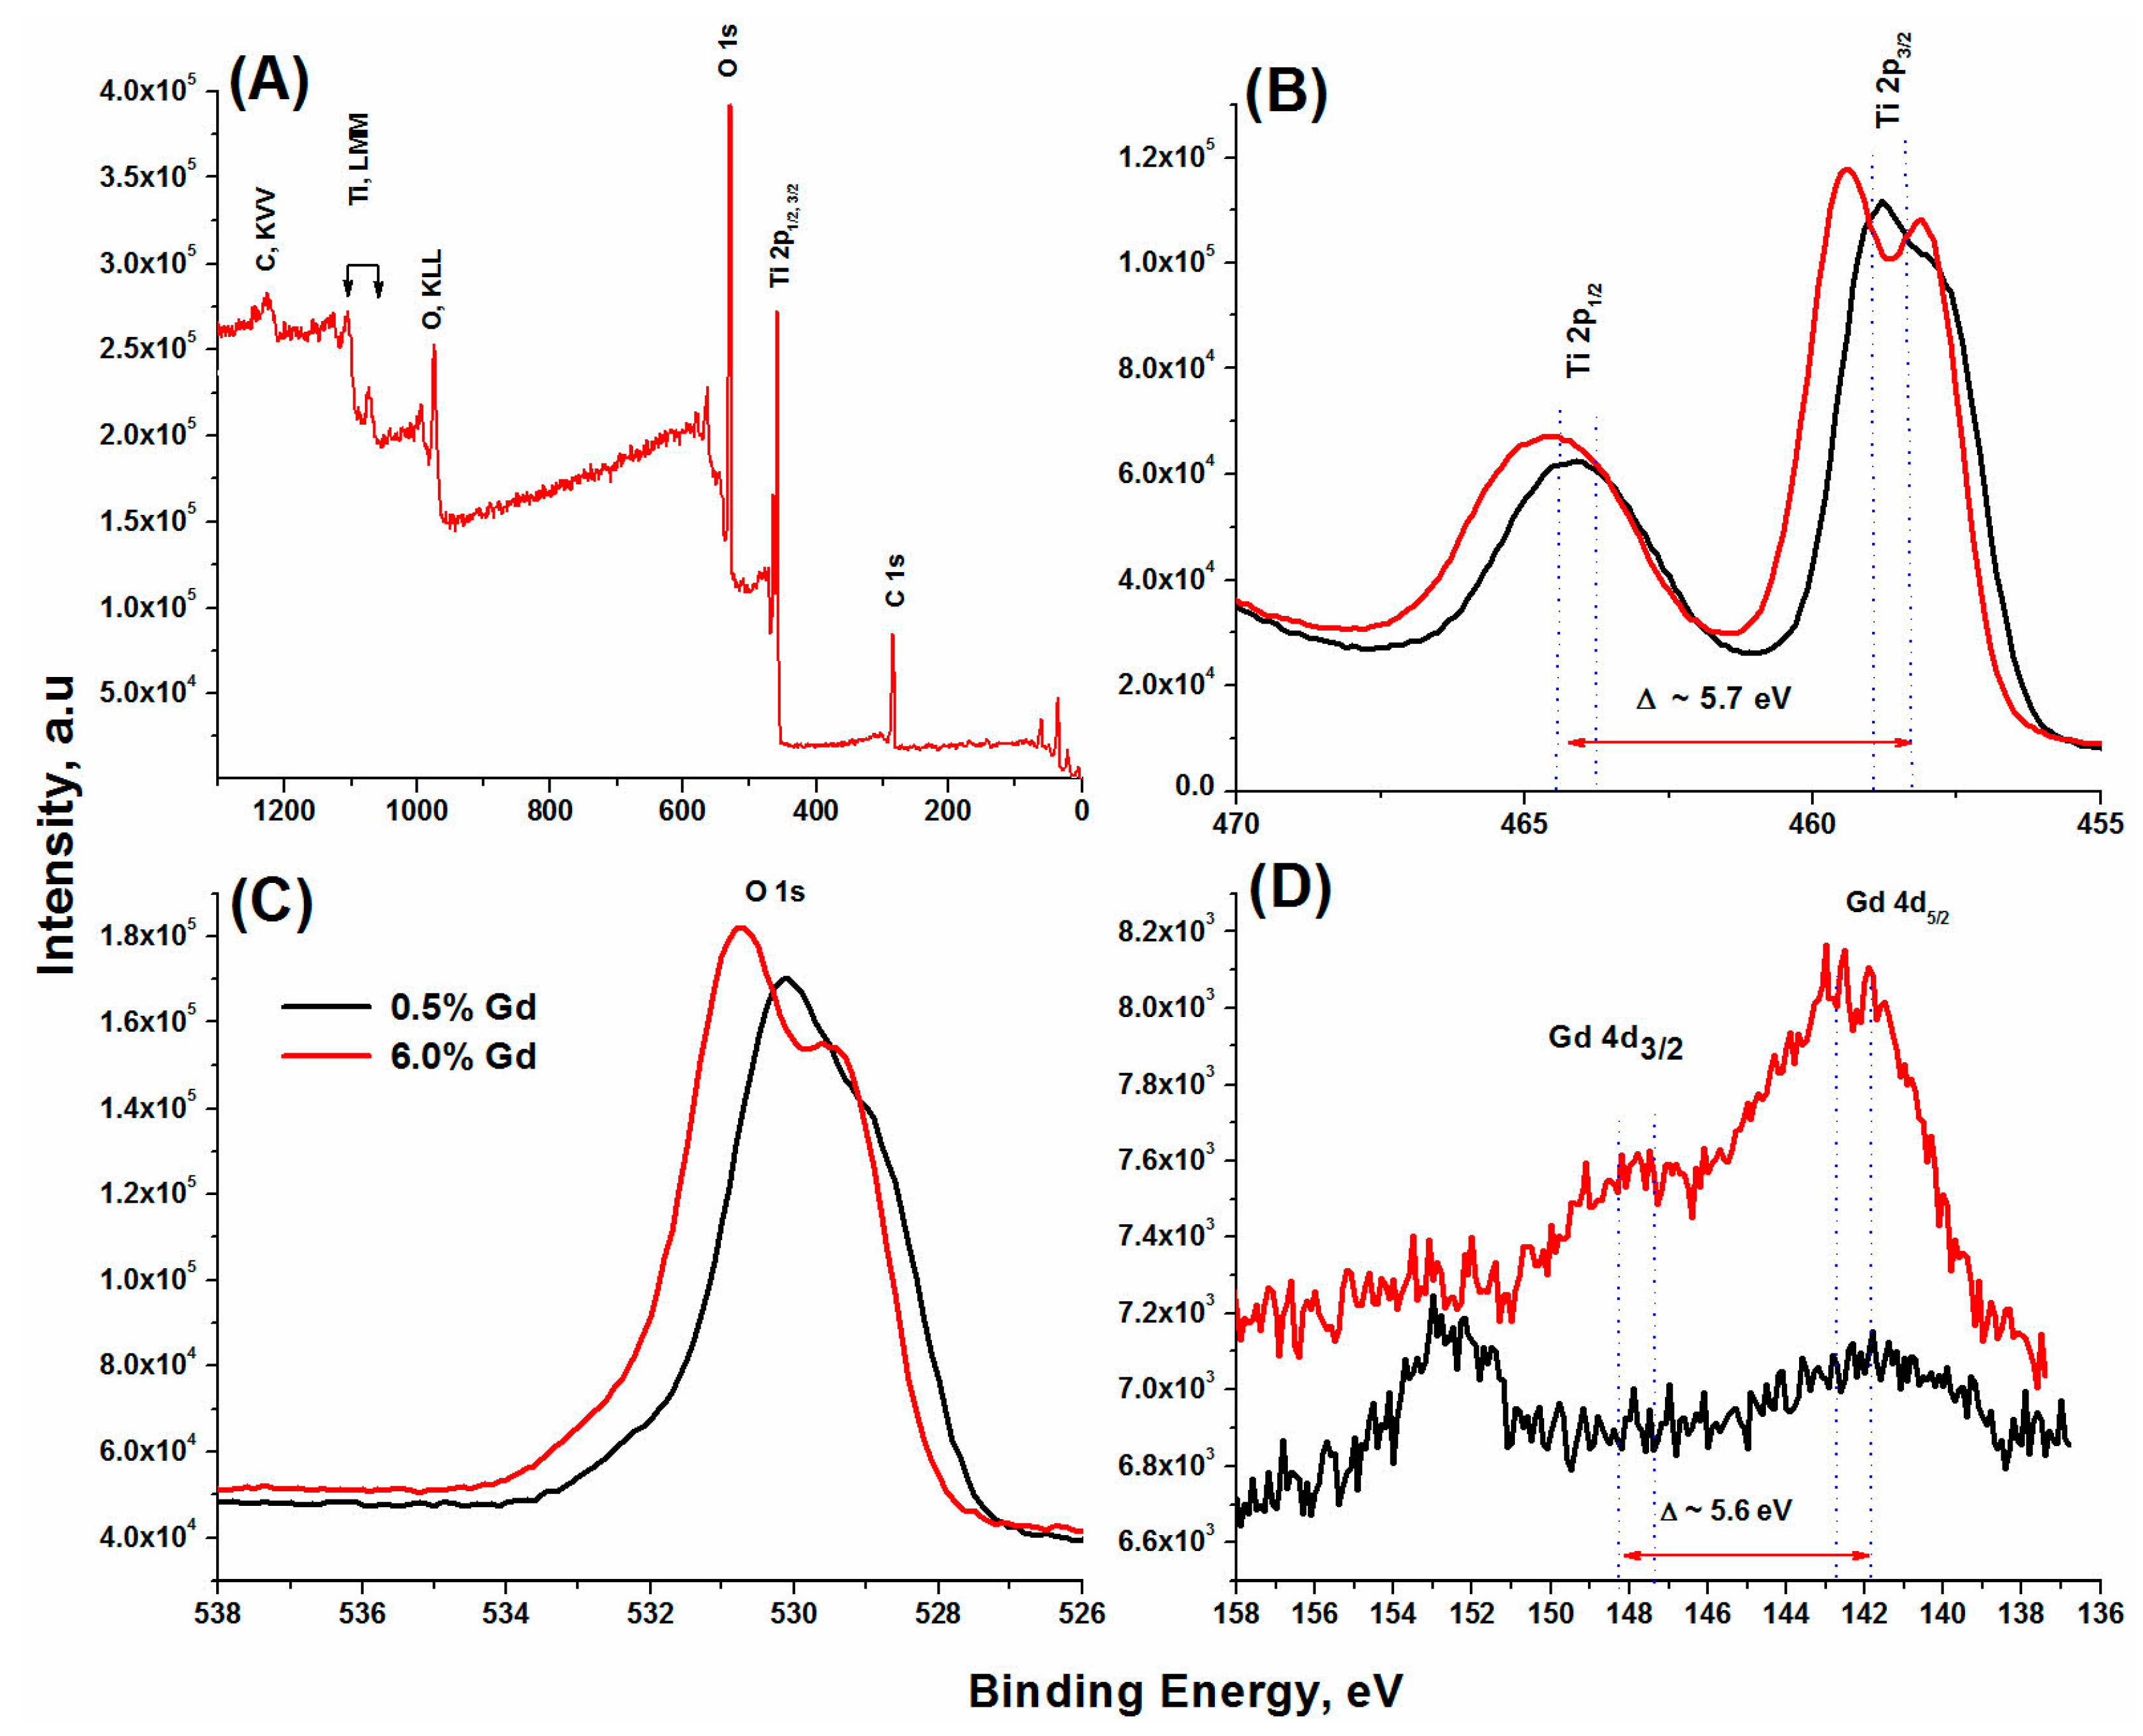
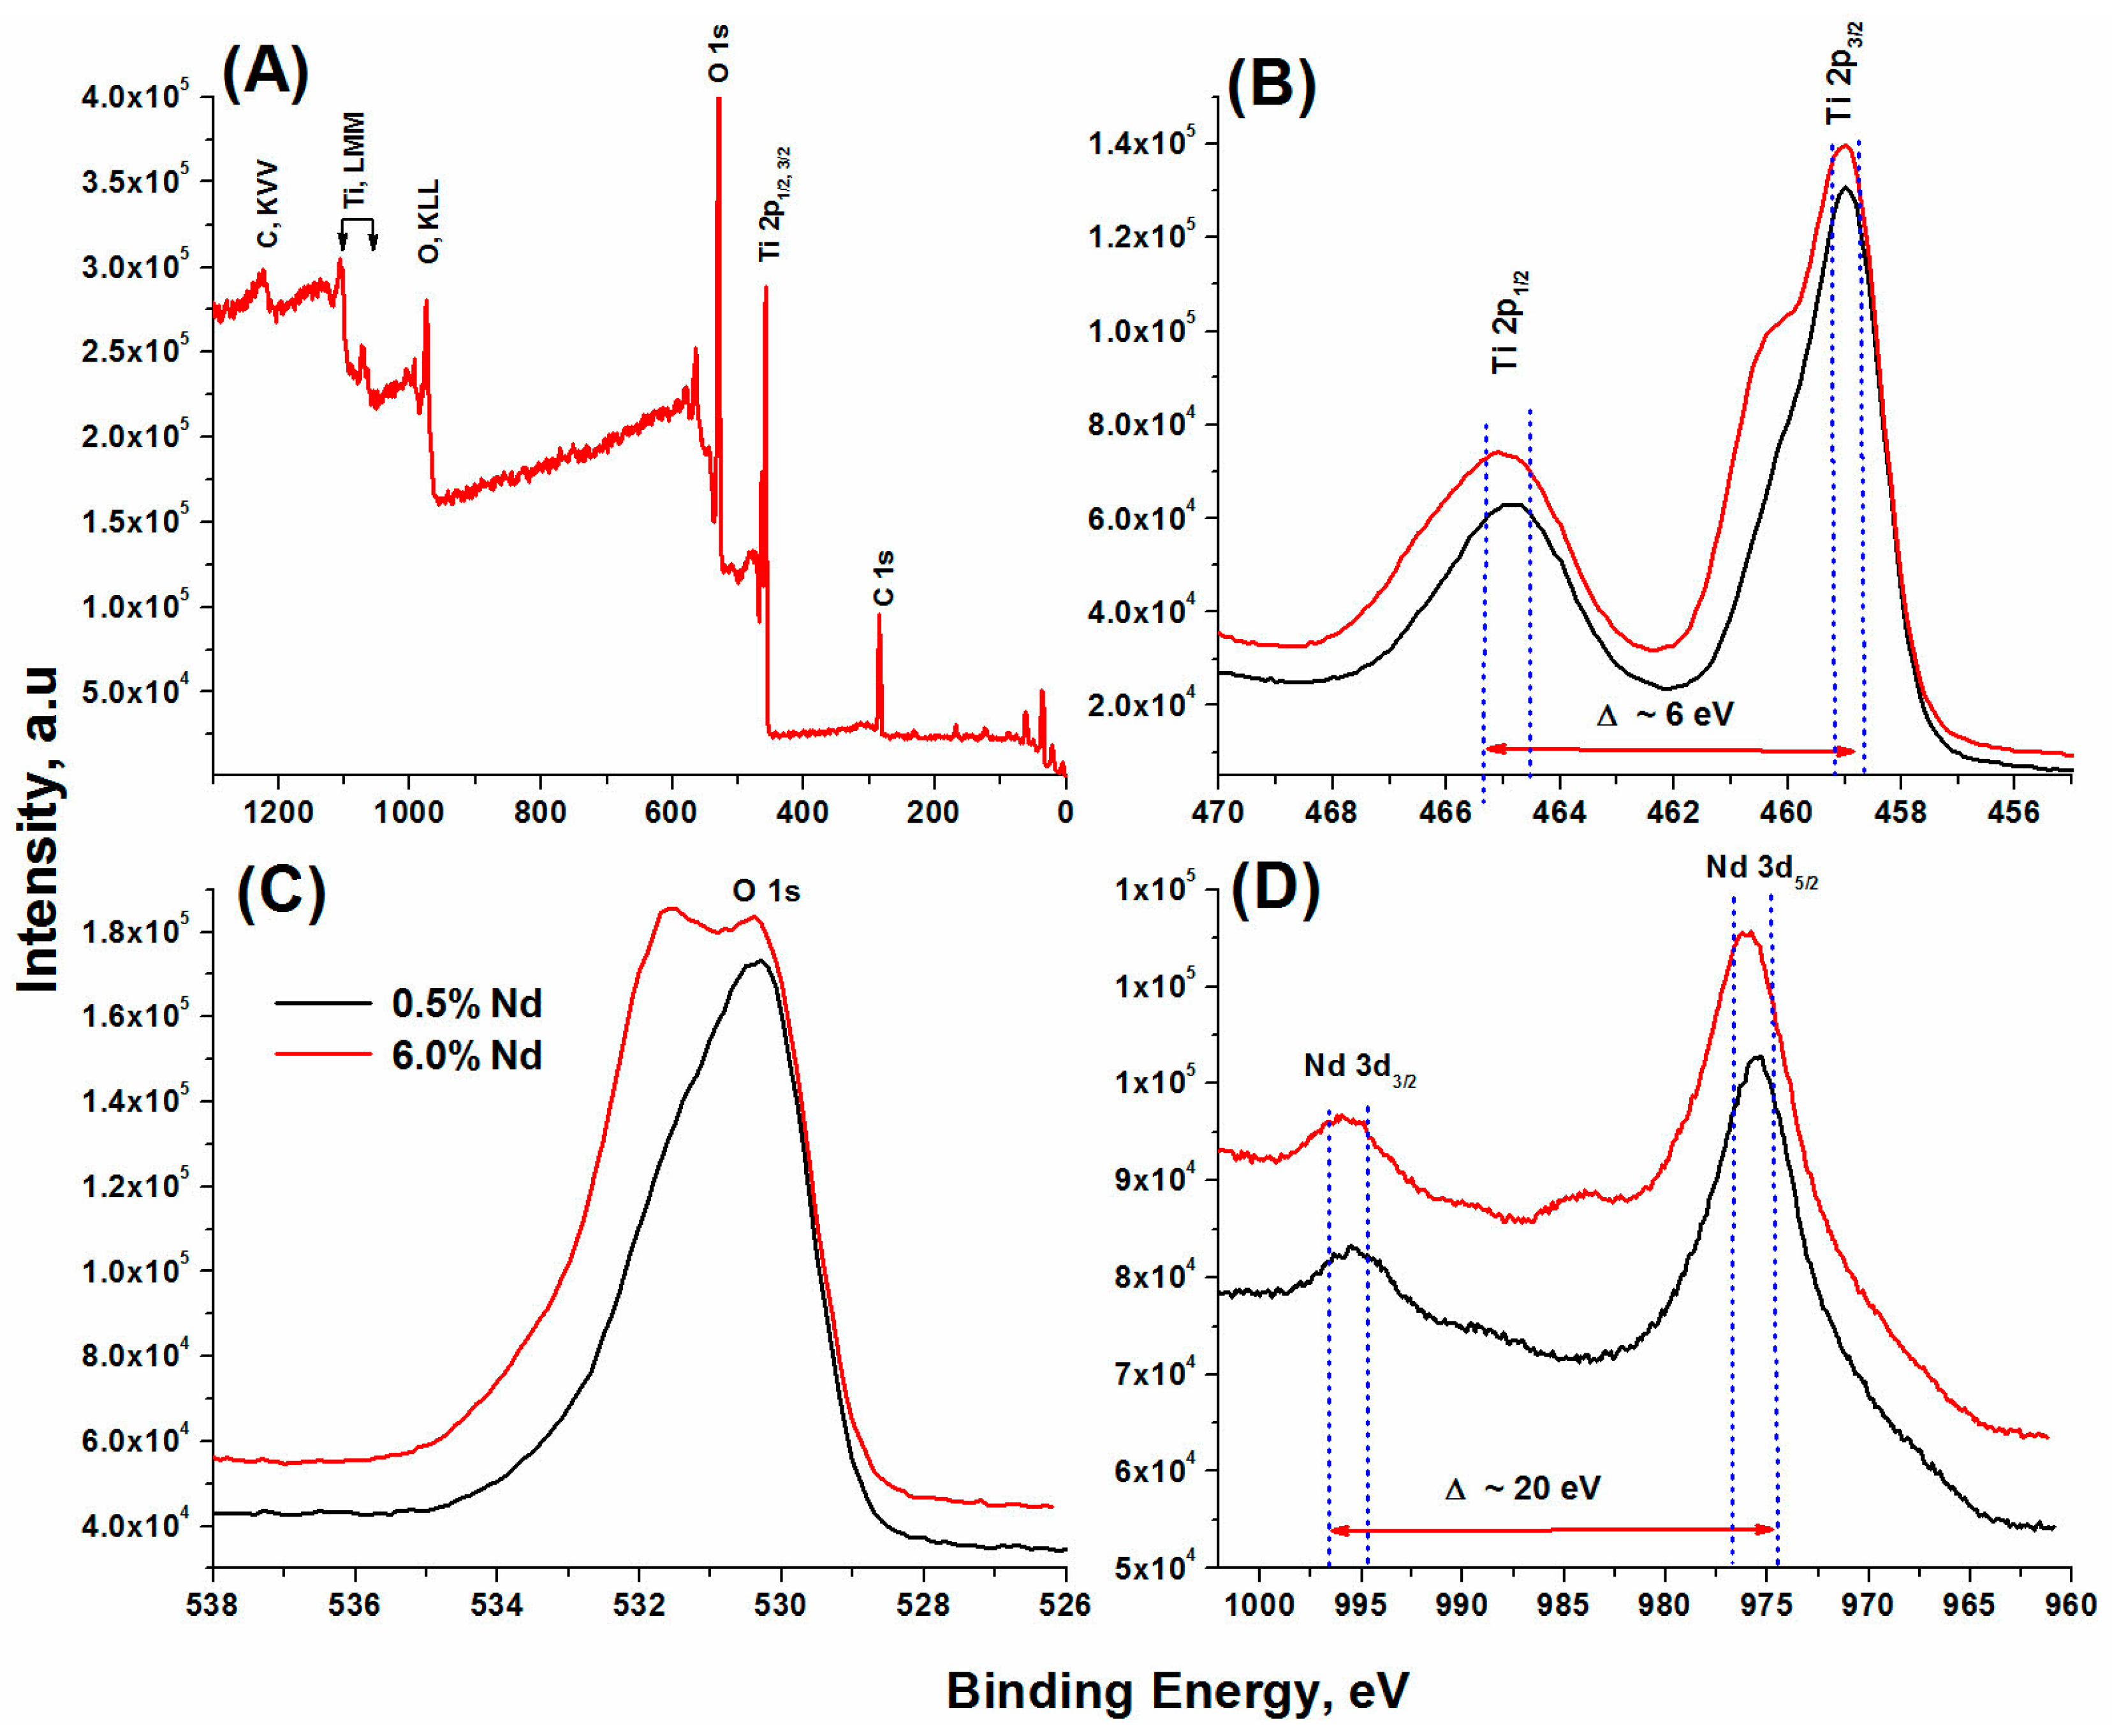
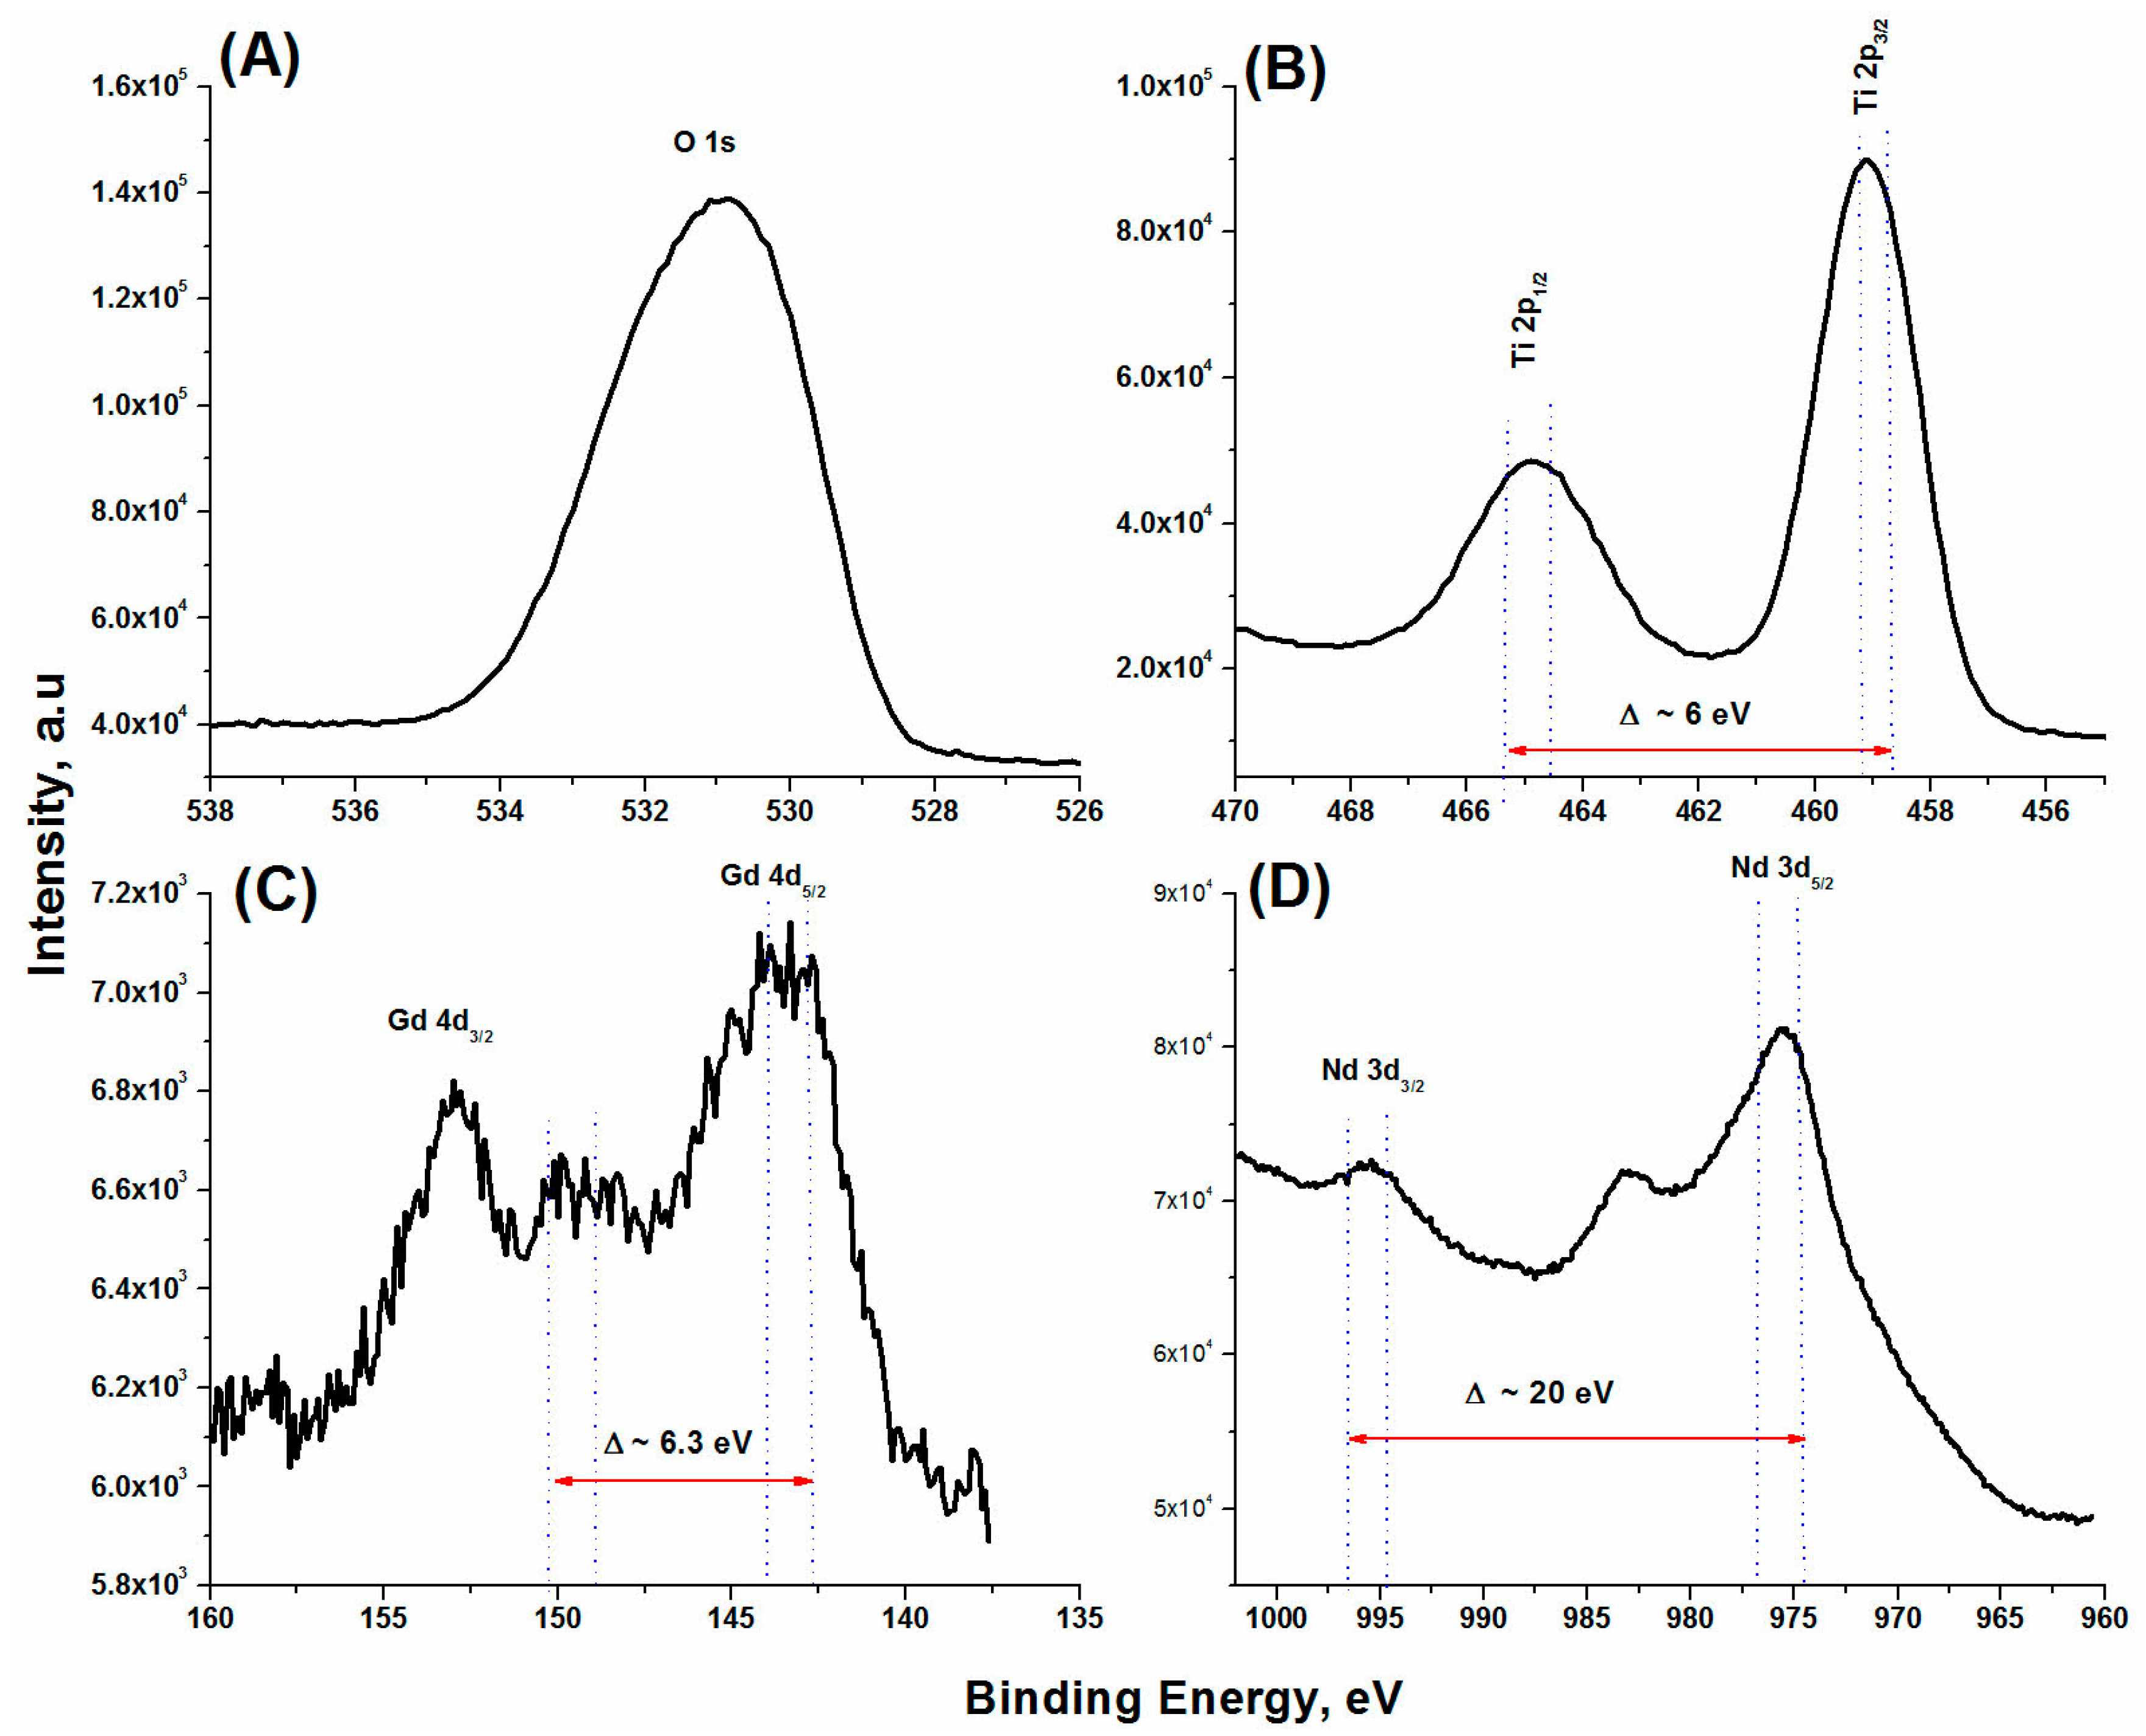
2.2. Composition and Chemical State Analysis
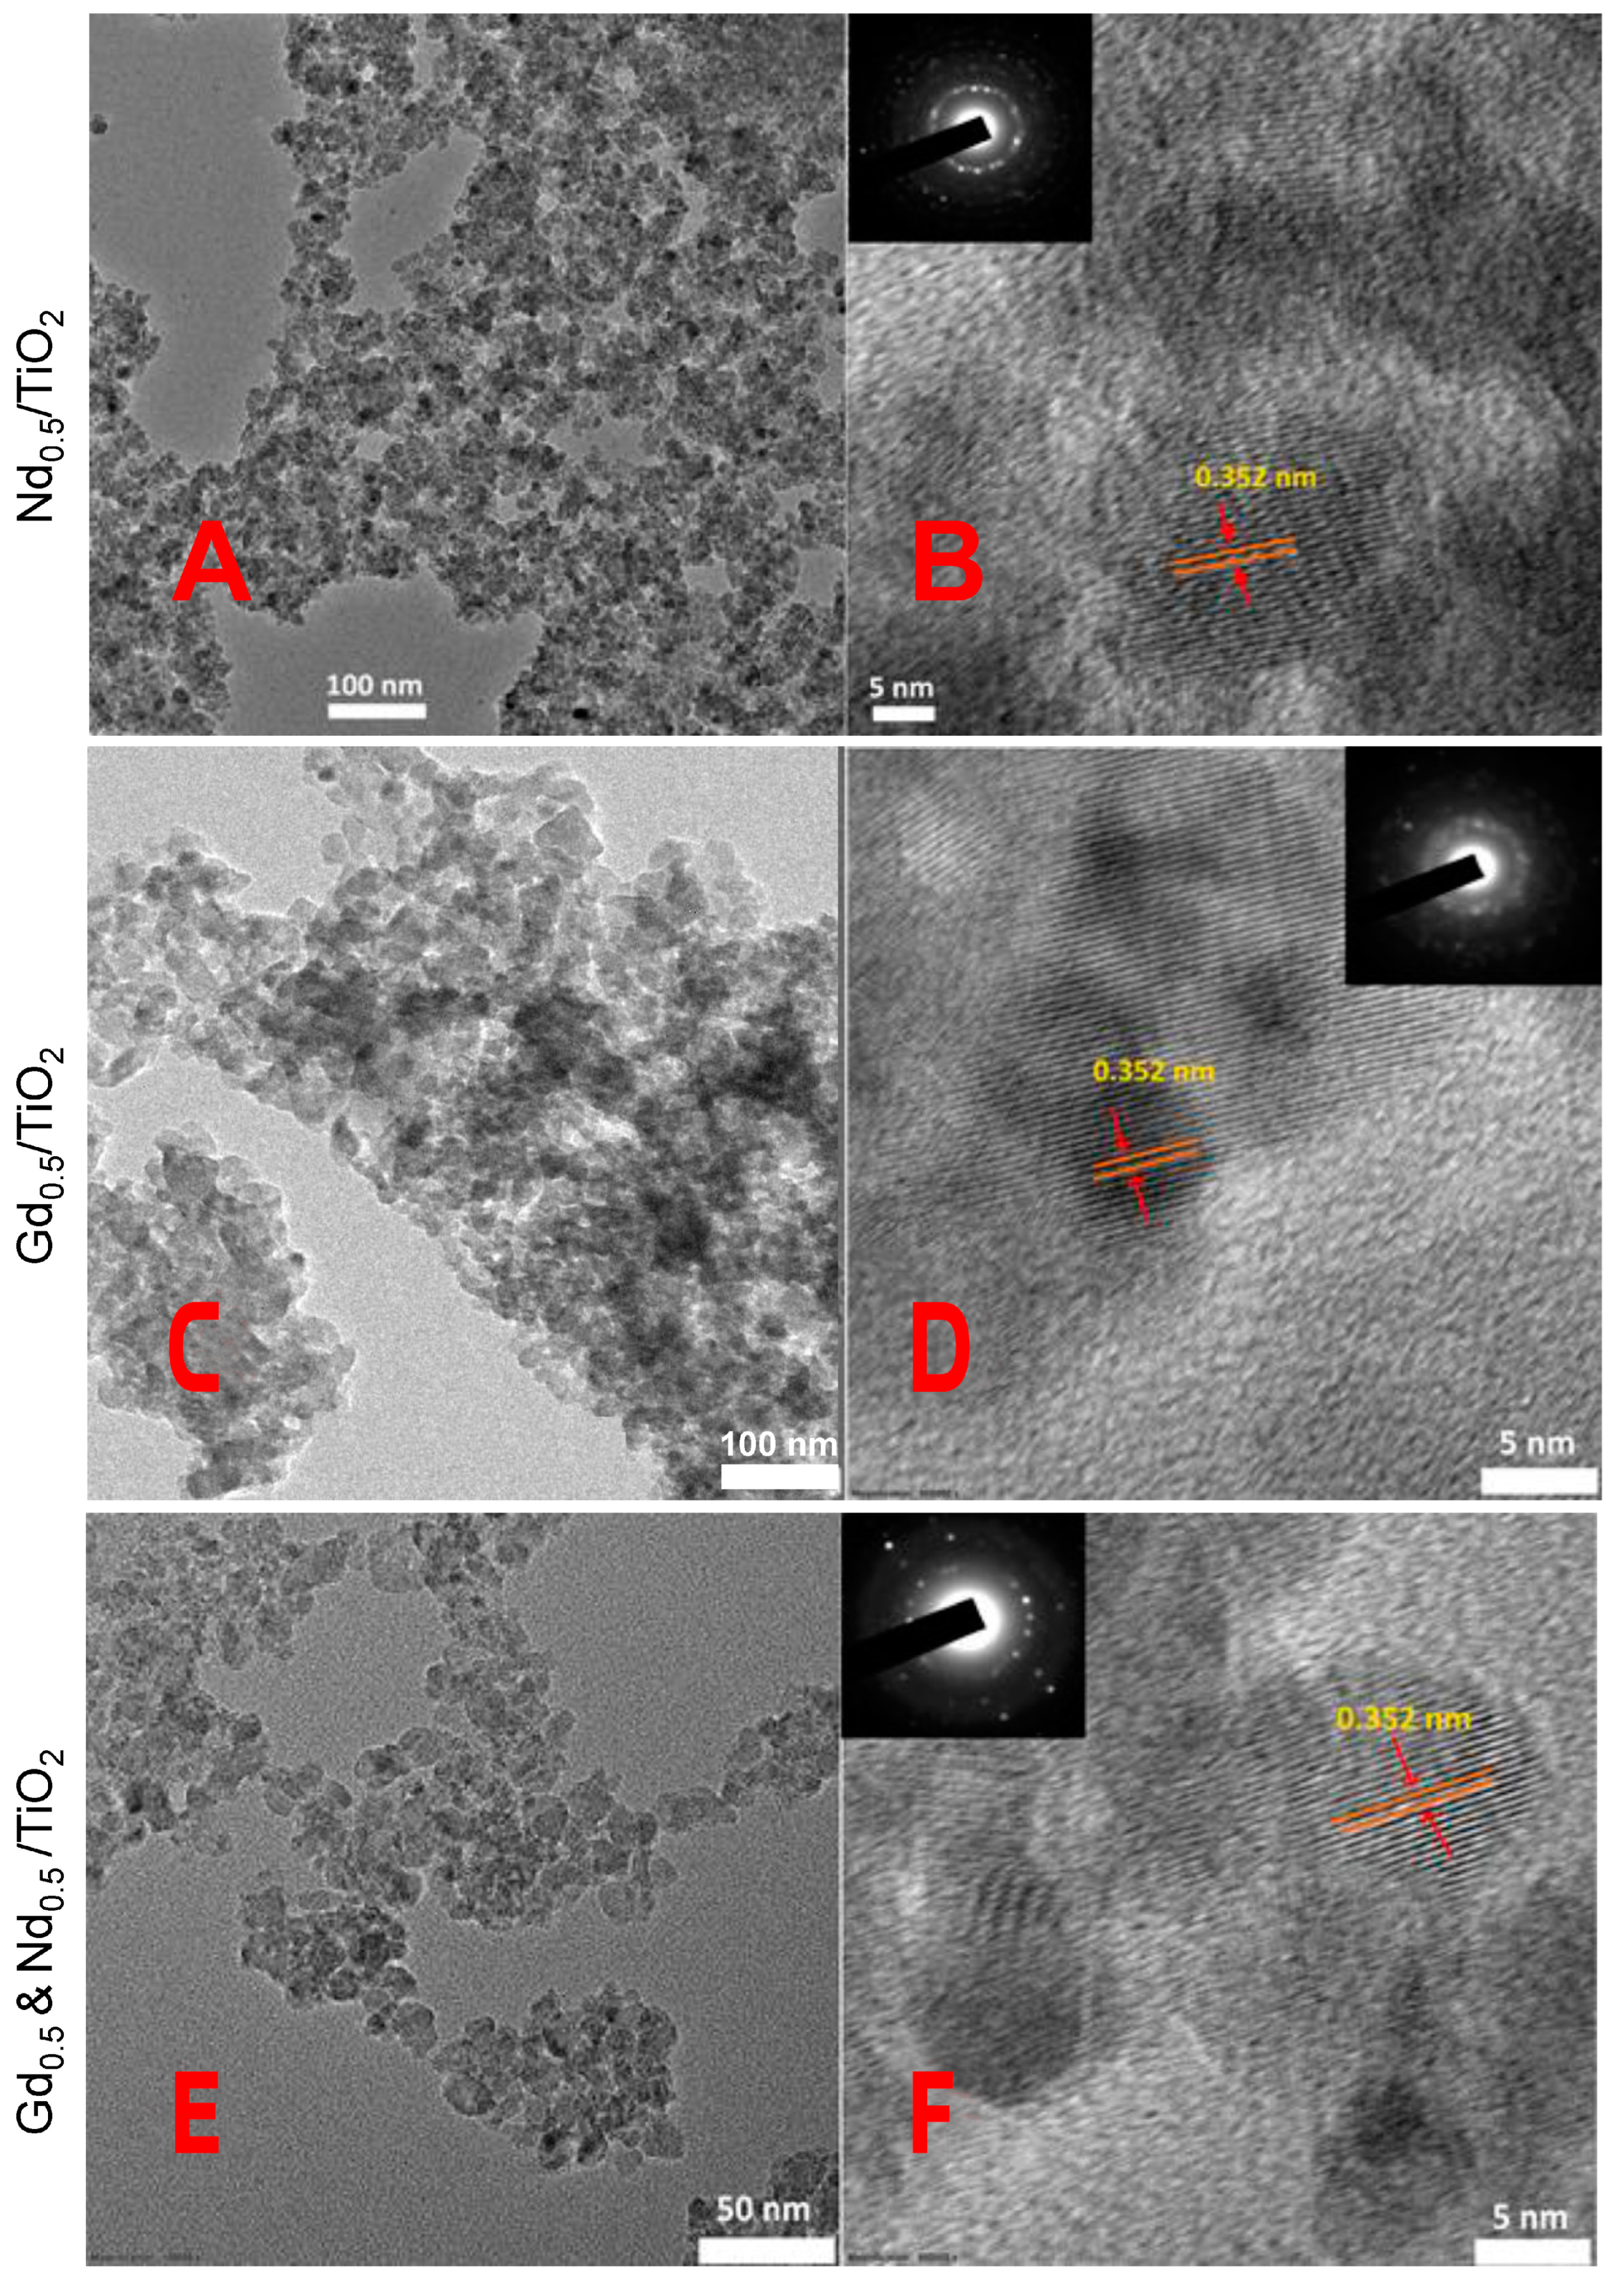
High Resolution Transmission Electron Microscopy (HR-TEM) Analysis
2.3. Electrocatalytic Activity Studies for the Hydrogen Evolution Reaction (HER)
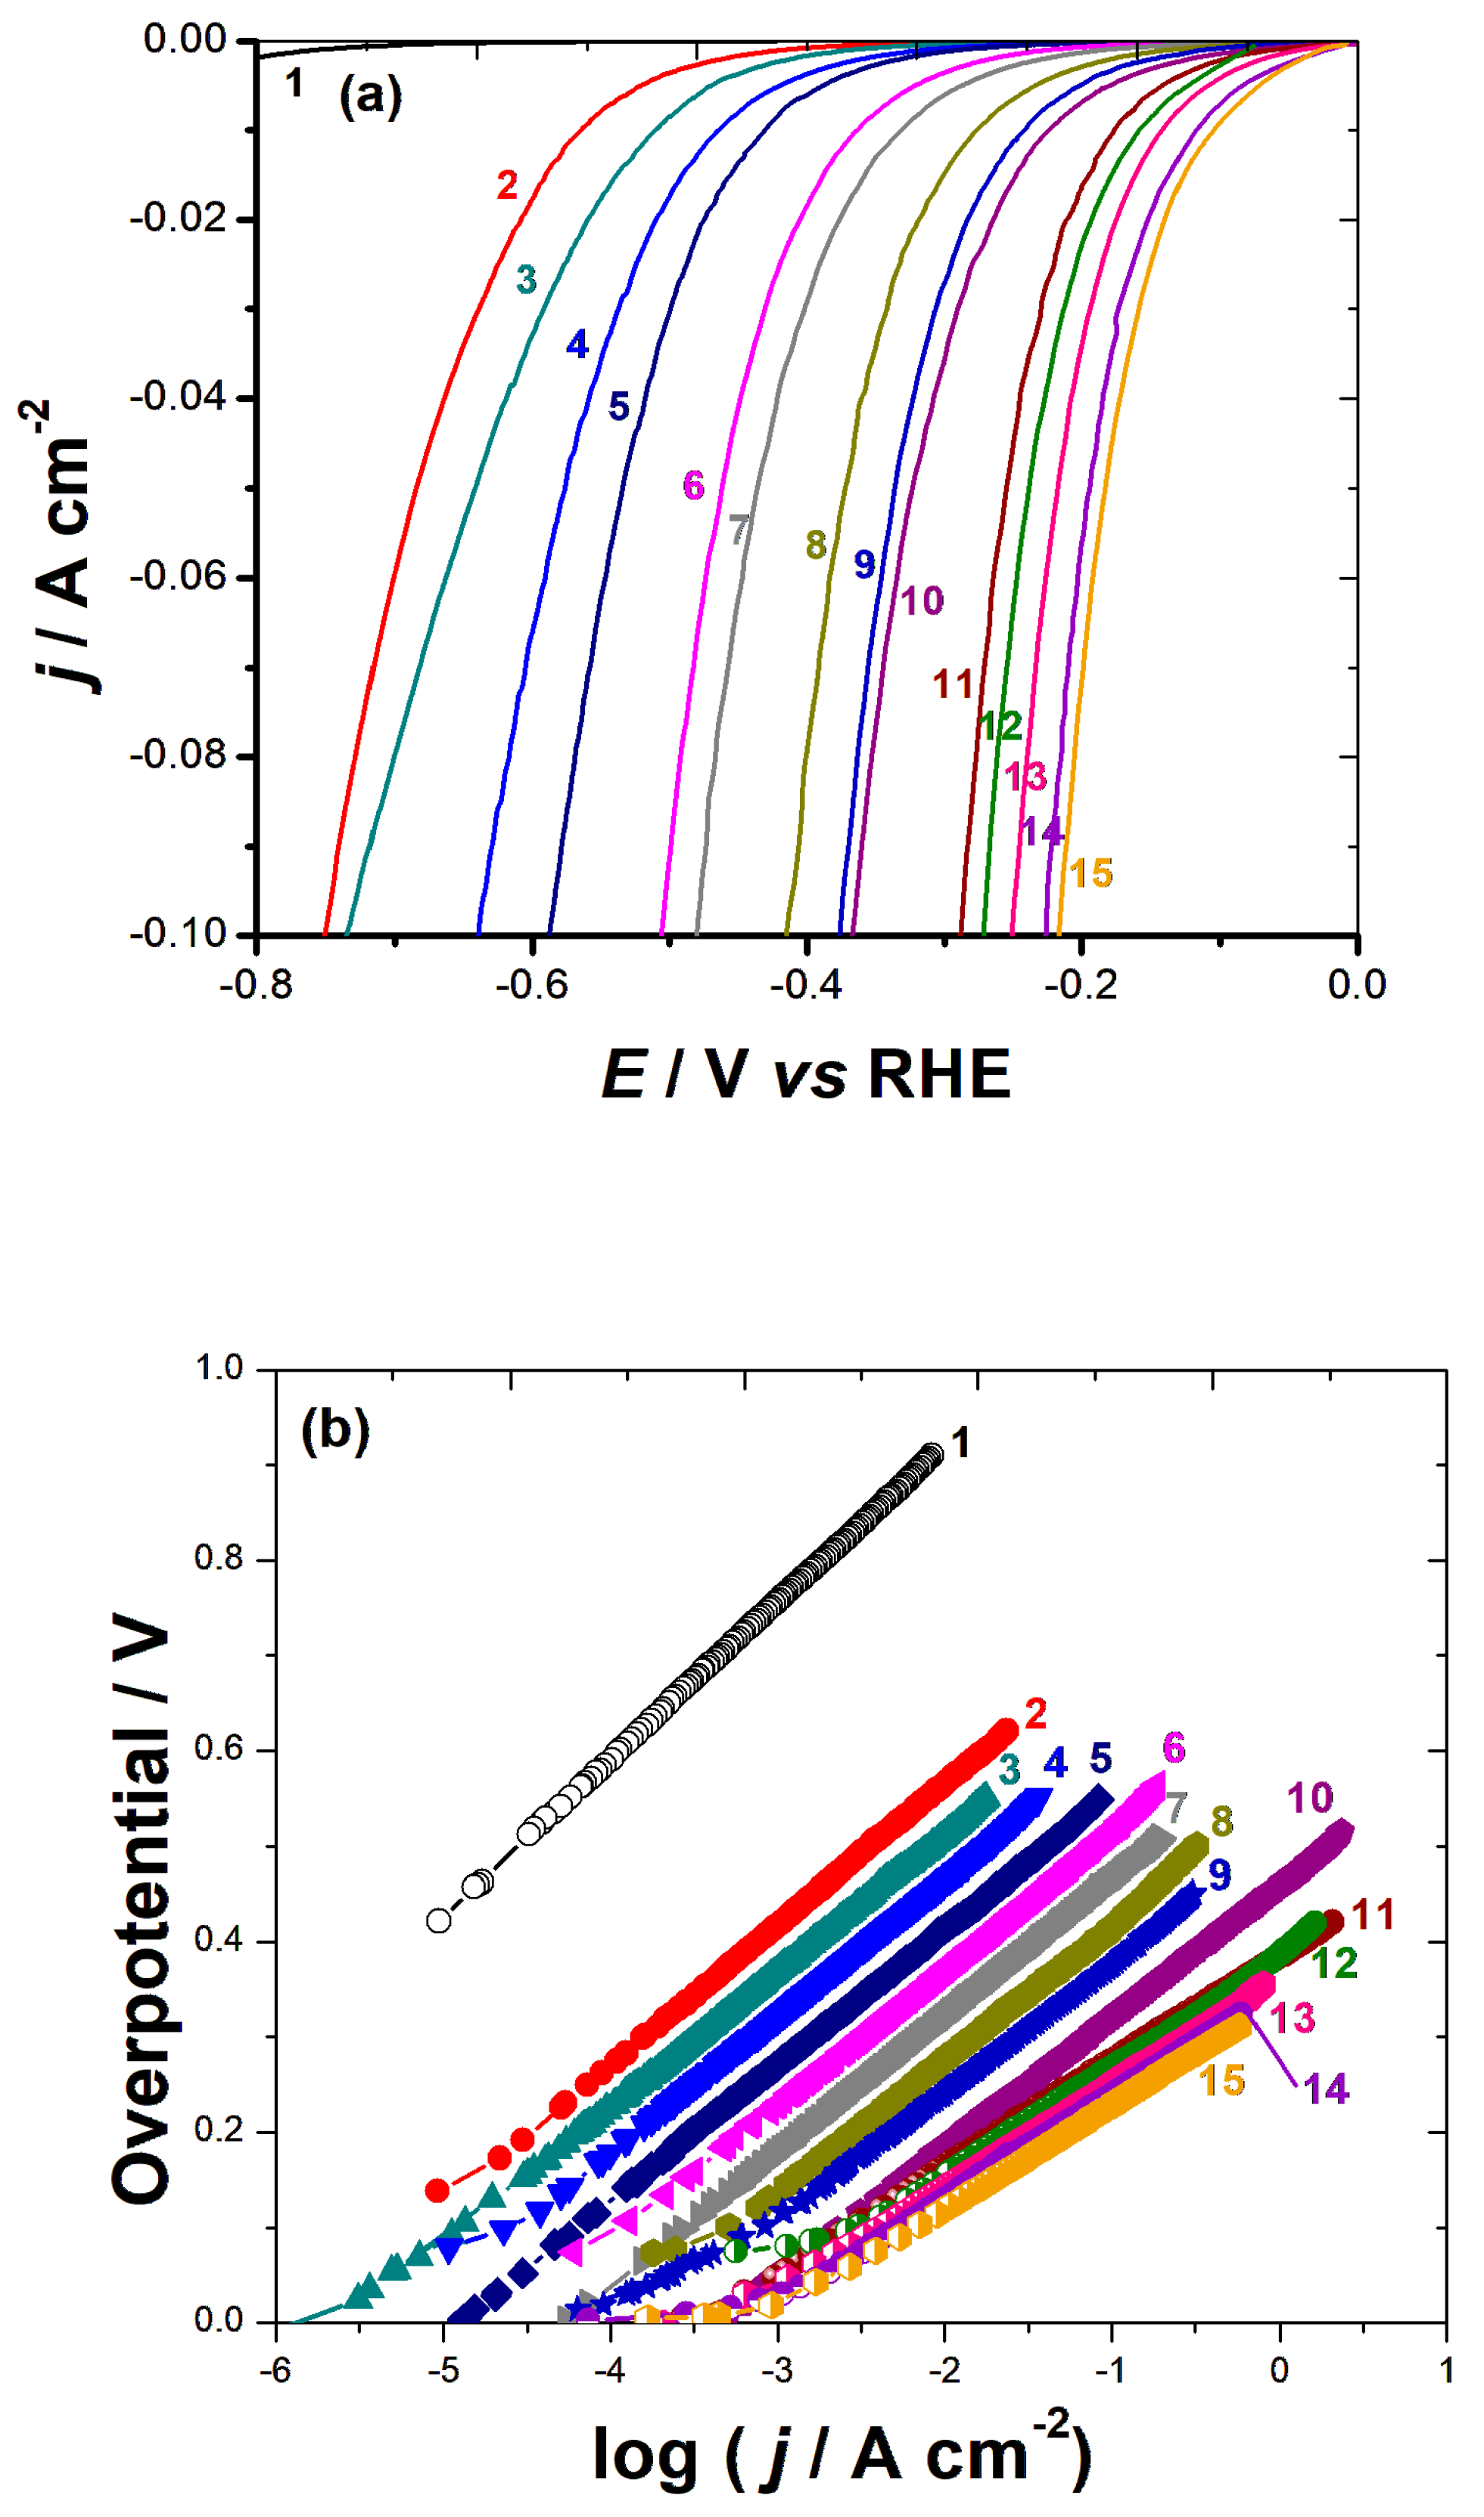
2.3.1. Cathodic Polarization Measurements
2.3.2. Faradaic Efficiency Calculations for the HER
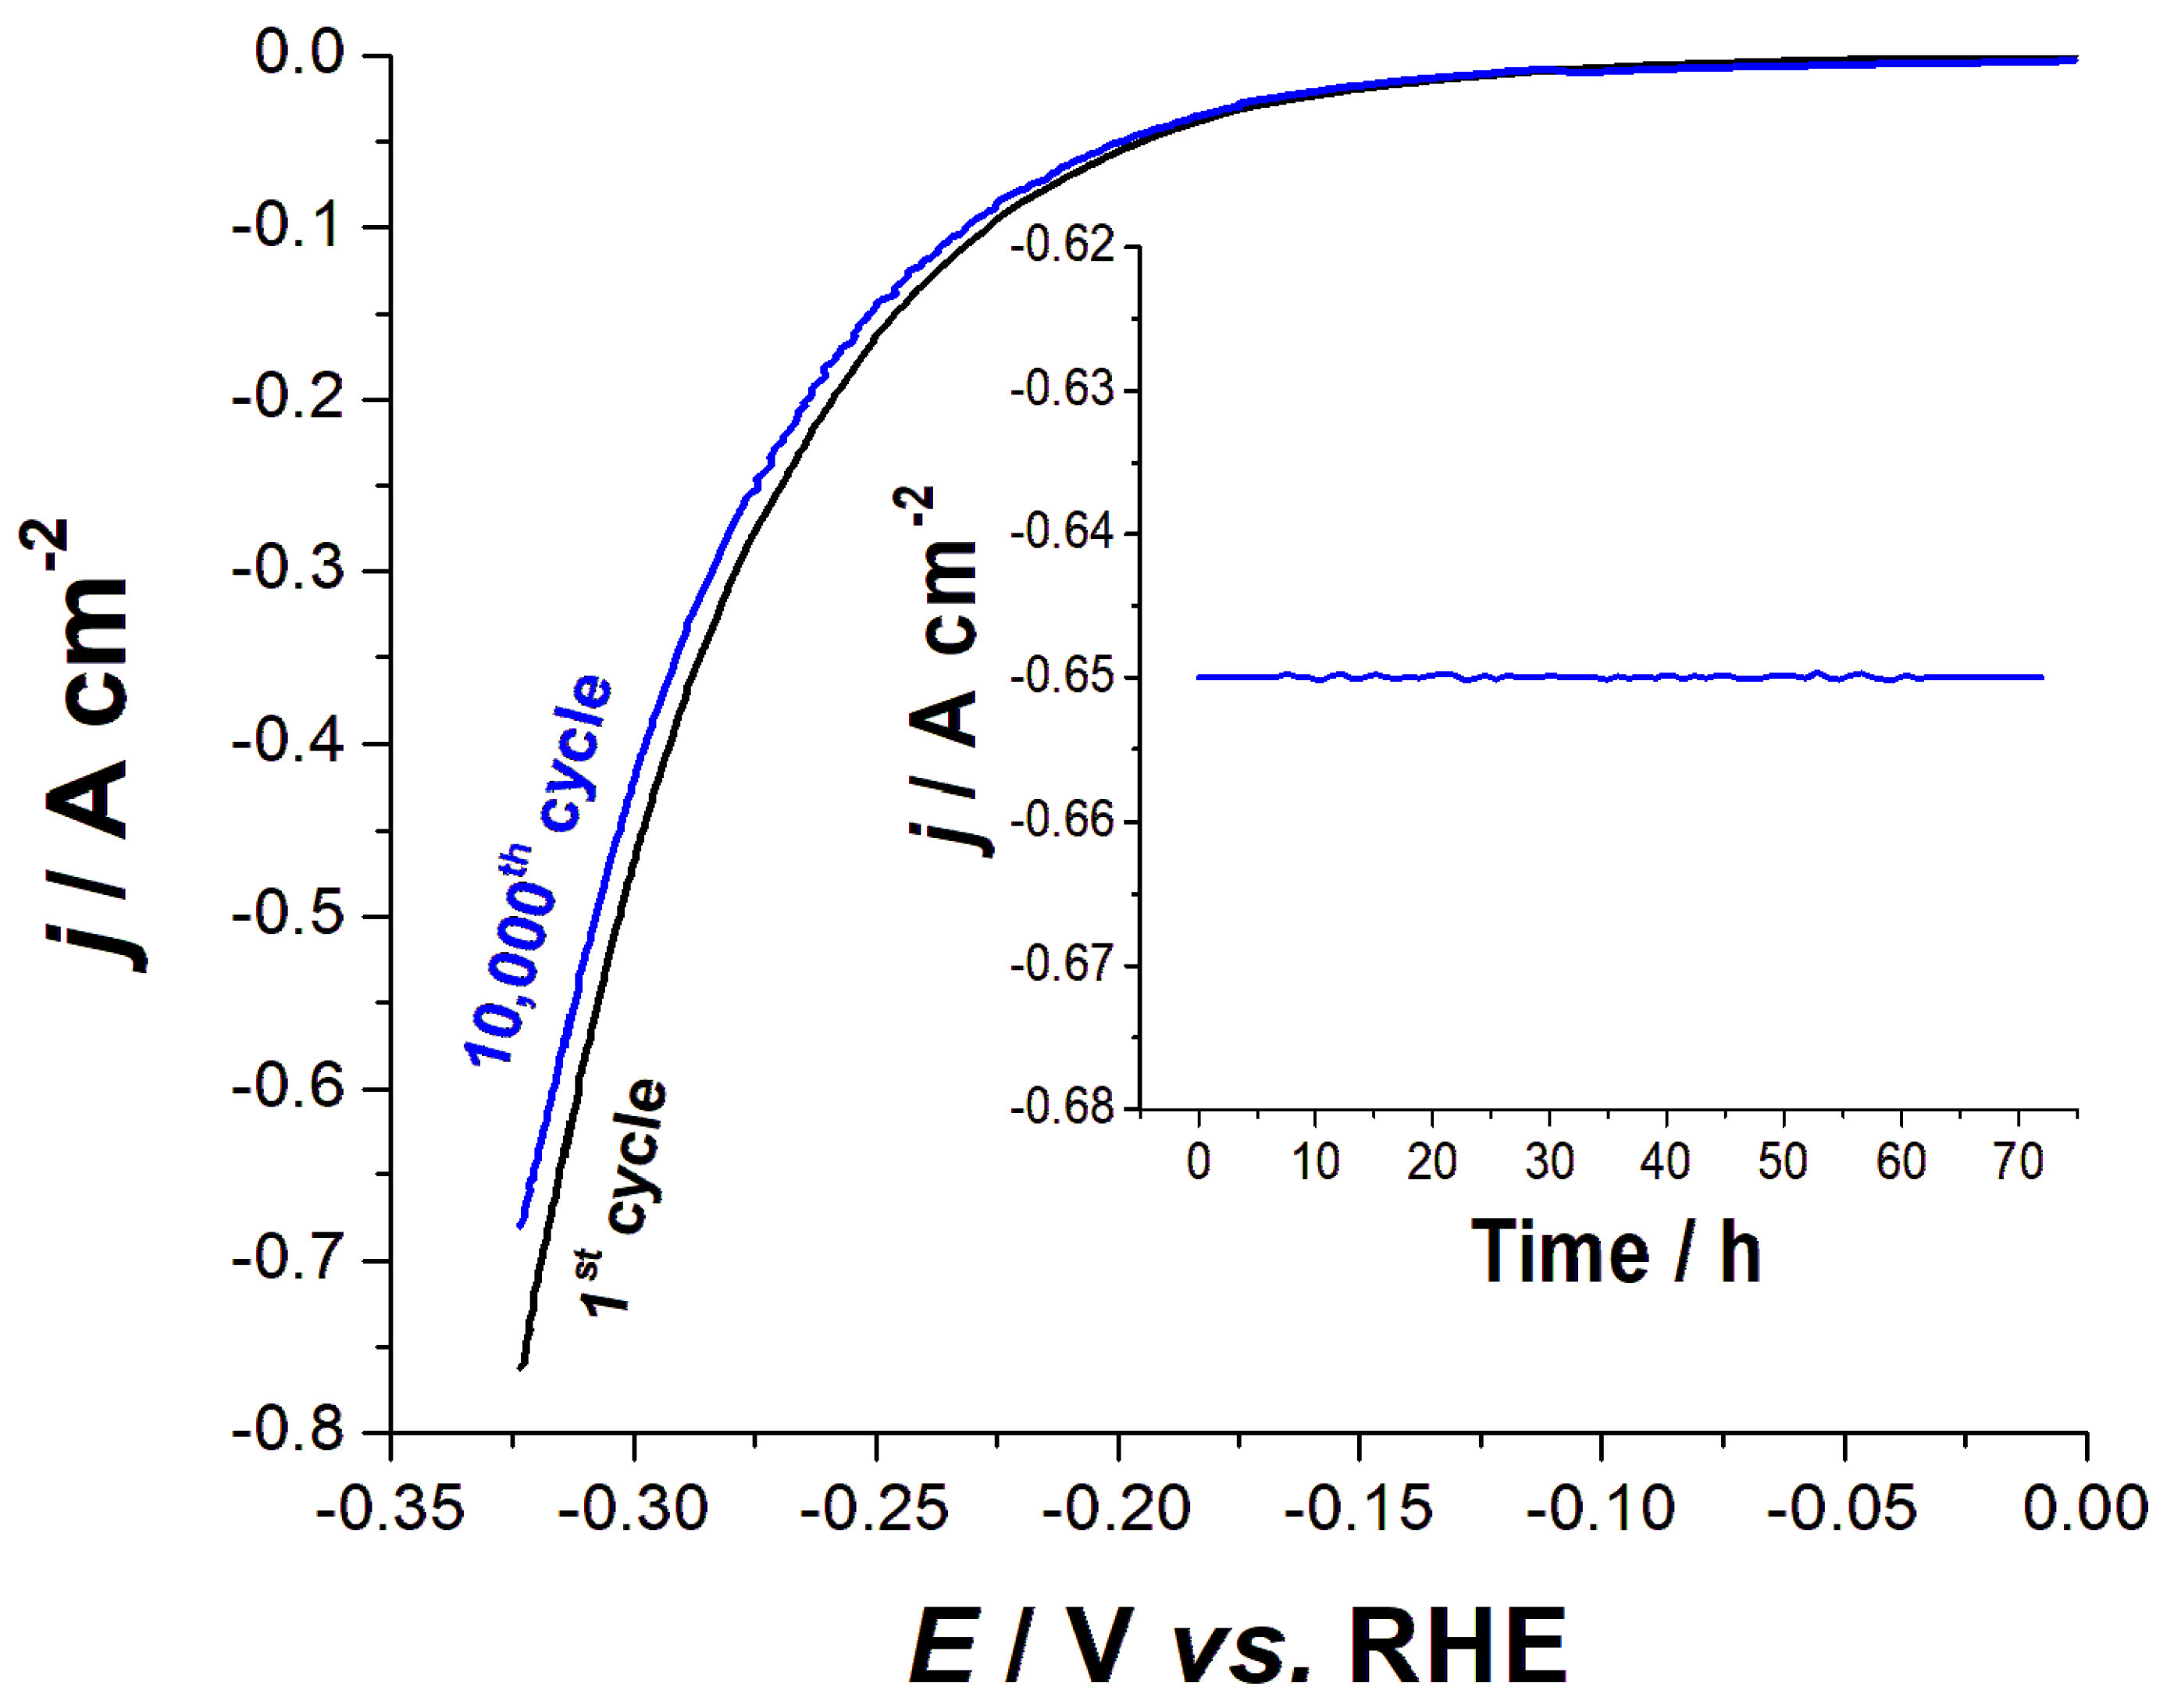
2.4. Best Catalyst’s Long-Term Stability Tests
3. Experimental
3.1. Synthesis of Gd3+- or Nd3+- as Well as 0.5%Gd3+-0.5%Nd3+-Doped TiO2 NPs
3.2. Electrocatalytic Activity Measurements
Electrochemical Setup
4. Conclusions
Supplementary Materials
Author Contributions
Funding
Conflicts of Interest
References
- Morales-Guio, C.G.; Stern, L.A.; Hu, X. Nanostructured hydrotreating catalysts for electrochemical hydrogen evolution. Chem. Soc. Rev. 2014, 43, 6555–6569. [Google Scholar] [CrossRef] [Green Version]
- Rostrup-Nielsen, J.R. Fuels and energy for the future: The role of catalysis. Catal. Rev. Sci. Eng. 2004, 46, 247–270. [Google Scholar] [CrossRef]
- Tee, S.Y.; Win, K.Y.; Teo, W.S.; Koh, L.-D.; Liu, S.; Teng, C.P.; Han, M.-Y. Recent Progress in Energy-Driven Water Splitting. Adv. Sci. 2017, 4, 1600337. [Google Scholar] [CrossRef] [Green Version]
- You, B.; Sun, Y. Innovative Strategies for Electrocatalytic Water Splitting. Acc. Chem. Res. 2018, 51, 1571–1580. [Google Scholar] [CrossRef]
- Sapountzi, F.M.; Gracia, J.M.; Weststrate, C.J.; Fredriksson, H.O.A.; Niemantsverdriet, J.W. Electrocatalysts for the generation of hydrogen, oxygen and synthesis gas. Prog. Energy Combust. Sci. 2017, 58, 1–35. [Google Scholar] [CrossRef] [Green Version]
- Yan, Y.; Xia, B.; Xu, Z.; Wang, X. Recent development of molybdenum sulfides as advanced electrocatalysts for hydrogen evolution reaction. ACS Catal. 2014, 4, 1693–1705. [Google Scholar] [CrossRef]
- Faber, M.S.; Jin, S. Earth-abundant inorganic electrocatalysts and their nanostructures for energy conversion applications. Energy Environ. Sci. 2014, 7, 3519–3542. [Google Scholar] [CrossRef]
- Xu, Y.; Zhang, B. Recent advances in porous Pt-based nanostructures: Synthesis and electrochemical applications. Chem. Soc. Rev. 2014, 43, 2439–2450. [Google Scholar] [CrossRef]
- Roy, N.; Leung, K.T.; Pradhan, D. Nitrogen doped reduced graphene oxide-based Pt-TiO2 nanocomposites for enhanced hydrogen evolution. J. Phys. Chem. C 2015, 119, 19117–19125. [Google Scholar] [CrossRef]
- Esposito, D.V.; Hunt, S.T.; Kimmel, Y.C.; Chen, J.G. A new class of electrocatalysts for hydrogen production from water electrolysis: Metal monolayers supported on low-cost transition metal carbides. J. Am. Chem. Soc. 2012, 134, 3025–3033. [Google Scholar] [CrossRef]
- Esposito, D.V.; Chen, J.G. Monolayer platinum supported on tungsten carbides as low-cost electrocatalysts: Opportunities and limitations. Energy Environ. Sci. 2011, 4, 3900–3912. [Google Scholar] [CrossRef]
- Jiao, F.; Frei, H. Nanostructured cobalt and manganese oxide clusters as efficient water oxidation catalysts. Energy Environ. Sci. 2010, 3, 1018–1027. [Google Scholar] [CrossRef]
- Merki, D.; Hu, X. Recent developments of molybdenum and tungsten sulfides as hydrogen evolution catalysts. Energy Environ. Sci. 2011, 4, 3878–3888. [Google Scholar] [CrossRef] [Green Version]
- Padmapriya, S.; Harinipriya, S.; Sudha, V.; Kumar, D.; Pal, S.; Chaubey, B. Polyaniline coated copper for hydrogen storage and evolution in alkaline medium. Int. J. Hydrogen Energy 2017, 42, 20453–20462. [Google Scholar] [CrossRef]
- Wang, J.; Gao, Y.; Kong, H.; Kim, J.; Choi, S.; Ciucci, F.; Hao, Y.; Yang, S.; Shao, Z.; Lim, J. Non-precious-metal catalysts for alkaline water electrolysis: Operando characterizations, theoretical calculations, and recent advances. Chem. Soc. Rev. 2020, 49, 9154–9196. [Google Scholar] [CrossRef]
- Wang, J.; Kim, S.-J.; Liu, J.; Gao, Y.; Choi, S.; Han, J.; Shin, H.; Jo, S.; Kim, J.; Ciucci, F.; et al. Redirecting dynamic surface restructuring of a layered transition metal oxide catalyst for superior water oxidation. Nat. Catal. 2021, 4, 212–222. [Google Scholar] [CrossRef]
- Wang, J.; Gao, Y.; Ciucci, F. Mechanochemical Coupling of MoS2 and Perovskites for Hydrogen Generation. ACS Appl. Energy Mater. 2018, 1, 6409–6416. [Google Scholar] [CrossRef]
- Chen, W.-F.; Sasaki, K.; Ma, C.; Frenkel, A.I.; Marinkovic, N.J.; Muckerman, T.; Zhu, Y.; Adzic, R.R. Hydrogen-evolution catalysts based on non-noble metal nickel-molybdenum nitride nanosheets. Angew. Chem. Int. Ed. 2012, 51, 6131–6135. [Google Scholar] [CrossRef]
- Hsu, I.J.; Kimmel, Y.C.; Jiang, X.; Willis, B.G.; Chen, J.G. Atomic layer deposition synthesis of platinum-tungsten carbide core-shell catalysts for the hydrogen evolution reaction. Chem. Commun. 2012, 48, 1063–1065. [Google Scholar] [CrossRef]
- Kong, D.; Wang, H.; Lu, Z.; Cui, Y. CoSe2 nanoparticles grown on carbon fiber paper: An efficient and stable electrocatalyst for hydrogen evolution reaction. J. Am. Chem. Soc. 2014, 136, 4897–4900. [Google Scholar] [CrossRef]
- Zhang, J.; Zhu, Z.; Tang, Y.; Muellen, K.; Feng, X. Titania nanosheet-mediated construction of a two-dimensional titania/cadmium sulfide heterostructure for high hydrogen evolution activity. Adv. Mater. 2014, 26, 734–738. [Google Scholar] [CrossRef] [PubMed]
- Xu, H.; Yan, B.; Zhang, K.; Wang, J.; Li, S.; Wang, C.; Shiraishi, Y.; Du, Y.; Yang, P. Ultrasonicassisted synthesis of N-doped graphene-supported binary PdAu nanoflowers for enhanced electro-oxidation of ethylene glycol and glycerol. Electrochim. Acta 2017, 245, 227–236. [Google Scholar] [CrossRef]
- Xu, H.; Zhang, K.; Yan, B.; Wang, J.; Wang, C.; Li, S.; Gu, Z.; Du, Y.; Yang, P. Ultrauniform PdBi nanodots with high activity towards formic acid oxidation. J. Power Sources 2017, 356, 27–35. [Google Scholar] [CrossRef]
- Xu, H.; Yan, B.; Wang, J.; Zhang, K.; Li, S.; Xiong, Z.; Wang, C.; Shiraishi, Y.; Du, Y.; Yang, P. Self-supported porous 2D AuCu triangular nanoprisms as model electrocatalysts for ethylene glycol and glycerol oxidation. J. Mater. Chem. A 2017, 5, 15932–15939. [Google Scholar] [CrossRef]
- Xu, H.; Wang, J.; Yan, B.; Zhang, K.; Li, S.; Wang, C.; Shiraishi, Y.; Du, Y.; Yang, P. Hollow AuxAg/Au core/shell nanospheres as efficient catalysts for electrooxidation of liquid fuels. Nanoscale 2017, 9, 12996–13003. [Google Scholar] [CrossRef]
- Greeley, J.; Jaramillo, T.F.; Bonde, J.; Chorkendorff, I.; Norskov, J.K. Computational high-throughput screening of electrocatalytic materials for hydrogen evolution. Nat. Mater. 2006, 5, 909–913. [Google Scholar] [CrossRef]
- Darabdhara, G.; Amin, M.A.; Mersal, G.A.M.; Ahmed, E.M.; Das, M.R.; Zakaria, M.B.; Malgras, V.; Alshehri, S.M.; Yamauchi, Y.; Szunerits, S.; et al. Reduced graphene oxide nanosheets decorated with Au, Pd and Au-Pd bimetallic nanoparticles as highly efficient catalysts for electrochemical hydrogen generation. J. Mater. Chem. A 2015, 3, 20254–20266. [Google Scholar] [CrossRef]
- Totha, P.S.; Velicky, M.; Slater, T.J.A.; Worrall, S.D.; Haigh, S.J. Hydrogen evolution and capacitance behavior of Au/Pd nanoparticle-decorated graphene heterostructures. Appl. Mater. Today 2017, 8, 125–131. [Google Scholar] [CrossRef]
- Darabdhara, G.; Das, M.R.; Amin, M.A.; Mersal, G.A.M.; Mostafa, N.Y.; Abd El-Rehim, S.S.; Szunerits, S.; Boukherroub, R. Au-Ni alloy nanoparticles supported on reduced graphene oxide as highly efficient electrocatalysts for hydrogen evolution and oxygen reduction reactions. Int. J. Hydrogen Energy 2018, 43, 1424–1438. [Google Scholar] [CrossRef]
- Mandegarzad, S.; Raoof, J.B.; Hosseini, S.R.; Ojani, R. Cu-Pt bimetallic nanoparticles supported metal organic framework-derived nanoporous carbon as a catalyst for hydrogen evolution reaction. Electrochim. Acta 2016, 190, 729–736. [Google Scholar] [CrossRef]
- Wang, L.; Qi, B.; Sun, L.; Sun, Y.; Guo, C.; Li, Z. Synthesis and assembly of Au-Pt bimetallic nanoparticles. Mater. Lett. 2008, 62, 1279–1282. [Google Scholar] [CrossRef]
- Raoof, J.-B.; Ojani, R.; Rashid-Nadimi, S. Electrochemical synthesis of bimetallic Au@Pt nanoparticles supported on gold film electrode by means of self-assembled monolayer. J. Electroanal. Chem. 2010, 641, 71–77. [Google Scholar] [CrossRef]
- Chen, Y.-L.; Xiong, L.; Song, X.-N.; Wang, W.-K.; Huang, Y.-X.; Yu, H.-Q. Electrocatalytic hydrodehalogenation of atrazine in aqueous solution by Cu@Pd/Ti catalyst. Chemosphere 2015, 125, 57–63. [Google Scholar] [CrossRef]
- Li, S.S.; Wang, A.J.; Hu, Y.Y.; Fang, K.M.; Chen, J.R.; Feng, J.J. One-step, seedless wet-chemical synthesis of gold@palladium nanoflowers supported on reduced graphene oxide with enhanced electrocatalytic properties. J. Mater. Chem. A 2014, 2, 18177–18183. [Google Scholar] [CrossRef]
- Ma, X.; Zhao, K.; Tang, H.; Chen, Y.; Lu, C.; Liu, W.; Gao, Y.; Zhao, H.; Tang, Z. New insight into the role of gold nanoparticles in Au@CdS core-shell nanostructures for hydrogen evolution. Small 2014, 10, 4664–4670. [Google Scholar] [CrossRef] [PubMed]
- Lang, L.; Shi, Y.; Wang, J.; Wang, F.-B.; Xia, X.-H. Hollow core-shell structured Ni-Sn@C nanoparticles: A novel electrocatalyst for the hydrogen evolution reaction. ACS Appl. Mater. Interfaces 2015, 7, 9098–9102. [Google Scholar] [CrossRef]
- ICDD. PDF 2, Database Sets 1–45; The International Centre for Diffraction Data: Newtown Square, PA, USA, 1995. [Google Scholar]
- Lutterotti, L.; Scardi, P. Simultaneous structure and size-strain refinement by the Rietveld method. J. Appl. Crystallogr. 1990, 23, 246–252. [Google Scholar] [CrossRef]
- Lutterotti, L. Total pattern fitting for the combined size–strain–stress–texture determination in thin film diffraction. Nucl. Instrum. Methods Phys. Res. B 2010, 268, 334–340. [Google Scholar] [CrossRef]
- ICSD Database, Version 2005-1; Fachinformationszentrum Karlsruhe: Eggenstein-Leopoldshafen, Germany; U.S. Department of Commerce: Washington, DC, USA, 2005.
- Vegard, L. The Constitution of Mixed Crystals and the Space Occupied by Atoms. Z. Phys. 1921, 5, 17–26. [Google Scholar] [CrossRef]
- Wagner, C.D.; Gale, L.H.; Raymond, R.H. Two-dimensional chemical state plots: A standardized data set for use in identifying chemicalstates by X-ray photoelectron spectroscopy. Anal. Chem. 1979, 51, 466–482. [Google Scholar] [CrossRef]
- Choi, J.; Sudhagar, P.; Lakshmipathiraj, P.; Lee, J.W.; Devadoss, A.; Lee, S.; Song, T.; Hong, S.; Eito, S.; Terashima, C.; et al. Three-dimensional Gd-doped TiO2 fibrous photoelectrodes for efficient visible light-driven photocatalytic performance. RSC Adv. 2014, 4, 11750–11757. [Google Scholar] [CrossRef]
- He, Y.-B.; Li, B.; Liu, M.; Zhang, C.; Lv, W.; Yang, C.; Li, J.; Du, H.; Zhang, B.; Yang, Q.H.; et al. Gassing in Li4Ti5O12-based batteries and its remedy. Sci. Rep. 2012, 2, 913. [Google Scholar] [CrossRef] [Green Version]
- Lyu, J.; Gao, J. Construction of homojunction-adsorption layer on anatase TiO2 to improve photocatalyticmineralization of volatile organic compounds. Appl. Catal. B 2017, 202, 664–667. [Google Scholar] [CrossRef]
- Wang, M.; Xu, X.; Lin, L.; He, D. Gd–La codoped TiO2 nanoparticles as solar photocatalysts. Prog. Nat. Sci. 2015, 35, 6–11. [Google Scholar] [CrossRef] [Green Version]
- Rengaraj, S.; Venkataraj, S.; Yeon, J.-W.; Kim, Y.; Li, X.Z.; Pang, G.K.H. Preparation, characterization and application of Nd–TiO2 photocatalyst for the reduction of Cr(VI) under UV light illumination. Appl. Catal. B 2007, 77, 157–165. [Google Scholar] [CrossRef]
- Yang, C.H.; Ma, Z.Q.; Li, F.; He, B.; Yuan, J.H.; Zhang, Z.H. Spectrum analysis on phase transformations in TiO2 thin films. Acta Phys.-Chim. Sin. 2010, 26, 1349–1354. [Google Scholar]
- Raiser, D.; Deville, J.P. Study of XPS photoemission of some gadolinium compounds. J. Electron Spectrosc. 1991, 57, 91–97. [Google Scholar] [CrossRef]
- Wang, C.; Ao, Y.; Wang, P.; Hou, J.; Qian, J. Preparation, characterization and photocatalytic activity of the neodymium-doped TiO2 hollow spheres. Appl. Surf. Sci. 2010, 257, 227–231. [Google Scholar] [CrossRef]
- Ibrahim, M.M.; Mezni, A.; Alsawat, M.; Kumeria, T.; Das, M.R.; Alzahly, S.; Aldalbahi, A.; Gornicka, K.; Ryl, J.; Amin, M.A.; et al. Enhanced hydrogen evolution reaction on highly stable titania-supported PdO and Eu2O3 nanocomposites in a strong alkaline solution. Int. J. Energy Res. 2019, 43, 5367–5383. [Google Scholar] [CrossRef]
- Mezni, A.; Ibrahim, M.M.; El-Kemary, M.; Shaltout, A.A.; Mostafa, N.Y.; Ryl, J.; Kumeria, T.; Altalhi, T.; Amin, M.A. Cathodically Activated Au/TiO2 Nanocomposite Synthesized by a New Facile Solvothermal Method: An Efficient Electrocatalyst with Pt-like Activity for Hydrogen Generation. Electrochim. Acta 2018, 290, 404–418. [Google Scholar] [CrossRef]
- Amin, M.A.; Ahmed, E.M.; Mostafa, N.Y.; Alotibi, M.M.; Darabdhara, G.; Das, M.R.; Wysocka, J.; Ryl, J.; Abd El-Rehim, S.S. Aluminum Titania Nanoparticle Composites as Nonprecious Catalysts for Efficient Electrochemical Generation of H2. ACS Appl. Mater. Interfaces 2016, 8, 23655–23667. [Google Scholar] [CrossRef] [PubMed]
- Ibrahim, M.M.; Mezni, A.; Alsawat, M.; Kumeria, T.; Alrooqi, A.; Shaltout, A.A.; Ahmed, S.I.; Boukherroub, R.; Amin, M.A.; Altalhi, T. Crystalline ZnO and ZnO/TiO2 nanoparticles derived from tert-butyl N-(2 mercaptoethyl)carbamatozinc(II) chelate: Electrocatalytic studies for H2 generation in alkaline electrolytes. Int. J. Energy Res. 2020, 44, 6725–6744. [Google Scholar] [CrossRef]
- Lu, Q.; Hutchings, G.S.; Yu, W.; Zhou, Y.; Forest, R.V.; Tao, R.; Rosen, J.; Yonemoto, B.T.; Cao, Z.; Zheng, H.; et al. Highly porous non-precious bimetallic elec for efficient hydrogen evolution. Nat. Commun. 2015, 6, 6567. [Google Scholar] [CrossRef] [PubMed] [Green Version]
- Mahmood, N.; Yao, Y.; Zhang, J.-W.; Pan, L.; Zhang, X.; Zou, J.-J. Electrocatalysts for Hydrogen Evolution in Alkaline Electrolytes: Mechanisms, Challenges, and Prospective Solutions. Adv. Sci. 2018, 5, 1700464. [Google Scholar] [CrossRef]
- Durst, J.; Siebel, A.; Simon, C.; Hasche, F.; Herranz, J.; Gasteiger, H.A. New Insights into the Electrochemical Hydrogen Oxidation and Evolution Reaction Mechanism. Energy Environ. Sci. 2014, 7, 2255–2260. [Google Scholar] [CrossRef] [Green Version]
- Shinagawa, T.; Garcia-Esparza, A.T.; Takanabe, K. Insight on Tafel Slopes from A Microkinetic Analysis of Aqueous Electrocatalysis for Energy Conversion. Sci. Rep. 2015, 5, 13801. [Google Scholar] [CrossRef]
- Ito, Y.; Cong, W.T.; Fujita, T.; Tang, Z.; Chen, M.W. High Catalytic Activity of Nitrogen and Sulfur Co doped Nanoporous Graphene in the Hydrogen Evolution Reaction. Angew. Chem. Int. Ed. 2015, 54, 2131–2136. [Google Scholar] [CrossRef]
- Zhang, H.C.; Li, Y.J.; Zhang, G.X.; Xu, T.H.; Wan, P.B.; Sun, X.M. A Metallic CoS2 Nanopyramid Array Grown on 3D Carbon Fiber Paper as an Excellent Electrocatalyst for Hydrogen Evolution. J. Mater. Chem. A 2015, 3, 6306–6310. [Google Scholar] [CrossRef]
- Liu, N.; Guo, Y.; Yang, X.; Lin, H.; Yang, L.; Shi, Z.; Zhong, Z.; Wang, S.; Tang, Y.; Gao, Q. Microwave-Assisted Reactant-Protecting Strategy Toward Efficient MoS2 Electrocatalysts in Hydrogen Evolution Reaction. ACS Appl. Mater. Interfaces 2015, 7, 23741–23749. [Google Scholar] [CrossRef]
- Kibsgaard, J.; Jaramillo, T.F. Molybdenum Phosphosulfide: An Active, Acid-Stable, Earth-Abundant Catalyst for the Hydrogen Evolution Reaction. Angew. Chem. Int. Ed. 2014, 53, 14433–14437. [Google Scholar] [CrossRef]
- Liu, Y.-R.; Shang, X.; Gao, W.-K.; Dong, B.; Chi, J.-Q.; Li, X.; Yan, K.-L.; Chai, Y.-M.; Liu, Y.-Q.; Liu, C.-G. Ternary CoS2/MoS2/RGO Electrocatalyst with CoMoS Phase for Efficient Hydrogen Evolution. Appl. Surf. Sci. 2017, 412, 138–145. [Google Scholar] [CrossRef]
- Beyene, B.B.; Mane, S.B.; Hung, C.-H. Highly efficient electrocatalytic hydrogen evolution from neutral aqueous solution by a water-soluble anionic cobalt(II) porphyrin. Chem. Commun. 2015, 51, 15067–15070. [Google Scholar] [CrossRef]
- Head, D.; Mc Carty, G. Acetylation of N-isopropylideneanilines. Formation of a novel 1,3-oxazetidine derivative. Tetrahedron Lett. 1975, 16, 1405–1408. [Google Scholar]
- Amine, A.; Imen, B.; Adnen, M.; Noureddine, J.; Leila, S. Hybrid Au-Fe3O4 Nanoparticles: Plasmonic, Surface Enhanced Raman Scattering, and Phase Transition Properties. J. Phys. Chem. C 2013, 117, 16166–16174. [Google Scholar]
- Yang, C.; Tang, Y.H.; Lam, W.M.; Lu, W.W.; Gao, P.; Zhao, C.B.; Yuen, M.F. Moisture-cured elastomeric transparent UV and X-ray shielding organic–inorganic hybrids. J. Mater. Sci. 2010, 45, 588–3594. [Google Scholar] [CrossRef] [Green Version]
- Velasco, M.J.; Rubio, F.; Rubio, J.; Oteo, J.L. Hydrolysis of Titanium Tetrabutoxide. Study by FT-IR Spectroscopy. Spectrosc. Lett. 1999, 32, 289–304. [Google Scholar] [CrossRef]
- Mezni, A.; Kouki, F.; Romdhane, S.; Fonrose, B.; Joulie, S.; Mlayah, A.; Smiri, L. Facile Synthesis of Cu-doped ZnO Nanoparticle in Triethyleneglycol: Photocatalytic Activities and Aquatic Ecotoxicity. Mater. Lett. 2012, 86, 153–156. [Google Scholar] [CrossRef]
- Que, W.; Zhou, Y.; Lam, Y.L.; Chan, Y.C.; Kam, C.H. Sol-gel Preparation and Optical Properties of TiO2/Organically Modified Silane Hybrid Material Containing DR13. J. Sol–Gel. Sci. Technol. 2001, 20, 187–195. [Google Scholar] [CrossRef]
- Wang, B.L.; Hu, L.L. Polydimethylsiloxane/silica/titania composites prepared by solvent-free sol-gel technique. Mater. Chem. Phys. 2005, 89, 417–422. [Google Scholar] [CrossRef]
- Vasilyeva, I.; Kuz’micheva, G.; Pochtar, A.; Gainanova, A.; Timaeva, O.; Dorokhov, A.; Podbel’skiy, V. On the nature of the phase “η-TiO2”. New J. Chem. 2016, 40, 151–161. [Google Scholar] [CrossRef]
- Ibrahim, M.M.; Mezni, A.; El-Sheshtawy, H.S.; Abu Zaid, A.A.; Alsawat, M.; El-Shafi, N.; Ahmed, S.I.; Shaltout, A.A.; Amin, M.A.; Kumeria, T.; et al. Direct Z-scheme of Cu2O/TiO2 enhanced self-cleaning, antibacterial activity, and UV protection of cotton fiber under sunlight. Appl. Surf. Sci. 2019, 479, 953–962. [Google Scholar] [CrossRef]
- Wang, C.; Bilan, H.K.; Podlaha, E.J. Electrodeposited Co-Mo-TiO2 Electrocatalysts for the Hydrogen Evolution Reaction. J. Electrochem. Soc. 2019, 166, F661–F669. [Google Scholar] [CrossRef]
- Laszczyńska, A.; Szczygieł, I. Electrocatalytic activity for the hydrogen evolution of the electrodeposited Co–Ni–Mo, Co–Ni and Co–Mo alloy coatings. Int. J. Hydrogen Energy 2020, 45, 508–520. [Google Scholar] [CrossRef]
- Zhou, Y.; Luo, M.; Zhang, W.; Zhang, Z.; Meng, X.; Shen, X.; Liu, H.; Zhou, M.; Zeng, X. Topological Formation of a Mo–Ni-Based Hollow Structure as a Highly Efficient Electrocatalyst for the Hydrogen Evolution Reaction in Alkaline Solutions. ACS Appl. Mater. Interfaces 2019, 11, 21998–22004. [Google Scholar] [CrossRef]
- Gao, M.Y.; Yang, C.; Zhang, Q.B.; Yu, Y.W.; Hua, Y.X.; Li, Y.; Dong, P. Electrochemical fabrication of porous Ni-Cu alloy nanosheets with high catalytic activity for hydrogen evolution. Electrochim. Acta 2016, 215, 609–616. [Google Scholar] [CrossRef]
- Fang, M.; Gao, W.; Dong, G.; Xia, Z.; Yip, S.; Qin, Y.; Qu, Y.; Ho, J.C. Hierarchical NiMo-based 3D electrocatalysts for highly-efficient hydrogen evolution in alkaline conditions. Nano Energy 2016, 27, 247–254. [Google Scholar] [CrossRef]
- Thenuwara, A.C.; Dheer, L.; Attanayake, N.H.; Yan, Q.; Waghmare, U.V.; Strongin, D.R. Co-Mo-P Based Electrocatalyst for Superior Reactivity in the Alkaline Hydrogen Evolution Reaction. ChemCatChem 2018, 10, 4846–4851. [Google Scholar] [CrossRef]
- Zhang, C.; Chen, B.; Mei, D.; Liang, X. The OH−-driven synthesis of Pt–Ni nanocatalysts with atomic segregation for alkaline hydrogen evolution reaction. J. Mater. Chem. A 2019, 7, 5475–5481. [Google Scholar] [CrossRef]
- Rosalbino, F.; Macciò, D.; Saccone, A.; Angelini, E.; Delfino, S. Fe-Mo-R (R = rare earth metal) crystalline alloys as a cathode material for hydrogen evolution reaction in alkaline solution. Int. J. Hydrogen Energy 2011, 36, 1965–1973. [Google Scholar] [CrossRef]
- Cabello, G.; Gromboni, M.F.; Pereira, E.C.; Mascaro, L.H.; Marken, F. Microwave-Electrochemical Deposition of a Fe-Co Alloy with Catalytic Ability in Hydrogen Evolution. Electrochim. Acta 2017, 235, 480–487. [Google Scholar] [CrossRef]
- Liu, G.; Bai, H.; Ji, Y.; Wang, L.; Wen, Y.; Lin, H.; Zheng, L.; Li, Y.; Zhang, B.; Peng, H. A highly efficient alkaline HER Co–Mo bimetallic carbide catalyst with an optimized Mo d-orbital electronic state. J. Mater. Chem. A 2019, 7, 12434–12439. [Google Scholar] [CrossRef]
- Yao, M.; Wang, B.; Sun, B.; Luo, L.; Chen, Y.; Wang, J.; Wang, N.; Komarneni, S.; Niu, X.; Hu, W. Rational design of self-supported Cu@WC core-shell mesoporous nanowires for pH-universal hydrogen evolution reaction. Appl. Catal. B 2021, 280, 119451. [Google Scholar] [CrossRef]
- Ren, J.; Wang, Q.; Xiang, Q.; Yang, C.; Liang, Y.; Li, J.; Liu, J.; Qian, D. O-vacancy-rich and heterostructured Cu/Cu2O/NiO@NiCu foam self-supported advanced electrocatalyst towards hydrogen evolution: An experimental and DFT study. Chem. Eng. Sci. 2023, 280, 119026. [Google Scholar] [CrossRef]
- Fu, H.; Zhang, N.; Lai, F.; Zhang, L.; Chen, S.; Li, H.; Jiang, K.; Zhu, T.; Xu, F.; Liu, T. Surface-regulated platinum–copper nanoframes in electrochemical reforming of ethanol for efficient hydrogen production. ACS Catal. 2022, 12, 11402–11411. [Google Scholar] [CrossRef]
- Zhang, N.; Zhang, Q.; Xu, C.; Li, Y.; Zhang, J.; Wu, L.; Liu, Y.; Fang, Y.; Liu, Z. Optional construction of Cu2O@Fe2O3@CC architecture as a robust multifunctional photoelectronic catalyst for overall water splitting and CO2 reduction. Chem. Eng. J. 2021, 426, 131192. [Google Scholar] [CrossRef]


| Gdx/TiO2 Composites | Ndx/TiO2 Composites | ||||
|---|---|---|---|---|---|
| Sample | Gd, % | TiO2, % | Sample | Nd, % | TiO2, % |
| Gd0.50/TiO2 | 1.80 ± 0.06 | 97.92 ± 0.07 | Nd0.5/TiO2 | 1.13 ± 0.05 | 98.67 ± 0.06 |
| Gd1.0/TiO2 | 2.20 ± 0.07 | 97.46 ± 0.08 | Nd1.0/TiO2 | 2.16 ± 0.07 | 97.45 ± 0.08 |
| Gd3.0/TiO2 | 2.39 ± 0.07 | 97.24 ± 0.08 | Nd3.0/TiO2 | 7.71 ± 0.12 | 90.95 ± 0.14 |
| Gd6.0/TiO2 | 3.07 ± 0.08 | 96.45 ± 0.09 | Nd6.0/TiO2 | 10.89 ± 0.25 | 87.19 ± 0.17 |
| Sample | Gd0.5/TiO2 | Nd0.5/TiO2 | Gd0.5/Nd0.5/TiO2 |
|---|---|---|---|
| Gd | 2.01 ± 0.07 | - | 2.11 ± 0.07 |
| Nd | - | 1.13 ± 0.05 | 1.04 ± 0.05 |
| TiO2 | 97.85 ± 0.07 | 98.67 ± 0.06 | 96.35 ± 0.09 |
| x | Gdx/TiO2 | Ndx/TiO2 | ||||||
|---|---|---|---|---|---|---|---|---|
| a (A) | c (A) | V (A3) | D (nm) | a (A) | c (A) | V (A3) | D (nm) | |
| 0.5 | 3.7872 (14) | 9.499 (4) | 136.24 (16) | 21 (2) | 3.7834 (12) | 9.454 (4) | 135.33 (14) | 12 (1) |
| 1.0 | 3.7885 (15) | 9.497 (5) | 136.31 (17) | 19 (2) | 3.7863 (15) | 9.447 (5) | 135.43 (17) | 11 (1) |
| 3.0 | 3.7895 (14) | 9.497 (4) | 136.39 (16) | 18 (1) | 3.7928 (16) | 9.425 (5) | 135.58 (18) | 10 (2) |
| 6.0 | 3.7899 (16) | 9.496 (5) | 136.40 (18) | 18 (1) | 3.7964 (14) | 9.405 (4) | 135.56 (16) | 10 (2) |
| 0.5%Gd-0.5%Nd/TiO2 | Pure TiO2 | |||||||
| 3.7915 (18) | 9.452 (3) | 135.87 (17) | 12 (2) | 3.7854 (14) | 9.4842 (5) | 135.9 (17) | 17 (3) | |
| Peak | Binding Energy (eV) | FWHM (eV) | Peak Area, kcps (eV) | Atomic Conc. (at.%) |
|---|---|---|---|---|
| O 1s | 530.77 | 7.49 | 3398.3 | 73.4 |
| Ti2p1/2 | 458.29 | 4.74 | 2892.5 | 26.5 |
| Ti2p3/2 | 463.98 |
| Peak | Binding Energy (eV) | FWHM (eV) | Peak Area, kcps (eV) | Atomic Conc. (at.%) |
|---|---|---|---|---|
| Gd0.5/TiO2 | ||||
| O 1s | 530.77 | 3.6 | 991.5 | 73.43 |
| Ti 2p1/2 | 458.29 | 3.31 | 973.6 | 26.48 |
| Ti 2p3/2 | 463.98 | |||
| Gd 4d3/2 | 142 | 0.27 | 1.3 | 0.09 |
| Gd 4d5/2 | 152 | |||
| Gd6.0/TiO2 | ||||
| O 1s | 530.77 | 3.71 | 1047.5 | 71.73 |
| Ti 2p1/2 | 458.29 | 3.23 | 1049.4 | 28.11 |
| Ti 2p3/2 | 463.98 | |||
| Gd 4d3/2 | 142 | 0.0 | 1.3 | 0.16 |
| Gd 4d5/2 | 152 | |||
| Peak | Binding Energy (eV) | FWHM (eV) | Peak Area, kcps (eV) | Atomic Conc. (at.%) |
|---|---|---|---|---|
| Nd (0.5%)/TiO2 | ||||
| O 1s | 530.77 | 3.36 | 1139.1 | 75.12 |
| Ti 2p1/2 | 458.29 | 1.93 | 1108.7 | 24.71 |
| Ti 2p3/2 | 463.98 | |||
| Nd 3d3/2 | 995.8 | 0 | 0.774 | 0.17 |
| Nd 3d5/2 | 975.9 | |||
| Nd (6.0%)/TiO2 | ||||
| O 1s | 530.77 | 3.7 | 1266.5 | 74.59 |
| Ti 2p1/2 | 458.29 | 3.37 | 1175.9 | 25.18 |
| Ti 2p3/2 | 463.98 | |||
| Nd 3d3/2 | 975.9 | 0.01 | 1.78 | 0.23 |
| Nd 3d5/2 | 995.8 | |||
| Peak | Binding Energy, eV | FWHM, eV | Peak Area, kcpseV | Atomic Concentration, (at.%) |
|---|---|---|---|---|
| O 1s | 538.5 | 3.83 | 961.4 | 77.55 |
| Ti 2p1/2 | 458.29 | 2.89 | 657.9 | 21.82 |
| Ti 2p3/2 | 463.98 | |||
| Gd 4d3/2 | 142 | 0.19 | 0.70 | 0.29 |
| Gd 4d5/2 | 152 | |||
| Nd 3d3/2 | 975.9 | 0.64 | 3.8 | 0.34 |
| Nd 3d5/2 | 995.8 |
| Element | Compound | ||
|---|---|---|---|
| TiO2 (Atom%) | Gdx/TiO2 (Atom%) | Ndx/TiO2 (Atom%) | |
| O | 73.04 | 70.81 | 72.36 |
| Ti | 26.96 | 29.05 | 27.46 |
| Gd | - | 0.150 | - |
| Nd | - | - | 0.185 |
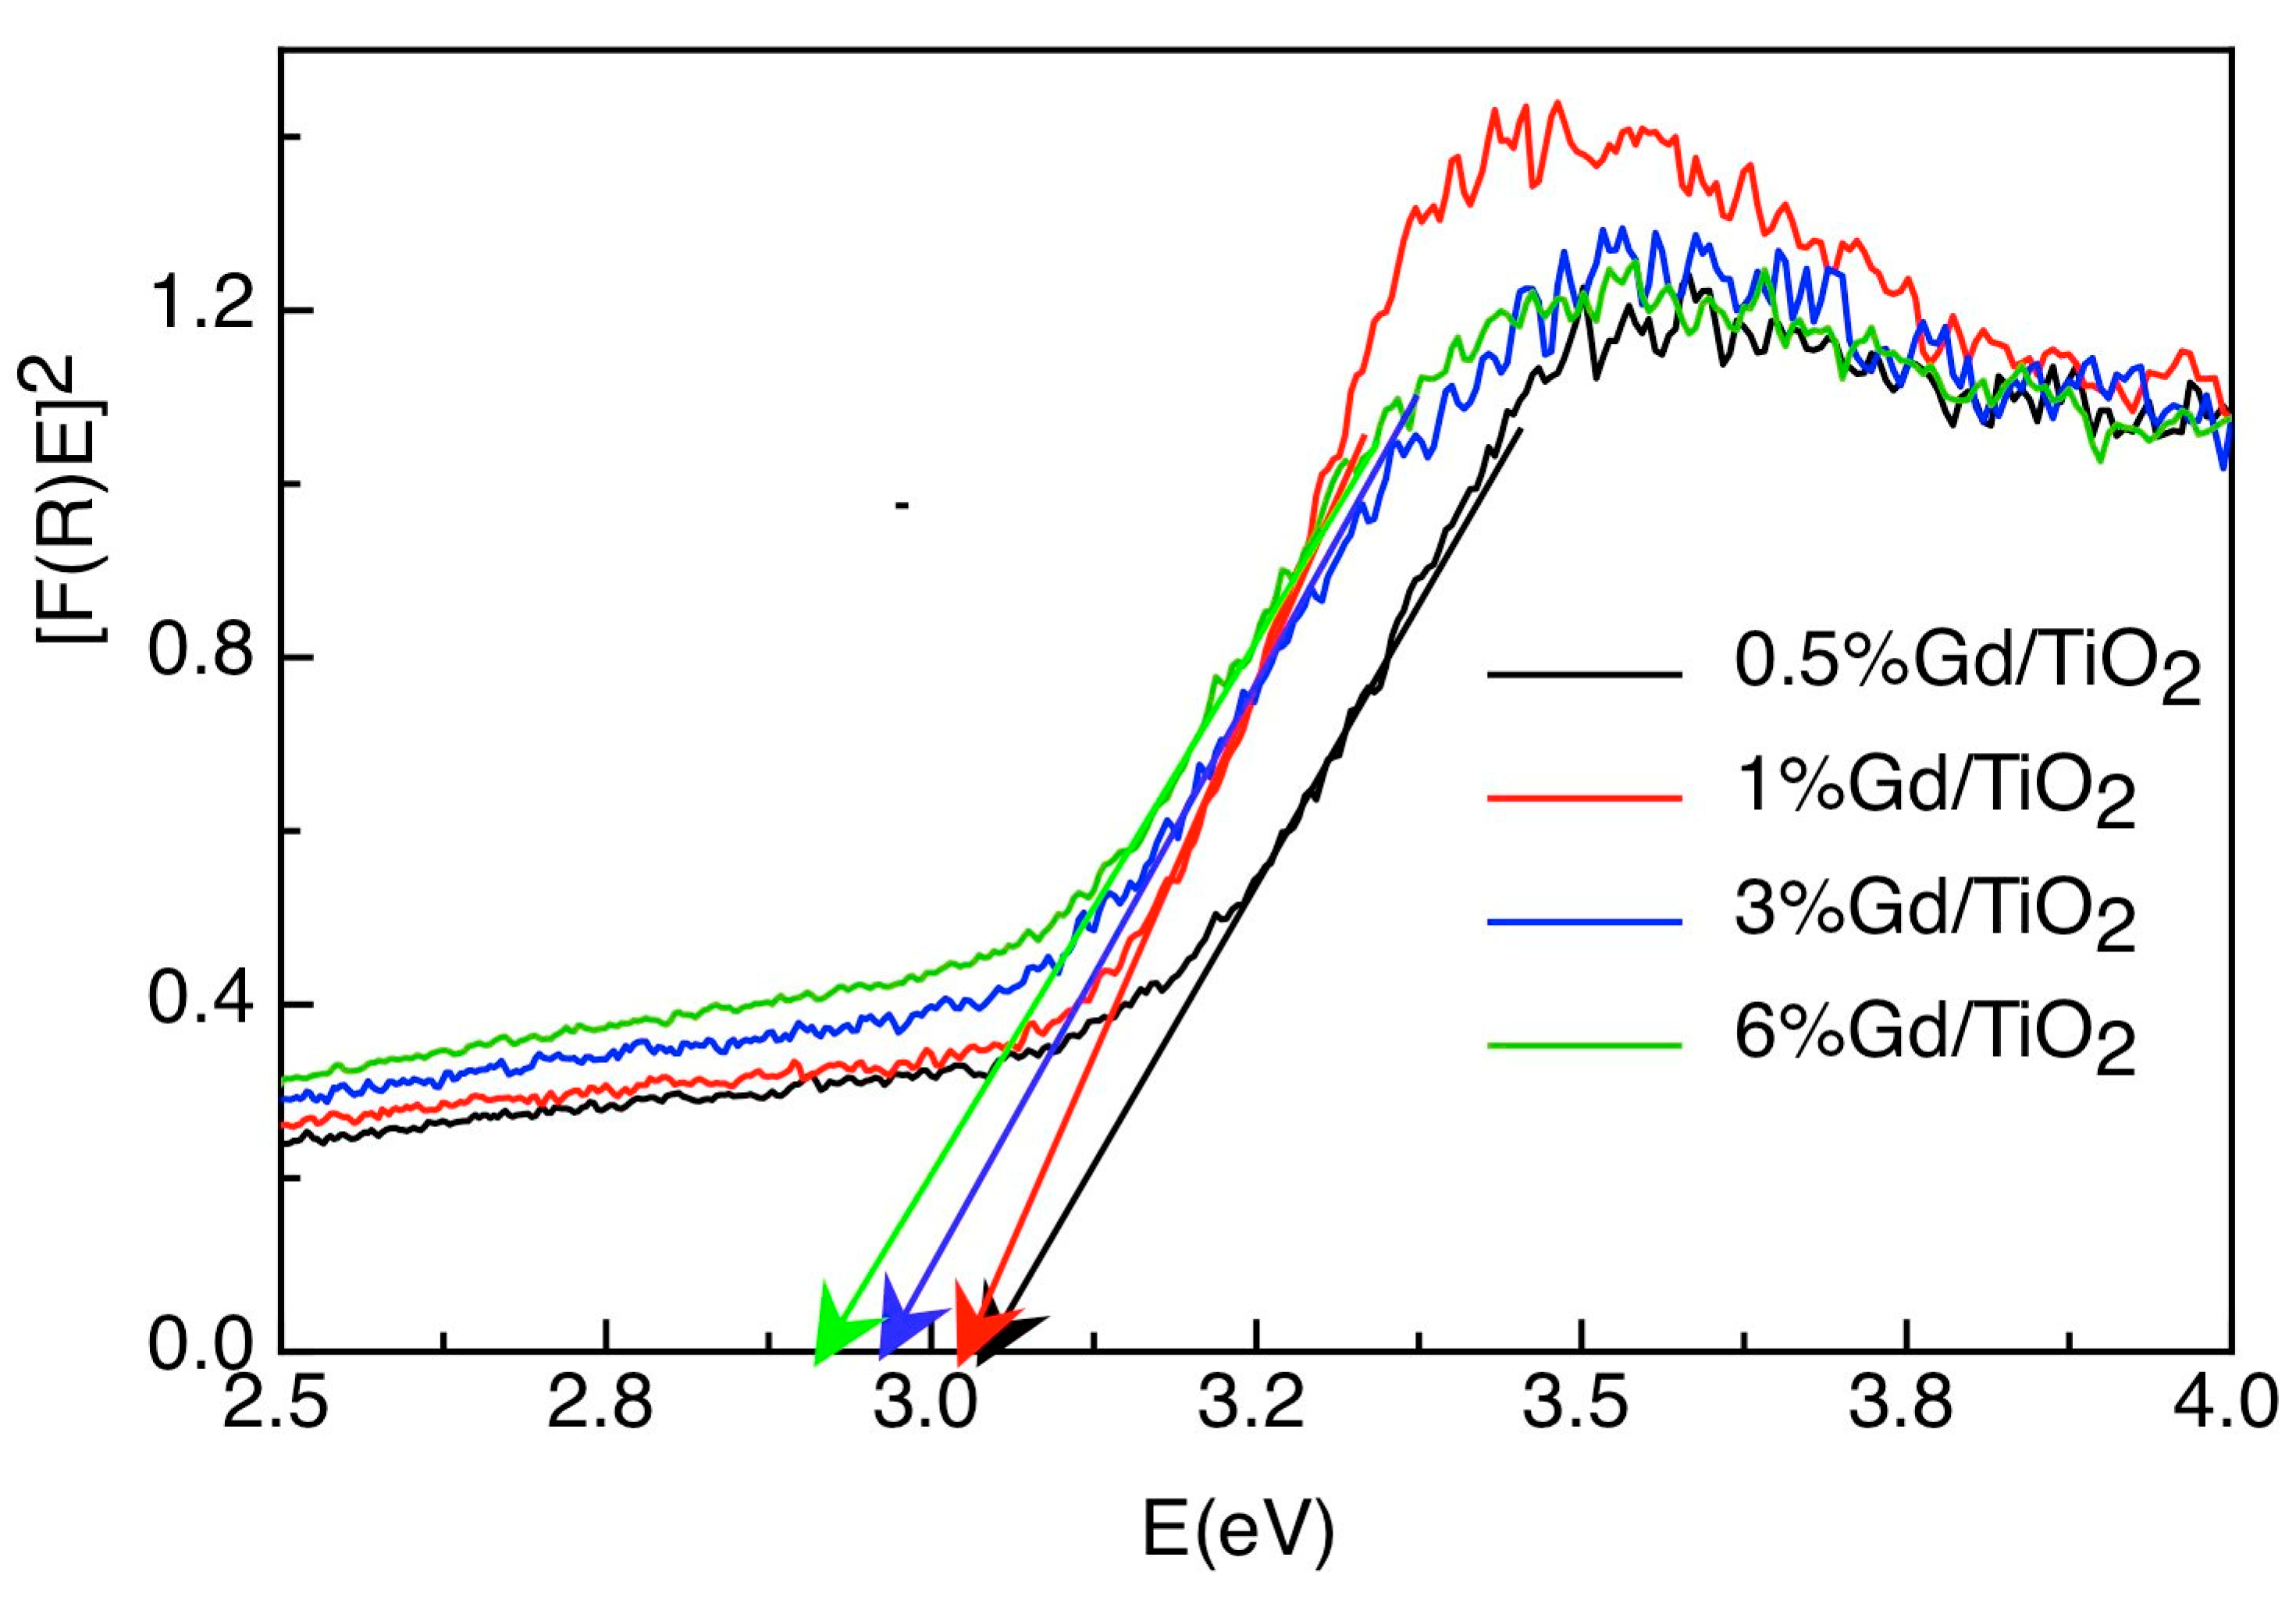
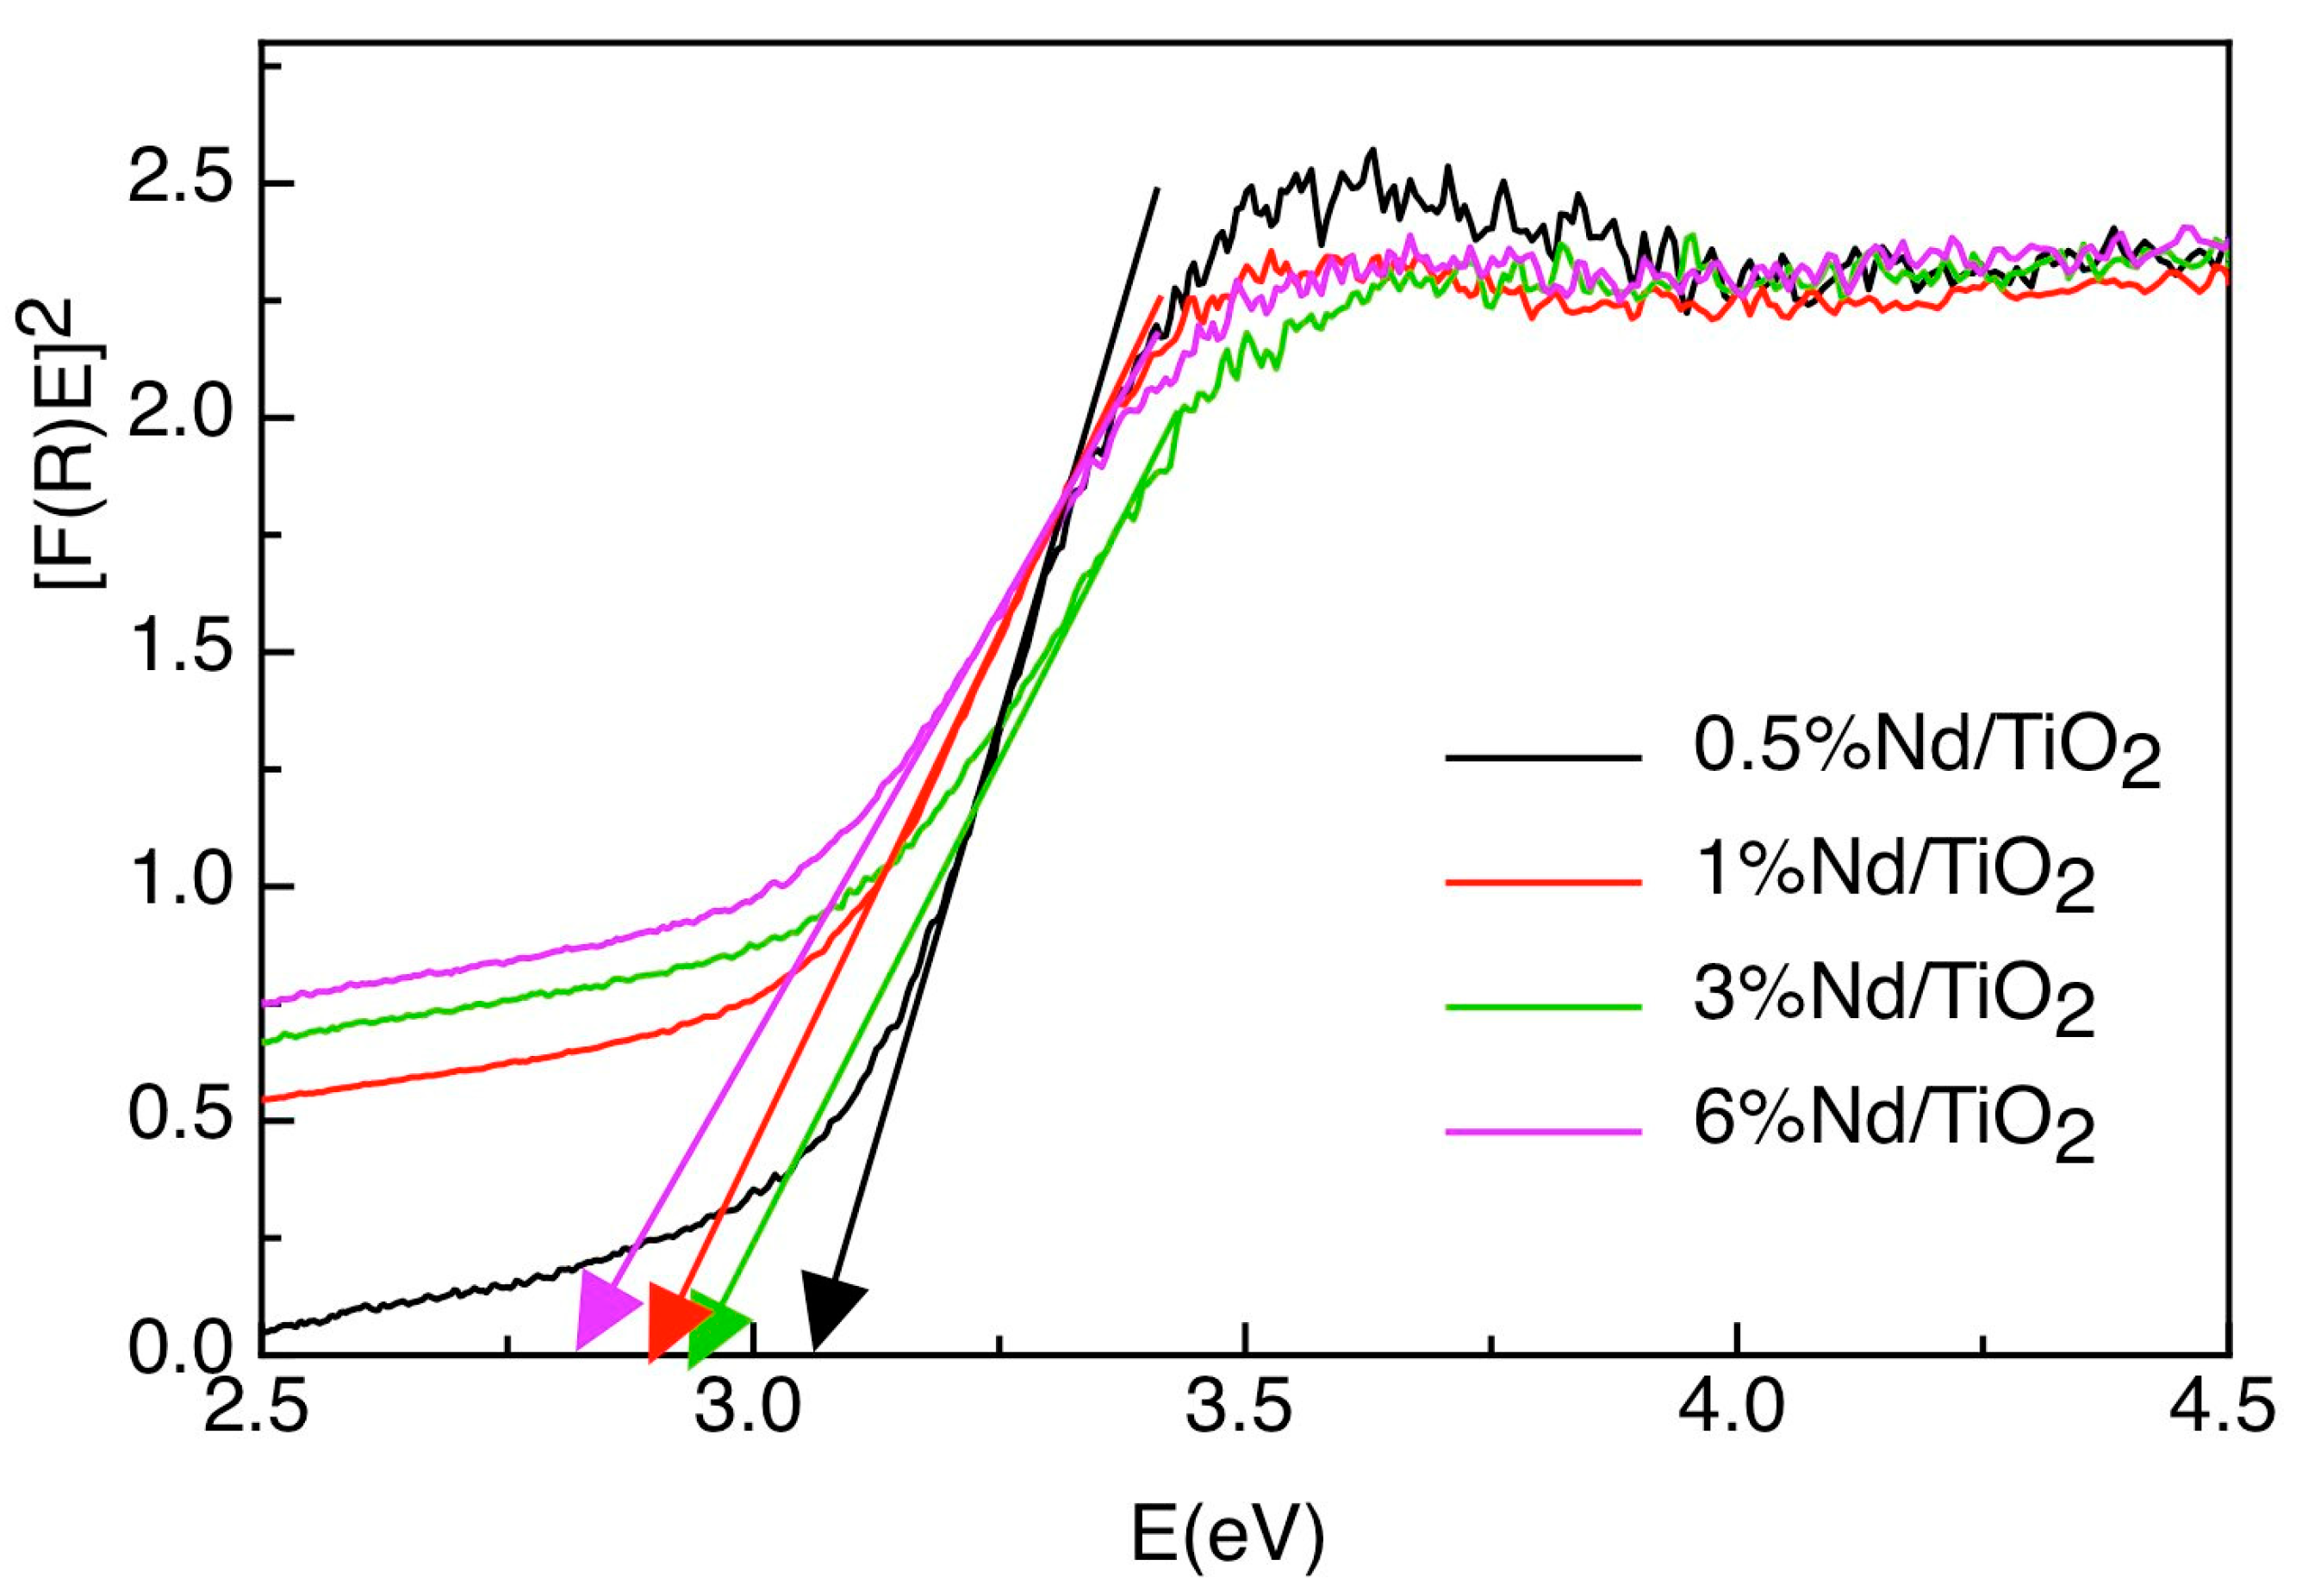
| 0.5% | 1.0% | 3.0% | 6.0% | |
|---|---|---|---|---|
| Gdx/TiO2 | 3.06 | 3.04 | 2.97 | 2.93 |
| Ndx/TiO2 | 3.07 | 2.95 | 2.91 | 2.83 |
| Tested Cathode | Onset Potential (EHER, mV vs. RHE) | Tafel Slope (βc, mV dec−1) | Exchange Current Density (jo, mA cm−2) | Overpotential at j = 10 mA cm−2 (η10, mV) |
|---|---|---|---|---|
| bare GCE | −720 (9.2) | −165 (2.6) | 2.75 (0.05) × 10−5 | ---- |
| TiO2/GCE | −215 (3.6) | −152 (2.2) | 1.45 (0.03) × 10−3 | 565 (7.6) |
| Gd0.5/TiO2/GCE | −186 (3.2) | −142 (1.7) | 2.51 (0.04) × 10−3 | 511 (6.2) |
| Gd1.0/TiO2/GCE | −175 (2.9) | −143 (1.8) | 5.4 (0.15) × 10−3 | 466 (5.1) |
| Gd3.0/TiO2/GCE | −160 (2.8) | −141 (2.1) | 1.12 (0.3) × 10−2 | 432 (4.7) |
| Gd6.0/TiO2/GCE | −145 (2.9) | −142 (1.8) | 2.51 (0.04) × 10−2 | 365 (4.2) |
| Nd0.5/TiO2/GCE | −130 (2.2) | −140 (1.5) | 5.62 (0.06) × 10−2 | 332 (3.8) |
| Nd1.0/TiO2/GCE | −118 (2.4) | −139 (1.5) | 10.5 (0.3) × 10−2 | 277 (3.5) |
| Nd3.0/TiO2/GCE | −103 (1.5) | −141 (1.6) | 15.9 (0.42) × 10−2 | 244 (3.2) |
| Nd6.0/TiO2/GCE | −85 (1.4) | 140 (1.5) | 43.6 (0.6) × 10−2 | 225 (2.2) |
| Gd1.0/Nd0.5/TiO2/GCE | −72 (1.6) | 113 (1.4) | 35.5 (0.4) × 10−2 | 177 (1.9) |
| Gd1.0/Nd1.0/TiO2/GCE | −60 (1.1) | 112 (1.4) | 44.7 (0.6) × 10−2 | 161 (1.8) |
| Gd1.0/Nd3.0/TiO2/GCE | −38 (0.8) | 110 (1.8) | 50.2 (0.7) × 10−2 | 142 (1.7) |
| Gd1.0/Nd6.0/TiO2/GCE | −22 (0.3) | 109 (1.5) | 72 (1.1) × 10−2 | 115 (1.8) |
| Pt/C | −15 (0.2) | −106 (1.2) | 80 (0.9) × 10−2 | 106 (1.5) |
| Tested Cathode | Cdl/ µF cm−2 | EASA/cm2 | Q × 103/C | n × 108/mol |
|---|---|---|---|---|
| TiO2 NPs alone | 4.08 | 136.0 | 3.2 | 1.66 |
| Gd0.5/TiO2 | 8.26 | 275.3 | 7.3 | 3.78 |
| Gd1.0/TiO2 | 21.2 | 706.7 | 11.6 | 6.01 |
| Gd3.0/TiO2 | 28.8 | 960.0 | 25.2 | 13.06 |
| Gd6.0/TiO2 | 36.4 | 1213.3 | 34.5 | 17.88 |
| Nd0.5/TiO2 | 21.8 | 726.7 | 10.8 | 5.60 |
| Nd1.0/TiO2 | 29.9 | 996.7 | 15.4 | 7.98 |
| Nd3.0/TiO2 | 38.6 | 1286.7 | 31.7 | 16.43 |
| Nd6.0/TiO2 | 46.9 | 1563.3 | 41.2 | 21.35 |
| Gd1.0/Nd0.5/TiO2 | 39.2 | 1306.7 | 22.9 | 11.87 |
| Gd1.0/Nd1.0/TiO2 | 47.4 | 1580.0 | 43.5 | 22.54 |
| Gd1.0/Nd3.0/TiO2 | 55.6 | 1853.3 | 48.6 | 25.19 |
| Gd1.0/Nd6.0/TiO2 | 62.9 | 2096.7 | 56.8 | 29.43 |
| Pt/C | 65.4 | 2180.0 | 59.7 | 30.94 |
| Tested Catalyst | H2 Measured by GC (H2/μmol h−1) | Calculated H2 Based on the Charge Passed during Electrolysis | FE (%) | |
|---|---|---|---|---|
| Charge Passed/C | H2/μmol h−1 | |||
| TiO2 NPs alone | 6.9 (0.12) | 2.4 (0.05) | 12.4 (0.2) | 55.4 (0.8) |
| Gd1.0/TiO2 | 11.8 (0.15) | 3.1 (0.055) | 15.9 (0.31) | 74.2 (1.1) |
| Gd6.0/TiO2 | 15.6 (0.3) | 3.6 (0.06) | 18.7 (0.38) | 83.6 (1.3) |
| Nd1.0/TiO2 | 14.3 (0.26) | 3.4 (0.052) | 17.8 (0.35) | 80.5 (1.2) |
| Nd6.0/TiO2 | 20.1 (0.35) | 4.3 (0.07) | 22.4 (0.4) | 89.8 (1.5) |
| Gd1.0/Nd1.0/TiO2 | 22.9 (0.4) | 4.8 (0.09) | 24.6 (0.42) | 92.9 (1.4) |
| Gd1.0/Nd6.0/TiO2 | 31.4 (0.55) | 6.1 (0.12) | 31.8 (0.5) | 98.7 (1.6) |
| Pt/C | 32.9 (0.3) | 6.4 (0.1) | 33.1 (0.36) | 99.5 (1.4) |
Disclaimer/Publisher’s Note: The statements, opinions and data contained in all publications are solely those of the individual author(s) and contributor(s) and not of MDPI and/or the editor(s). MDPI and/or the editor(s) disclaim responsibility for any injury to people or property resulting from any ideas, methods, instructions or products referred to in the content. |
© 2023 by the authors. Licensee MDPI, Basel, Switzerland. This article is an open access article distributed under the terms and conditions of the Creative Commons Attribution (CC BY) license (https://creativecommons.org/licenses/by/4.0/).
Share and Cite
Alsawat, M.; Alshehri, N.A.; Shaltout, A.A.; Ahmed, S.I.; Al-Malki, H.M.O.; Das, M.R.; Boukherroub, R.; Amin, M.A.; Ibrahim, M.M. Enhanced Alkaline Hydrogen Evolution on Gd1.0/Ndx (x = 0.5, 1.0, 3.0, and 6.0%)-Doped TiO2 Bimetallic Electrocatalysts. Catalysts 2023, 13, 1192. https://doi.org/10.3390/catal13081192
Alsawat M, Alshehri NA, Shaltout AA, Ahmed SI, Al-Malki HMO, Das MR, Boukherroub R, Amin MA, Ibrahim MM. Enhanced Alkaline Hydrogen Evolution on Gd1.0/Ndx (x = 0.5, 1.0, 3.0, and 6.0%)-Doped TiO2 Bimetallic Electrocatalysts. Catalysts. 2023; 13(8):1192. https://doi.org/10.3390/catal13081192
Chicago/Turabian StyleAlsawat, Mohammed, Naif Ahmed Alshehri, Abdallah A. Shaltout, Sameh I. Ahmed, Hanan M. O. Al-Malki, Manash R. Das, Rabah Boukherroub, Mohammed A. Amin, and Mohamed M. Ibrahim. 2023. "Enhanced Alkaline Hydrogen Evolution on Gd1.0/Ndx (x = 0.5, 1.0, 3.0, and 6.0%)-Doped TiO2 Bimetallic Electrocatalysts" Catalysts 13, no. 8: 1192. https://doi.org/10.3390/catal13081192