Article

The Toxicological Analysis and Toxicological Risk Assessment of Chosen Elemental Impurities (Ag, Au, Co, Cr, Cs, Li, Mo, Se, and Sr) in Green Tea (Camellia sinensis (L.)) Infusions

by
Adrian Frydrych
1,
Maciej Noga
2,
Justyna Milan
1,
Elżbieta Kondratowicz-Pietruszka
3,
Mirosław Krośniak
4 and
Kamil Jurowski
1,2,*
1
Laboratory of Innovative Toxicological Research and Analyses, Institute of Medical Studies, Medical College, Rzeszów University, Aleja Majora W. Kopisto 2a, 35-959 Rzeszow, Poland
2
Department of Regulatory and Forensic Toxicology, Institute of Medical Expertises, Aleksandrowska 67/93, 91-205 Łódź, Poland
3
Department of General Chemistry, Cracow University of Economics, Sienkiewicza 5, 30-033 Kraków, Poland
4
Department of Food Chemistry and Nutrition, Medical College, Jagiellonian University, Medyczna 9, 30-688 Kraków, Poland
*
Author to whom correspondence should be addressed.
Nutrients 2023, 15(6), 1460; https://doi.org/10.3390/nu15061460
Submission received: 13 February 2023 / Revised: 13 March 2023 / Accepted: 16 March 2023 / Published: 17 March 2023
(This article belongs to the Special Issue The Link between Dietary Minerals and Human Health)

Abstract

:
Our study’s objective is to evaluate the potential health effects of elemental impurities (Ag, Au, Co, Cr, Cs, Li, Mo, Se, and Sr) found in green tea infusions (Camellia sinensis (L.)). The ICP-MS-based methodology was employed for elemental analysis and a detailed health risk evaluation based on weekly consumption (μg/L of infusion/week). The provisional tolerable weekly intake (PTWI), established by the Joint FAO Expert Committee on infusion/week/month based on existing literature data, was then compared to the subjects with data from the available literature. The exposure of the study items to Co ranged from 0.07904 to 0.85421 μg/day. On the contrary, the ICH (International Council for Harmonisation of Technical Requirements for Pharmaceuticals for Human Use) guidelines state that the established permitted daily exposure PDE (oral exposure) for Co is 50 μg/day. The PDE of lithium is around 560 μg/day, and according to our study, the estimated daily exposure of the evaluated products to Li fell between 0.0185 and 0.7170 μg/day. Our research also revealed modest concentrations of Cs (0.399–2.654 μg/L), Mo (0.0113–0.107 μg/L), and Sr (9.848–22.331 μg/L) in infusions. The recognized PDE for molybdenum is approximately 3400 μg/day. Only two samples contained silver, and when considering daily consumption, the predicted daily exposure to Ag is between 4.4994 and 0.03122 μg/day. The amounts of all evaluated elements in a daily dose of green tea infusions should not harm the consumer’s health. Further considerations should take aspects, such as constant change and environmental pollution, into account.

1. Introduction

People have been using plant extracts for health purposes for centuries, especially in the form of tea, due to their easy and accessible administration and the possibility of applying them in various situations [1]. These characteristics make tea the second most consumed beverage globally, after water [2]. Green tea was the first to be discovered. It contains large amounts of polyphenols and caffeine (2–5%, depending on the age of the leaf), as well as minerals and trace amounts of vitamins, amino acids, and carbohydrates [3]. Because green tea is not fermented, it contains much more natural substances in its fresh leaves and shows fewer vitamin losses than other types of tea [4]. Green tea has health-promoting effects due to its high content of polyphenols in fresh leaves, especially flavanols, which account for 30% of the dry weight [5]. Furthermore, green tea exceeds the catechin content of all known dietary sources, such as apples, red grapes or chocolate [6]. The catechins in tea provide beneficial effects, and (-)-epigallocatechin-3-gallate (EGCG) is the most abundant catechin [7]. According to the Food and Drug Administration (FDA), 71 mg of epigallocatechin gallate is present per 100 mL of green tea [8]. Pure epigallocatechin gallate is less stable than green tea extracts, related to their presence of antioxidant components [9]. Herbal medicines are often complex mixtures of various compounds that act synergistically with each other, allowing their beneficial health-promoting effects to be fully understood [10]. The chemical ingredients in green tea provide many health benefits for humans, such as protection against degenerative diseases due to catechins [11]. Catechins in green tea have been linked to the prevention of many types of cancer [12]. The beneficial effect of reducing the risk of many chronic diseases is attributed to the presence of powerful antioxidants (polyphenols) in green tea [13]. Green tea consumption has also been proven to lower blood sugar levels [14]. Both green tea and its extracts effectively prevent oxidative stress [15] and neurological problems [16]. In addition, green tea prevents hepatotoxicity and has antiproliferative effects on hepatoma cells [11]. Consumption of green tea may also lower blood pressure and reduce the risk of ischemic heart disease and stroke [17].
When it comes to green teas, beneficial medicinal properties are especially considered, while the problem of toxicological contamination of the soil in plant cultivation is neglected. Tea grown in polluted soil absorbs elemental ions through the roots, including heavy metals (such as Hg, Cd, and Pb), essential elements (such as Cr, Mo, and Se) and others not as well studied (such as Ag, Au, Co, Cs, Li, and Sr). These elemental impurities (EIs) are then transported to the surface and bioaccumulate in the above-ground sections of plants [18]. These impurities enter the human body after consuming such a plant or its extracts, for example, tea. Some pollutants will degrade, while the rest may accumulate in the human body. For this reason, it is worth paying attention to the significant content of these, because in excessively high concentrations, they can threaten human health [19,20]. A significant problem for the environment and substantial threat to human health is new elemental impurities (NEIs). NEIs do not result from actual environmental exposures, as in the case of conventional EIs (e.g., Co, Mo, Se, Sr, Cs, and Li). Metallic nanoparticles, such as Ag and Au, for which more information is required regarding their environmental levels and fate, are of the most important hot topics related to NEIs [21]. Excessive unintentional absorption or deliberate intake of silver compounds (usually silver dust or colloidal silver) can cause symptoms of argyria [22]. The main symptom is a change in skin colour to blue or bluish grey in places exposed to the sun’s rays, due to the deposition of silver [23]. Gold is not considered a nutrient. People are exposed to it through food chains or as a food colourant. The excess gold consumed is absorbed into the circulation and metabolised in the kidneys, liver, lymph nodes, spleen, bones, salivary glands, and bone marrow. The toxic risk associated with excess Au intake was negligible, especially compared to other metals that cause more clinically severe problems [24]. The term “EIs” (elemental impurities) in this paper describes contamination with all elements. The term “new elemental impurities” (NEIs) describes low-level elements with a harmful effect on/for the environment (e.g., Ag and Au). Traditional or conventional EIs define elements commonly found in the environment, such as the essential elements for human health and heavy metals widely studied for their high toxicity, or non-metals. Environmental EIs (Co, Cr, Cs, Li, Mo, Se, and Sr) tend to have never been evaluated because of their challenging nature and importance in the minor league. Cobalt is a vital element of vitamin B12; however, no specific biological functions of this element have been identified in the human body [25]. In selective hydrogenation processes, cobalt compounds are used as catalysts. Therefore, they are a possible source of this environmental element [26]. Excessive cobalt intake has been correlated with systemic toxicity, which refers to the toxic effect due to the absorption and degradation of the substance acting throughout the body and not locally, i.e., in an area distant from the point of entry. This is evidenced by a clinical syndrome with varying neurological, cardiovascular, and endocrine symptoms [27]. On the other hand, the cobalt deficit is also potentially dangerous, leading to pernicious anaemia [28]. Chromium toxicity depends on the state of oxidation. Chromium is absorbed through both the inhalation and oral pathways. Trivalent chromium is a vital mineral for human nutrition [29]. If a significant amount of chromium(III) appears in living cells, there may be a potential threat of genotoxicity. However, regular metabolism and cell function prevent it. Persistent exposure to trivalent chromium leads to weight loss, anaemia, liver failure, and renal failure [30]. On the other hand, caesium naturally occurs primarily in the form of 133Cs isotopes. Caesium is an exciting, but undervalued element, with 11 other major radioactive isotopes that can harm humans [31]. Caesium side symptoms include cardiac arrhythmias, hypokalaemia, fainting, convulsions, and cardiac arrest. There is no complete understanding of caesium functions [32]. Lithium is another engaging element that is used as a therapeutic agent for humans. An example is lithium salts, used to treat mania, recurrent unipolar depression, and affective problems in people with bipolar disorder [33]. An excess of lithium increases the chances of hypothyroidism and polyuria, a condition in which the body excretes excessive amounts of urine, decreased weight gain, and hyperparathyroidism [34]. In the case of toxicity associated with molybdenum consumption, there is little difference between animals treated with toxic concentrations and those that are molybdenum deficient. Exceeding the range triggers respiratory symptoms and increases neutrophils and lymphocytes [35]. Therefore, it is crucial to precisely control molybdenum content in the diet [36]. Selenium is a crucial trace element for the existence of many species and ensures the proper functioning of enzyme systems. Its most important function is to create a powerful antioxidant, an enzyme called glutathione peroxidase, which protects red blood cells and cell membranes from the damaging effects of free radicals [37]. Continuous overexposure to selenium can lead to chronic intoxication called selenosis, and is characterised primarily by epidermal and neurological effects that involve unpredictable gait and paralysis [25]. Since strontium is treated by the body similarly to calcium, it can be incorporated into the structure of the bone. Most strontium taken up is quickly excreted, and 20–30% is retained in the skeletal system [38]. Due to easy absorption and permanent incorporation into the body, radioactive isotopes from waste products of nuclear technologies are particularly dangerous, mainly 90Sr, which persists in a contaminated environment for a long time due to its half-life of nearly 29 years [39]. These isotopes can be inhaled with dust, although they enter the body mainly through food. It may increase the risk of bone cancer and leukaemia [40]. Our article aimed to identify and evaluate the toxicological risks to humans of novel and traditional elemental impurities (Ag, Au, Co, Cr, Cs, Li, Mo, Se, and Sr) in green tea infusions (n = 12) accessible in the Polish market. The first step in our studies was to determine the investigated EI and present the raw results obtained as an EI profile. The weekly consumption of green tea was then estimated (µg/L of infusion/week), and the weekly intake was assumed to be approximately 6 L of tea per week according to [41]. The next step was to estimate the weekly consumption per body weight (µg/L of infusion/week/bw). Based on the weekly intake of weekly green tea per person (~70 kg bw) compared to the provisional tolerable weekly intake (PTWI), established by the Joint FAO/WHO Expert Committee on Food Additives (JECFA). Furthermore, an individual toxicological risk assessment was performed for elements that do not include PTWI values.
Green tea is among the most consumed single-ingredient teas worldwide [25]. Despite the widely studied beneficial effects of green tea, some contaminants in tea leaves may lead to human health risks when drinking tea. In the context of exposure to green tea, this problem seems very basic, but is extremely important due to the lack of a comprehensive human toxicological risk assessment (TRA) within scientific works of NEIs and traditional EIs in green tea. Only one article on this topic in the scientific literature refers to infusions of green tea [42]. Therefore, we decided to estimate the exposure to NEIs and traditional EIs listed in the final tea infusions, and assess the safety of drinking green tea and the associated health risks. For this purpose, complete and well-designed TRA of the listed elements in green tea infusions have been developed.

2. Materials and Methods

2.1. Samples

From June 2022 to September 2022, green tea samples (n = 12) were purchased from stores in Rzeszów, Kraków, Toruń, Gdańsk, and Poznań in Poland. The samples analysed came in various forms, such as raw materials (in the form of leaves or needles) and tea bag containers (20–25 pieces per box; 1.4–2.0 g of raw materials). Samples were coded in a random order (GT1, GT2, etc.). Table 1 shows the characteristics of the examined green tea samples. To minimise potential impurities (elemental impurities require a specific condition in the laboratory) from other sources, all sampling procedures were performed at the analytical and clinical purity in the Bioelement Laboratory of the Collegium Medicum of the Jagiellonian University in Kraków. Furthermore, plastic equipment was applied to avoid impurities during the study. Additionally, laboratory glass equipment (volumetric flasks) was kept overnight in a 10% solution of nitric acid (HNO3), rinsed with distilled water, and dried in the air before analysis. Additional processing (e.g., homogenisation and digestion) was not required, because all samples were liquid samples (tea infusion). Consequently, in situ analysis was applied at the measurement stage.

2.2. Chemicals

In this research, nine elements (Ag, Au, Co, Cr, Cs, Li, Mo, Se, and Sr) were analysed, and two multi-element stock solutions (CHECL 01.13632.0100 and Merck 01.10580.0100) containing Ag (10.0 mg/L), Au (10.1 mg/L), Co (20.0 mg/L), Cr (20.1 mg/L), Cs (10.0 mg/L), Li (19.8 mg/L), Mo (19.9 mg/L), Se (101.0 mg/L), and Sr (9.5 mg/L), were applied as internal standards. Nitric acid (65%) was obtained from Merck (Lowe, NJ, USA).

2.3. Instrumentation and Determination of Elements

The determination of elements (Ag, Au, Co, Cr, Cs, Li, Mo, Se, and Sr) was performed using an ICP-MS method, that uses argon gas (plasma) to convert the sample into the ionization state for elements that are then separated, measured and investigated using a mass spectrometer. In our study, we applied an Elan DRC-e spectrometer (PerkinElmer, Waltham, MA, USA) [43]. We used simultaneous multi-element detection mode. The plasma excitation power was 1150 W; the plasma gas, carrier gas, and composition gas flow rates were 15.0 L/min, 1.1 L/min, and 1.0 L/min, respectively. All experimental conditions are summarised in Table 2. All details regarding analytical calibration and quality control are described in Supplementary Materials S1 (SM S1).

2.4. The Procedure of the Study

2.4.1. The Green Tea Infusion Process Procedure

The green tea infusion process was carried out according to the information in Table 1 (infusion process, raw materials, and infusion time). First, an appropriate amount of green tea was poured into a beaker, and then ultrapure, demineralized, boiling water was poured over it (according to the manufacturer’s recommendations). The mixture was then covered for 3 to 8 min (according to the tea manufacturer’s recommendation), to ensure sufficient immersion [44]. After the injection, the solution was decanted and chilled to room temperature until determination.

2.4.2. Toxicological Risk Assessment

For a complex toxicological risk assessment, an appropriate strategy, consisting of three crucial steps, was applied. Table 3 shows the characteristics of the applied toxicological risk assessment. This strategy was based on our previously published article on mint tea [45].

2.5. Statistical Analysis

Data were analysed, and graphs were generated using the OriginLab 2010 statistical software. Data processing and basic descriptive calculations, compilation, and storage of the collected data at the laboratory stage were done using Excel 2010 (Microsoft Office), licensed by Rzeszów University. The results of five independent replications are expressed as relative standard errors (RSD, %).

3. Results

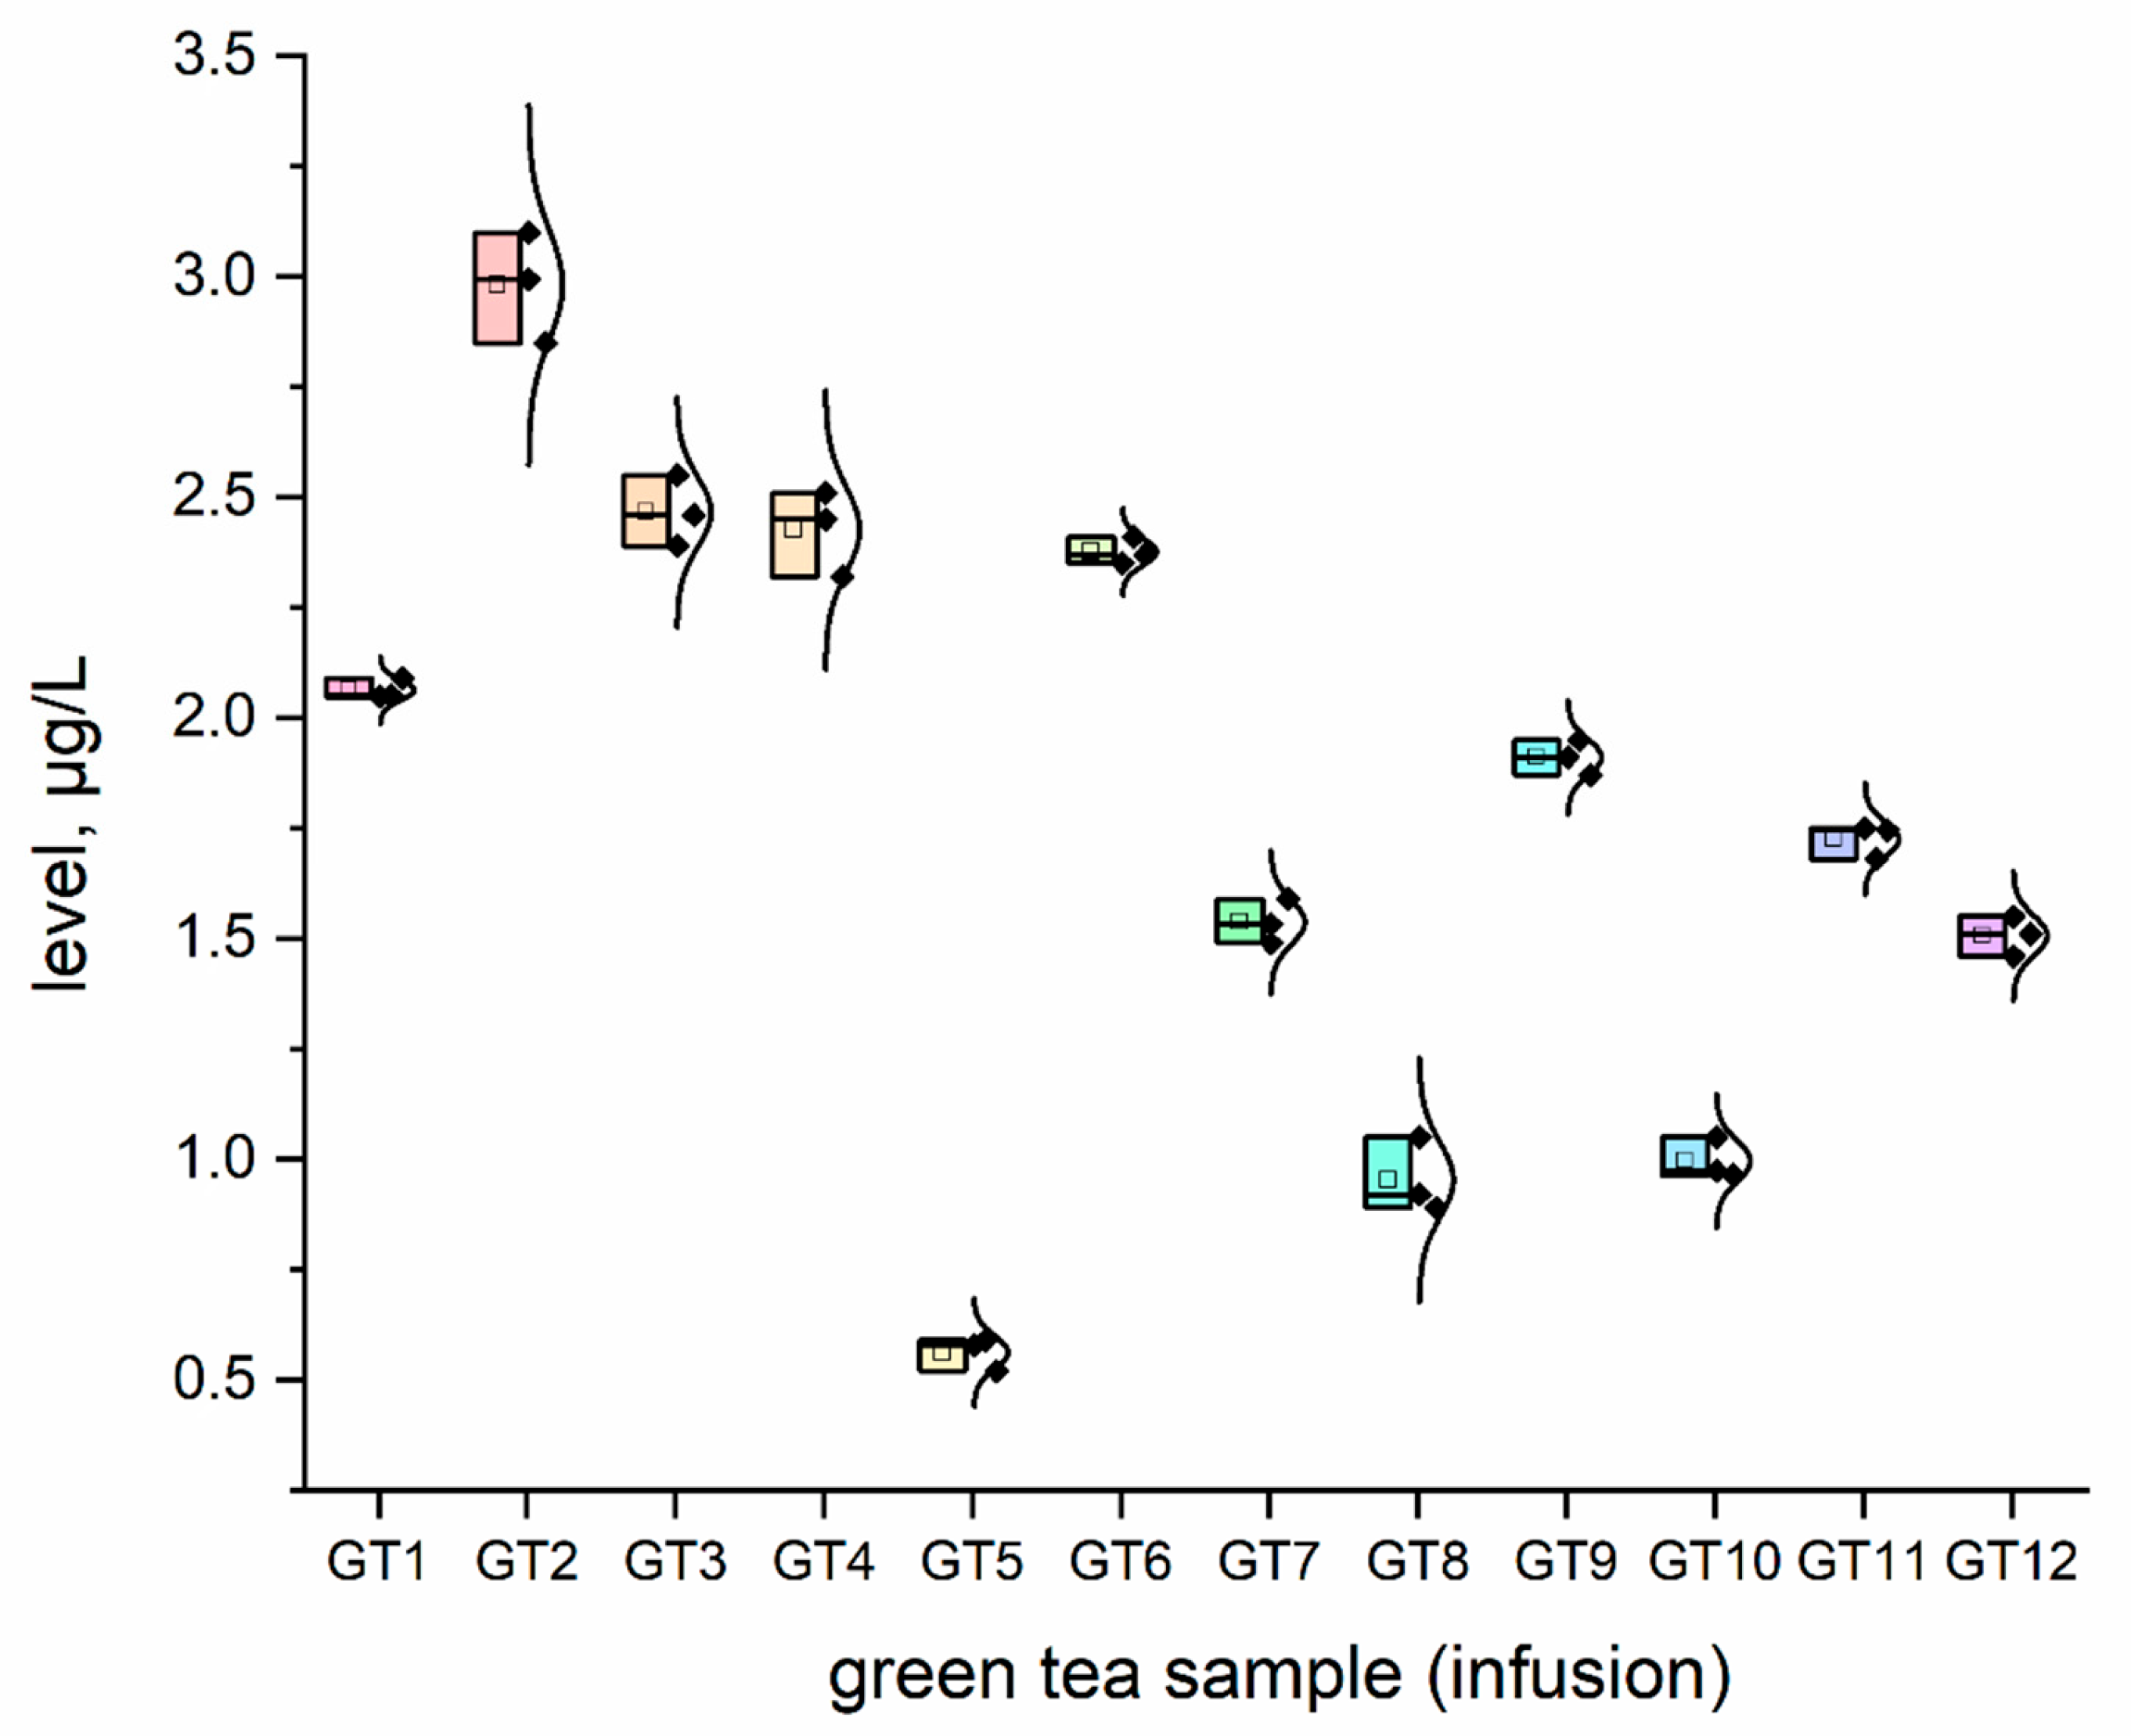
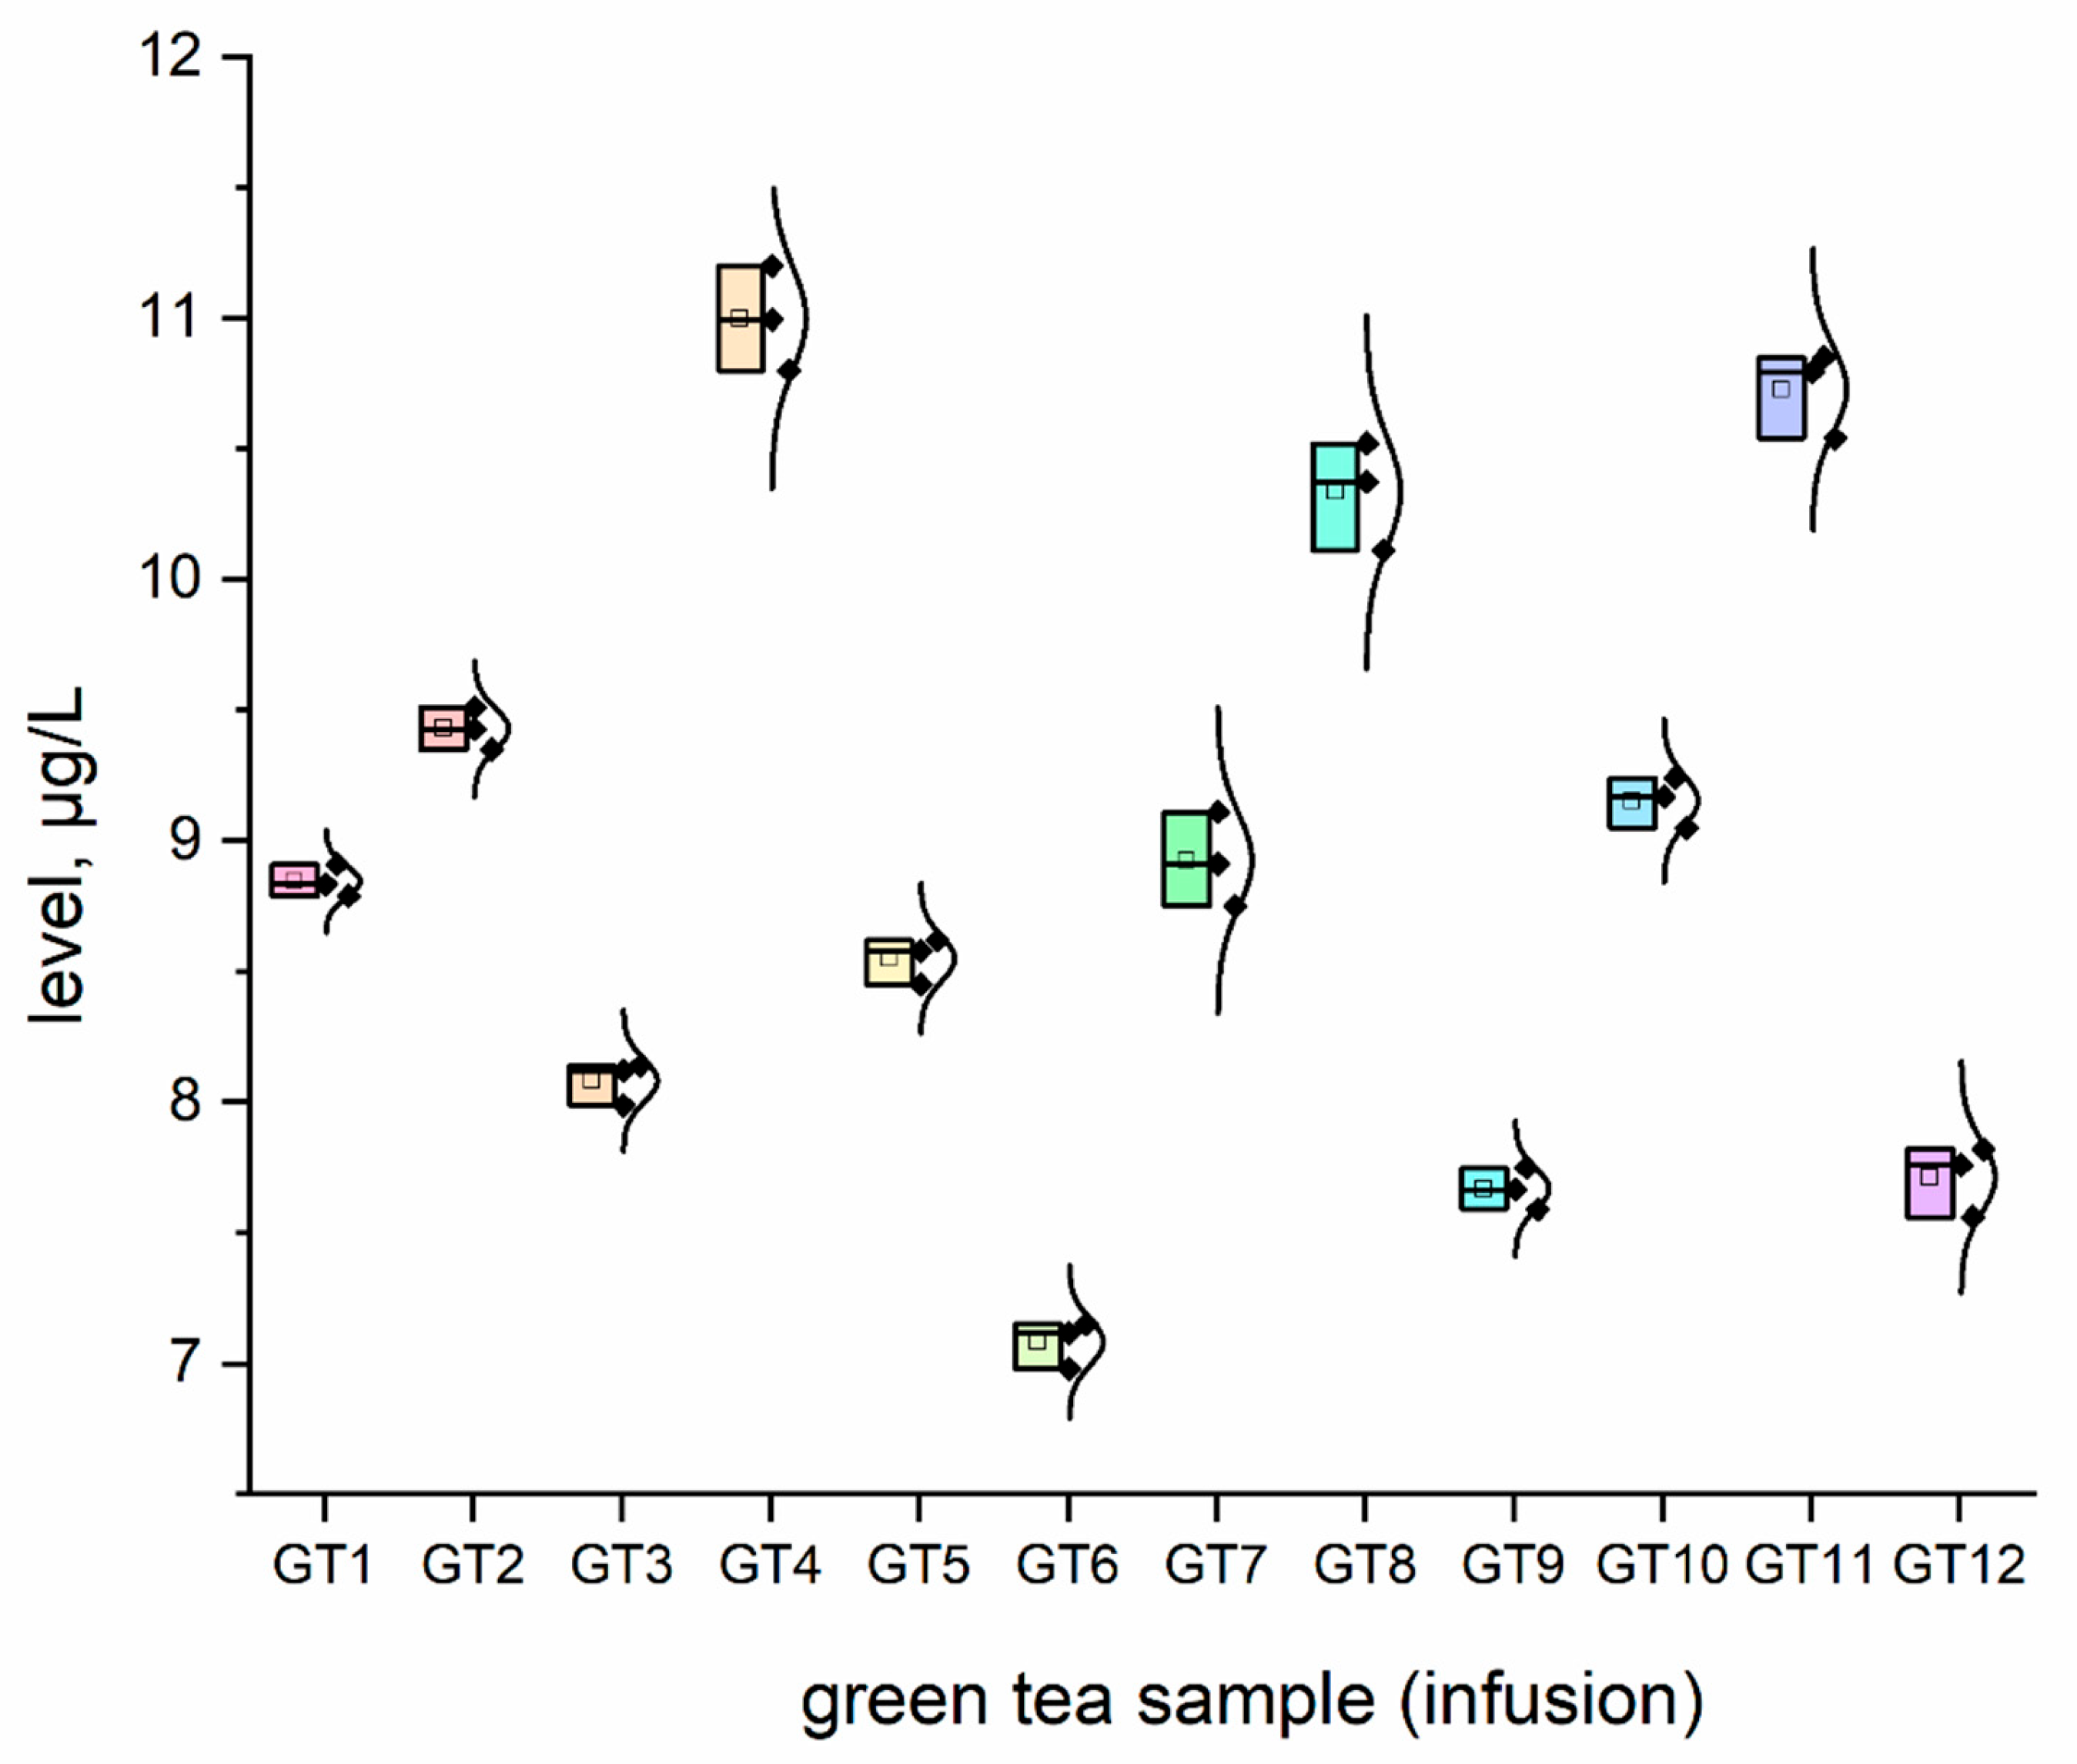
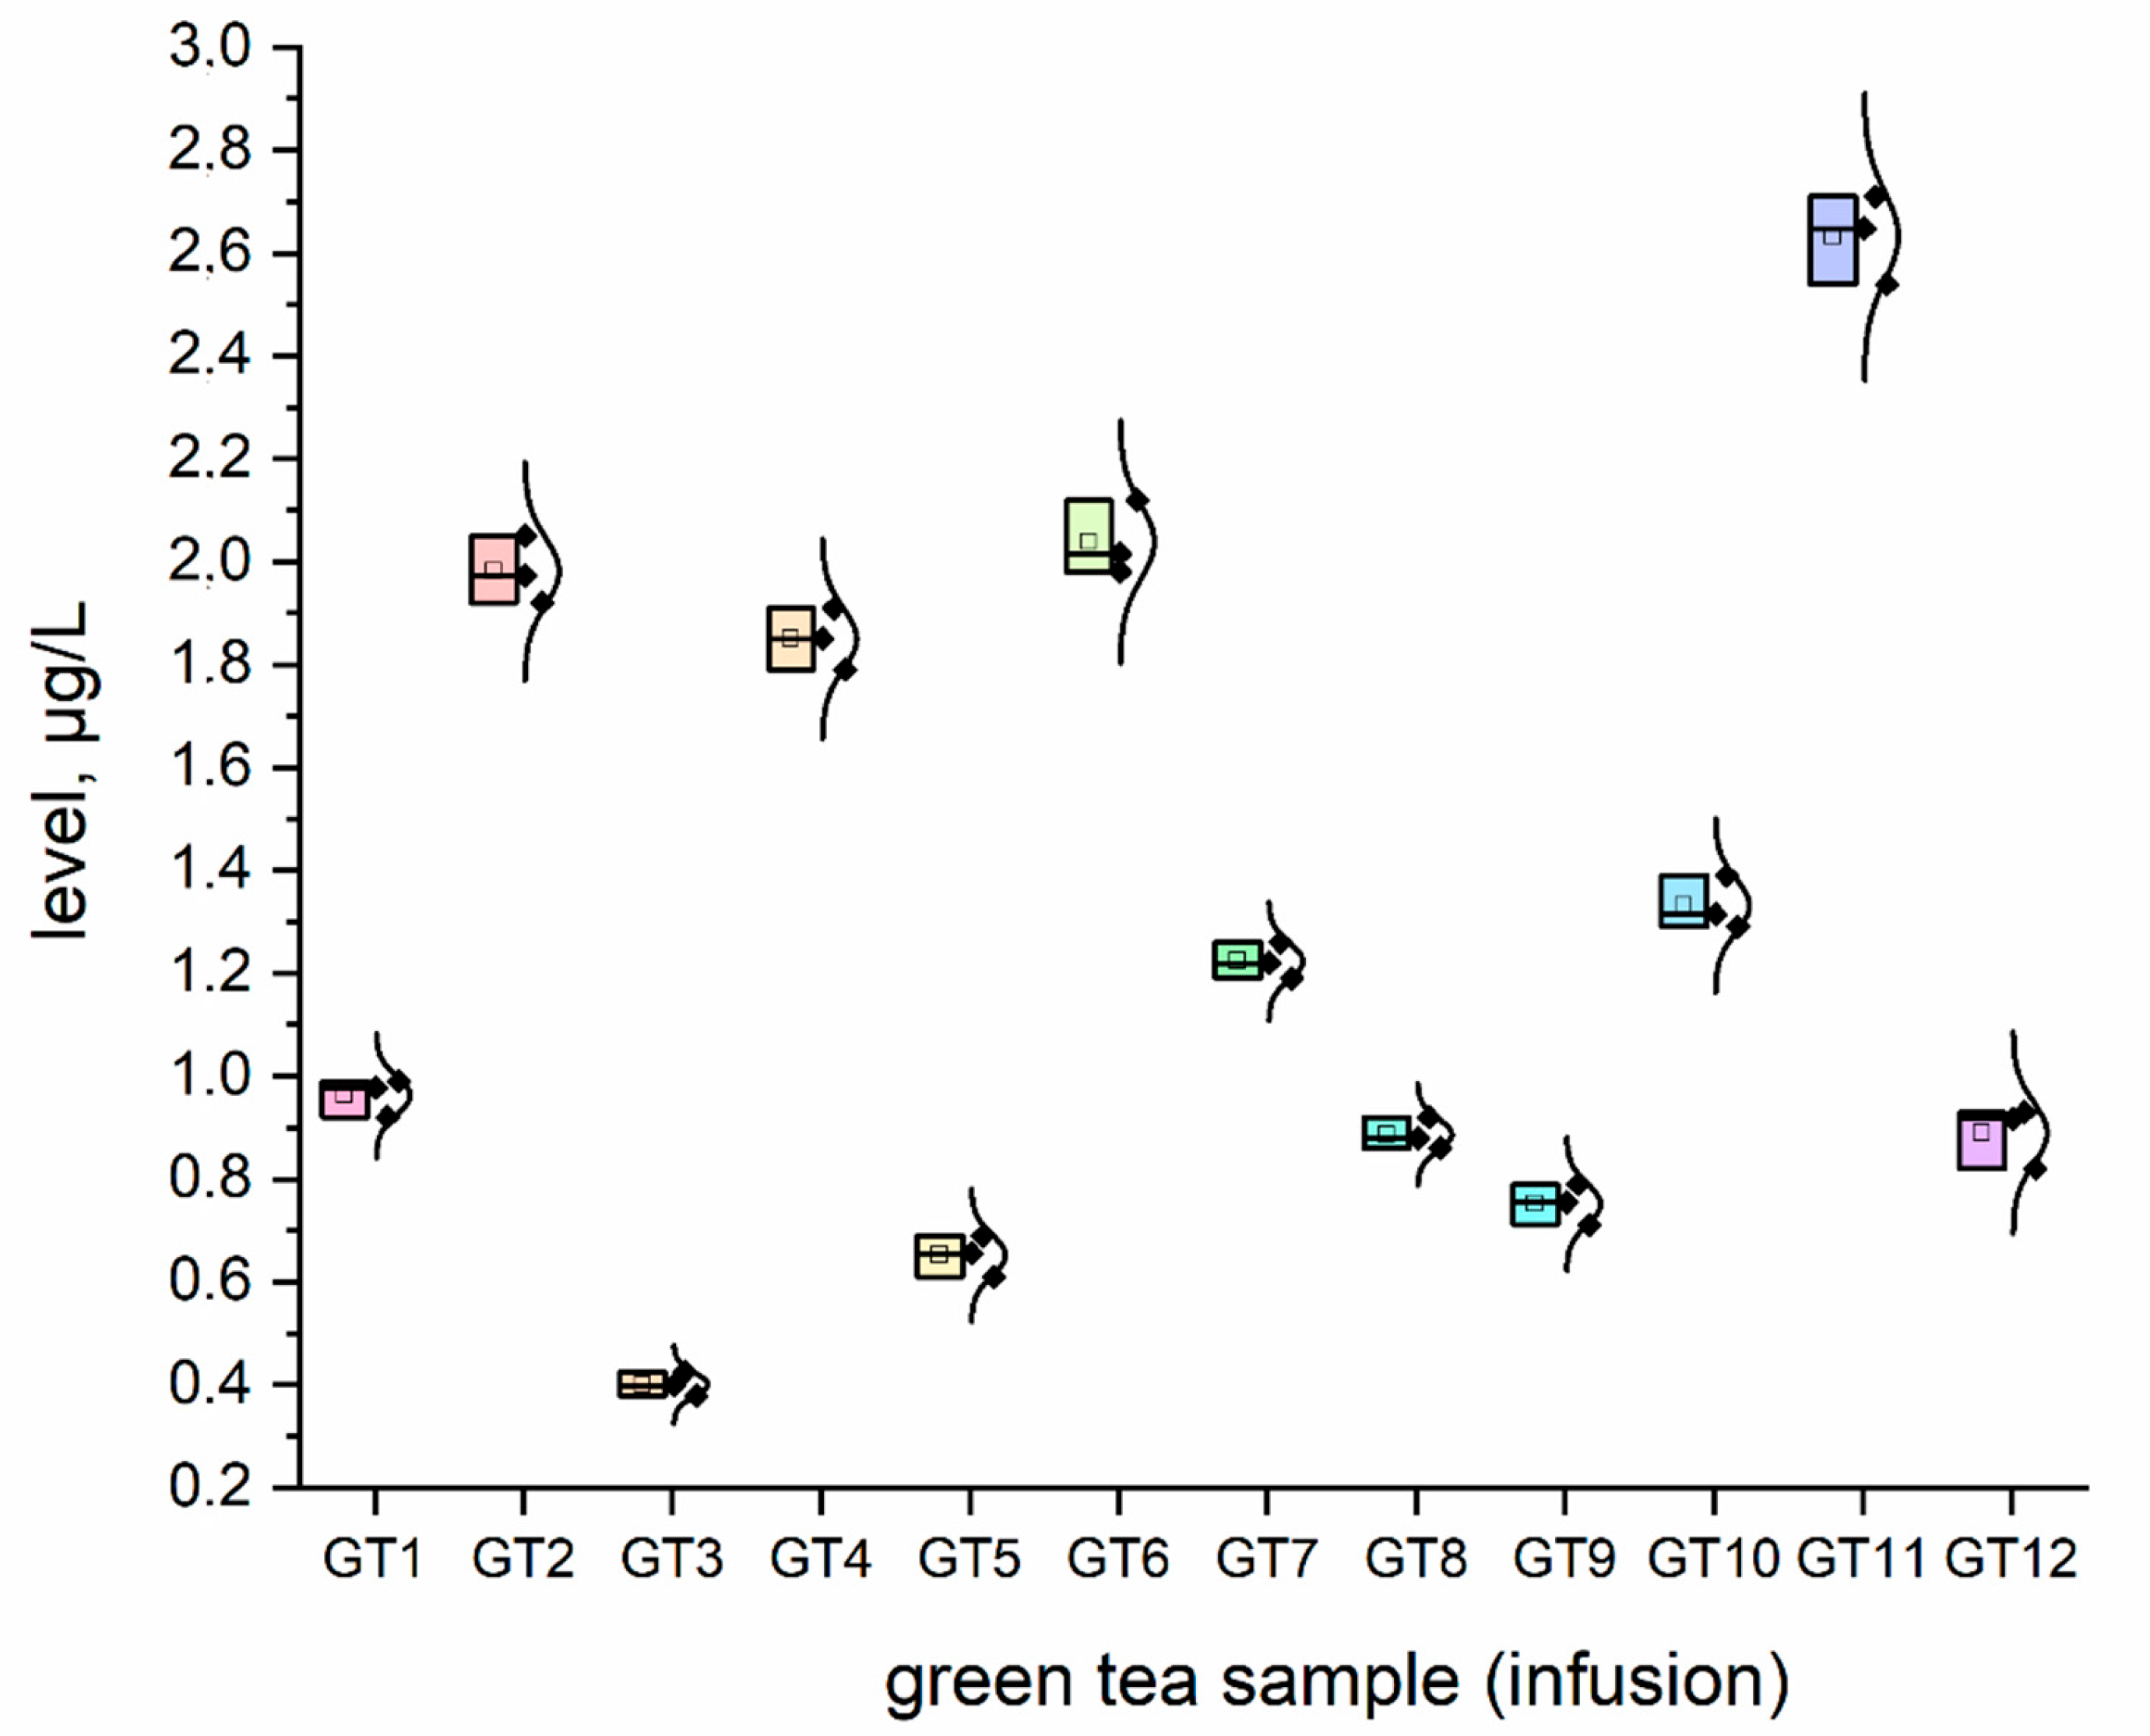
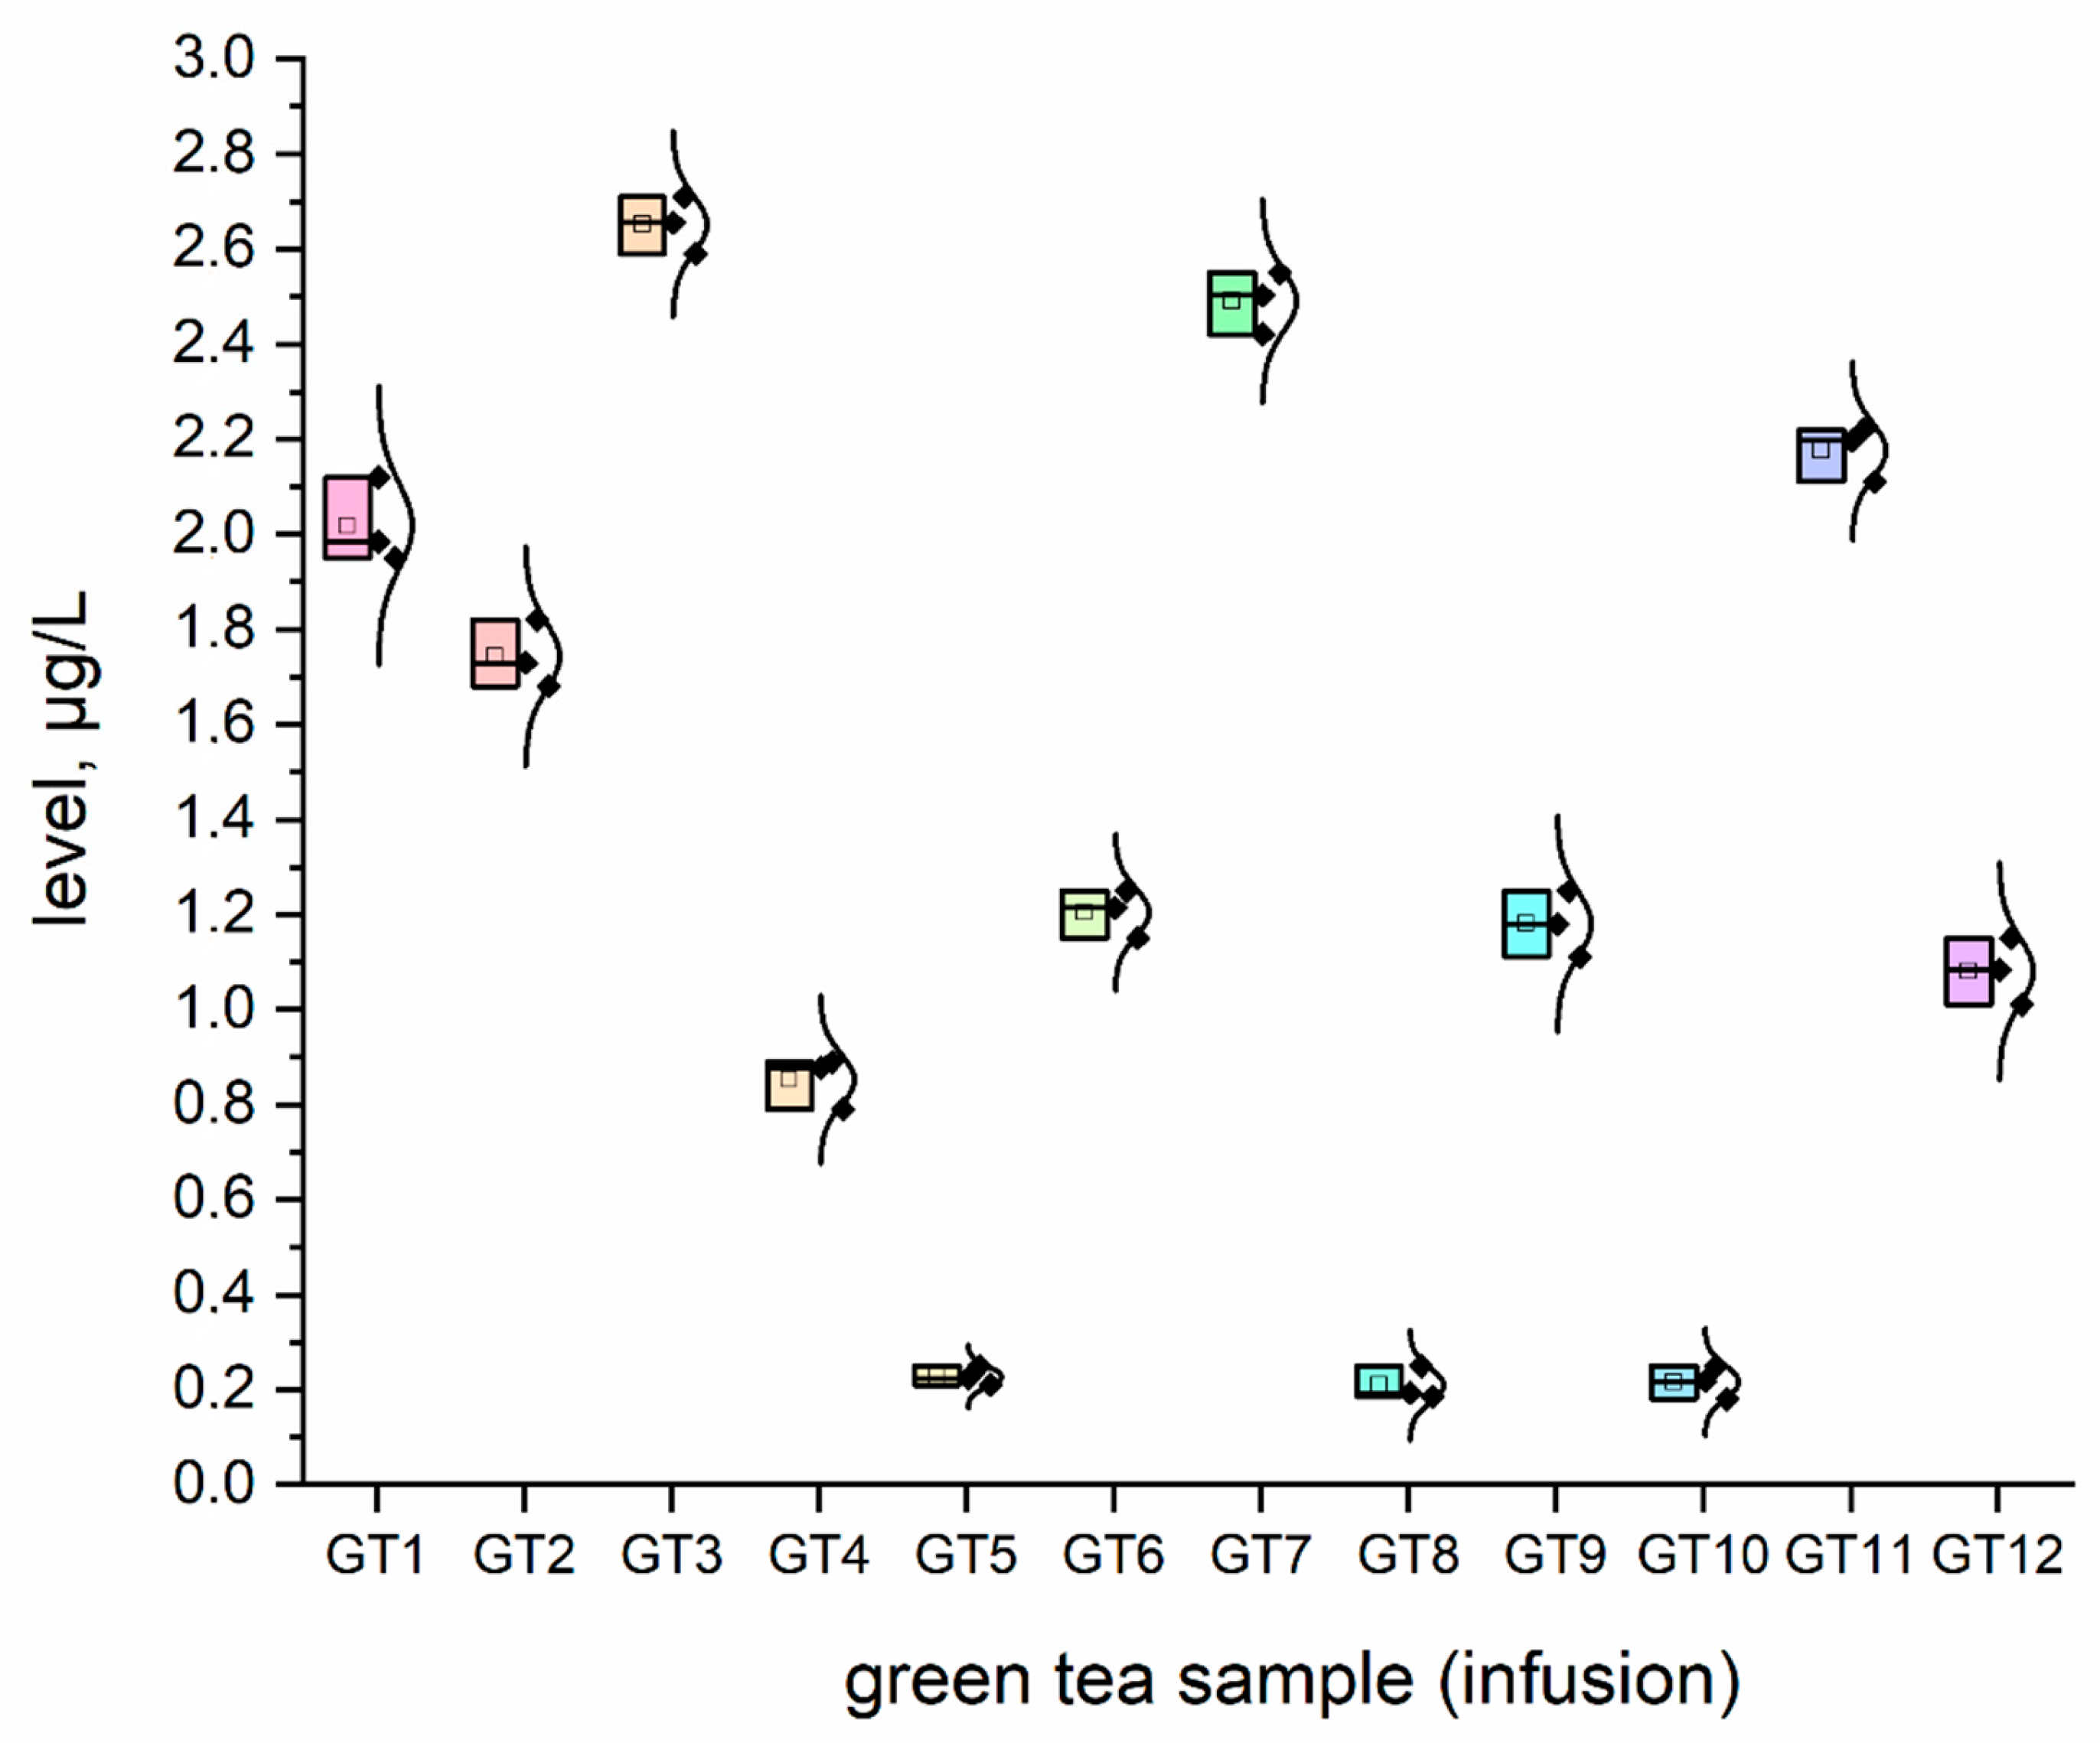
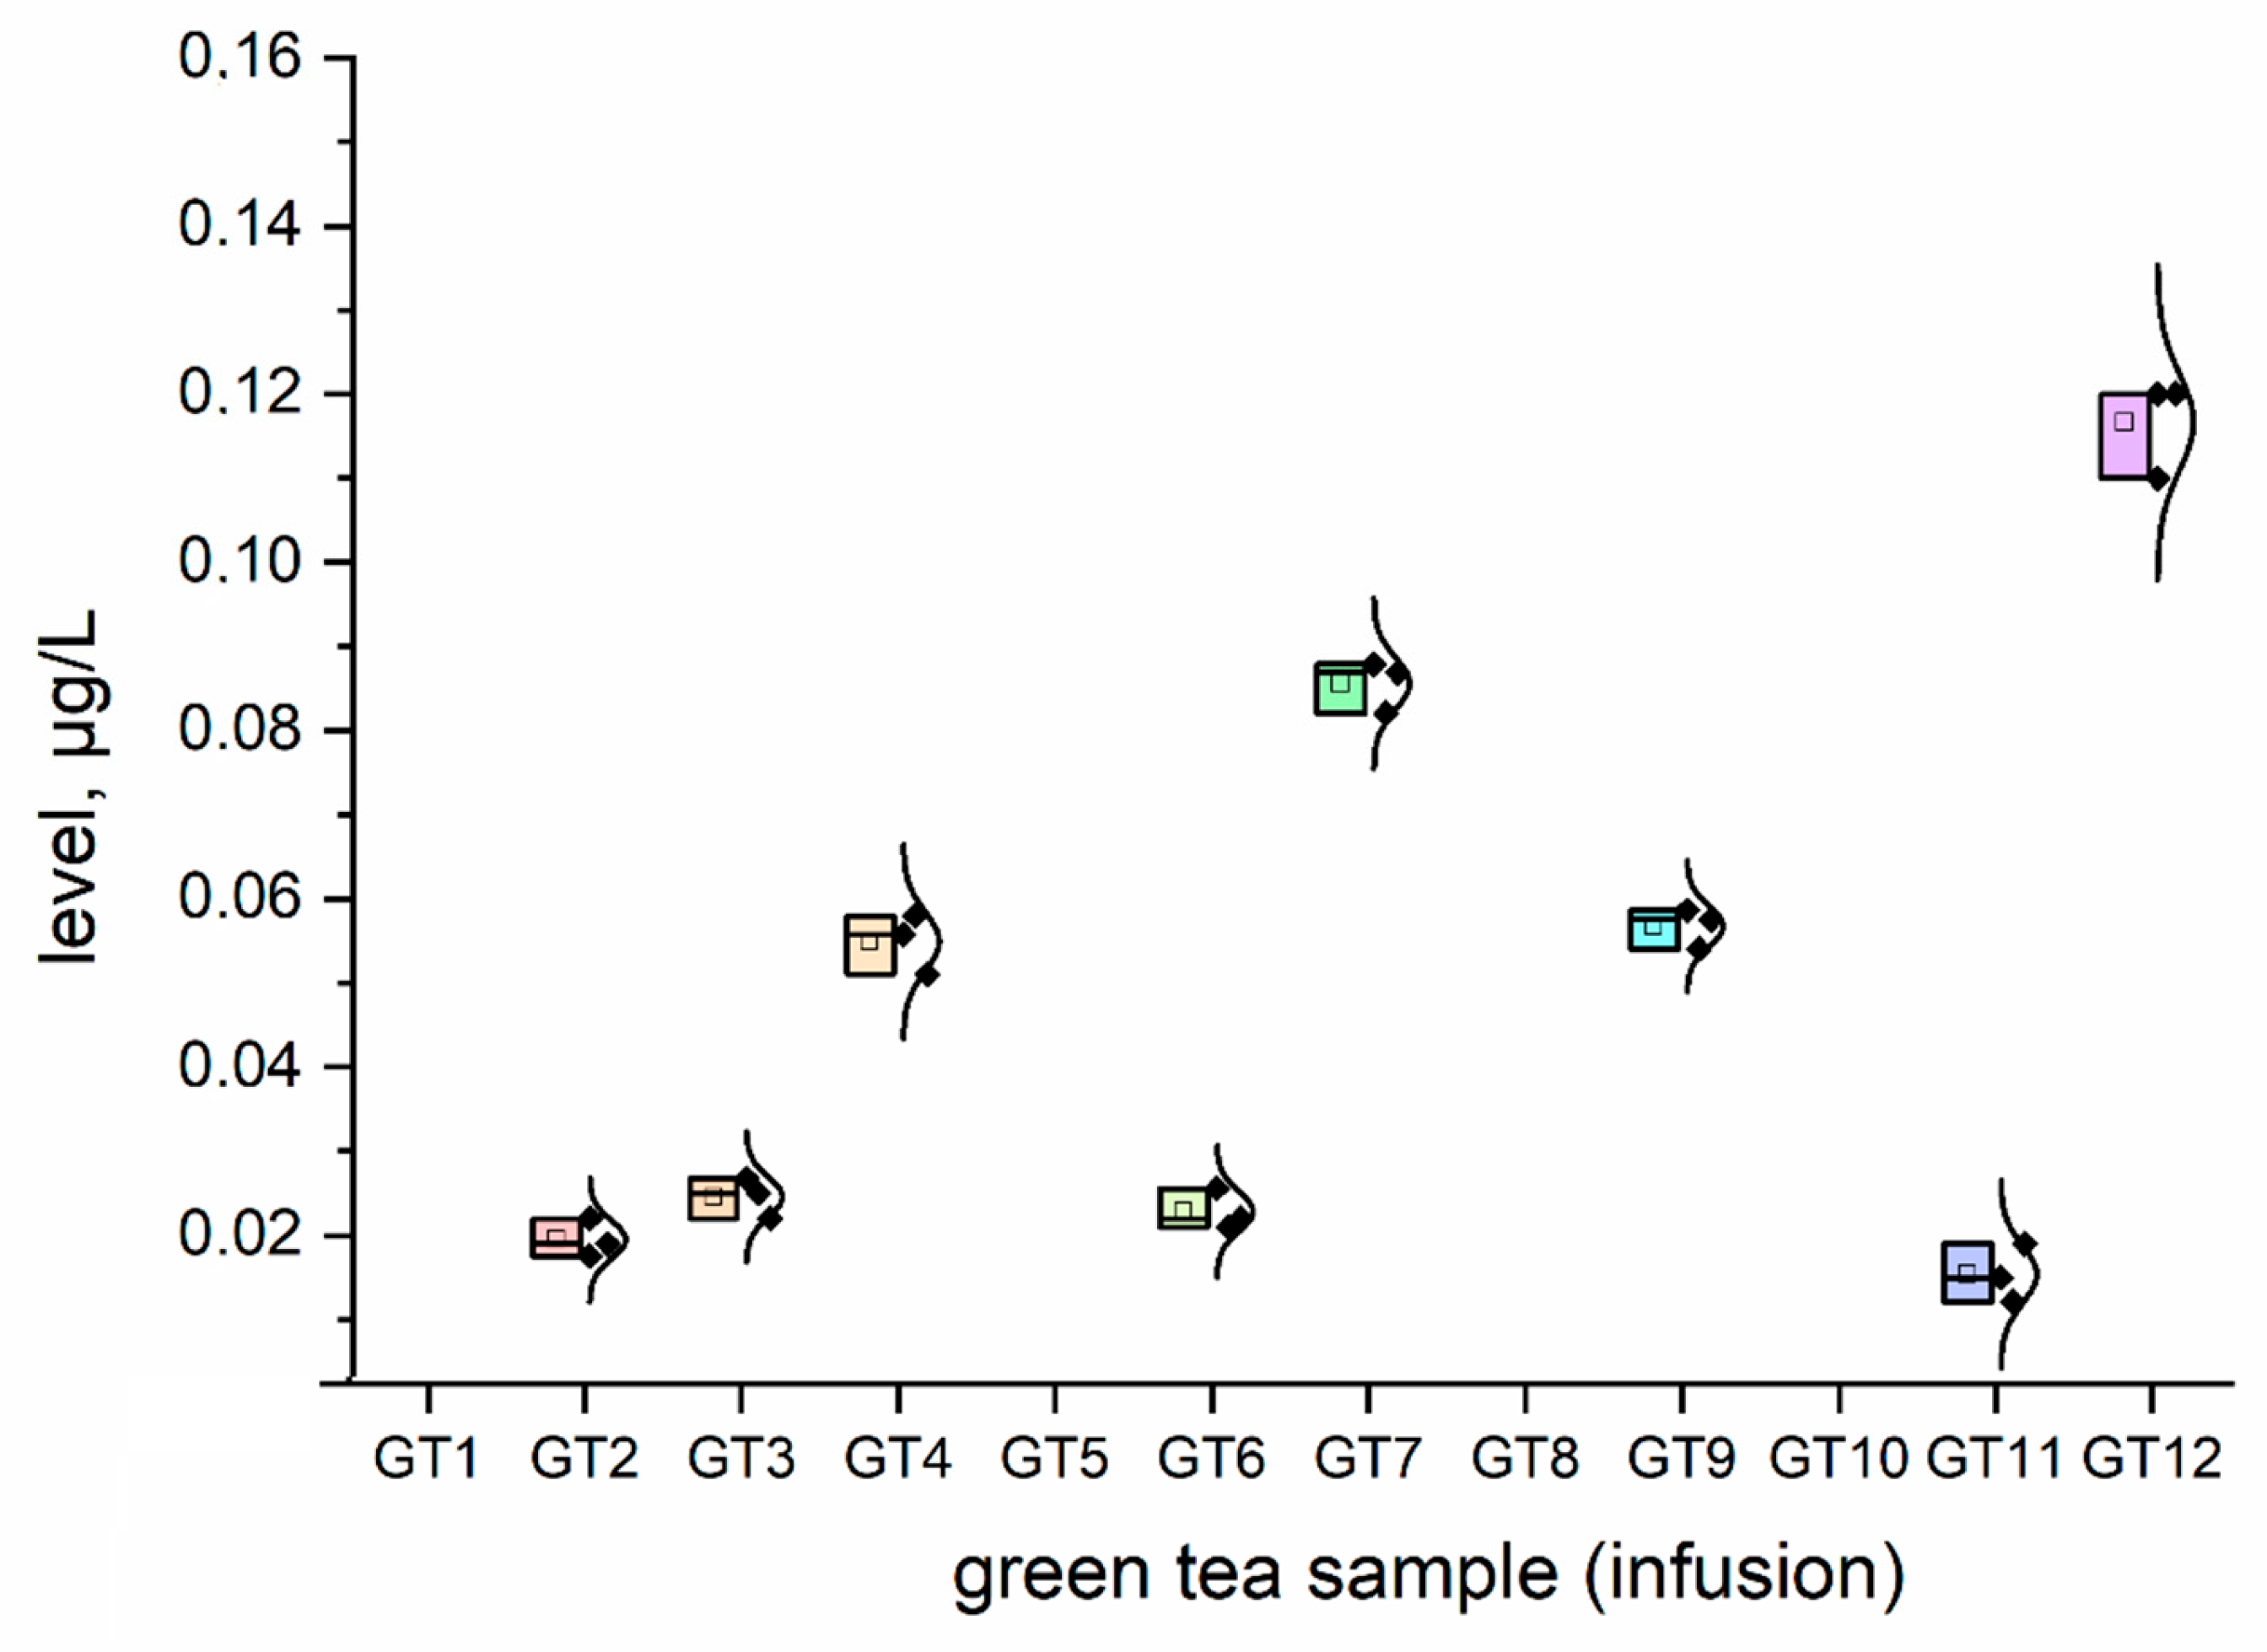
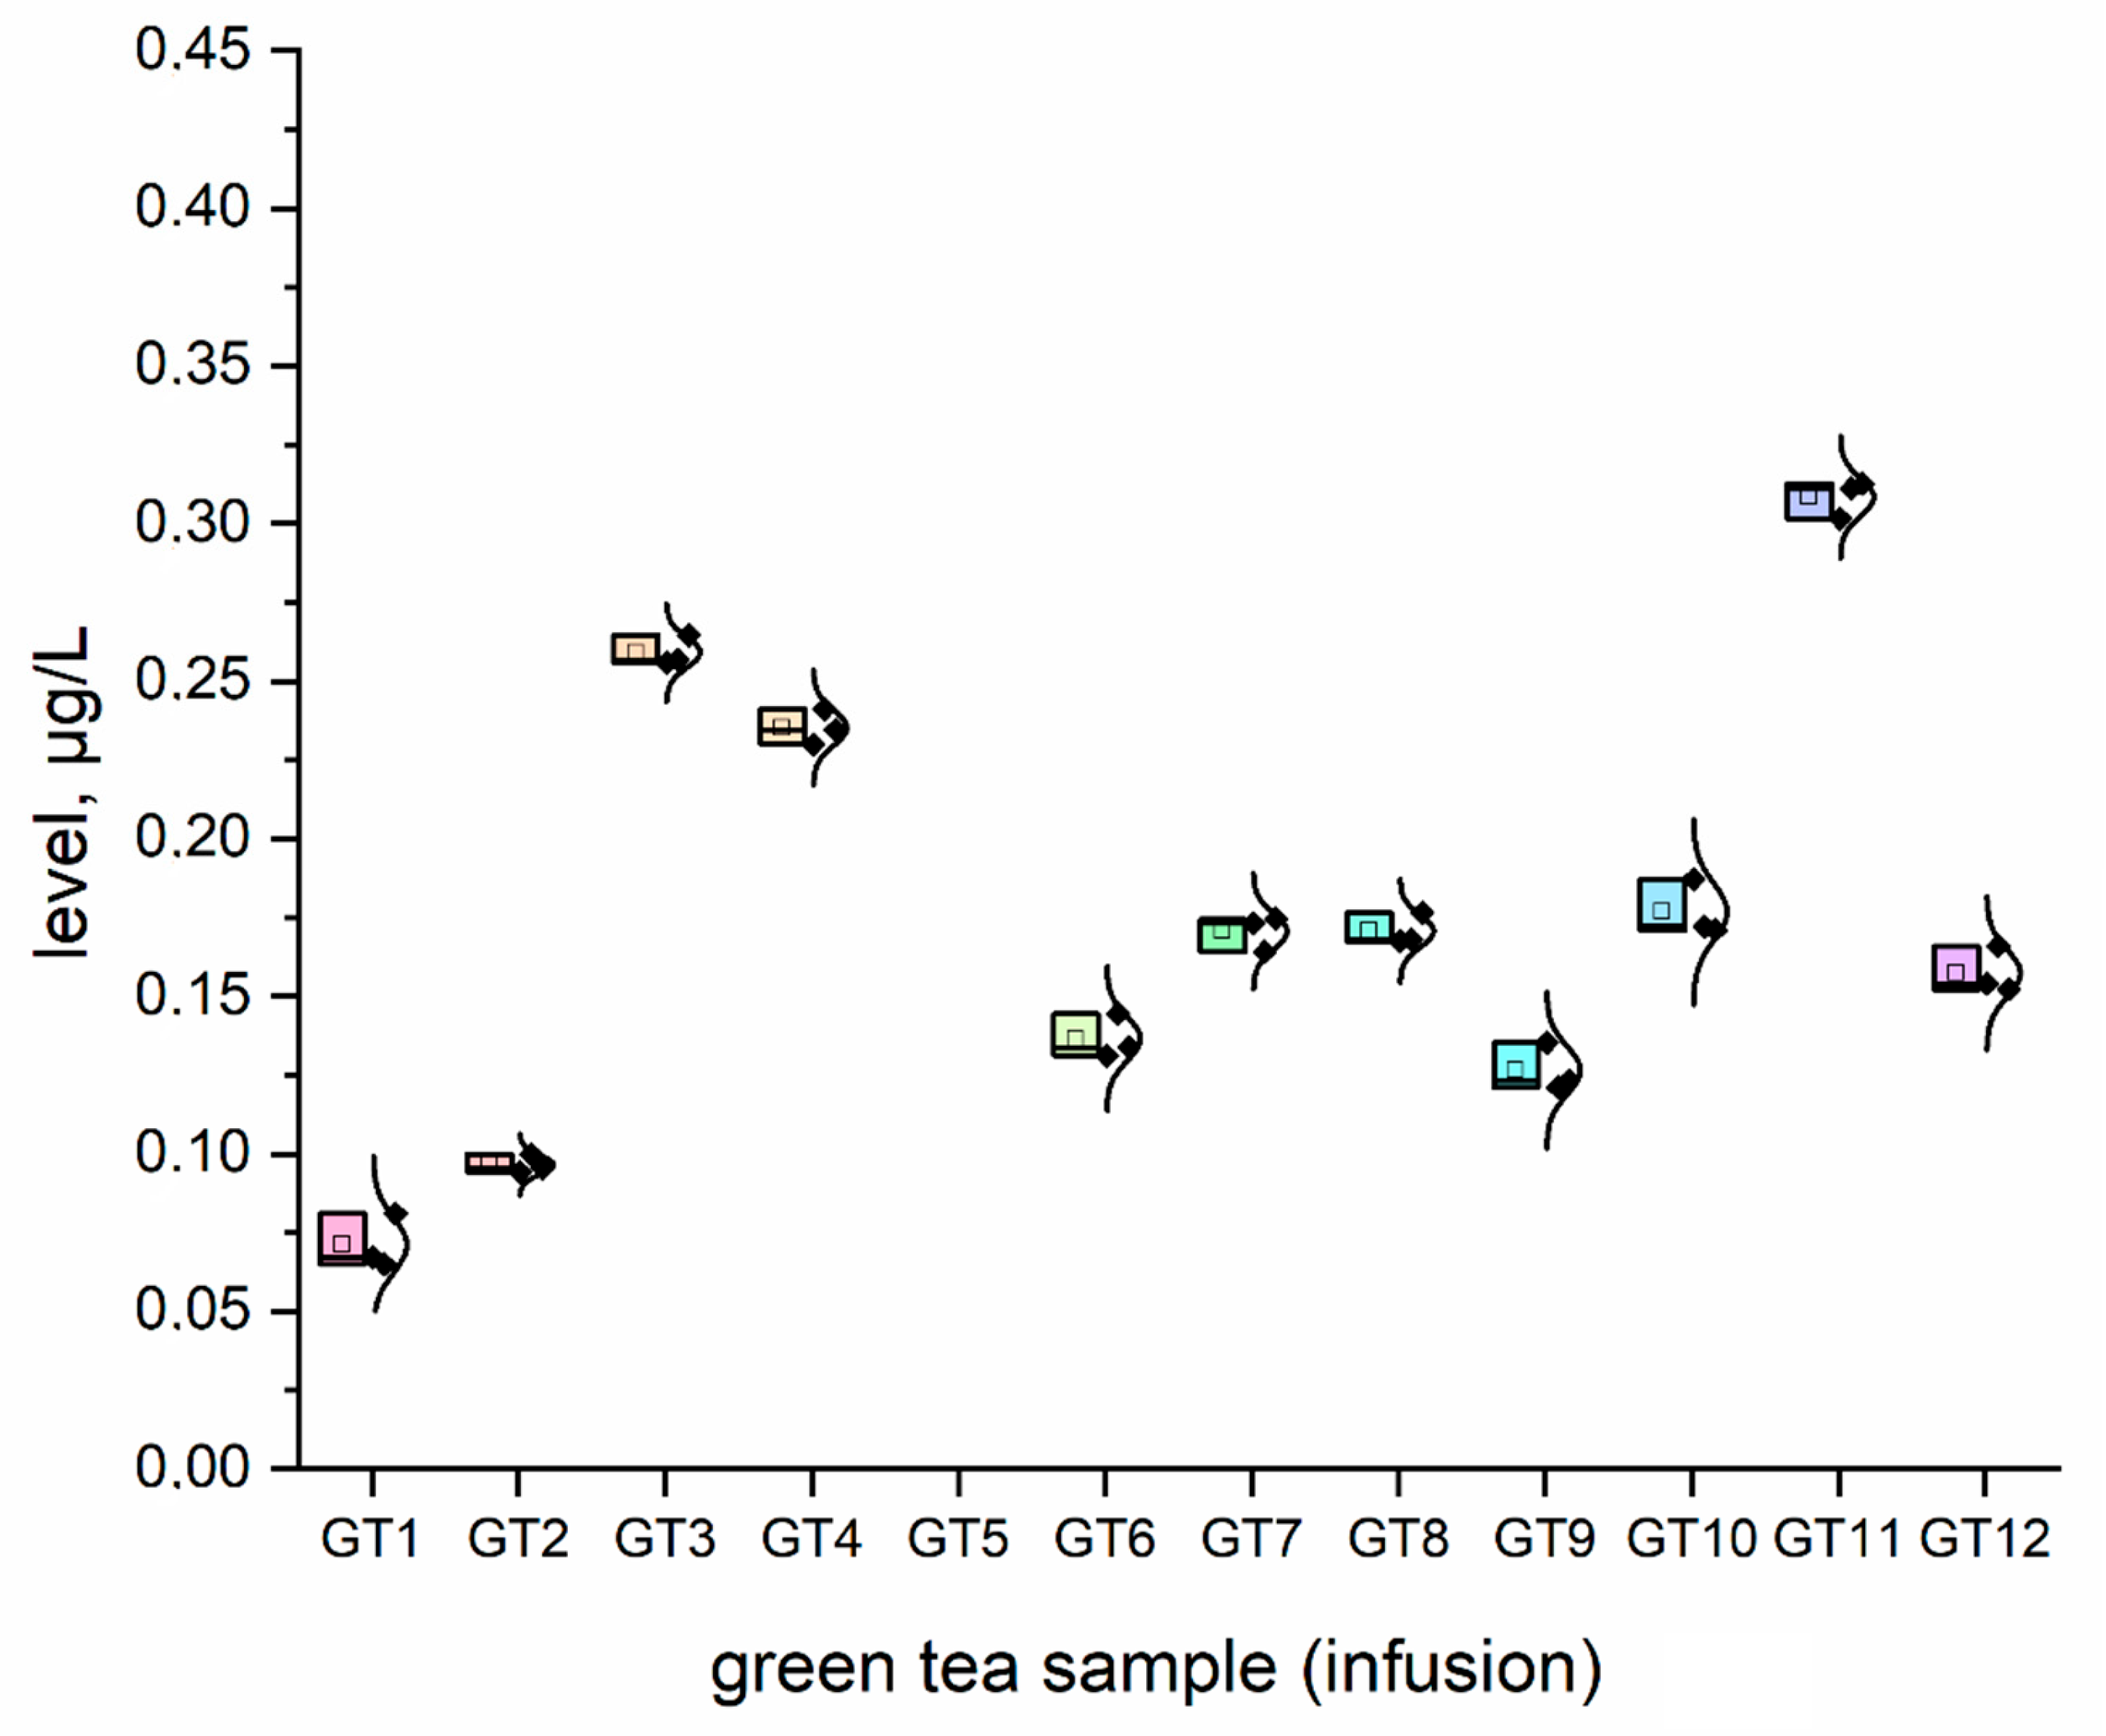
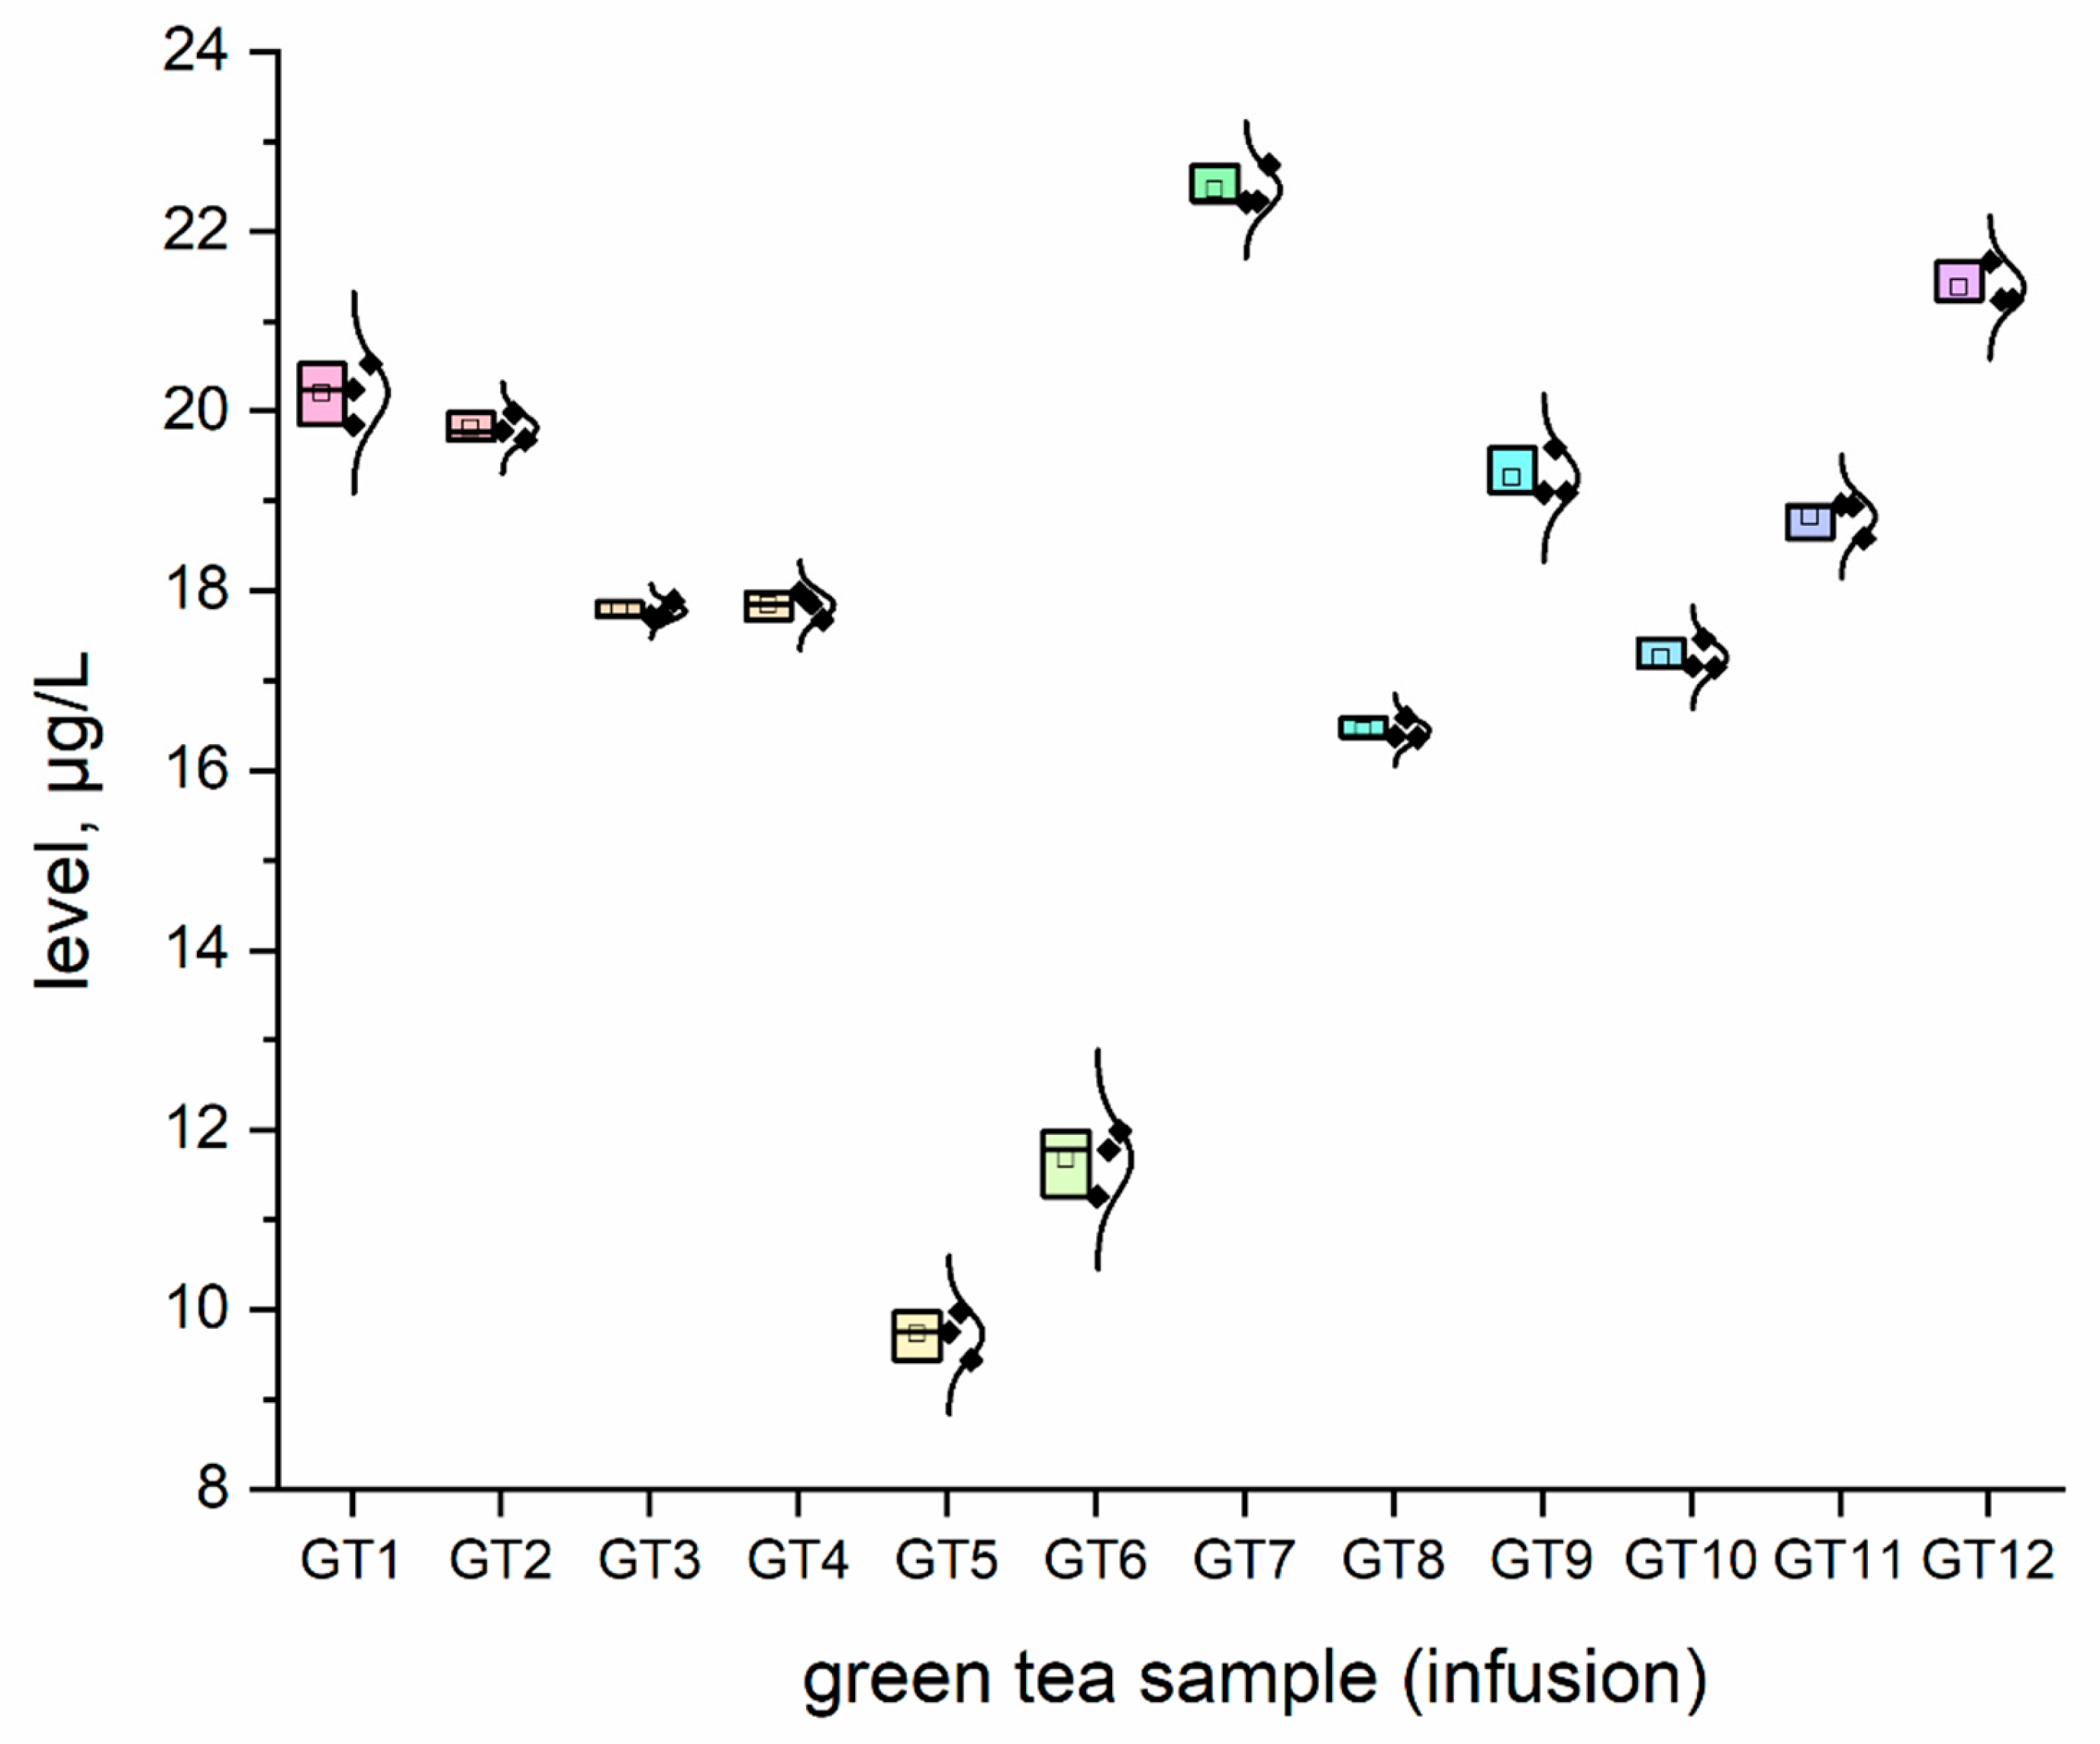
3.1. The NEI and Traditional EI Profiles of All Investigated Green Tea Samples

The concentration (μg/L) of all investigated elemental impurities (Ag, Au, Co, Cr, Cs, Li, Mo, Se, and Sr) in all samples (n = 12; GT1–GT12) are shown in Figure 1, Figure 2, Figure 3, Figure 4, Figure 5, Figure 6 and Figure 7 as NEI and traditional EI profiles by plots, as box diagrams. All the green tea samples analysed generally contained investigated elements at different concentrations. The descriptive statistics (minimum, maximum, mean, RSD) are shown in Table 4.
All analysed green tea infusions contained all elemental impurities except silver. This element was present only in two samples; that is, GT1: 0.364 ± 0.05 μg/L and GT3: 15.748 ± 0.09 μg/L. Surprisingly, the Ag concentration in the GT3 sample was enormously high (15.748 ± 0.09 μg/L). In seven samples (GT1, GT2, GT3, GT4, GT5, GT9, and GT12), Au was present at relatively low concentrations (0.105–0.0830 μg/L). Figure 1 shows that Sr (9.848–22.331 μg/L), and Cr (7.121–10.993 μg/L) had the highest concentrations across all samples. Co (2.989 ± 0.07 μg/L), Cs (2.654 ± 0.04 μg/L), and Li (2.667 ± 0.05 μg/L) had similar maximum concentrations. The lowest concentration was observed for Mo (0.0113–0.107 μg/L). Interestingly, Ag (0.364–15.748 μg/L) and Se (0.067–0.308 μg/L) had variable values. These observations are unrelated to tea-related factors (form, raw material used, brewing time, or origin).

3.2. The Toxicological Risk Assessment

As described in Table 3, the second step of our toxicological risk assessment was the weekly EI assessment (based on consumption scenarios). Because there are many consumption scenarios, this was difficult. The worst scenario (WC) is usually applied to toxicological risk assessments, i.e., the highest possible frequency of weekly tea consumption. Assuming that the average consumer drinks 3–10 cups of green tea daily, the weekly intake of the elements investigated from the infusion of green tea is estimated in Table 5. The last step was estimating the weekly intake based on the weight and weekly consumption of green tea. The weekly intake of each element in the investigated samples was calculated by dividing it by 70 kg (average adult weight recommended by EFSA [50]). The results obtained are shown in Table 5.

4. Discussion

For complex toxicological risk assessment, we have implemented appropriate strategies composed of three key steps (Table 3). The first step was the analysis of the preliminary results of the determination of the elemental impurities (EIs) of the green tea infusion (GT1–GT12) investigated as NEI, based on the ICP-MS method, with the EI profile and descriptive statistics (minimum, maximum, average). In this phase, we demonstrated that all green tea infusions (impurities profile: Figure 1, and normal distribution curve boxes: Figure 2, Figure 3, Figure 4, Figure 5, Figure 6 and Figure 7) show a relatively low concentration of EIs in all green tea infusions. The element profiles obtained in the green tea infusions revealed the presence of Ag (0.364–15.748 μg/L), Au (0.0105–0.0830 μg/L), Co (0.580–0.989 μg/L), Cr (7.121–10.993 μg/L), Cs (0.399–2.664 μg/L), Li (0.205–2.667 μg/L), Mo (0.0113–0.107 μg/L), and Se (0.067–22.331 μg/L). It should be noted that Ag was present only in two samples (GT1: 0.364 ± 0.05 μg/L and GT3: 15.748 ± 0.09 μg/L). Surprisingly, Ag concentration in the GT3 sample was enormously high (15.748 ± 0.09 μg/L). Furthermore, seven samples (GT1, GT2, GT3, GT4, GT5, GT9, and GT12) contained Au, but were relatively low (0.105–0.0830 μg/L). This article is the first in the scientific literature to determine the selected elements of the green tea infusion (raw results). We tried to compare our results (μg/L) with data from the literature on selected elements. Only one article [51] described the determination of the same elements, but only four of the elements (Co = 1.715 μg/L, Cs = 1.515 μg/L, Mo = 0.043 μg/L, Sr = 7.25 μg/L) coincided. The results are very comparable for the first three elements, and the only significant difference is in the case of strontium (in our case, Sr = 17.763 µg/L). The difference may result from comparing the average values based on the product ranges of the variables and the products analysed (n = 12). There are several articles in the scientific literature in which the elements were also determined. However, compared to our article, dry matter and green tea leaves were used as samples for analysis, and the data were presented in µg/g, µg/kg and mg/kg [52,53,54,55,56,57]. In the second and third steps of toxicological risk assessment, the weekly intake (μg/week) in the 600–2000 ml range, and the weekly intake per body weight depending on green tea consumption, were examined (Table 5). Since most of the EIs in the investigation (Ag, Au, Co, Cr, Cs, Li, Mo, and Sr) did not have an established value of PTWI, individual health risk assessments were evaluated. The results indicate that daily EI concentrations should not represent a health risk to consumers after consuming green tea infusions from the products available on the Polish market. The possible assessment of health risks did not show any health hazards to consumers for weekly exposure only for Se.

4.1. Silver

Silver is a naturally occurring element. Silver can exist in various forms, such as soluble silver compounds, insoluble compounds, or in the form of metallic silver. Soluble silver compounds can potentially cause adverse effects on the human body, because they are more easily absorbed than metallic or insoluble silver. In the example of overexposure to silver nitrate, symptoms include diarrhoea, stomach irritation, breathing problems, or a drop in blood pressure. After prolonged inhalation or ingestion of soluble silver compounds or colloidal silver, the most familiar characteristic, irreversible discolouration of the skin (argyria) and/or eyes (argyrosis), may appear [58]. With reference to the daily consumption (about 250 ml of green tea infusion daily), the estimated daily exposure to Ag was approximately 0.03122–4.4994 μg/day. According to the ICH guideline Q3D (R1) on elemental contaminants, the established permitted daily exposure (PDE and oral exposure) for Ag is 167 μg/day [59]. This means that drinking green tea is safe. Silver was present only in two samples (GT1: 0.364 ± 0.05 μg/L and GT3: 15.748 ± 0.09, μg/L).

4.2. Gold

Gold was present in all samples (0.105–0.0830 μg/L), but in seven at relatively low concentrations. Toxicity studies have shown that Au tends to exhibit relatively little, if any, toxicity, since many cytotoxicity studies show that gold is non-toxic [60]. The gastrointestinal tract partially absorbs elemental gold or released ions. Organs such as the liver, heart, kidneys, and lungs receive gold. Gold is primarily expelled in the urine after ingestion. There are only a few studies on the oral toxicity of elemental gold. According to Hadrup et al., rats in their investigation were unaffected by a single dose of 2000 mg of nanoparticles/kg body weight, suggesting that elemental gold has low acute toxicity [61]. According to the ICH Q3D guideline (R1), the PDE for Au of 134 μg/day, Au impurities are not hazardous to human health and are not pollutants with a crucial concentration in the environment. The study showed that you could take 0.00049–0.02074 μg/day of Au when drinking green tea (250 mL of green tea infusion per day), which is safe for health.

4.3. Cobalt

Cobalt has magnetic properties and promotes oxidation and reduction reactions. Exposure to cobalt and its compounds causes adverse health effects, such as carcinogenicity in humans [62]. Cobalt impurities were observed in all samples (0.580–2.989 μg/L). There was no Co assessment in the Joint FAO/WHO Expert Committee on Food Additives (JECFA) database. The established PDE (oral exposure) for Co by the ICH Q3D guideline (R1) is 50 µg/day [59]. Compared to the findings of this investigation, the Co impurities in green tea are low. Providing the body with such an amount of cobalt, by consuming the green tea available in Poland, does not threaten human health. The estimated daily exposure of the body to this element is between 0.07904 and 0.85421 μg/day (approximately 250 mL of green tea infusion per day). Co impurities are negligible compared to the 50 g/day (oral exposure) Co established PDE by the ICH Q3D (R1) guideline [59], and do not pose a risk to people.

4.4. Chromium

Chromium (Cr) is a “hazy” chemical element regarding human health. Although it is a crucial micronutrient, it is also linked to several diseases and toxic effects, including carcinogenicity. We still do not fully understand how Cr and its components work in humans. The chromium content in tested teas varied between 7.121 and 10.993 μg/L. Chromium PDE is described in the ICH guideline Q3D (R1), which is 10700 μg/day [59]. In the tested green teas, the Cr concentration was within the range of 7.12–10.99 μg/L. According to our estimates, drinking green tea does not pose a risk of chromium toxicity.

4.5. Caesium

Caesium was present in each tested sample, in concentrations between 0.399 and 2.654 μg/L. The knowledge of the metabolism and toxicity of caesium is limited [63]. Oral consumption of caesium chloride has been widely promoted based on a hypothesis called “high-pH cancer treatment” [64]. This element is excreted by the kidneys in humans. The biokinetic model gives the following percentages: urine at 85%, faeces at 13%, and sweat at 2% [65]. Taking into account the content of caesium in green tea infusions tested in Poland, its consumption appears safe for the human body. The ICH Q3D (R1) guideline and the Joint FAO/WHO Expert Committee on Food Additives (JECFA) database lack Cs papers. As a result, it is impossible to compare the data obtained, although the low concentration of this element suggests no significant health problems for humans.

4.6. Lithium

A popular and successful treatment for mood disorders is lithium. Although there has been concern about its safety, there is insufficient evidence for side effects. The lithium content in the tested samples varied between 0.205 and 2.667 μg/L. Lithium can be harmful if used in excess or in situations with a risk of fluid or sodium deficit. When drinking green tea, the risk of lithium toxicity is not significant [34]. Consuming green tea infusions does not pose a risk associated with the toxic effects of lithium. The established PDE (oral exposure) for Li by the ICH Q3D guideline (R1) is based on human experience with this element, and is approximately 560 μg/day. Since the expected daily exposure to Li in the items under investigation (approximately 250 mL of green tea infusion per day) ranges from 0.0185 to 0.7170 μg/day, there is no potential issue with Li exposure after green tea consumption.

4.7. Molybdenum

Very little is known about the effects of Mo on human health. This trace element is essential for both animals and plants. In mammals, molybdenum is present as a component of some metalloflavoproteins. Molybdenum is present in drinking water in the range of 0.11–6.2 or 0–20 μg L−1 [66]. Our studies found low molybdenum concentrations in green tea infusions (0.0113–0.107 μg/L). From a regulatory point of view, this element only has a PDE (oral) value of 3400 g/day [59]. No risk is associated with green tea infusions, because the Mo concentration range in the infusions tested was between 0.002177 and 0.02488 μg/day.

4.8. Strontium

The estimated exposure to strontium in the green tea infusions investigated available in Poland was in the range of 9.848–22.331 μg/L. Strontium had the highest concentrations across all samples. However, our results compared to the value of PDE (oral) for this element, described in the ICH Q3D (R1) guideline, which is 120 µg/day, are relatively low; therefore, strontium concentrations do not pose a health risk, including drinking green tea infusions available in Poland.

4.9. Selenium

Selenium is poisonous at high concentrations, and several examples of apparent toxicity and fatalities after acute poisoning have been documented [67]. The trace element selenium (Se) is essential for synthesising amino acids, such as selenocysteine and selenomethionine. We discuss the acute hazardous effects, including exposure and concentrations in the blood and urine, linked to mortality [67]. The selenium content in the tested green tea samples was in the range of 0.067–0.308 μg/L. With the regular consumption of green tea, selenium contamination does not threaten the human body health. The PTWI for selenium is 66 μg/kg bw/week, meaning drinking 600–2000 mL of green tea covered by the study is safe for the human body [68].

5. Conclusions

Our developed EI research health risk assessment strategy provides pioneering data (Ag, Au, Co, Cr, Cs, Li, Mo, Se, and Sr) and can be helpful for additional research and manufacturers. Furthermore, well-designed health risk assessment methods will be valuable and essential for public health and environmental studies. As these environmental studies are rare, it would be useful to conduct a broader study considering other green tea infusions in different countries, differentiating them, for example, according to their origin, supply chain, and other aspects of food production that may restrict the toxicological safety of green teas.

Supplementary Materials

The following supporting information can be downloaded at: https://www.mdpi.com/article/10.3390/nu15061460/s1, Table S1. The summary of analytical calibration strategy and quality control results.

Author Contributions

Conceptualization, K.J.; Methodology, K.J. and M.K.; Validation, M.K.; Formal analysis, E.K.-P., M.K. and K.J.; Investigation, K.J.; Sample collection, E.K.-P.; Data curation, K.J.; Writing-original draft preparation, J.M., A.F., M.N., M.K. and K.J.; Writing-review and editing, J.M., A.F., M.N., M.K. and K.J.; Visualization, M.N. and K.J.; Project administration, K.J. All authors have read and agreed to the published version of the manuscript.

Funding

This research received no external funding.

Institutional Review Board Statement

Not applicable.

Informed Consent Statement

Not applicable.

Data Availability Statement

The datasets generated during and/or analysed during the current study are available from Kamil Jurowski (kjurowski@ur.edu.pl) upon reasonable request.

Acknowledgments

The authors wish to express their gratitude to Barbara Tatar and Maria Fołta (the Department of Food Chemistry and Nutrition, Medical College, Jagiellonian University, Medyczna 9, 30-688 Kraków, Poland) for excellent technical assistance. This work was not supported by any grant. The authors would like to thank their English-native colleague for the superb language revisions.

Conflicts of Interest

The authors declare that they have no known competing financial interest or personal relationships that could have appeared to influence the work reported in this paper.

Abbreviations

EANEuropean article number
EGCG(-)-epigallocatechin-3-gallate
EIElemental impurity
FAOThe Food and Agriculture Organization
FDAFood and Drug Administration
ICHThe International Council for Harmonisation of Technical Requirements for Pharmaceuticals for Human Use
ICP-MSInductively coupled plasma mass spectrometry
JECFAJoint FAO Expert Committee on Food Additives
NEINew elemental impurity
PTWIProvisional tolerable weekly intake
RSDRelative standard deviation
TRAToxicological risk assessment
WHOWorld Health Organization

References

  1. McKay, D.L.; Blumberg, J.B. A Review of the Bioactivity and Potential Health Benefits of Peppermint Tea (Mentha piperita L.). Phytother. Res. 2006, 20, 619–633. [Google Scholar] [CrossRef] [PubMed]
  2. Prasanth, M.; Sivamaruthi, B.; Chaiyasut, C.; Tencomnao, T. A Review of the Role of Green Tea (Camellia sinensis) in Antiphotoaging, Stress Resistance, Neuroprotection, and Autophagy. Nutrients 2019, 11, 474. [Google Scholar] [CrossRef] [Green Version]
  3. Chacko, S.M.; Thambi, P.T.; Kuttan, R.; Nishigaki, I. Beneficial Effects of Green Tea: A Literature Review. Chin. Med. 2010, 5, 13. [Google Scholar] [CrossRef] [PubMed] [Green Version]
  4. Zhao, T.; Li, C.; Wang, S.; Song, X. Green Tea (Camellia sinensis): A Review of Its Phytochemistry, Pharmacology, and Toxicology. Molecules 2022, 27, 3909. [Google Scholar] [CrossRef] [PubMed]
  5. McKay, D.L.; Blumberg, J.B. The Role of Tea in Human Health: An Update. J. Am. Coll. Nutr. 2002, 21, 1–13. [Google Scholar] [CrossRef] [PubMed]
  6. Wierzejska, R. Tea and Health—A Review of the Current State of Knowledge. Przegl. Epidemiol. 2014, 68, 501–506, 595–599. [Google Scholar] [PubMed]
  7. Higdon, J.V.; Frei, B. Tea Catechins and Polyphenols: Health Effects, Metabolism, and Antioxidant Functions. Crit. Rev. Food Sci. Nutr. 2003, 43, 89–143. [Google Scholar] [CrossRef] [PubMed]
  8. Rietveld, A.; Wiseman, S. Antioxidant Effects of Tea: Evidence from Human Clinical Trials. J. Nutr. 2003, 133, 3285S–3292S. [Google Scholar] [CrossRef] [PubMed] [Green Version]
  9. Osada, K.; Takahashi, M.; Hoshina, S.; Nakamura, M.; Nakamura, S.; Sugano, M. Tea Catechins Inhibit Cholesterol Oxidation Accompanying Oxidation of Low Density Lipoprotein in Vitro. Comp. Biochem. Physiol. Part C Toxicol. Pharmacol. 2001, 128, 153–164. [Google Scholar] [CrossRef] [PubMed]
  10. Raederstorff, D.G.; Schlachter, M.F.; Elste, V.; Weber, P. Effect of EGCG on Lipid Absorption and Plasma Lipid Levels in Rats. J. Nutr. Biochem. 2003, 14, 326–332. [Google Scholar] [CrossRef] [PubMed]
  11. Crespy, V.; Williamson, G. A Review of the Health Effects of Green Tea Catechins in In Vivo Animal Models. J. Nutr. 2004, 134, 3431S–3440S. [Google Scholar] [CrossRef] [PubMed] [Green Version]
  12. Koo, M.W.L.; Cho, C.H. Pharmacological Effects of Green Tea on the Gastrointestinal System. Eur. J. Pharmacol. 2004, 500, 177–185. [Google Scholar] [CrossRef]
  13. Zaveri, N.T. Green Tea and Its Polyphenolic Catechins: Medicinal Uses in Cancer and Noncancer Applications. Life Sci. 2006, 78, 2073–2080. [Google Scholar] [CrossRef]
  14. De Amorim, L.M.N.; Vaz, S.R.; Cesário, G.; Coelho, A.S.G.; Botelho, P.B. Effect of Green Tea Extract on Bone Mass and Body Composition in Individuals with Diabetes. J. Funct. Foods 2018, 40, 589–594. [Google Scholar] [CrossRef]
  15. Babu, P.V.A.; Sabitha, K.E.; Shyamaladevi, C.S. Therapeutic Effect of Green Tea Extract on Oxidative Stress in Aorta and Heart of Streptozotocin Diabetic Rats. Chem. Biol. Interact. 2006, 162, 114–120. [Google Scholar] [CrossRef] [PubMed]
  16. Unno, K.; Takabayashi, F.; Yoshida, H.; Choba, D.; Fukutomi, R.; Kikunaga, N.; Kishido, T.; Oku, N.; Hoshino, M. Daily Consumption of Green Tea Catechin Delays Memory Regression in Aged Mice. Biogerontology 2007, 8, 89–95. [Google Scholar] [CrossRef] [PubMed]
  17. Tsuneki, H.; Ishizuka, M.; Terasawa, M.; Wu, J.-B.; Sasaoka, T.; Kimura, I. Effect of Green Tea on Blood Glucose Levels and Serum Proteomic Patterns in Diabetic (Db/Db) Mice and on Glucose Metabolism in Healthy Humans. BMC Pharm. 2004, 4, 18. [Google Scholar] [CrossRef] [Green Version]
  18. Maiga, A.; Diallo, D.; Bye, R.; Paulsen, B.S. Determination of Some Toxic and Essential Metal Ions in Medicinal and Edible Plants from Mali. J. Agric. Food Chem. 2005, 53, 2316–2321. [Google Scholar] [CrossRef] [PubMed]
  19. Madejón, P.; Domínguez, M.T.; Madejón, E.; Cabrera, F.; Marañón, T.; Murillo, J.M. Soil-Plant Relationships and Contamination by Trace Elements: A Review of Twenty Years of Experimentation and Monitoring after the Aznalcóllar (SW Spain) Mine Accident. Sci. Total Environ. 2018, 625, 50–63. [Google Scholar] [CrossRef] [PubMed] [Green Version]
  20. Sarma, H.; Deka, S.; Deka, H.; Saikia, R.R. Accumulation of Heavy Metals in Selected Medicinal Plants. In Reviews of Environmental Contamination and Toxicology; Whitacre, D.M., Ed.; Springer: New York, NY, USA, 2012; Volume 214, pp. 63–86. ISBN 978-1-4614-0667-9. [Google Scholar]
  21. Ray, P.C.; Yu, H.; Fu, P.P. Toxicity and Environmental Risks of Nanomaterials: Challenges and Future Needs. J. Environ. Sci. Health Part C 2009, 27, 1–35. [Google Scholar] [CrossRef] [Green Version]
  22. James, W.D.; Elston, D.M.; Treat, J.; Rosenbach, M.A.; Neuhaus, I.; Andrews, G.C. Andrews’ Diseases of the Skin: Clinical Dermatology, 13th ed.; Elsevier: Edinburgh, Scotland, 2020; ISBN 978-0-323-55188-5. [Google Scholar]
  23. Hadrup, N.; Sharma, A.K.; Loeschner, K. Toxicity of Silver Ions, Metallic Silver, and Silver Nanoparticle Materials after in Vivo Dermal and Mucosal Surface Exposure: A Review. Regul. Toxicol. Pharmacol. 2018, 98, 257–267. [Google Scholar] [CrossRef] [Green Version]
  24. Lansdown, A.B.G. GOLD: Human Exposure and Update on Toxic Risks. Crit. Rev. Toxicol. 2018, 48, 596–614. [Google Scholar] [CrossRef]
  25. Agency for Toxic Substances and Disease Registry (ATSDR). Toxicological Profile for Cobalt; Public Health Service, U.S. Department of Health and Human Services: Atlanta, GA, USA, 2004. [Google Scholar]
  26. United States Environmental Protection Agency (US EPA). Cobalt Compounds: Technology Transfer Network Air Toxics Web Site: Hazard Summary; United States Environmental Protection Agency: Washington, DC, USA, 2000. [Google Scholar]
  27. Leyssens, L.; Vinck, B.; Van Der Straeten, C.; Wuyts, F.; Maes, L. Cobalt Toxicity in Humans—A Review of the Potential Sources and Systemic Health Effects. Toxicology 2017, 387, 43–56. [Google Scholar] [CrossRef] [PubMed]
  28. Donaldson, J.D.; Beyersmann, D. Cobalt and Cobalt Compounds. In Ullmann’s Encyclopedia of Industrial Chemistry; Wiley-VCH Verlag GmbH & Co. KGaA: Weinheim, Germany, 2005; ISBN 978-3-527-30673-2. [Google Scholar]
  29. Agency for Toxic Substances and Disease Registry (ATSDR). Chromium (Cr) Toxicity: What Are the Physiologic Effects of Chromium Exposure? Case Studies in Environmental Medicine (CSEM); Agency for Toxic Substances and Disease Registry (ATSDR): Atlanta, Georgia, USA, 2008. [Google Scholar]
  30. Hartwig, A.; Arand, M.; Epe, B.; Guth, S.; Jahnke, G.; Lampen, A.; Martus, H.-J.; Monien, B.; Rietjens, I.M.C.M.; Schmitz-Spanke, S.; et al. Mode of Action-Based Risk Assessment of Genotoxic Carcinogens. Arch. Toxicol. 2020, 94, 1787–1877. [Google Scholar] [CrossRef] [PubMed]
  31. Yu, D.; Morisada, S.; Kawakita, H.; Ohto, K.; Inoue, K.; Song, X.; Zhang, G. Selective Cesium Adsorptive Removal on Using Crosslinked Tea Leaves. Processes 2019, 7, 412. [Google Scholar] [CrossRef] [Green Version]
  32. Kobayashi, N. Hazama Cesium Treatment Depresses Glycolysis Pathway in HeLa Cell. Cell Physiol. Biochem. 2021, 55, 477–488. [Google Scholar] [CrossRef] [PubMed]
  33. Grandjean, E.M.; Aubry, J.-M. Lithium: Updated Human Knowledge Using an Evidence-Based Approach: Part II: Clinical Pharmacology and Therapeutic Monitoring. CNS Drugs 2009, 23, 331–349. [Google Scholar] [CrossRef] [PubMed]
  34. McKnight, R.F.; Adida, M.; Budge, K.; Stockton, S.; Goodwin, G.M.; Geddes, J.R. Lithium Toxicity Profile: A Systematic Review and Meta-Analysis. Lancet 2012, 379, 721–728. [Google Scholar] [CrossRef] [PubMed]
  35. Hadrup, N.; Sørli, J.B.; Sharma, A.K. Pulmonary Toxicity, Genotoxicity, and Carcinogenicity Evaluation of Molybdenum, Lithium, and Tungsten: A Review. Toxicology 2022, 467, 153098. [Google Scholar] [CrossRef]
  36. Jarrell, W.M.; Page, A.L.; Elseewi, A.A. Molybdenum in the Environment. In Residue Reviews; Gunther, F.A., Gunther, J.D., Eds.; Springer: New York, NY, USA, 1980; pp. 1–43. ISBN 978-1-4612-6098-1. [Google Scholar]
  37. Albuquerque, R.G.; Hirotsu, C.; Tufik, S.; Andersen, M.L. Why Should We Care About Selenium in Obstructive Sleep Apnea? J. Clin. Sleep Med. 2017, 13, 931–932. [Google Scholar] [CrossRef] [Green Version]
  38. Emsley, J. Nature’s Building Blocks: An A-Z Guide to the Elements; New edition, Completely Revised and Updated; Oxford University Press: Oxford, UK; New York, NY, USA, 2011; p. 507. ISBN 978-0-19-960563-7. [Google Scholar]
  39. Price, C.T.; Langford, J.R.; Liporace, F.A. Essential Nutrients for Bone Health and a Review of Their Availability in the Average North American Diet. Open Orthop. J. 2012, 6, 143–149. [Google Scholar] [CrossRef] [Green Version]
  40. Pors Nielsen, S. The Biological Role of Strontium. Bone 2004, 35, 583–588. [Google Scholar] [CrossRef]
  41. Gruzewska, K.; Michno, A.; Pawelczyk, T.; Bielarczyk, H. Essentiality and Toxicity of Vanadium Supplements in Health and Pathology. J. Physiol. Pharm. 2014, 65, 603–611. [Google Scholar]
  42. Leszek, M.; Maleszka, A. Evaluation of the exposure of a Polish consumer to tea-origin lead. Zarz. Finans. 2012, 3, 206–223. [Google Scholar]
  43. Cabrera, C.; Artacho, R.; Giménez, R. Beneficial Effects of Green Tea—A Review. J. Am. Coll. Nutr. 2006, 25, 79–99. [Google Scholar] [CrossRef]
  44. Milan, J.; Frydrych, A.; Noga, M.; Kondratowicz-Pietruszka, E.; Krośniak, M.; Jurowski, K. The Control of Novel and Traditional Elemental Impurities: Ag, Au, Co, Cs, Li, Mo, Se, Sr, and V in Mint Tea Infusions (Peppermint, Mentha piperita L.) Available in Poland: A Health Risk Assessment. Int. J. Environ. Res. Public Health 2022, 19, 16564. [Google Scholar] [CrossRef]
  45. Khokhar, S.; Magnusdottir, S.G.M. Total Phenol, Catechin, and Caffeine Contents of Teas Commonly Consumed in the United Kingdom. J. Agric. Food Chem. 2002, 50, 565–570. [Google Scholar] [CrossRef]
  46. Kaegi, E. Unconventional Therapies for Cancer: 2. Green Tea. The Task Force on Alternative Therapies of the Canadian Breast Cancer Research Initiative. Can. Med. Assoc. J. 1998, 158, 1033–1035. [Google Scholar]
  47. Hakim, I.A.; Harris, R.B.; Brown, S.; Chow, H.-H.S.; Wiseman, S.; Agarwal, S.; Talbot, W. Effect of Increased Tea Consumption on Oxidative DNA Damage among Smokers: A Randomized Controlled Study. J. Nutr. 2003, 133, 3303S–3309S. [Google Scholar] [CrossRef] [Green Version]
  48. Imai, K.; Suga, K.; Nakachi, K. Cancer-Preventive Effects of Drinking Green Tea among a Japanese Population. Prev. Med. 1997, 26, 769–775. [Google Scholar] [CrossRef] [PubMed]
  49. Jehan, S.; Muhammad, S.; Ali, W.; Hussain, M.L. Potential Risks Assessment of Heavy Metal(Loid)s Contaminated Vegetables in Pakistan: A Review. Geocarto Int. 2022, 37, 7287–7302. [Google Scholar] [CrossRef]
  50. EFSA Scientific Committee. Guidance on Selected Default Values to Be Used by the EFSA Scientific Committee, Scientific Panels and Units in the Absence of Actual Measured Data. EFSA J. 2012, 10, 2579. [Google Scholar] [CrossRef]
  51. Matsuura, H.; Hokura, A.; Haraguchi, H. Multielement Determination and Speciation of Major-to-Ultratrace Elements in Green Tea Leaves by ICP-AES and ICP-MS. Analytical Chemistry for Environmental and Human Health. Bunseki Kagaku 2000, 49, 397–404. [Google Scholar] [CrossRef] [Green Version]
  52. Karak, T.; Bhagat, R.M. Trace Elements in Tea Leaves, Made Tea and Tea Infusion: A Review. Food Res. Int. 2010, 43, 2234–2252. [Google Scholar] [CrossRef]
  53. Szymczycha-Madeja, A.; Welna, M.; Pohl, P. Determination of Essential and Non-Essential Elements in Green and Black Teas by FAAS and ICP OES Simplified—Multivariate Classification of Different Tea Products. Microchem. J. 2015, 121, 122–129. [Google Scholar] [CrossRef]
  54. Brzezicha-Cirocka, J.; Grembecka, M.; Szefer, P. Monitoring of Essential and Heavy Metals in Green Tea from Different Geographical Origins. Environ. Monit. Assess. 2016, 188, 183. [Google Scholar] [CrossRef] [Green Version]
  55. Heshmati, A.; Mehri, F.; Karami-Momtaz, J.; Mousavi Khaneghah, A. The Concentration and Health Risk of Potentially Toxic Elements in Black and Green Tea—Both Bagged and Loose-Leaf. Qual. Assur. Saf. Crop. Foods 2020, 12, 140–150. [Google Scholar] [CrossRef]
  56. Deka, H.; Barman, T.; Sarmah, P.P.; Devi, A.; Tamuly, P.; Karak, T. Impact of Processing Method on Selected Trace Elements Content of Green Tea: Does CTC Green Tea Infusion Possess Risk towards Human Health? Food Chem. X 2021, 12, 100173. [Google Scholar] [CrossRef] [PubMed]
  57. Na Nagara, V.; Sarkar, D.; Luo, Q.; Biswas, J.K.; Datta, R. Health Risk Assessment of Exposure to Trace Elements from Drinking Black and Green Tea Marketed in Three Countries. Biol. Trace Elem. Res. 2022, 200, 2970–2982. [Google Scholar] [CrossRef]
  58. Drake, P.; Hazelwood, K. Exposure-Related Health Effects of Silver and Silver Compounds: A Review. Ann. Occup. Hyg. 2005, 49, 575–585. [Google Scholar] [CrossRef] [PubMed] [Green Version]
  59. Committee for Human Medicinal Products. ICH Guideline Q3D (R1) on Elemental Impurities; European Medicines Agency: Amsterdam, The Netherlands, 2019. [Google Scholar]
  60. Boisselier, E.; Astruc, D. Gold Nanoparticles in Nanomedicine: Preparations, Imaging, Diagnostics, Therapies and Toxicity. Chem. Soc. Rev. 2009, 38, 1759. [Google Scholar] [CrossRef]
  61. Hadrup, N.; Sharma, A.K.; Poulsen, M.; Nielsen, E. Toxicological Risk Assessment of Elemental Gold Following Oral Exposure to Sheets and Nanoparticles—A Review. Regul. Toxicol. Pharmacol. 2015, 72, 216–221. [Google Scholar] [CrossRef]
  62. Scarselli, A.; Di Marzio, D.; Iavicoli, S. Assessment of Exposure to Cobalt and Its Compounds in Italian Industrial Settings: Occupational Exposure to Cobalt. Med. Lav. 2020, 111, 22–31. [Google Scholar] [CrossRef] [PubMed]
  63. Melnikov, P.; Zanoni, L.Z. Clinical Effects of Cesium Intake. Biol. Trace Elem Res. 2010, 135, 1–9. [Google Scholar] [CrossRef]
  64. Brewer, A.K. The High PH Therapy for Cancer Tests on Mice and Humans. Pharmacol. Biochem. Behav. 1984, 21, 1–5. [Google Scholar] [CrossRef]
  65. Leggett, R.W.; Williams, L.R.; Melo, D.R.; Lipsztein, J.L. A Physiologically Based Biokinetic Model for Cesium in the Human Body. Sci. Total Environ. 2003, 317, 235–255. [Google Scholar] [CrossRef]
  66. Vyskočil, A.; Viau, C. Assessment of Molybdenum Toxicity in Humans. J. Appl. Toxicol. 1999, 19, 185–192. [Google Scholar] [CrossRef]
  67. Hadrup, N.; Ravn-Haren, G. Acute Human Toxicity and Mortality after Selenium Ingestion: A Review. J. Trace Elem. Med. Biol. 2020, 58, 126435. [Google Scholar] [CrossRef] [PubMed]
  68. Mohamed, H.; Haris, P.I.; Brima, E.I. Estimated Dietary Intake of Essential Elements from Four Selected Staple Foods in Najran City, Saudi Arabia. BMC Chem. 2019, 13, 73. [Google Scholar] [CrossRef] [PubMed]
Figure 1. The plot as a box chart, with a normal distribution curve for Co concentration (μg/L) in analysed green tea samples (infusions; GT1–GT12). The colors indicate the results for the individual tested samples, the symbol indicates the standard deviation.
Nutrients 15 01460 g001
Figure 2. The plot as a box chart, with a normal distribution curve for Cr concentration (μg/L) in analysed green tea samples (infusions; GT1–GT12). The colors indicate the results for the individual tested samples, the symbol indicates the standard deviation.
Nutrients 15 01460 g002
Figure 3. The plot as a box chart, with a normal distribution curve for Cs concentration (μg/L) in analysed green tea samples (infusions; GT1–GT12). The colors indicate the results for the individual tested samples, the symbol indicates the standard deviation.
Nutrients 15 01460 g003
Figure 4. The plot as a box chart with, a normal distribution curve for Li concentration (μg/L) in analysed green tea samples (infusions; GT1–GT12). The colors indicate the results for the individual tested samples, the symbol indicates the standard deviation.
Nutrients 15 01460 g004
Figure 5. The plot as a box chart, with a normal distribution curve for Mo concentration (μg/L) in analysed green tea samples (infusions; GT1–GT12). The colors indicate the results for the individual tested samples, the symbol indicates the standard deviation.
Nutrients 15 01460 g005
Figure 6. The plot as a box chart, with a normal distribution curve for Se concentration (μg/L) in analysed green tea samples (infusions; GT1–GT12). The colors indicate the results for the individual tested samples, the symbol indicates the standard deviation.
Nutrients 15 01460 g006
Figure 7. The plot as a box chart, with a normal distribution curve for Sr concentration (μg/L) in analysed green tea samples (infusions; GT1–GT12). The colors indicate the results for the individual tested samples, the symbol indicates the standard deviation.
Nutrients 15 01460 g007
Table 1. List and data of teas used for the impurity profile and toxicological risk assessment.
Code of SampleForm of TeaThe Amount of Raw Material Intended for a Single Brewing Process, gTime of the Brewing Process (Brew Time), MinutesCountry of OriginEAN
GT1Tea bag1.51–3Sri Lanka5901086000333
GT2Tea bag1.53China5900175401532
GT3Leaf tea2.02–3China5900738004101
GT4Leaf tea2.03Sri Lanka5901483051129
GT5Leaf tea4–53China5907732943986
GT6Leaf tea3.04China5900956700410
GT7Tea bag1.51–3China5906881826072
GT8Tea bag22–3Sri Lanka4796004230449
GT9Tea bag23–4China5900956006782
GT10Tea bag1.51–3Sri Lanka4791038950158
GT11Leaf tea2.03–5Sri Lanka5900396000736
GT12Tea bag1.752–3China20321154
Table 2. ICP-MS operating conditions and performance.
ParameterValue(s)
InstrumentElan DRC-e Perkin Elmer (US)
CalibrationExternal *
RF power1150
Dwell time250 ms
Sweeps/Readings4
Readings/Replicates2
Replicates3
Spray chamberCyclonic spray chamber
NebulizerMeinhard nebulizer
Cooling gas flow rate (L/min)17
Sampler coneNi
Scanning modePeak-hopping
Plasma gas flow rate15 L/min
Carrier gas flow rate1.1 L/min
Composition gas flow rate1.0 L/min
* External calibration—Because the pure and certified standard solution used in the calibration process is external to the sample, the calibration is called external standard calibration. This type of calibration can be applied successfully by comparing analytical signals from standard solutions with samples.
Table 3. Description of the applied toxicological risk assessment.
StepDescription
1Analysis of raw results from the determination of investigated elemental impurities in green tea infusions (g/L of infusion) as NEI and traditional EI profiles of investigated samples (GT1-GT12) and descriptive statistics (minimum, maximum, average);
2Estimation of weekly intake (g/L infusion/week) based on weekly tea consumption (approximately 21–70 cups of green tea infusions per week based on the review of the literature [46,47,48,49]);
3Depending on weekly tea consumption per person compared to PTWI, weekly intake was evaluated according to body weight (µg/L of infusion/week/bw), using the equation: EWIBW = EWI/BW, where EWI is the estimated weekly intake (µg/L of infusion/week), and BW is the average body weight (approximately 70 kg bw) (kg).
Table 4. The descriptive statistics of examined elements in each analysed sample (GT1–GT12).
Statistical ParameterElemental Impurity
AgAuCoCrCsLiMoSeSr
Minimum, μg/L0.3640.01050.5807.1210.3990.2050.01130.0679.848
Maximum, μg/L15.7480.08302.98910.9932.6542.6670.1070.30822.331
Mean, μg/L8.05600.03331.7988.9811.3041.3400.04860.17017.763
RSD, %0.3340.000310.00540.01990.00580.009830.000610.00210.0157
Table 5. The estimation of the weekly intake (µg/week) in the range of 600–2000 mL, and weekly intake per body weight estimation of the examined elements based on the consumption of green tea.
SampleEstimation of Weekly Intake, µg/Week
AgAuCoCrCsLiMoSeSr
GT10.219–0.7290.044–0.1451.229–4.0975.302–17.6730.586–1.9541.196–3.986N/D0.041–0.13512.502–41.673
GT2N/D0.016–0.0531.794–5.9795.658–18.8601.189–3.9631.050–3.5010.011–0.0360.057–0.18911.966–39.888
GT39.49–31.4960.008–0.0271.523–5.0784.822–16.0730.240–0.7991.600–5.3350.016–0.0520.155–0.51810.631–35.436
GT4N/D0.013–0.0421.504–5.0146.596–21.9881.114–3.7130.524–1.7450.034–0.1130.139–0.46410.742–35.808
GT5N/D0.050–0.1670.348–1.1605.147–17.1570.396–1.3210.136–0.455N/DN/D5.909–19.697
GT6N/DN/D1.388–4.6264.273–14.2421.210–4.0340.724–2.4130.015–0.0510.080–0.2667.060–23.532
GT7N/DN/D0.918–3.0585.363–17.8780.737–2.4581.506–5.0200.052–0.1740.098–0.32813.399–44.662
GT8N/DN/D0.553–1.8446.221–20.7360.528–1.7600.123–0.410N/D0.100–0.3359.826–32.755
GT9N/D0.006–0.0211.152–3.8414.595–15.3160.455–1.5180.703–2.3430.035–0.1160.073–0.24411.454–38.180
GT10N/DN/D0.587–1.9555.534–18.4460.793–2.6430.130–0.433N/D0.103–0.34310.293–34.309
GT11N/DN/D0.925–3.0846.497–21.6571.593–5.3091.310–4.3670.007–0.0230.185–0.61711.369–37.895
GT12N/D0.003–0.012N/D4.658–15.5270.553–1.8450.647–2.1580.064–0.2140.093–0.31012.744–42.479
SampleEstimation of Weekly Intake, µg/Week/bw
AgAuCoCrCsLiMoSeSr
GT10.00312–0.010410.00062–0.002070.01756–0.058530.07574–0.252470.00837–0.027910.01708–0.05694N/D0.00058–0.001930.17860–0.59533
GT2N/D0.00023–0.000750.02563–0.085420.08083–0.269420.01698–0.056610.01500–0.050020.00016–0.000520.00081–0.002700.17095–0.56982
GT30.13498–0.449950.00012–0.000380.02176–0.072540.06888–0.229620.00342–0.011410.02286–0.076210.00022–0.000740.00222–0.007400.15187–0.50624
GT4N/DN/D0.02149–0.071620.09423–0.314110.01591–0.053040.00748–0.024930.00048–0.001610.00199–0.006630.15346–0.51154
GT5N/DN/D0.00497–0.016580.07353–0.245100.00566–0.018880.00195–0.00650N/DN/D0.08442–0.28139
GT6N/DN/D0.01983–0.066090.06104–0.203460.01729–0.057630.01034–0.034470.00022–0.000730.00114–0.003810.10085–0.33617
GT7N/DN/D0.01311–0.043690.07662–0.255400.01053–0.035110.02151–0.071710.00075–0.002490.00141–0.004680.19141–0.63803
GT8N/DN/D0.00790–0.026350.08887–0.296230.00754–0.025150.00176–0.00586N/D0.00143–0.004780.14038–0.46792
GT9N/D0.00009–0.000300.01646–0.054870.06564–0.218800.00650–0.021680.01004–0.033470.00050–0.001650.00105–0.003490.16363–0.54543
GT10N/DN/D0.00838–0.027940.07906–0.263520.01133–0.037750.00186–0.00618N/D0.00147–0.004900.14704–0.49013
GT11N/DN/D0.01467–0.048900.09282–0.309390.02275–0.075840.01872–0.062390.00010–0.000330.00264–0.008810.16241–0.54136
GT12N/D0.0005–0.000160.01322–0.044050.09282–0.309390.00791–0.026350.00925–0.030830.00092–0.003060.00881–0.008810.18205–0.60685
N/D—no data.
Disclaimer/Publisher’s Note: The statements, opinions and data contained in all publications are solely those of the individual author(s) and contributor(s) and not of MDPI and/or the editor(s). MDPI and/or the editor(s) disclaim responsibility for any injury to people or property resulting from any ideas, methods, instructions or products referred to in the content.

