
Fluid Balance and Thermoregulatory Responses during Wheelchair Basketball Games in Hot vs. Temperate Conditions

 ,
,  ,
,
Abstract
:1. Introduction
2. Materials and Methods
2.1. Participants
2.2. Procedure
2.3. Indoor Tracking System (ITS)
2.4. Fluid Balance
2.5. Equipment/Location
2.6. Statistics
3. Results
3.1. Change in Body Mass
3.2. Fluid INTAKE
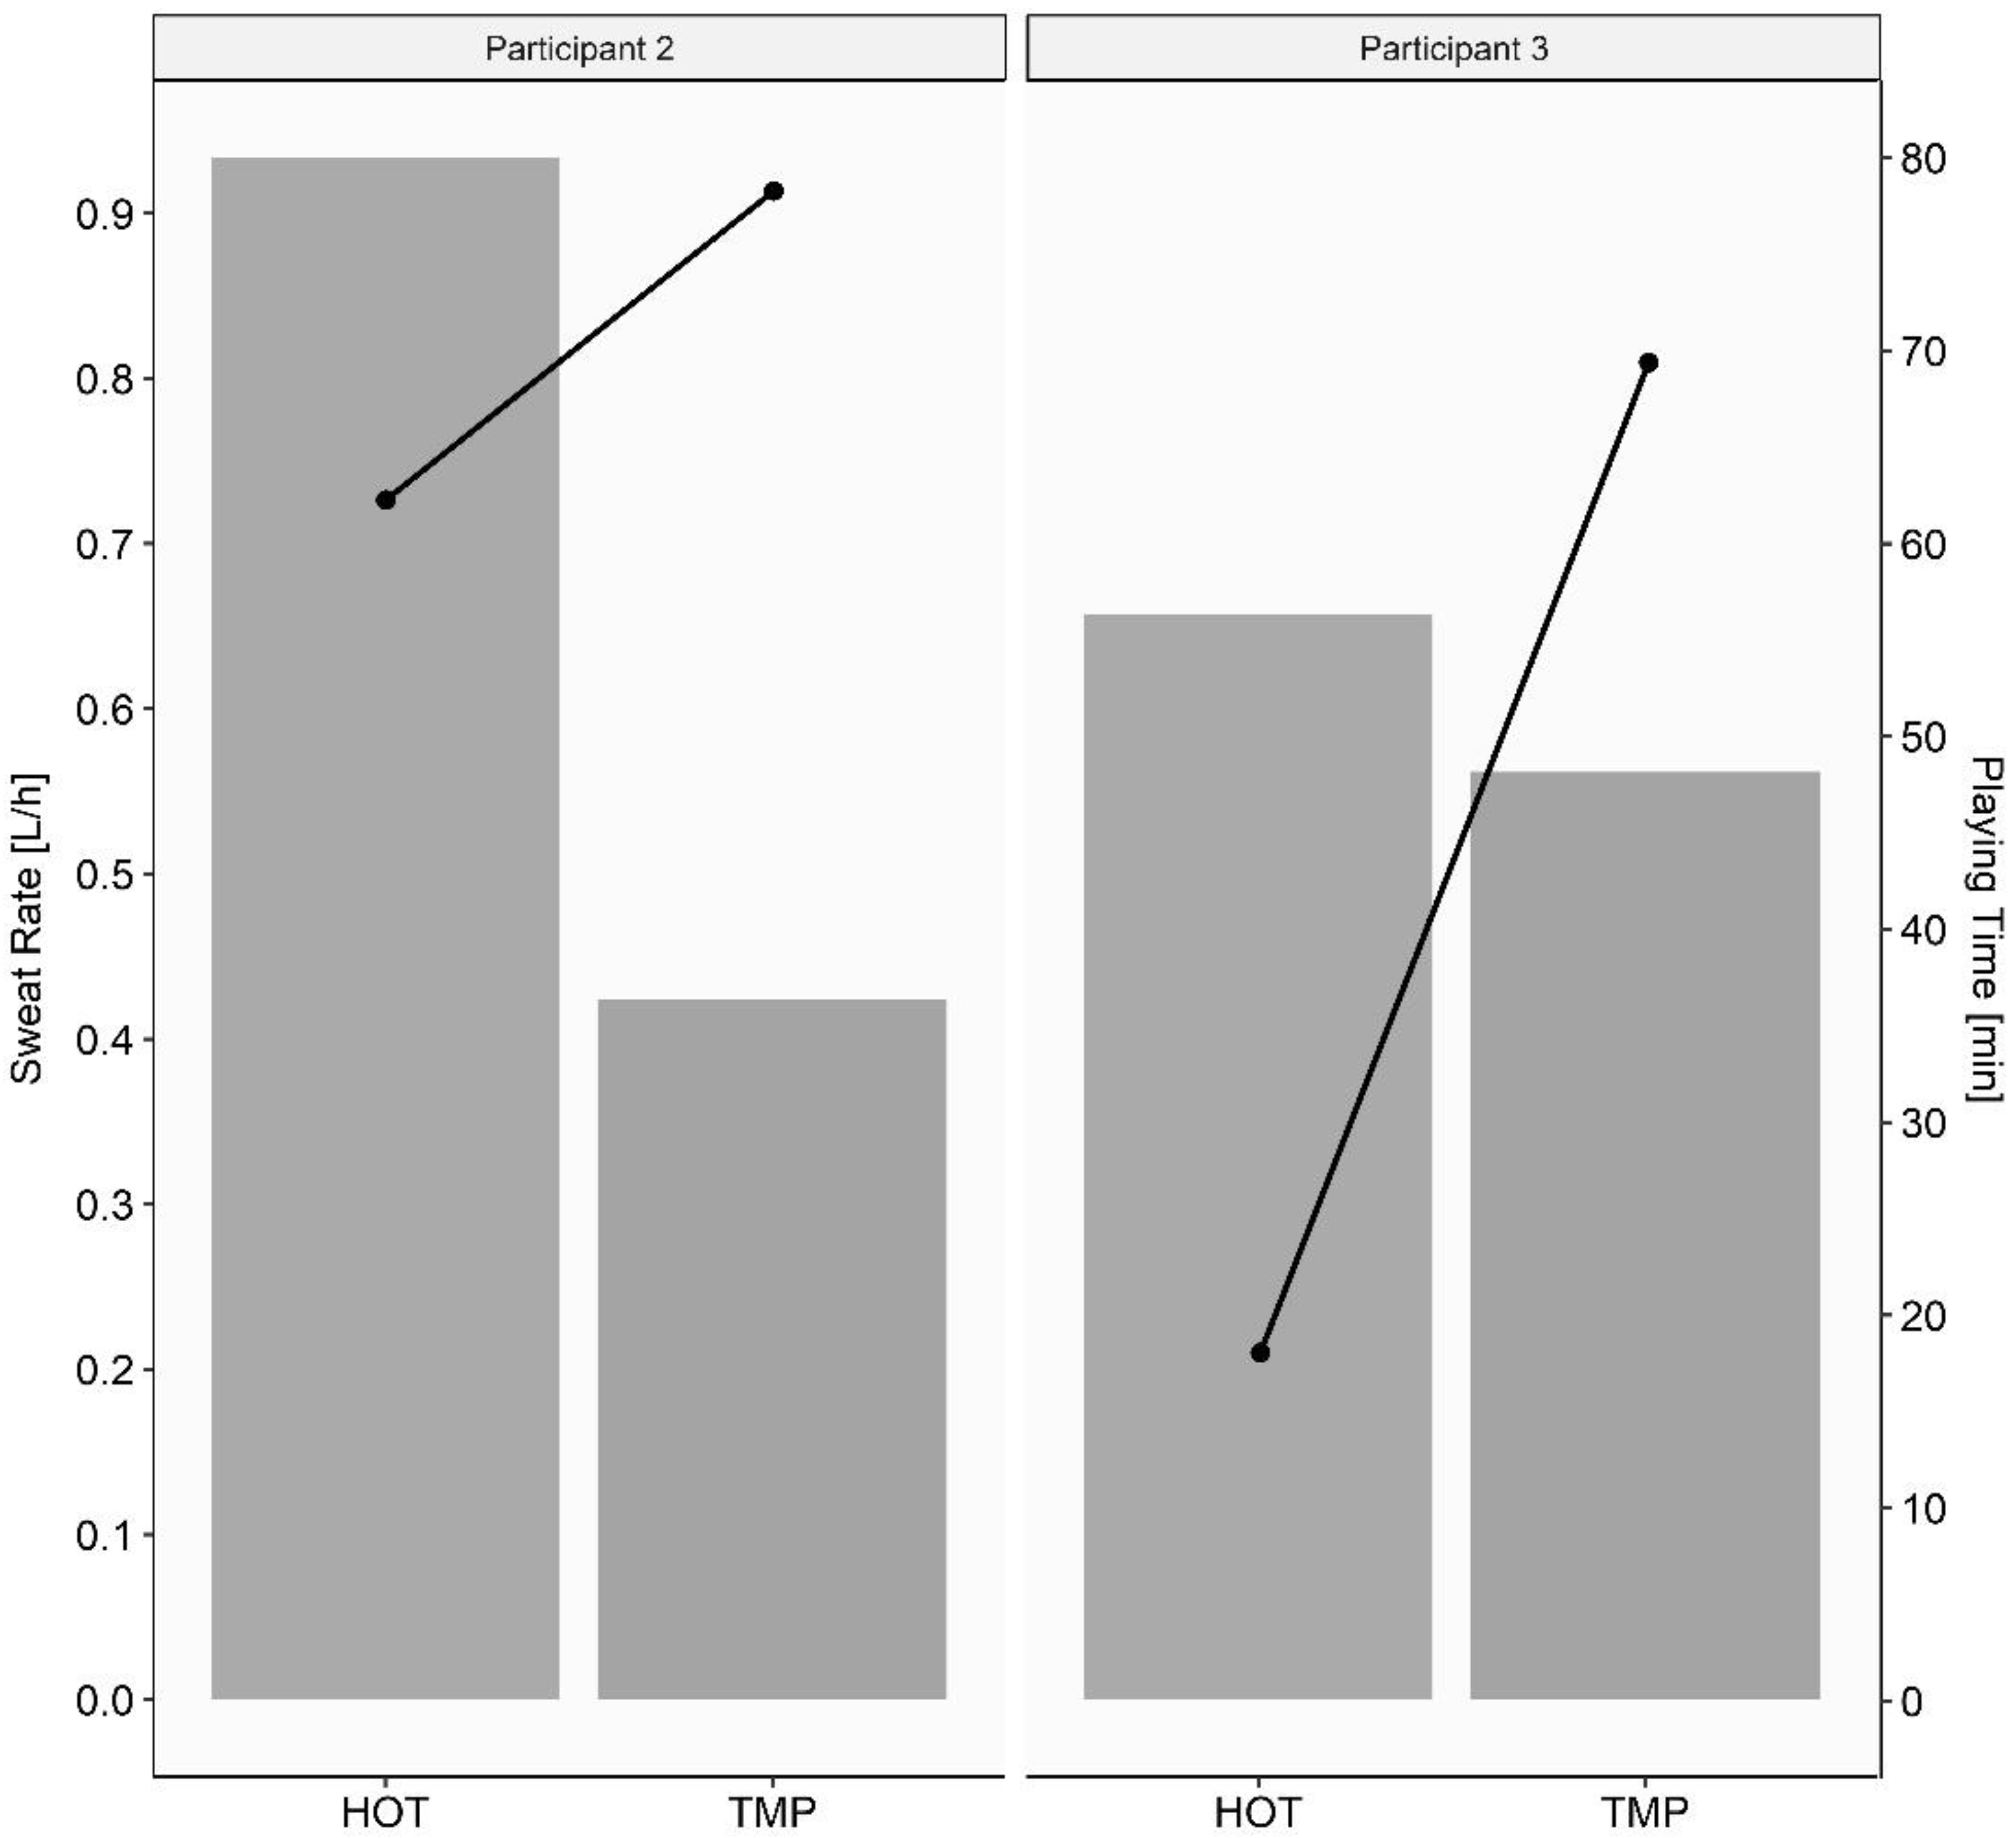
3.3. Sweat Rate
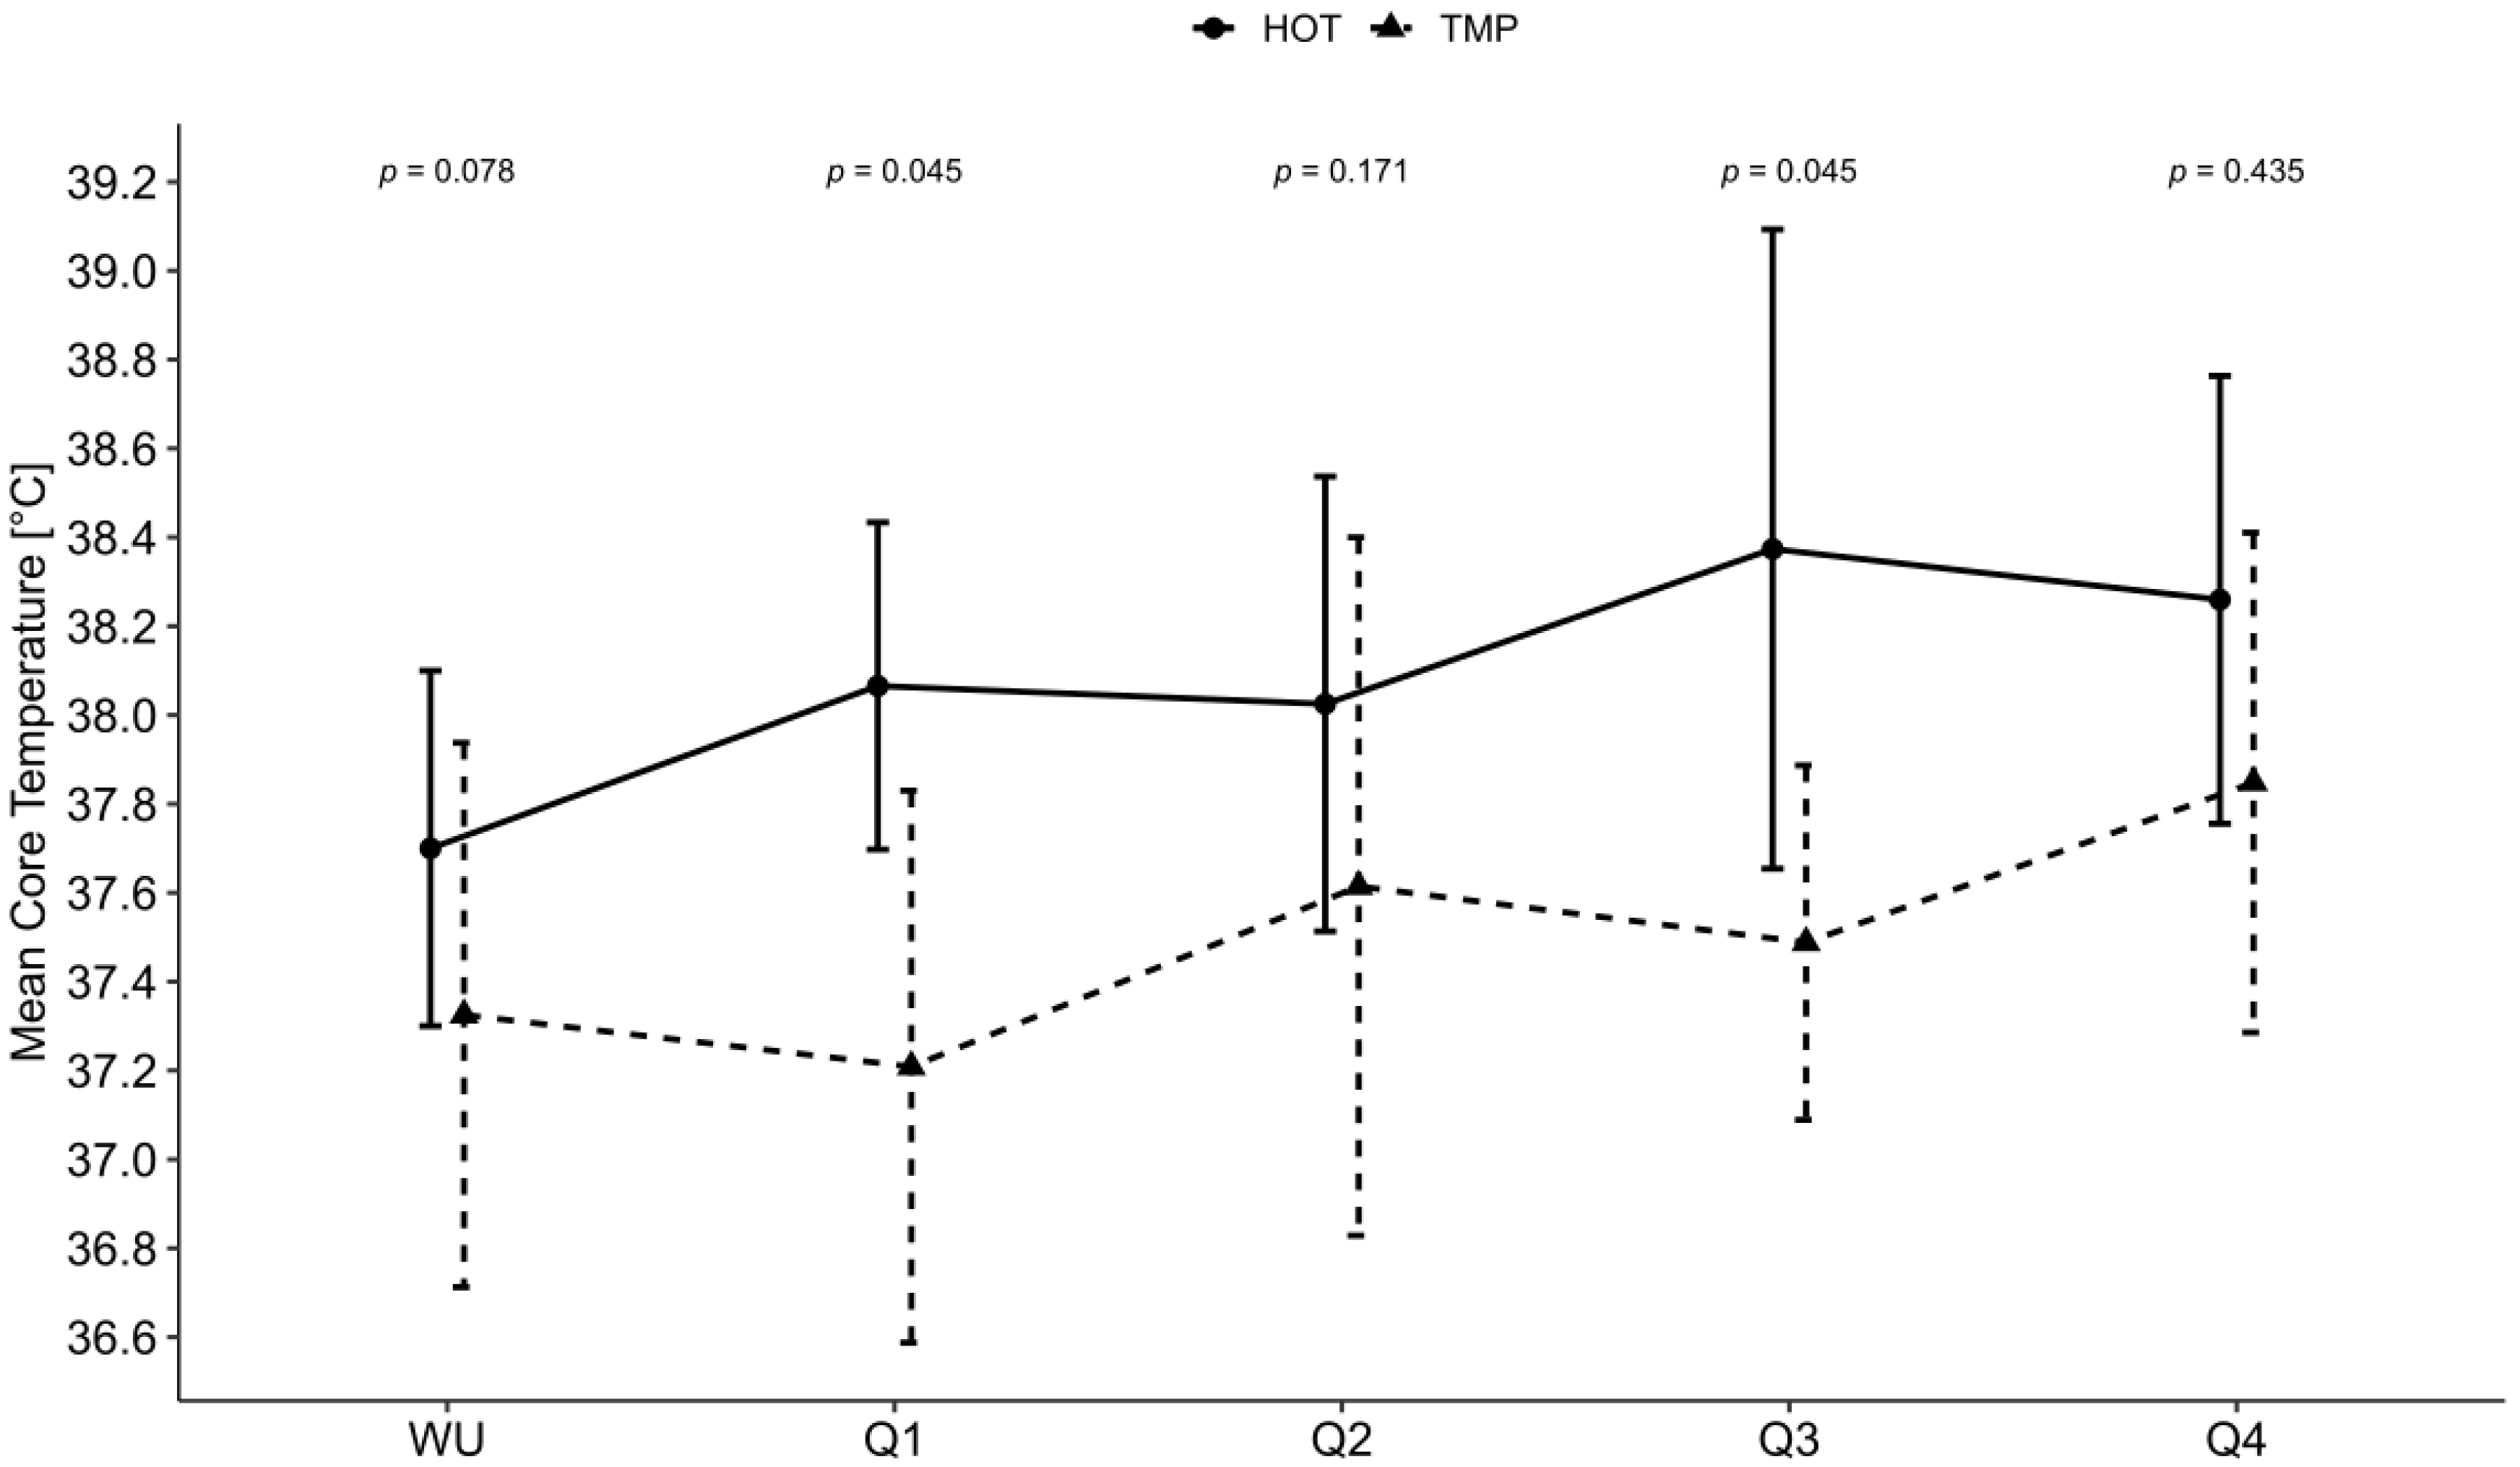
3.4. Body Core Temperature, Perceived Thermal Sensation, Game Characteristics and Pregame Behavior
3.5. Correlations
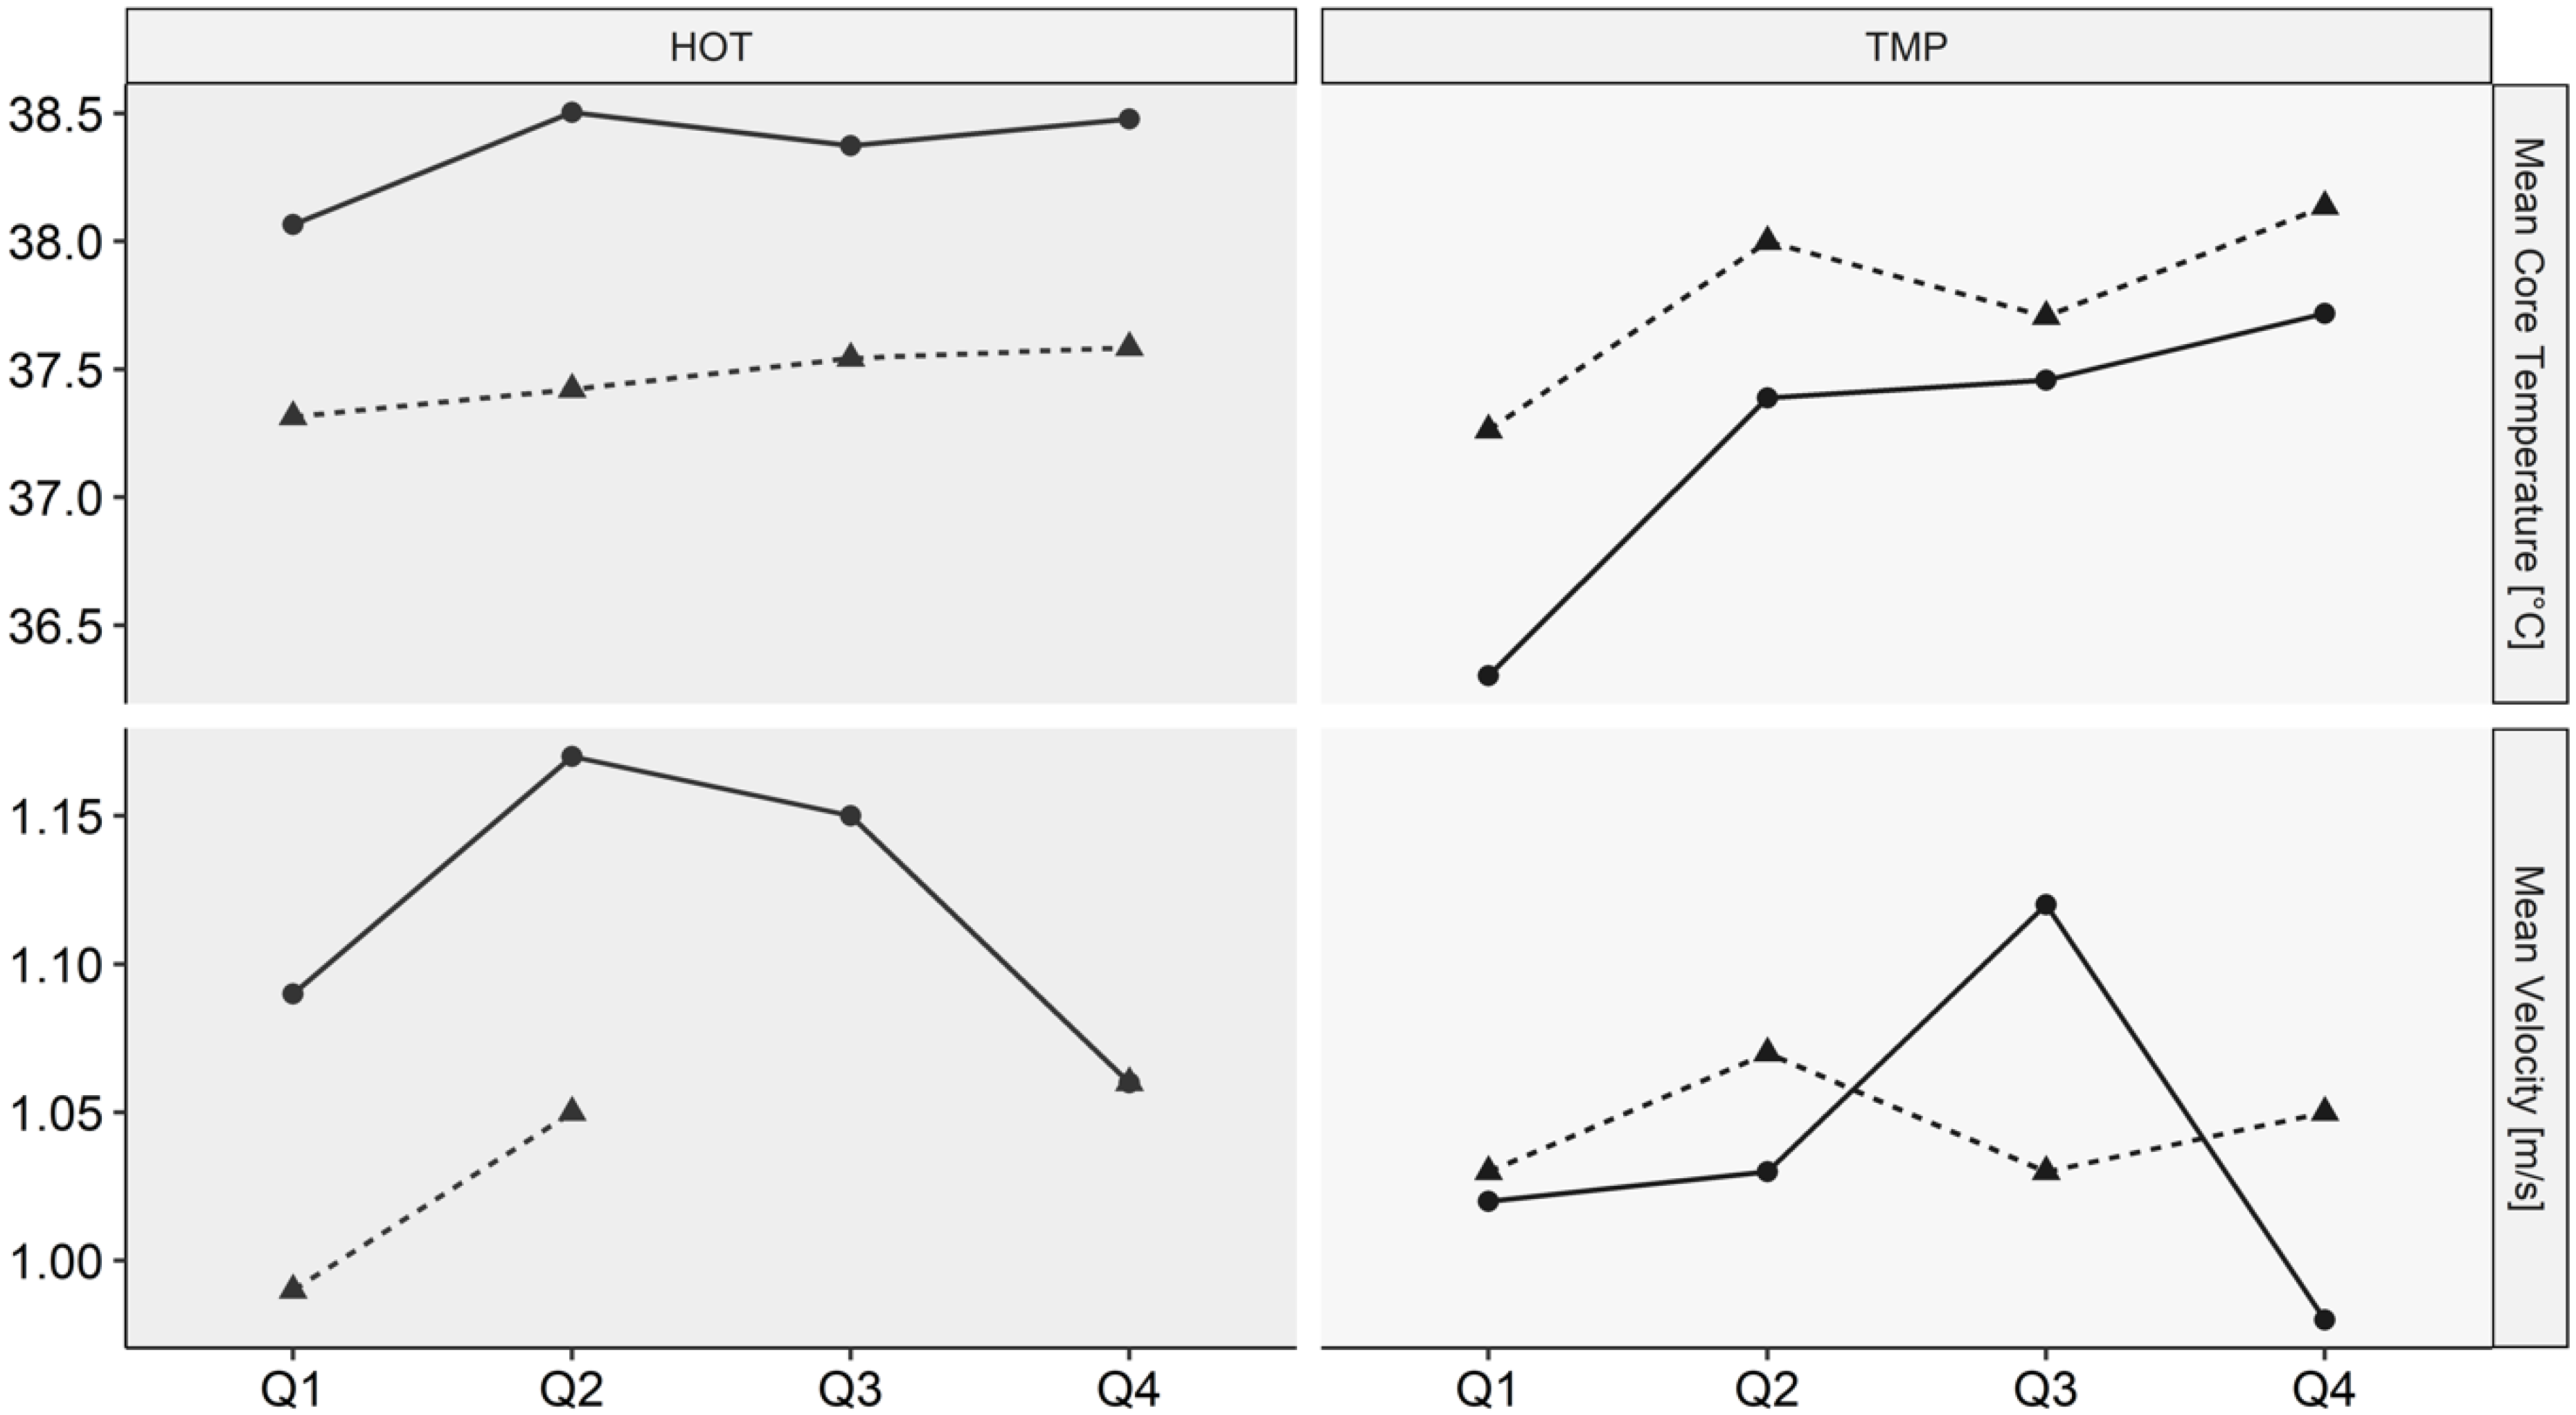
3.6. Athletes with Paired Data
4. Discussion
4.1. Fluid Balance
4.2. Body Core Temperature and Perceived Thermal Sensation
4.3. Level of Lesion/Classification
4.4. Limitations
4.5. Practical Application
5. Conclusions
Author Contributions
Funding
Institutional Review Board Statement
Informed Consent Statement
Data Availability Statement
Acknowledgments
Conflicts of Interest
References
- Hou, S.; Rabchevsky, A.G. Autonomic consequences of spinal cord injury. Compr Physiol. 2014, 4, 1419–1453. [Google Scholar] [CrossRef]
- Walter, M.; Krassioukov, A.V. Autonomic Nervous System in Paralympic Athletes with Spinal Cord Injury. Phys. Med. Rehabil. Clin. N. Am. 2018, 29, 245–266. [Google Scholar] [CrossRef]
- Wallin, B.G.; Stjernberg, L. Sympathetic activity in man after spinal cord injury. Outflow to skin below the lesion. Brain 1984, 107, 183–198. [Google Scholar] [CrossRef]
- Hopman, M.T.; Oeseburg, B.; Binkhorst, R.A. Cardiovascular responses in persons with paraplegia to prolonged arm exercise and thermal stress. Med. Sci. Sports Exerc. 1993, 25, 577–583. [Google Scholar] [CrossRef]
- Grossmann, F.; Flueck, J.L.; Perret, C.; Meeusen, R.; Roelands, B. The Thermoregulatory and Thermal Responses of Individuals With a Spinal Cord Injury During Exercise, Acclimation and by Using Cooling Strategies—A Systematic Review. Front. Physiol. 2021, 12, 636997. [Google Scholar] [CrossRef]
- Brown, R.; Engel, S.; Wallin, B.G.; Elam, M.; Macefield, V. Assessing the integrity of sympathetic pathways in spinal cord injury. Auton. Neurosci. 2007, 134, 61–68. [Google Scholar] [CrossRef]
- Bhambhani, Y. Physiology of wheelchair racing in athletes with spinal cord injury. Sports Med. 2002, 32, 23–51. [Google Scholar] [CrossRef]
- Minson, C.T.; Brunt, V.E. Thermoregulatory Considerations for the Performance of Exercise in SCI. In The Physiology of Exercise in Spinal Cord Injury; Taylor, J.A., Ed.; Springer: Boston, MA, USA, 2016; pp. 127–160. [Google Scholar]
- Baker, L.B. Sweating Rate and Sweat Sodium Concentration in Athletes: A Review of Methodology and Intra/Interindividual Variability. Sports Med. 2017, 47, 111–128. [Google Scholar] [CrossRef] [Green Version]
- Burke, L.M.; Hawley, J.A. Fluid balance in team.m sports. Guidelines for optimal practices. Sports Med. 1997, 24, 38–54. [Google Scholar] [CrossRef]
- Thomas, D.T.; Erdman, K.A.; Burke, L.M. American College of Sports Medicine Joint Position Statement. Nutrition and Athletic Performance. Med. Sci. Sports Exerc. 2016, 48, 543–568. [Google Scholar] [CrossRef]
- Nuccio, R.P.; Barnes, K.A.; Carter, J.M.; Baker, L.B. Fluid Balance in Team Sport Athletes and the Effect of Hypohydration on Cognitive, Technical, and Physical Performance. Sports Med. 2017, 47, 1951–1982. [Google Scholar] [CrossRef] [PubMed] [Green Version]
- Cheuvront, S.N.; Kenefick, R.W. Personalized fluid and fuel intake for performance optimization in the heat. J. Sci. Med. Sport 2021, 24, 735–738. [Google Scholar] [CrossRef] [PubMed]
- Rowlands, D.S.; Bonetti, D.L.; Hopkins, W.G. Unilateral Fluid Absorption and Effects on Peak Power After Ingestion of Commercially Available Hypotonic, Isotonic, and Hypertonic Sports Drinks. Int. Int. J. Sport Nutr. Exerc. Metab. 2011, 21, 480–491. [Google Scholar] [CrossRef] [PubMed]
- Leiper, J.B. Intestinal water absorption—Implications for the formulation of rehydration solutions. Int. J. Sports Med. 1998, 19 (Suppl. S2), S129–S132. [Google Scholar] [CrossRef]
- Koch, H.G.; Geng, V. Querschnittlähmung Verständlich Erklärt Band 1-Medizinische Grundlagen: Anatomie, Physiologie, Pathophysiologie; Manfred-Sauer-Stiftung und Schweizer Paraplegiker-Vereinigung: Lobbach, Germany; Nottwil, Switzerland, 2021; Volume 1, p. 160. [Google Scholar]
- Pritchett, R.C.; Al-Nawaiseh, A.M.; Pritchett, K.K.; Nethery, V.; Bishop, P.A.; Green, J.M. Sweat gland density and response during high-intensity exercise in athletes with spinal cord injuries. Biol. Sport 2015, 32, 249–254. [Google Scholar] [CrossRef] [Green Version]
- Griggs, K.E.; Havenith, G.; Price, M.J.; Mason, B.S.; Goosey-Tolfrey, V.L. Thermoregulatory responses during competitive wheelchair rugby match play. Int. J. Sports Med. 2017, 38, 177–183. [Google Scholar] [CrossRef] [Green Version]
- Logan-Sprenger, H.M.; Mc Naughton, L.R. Characterizing thermoregulatory demands of female wheelchair basketball players during competition. Res. Sports Med. 2020, 28, 256–267. [Google Scholar] [CrossRef]
- Goosey-Tolfrey, V.L.; Diaper, N.J.; Crosland, J.; Tolfrey, K. Fluid intake during wheelchair exercise in the heat: Effects of localized cooling garments. Int. J. Sports Physiol. 2008, 3, 145–156. [Google Scholar] [CrossRef] [Green Version]
- Price, M.J.; Campbell, I.G. Effects of spinal cord lesion level upon thermoregulation during exercise in the heat. Med. Sci. Sports Exerc. 2003, 35, 1100–1107. [Google Scholar] [CrossRef]
- World Medical Association Declaration of Helsinki: Ethical principles for medical research involving human subjects. JAMA 2013, 310, 2191–2194. [CrossRef] [Green Version]
- International Wheelchair Basketball Federation IWBF, Player Classification Commission. IWBF, Official Player Classification Manual. 2021. Available online: https://iwbf.org/downloads/ (accessed on 12 January 2022).
- Arens, E.; Zhang, H.; Huizenga, C. Partial- and whole-body thermal sensation and comfort—Part I: Uniform environmental conditions. J. Therm Biol. 2006, 31, 53–59. [Google Scholar] [CrossRef] [Green Version]
- Borg, G.A. Psychophysical bases of perceived exertion. Med. Sci. Sports Exerc. 1982, 14, 377–381. [Google Scholar] [CrossRef] [PubMed]
- Rhodes, J.; Mason, B.; Perrat, B.; Smith, M.; Goosey-Tolfrey, V. The validity and reliability of a novel indoor player tracking system for use within wheelchair court sports. J. Sports Sci. 2014, 32, 1639–1647. [Google Scholar] [CrossRef] [PubMed] [Green Version]
- Pritchett, K.; Broad, E.; Scaramella, J.; Baumann, S. Hydration and Cooling Strategies for Paralympic Athletes: Applied Focus: Challenges Athletes May Face at the Upcoming Tokyo Paralympics. Curr. Nutr. Rep. 2020, 9, 137–146. [Google Scholar] [CrossRef]
- Price, M.J.; Campbell, I.G. Thermoregulatory responses of spinal cord injured and able-bodied athletes to prolonged upper body exercise and recovery. Spinal. Cord 1999, 37, 772–779. [Google Scholar] [CrossRef] [Green Version]
- Barnes, K.A.; Anderson, M.L.; Stofan, J.R.; Dalrymple, K.J.; Reimel, A.J.; Roberts, T.J.; Randell, R.K.; Ungaro, C.T.; Baker, L.B. Normative data for sweating rate, sweat sodium concentration, and sweat sodium loss in athletes: An update and analysis by sport. J. Sports Sci. 2019, 37, 2356–2366. [Google Scholar] [CrossRef]
- Burke, L.M. Fluid balance during team sports. J. Sports Sci. 1997, 15, 287–295. [Google Scholar] [CrossRef]
- Broad, E.M.; Burke, L.M.; Cox, G.R.; Heeley, P.; Riley, M. Body Weight Changes and Voluntary Fluid Intakes during Training and Competition Sessions in Team Sports. Int. J. Sport Nutr. 1996, 6, 307. [Google Scholar] [CrossRef] [Green Version]
- Maughan, R.J.; Watson, P.; Evans, G.H.; Broad, N.; Shirreffs, S.M. Water balance and salt losses in competitive football. Int. J. Sport Nutr. Exerc. Metab. 2007, 17, 583–594. [Google Scholar] [CrossRef]
- Davis, J.K.; Baker, L.B.; Barnes, K.; Ungaro, C.; Stofan, J. Thermoregulation, Fluid Balance, and Sweat Losses in American Football Players. Sports Med. 2016, 46, 1391–1405. [Google Scholar] [CrossRef]
- Black, K.E.; Huxford, J.; Perry, T.; Brown, R.C. Fluid and sodium balance of elite wheelchair rugby players. Int. J. Sport Nutr. Exerc. Metab. 2013, 23, 110–118. [Google Scholar] [CrossRef] [PubMed]
- González-Alonso, J.; Teller, C.; Andersen, S.L.; Jensen, F.B.; Hyldig, T.; Nielsen, B. Influence of body temperature on the development of fatigue during prolonged exercise in the heat. J. Appl. Physiol. 1999, 86, 1032–1039. [Google Scholar] [CrossRef] [PubMed] [Green Version]
- Ravanelli, N.; Imbeault, P.; Jay, O. Steady-state sweating during exercise is determined by the evaporative requirement for heat balance independently of absolute core and skin temperatures. J. Physiol. Paris 2020, 598, 2607–2619. [Google Scholar] [CrossRef]
- Griggs, K.E.; Leicht, C.A.; Price, M.J.; Goosey-Tolfrey, V.L. Thermoregulation during intermittent exercise in athletes with a spinal-cord injury. Int. J. Sports Physiol. Perform. 2015, 10, 469–475. [Google Scholar] [CrossRef] [PubMed] [Green Version]


| Participant | Age [Years] | Lesion Level | Classification | Body Mass [kg] | Game Played | ITS |
|---|---|---|---|---|---|---|
| 1 | 29.3 | L1 | 4.0 | 82.8 | HOT | x |
| 2 | 39.7 | C5 | 2.5 | 94.6 | HOT, TMP | x |
| 3 | 46.3 | T5 | 1.0 | 78.6 | HOT, TMP | x |
| 4 | 40.2 | T4 | 1.0 | 83.0 | HOT | x |
| 5 | 29.6 | T10 | 3.0 | 70.0 | HOT | x |
| 6 | 42.4 | L1 | 4.0 | 110.6 | TMP | x |
| 7 | 36.5 | T12 | 2.5 | 65.4 | TMP | x |
| 8 | 59.7 | T10 | 2.0 | 111.6 | TMP | - |
| 9 | 39.7 | T10 | 1.0 | 70.6 | TMP | - |
| 10 | 54.0 | L3 | 3.0 | 90.6 | TMP | - |
| 11 | 20.0 | T8 | 1.0 | 74.2 | TMP | - |
| Median, IQR | 39.8, 11.3 | - | - | 82.8, 20.2 | - | - |
| HOT | TMP | Difference | |||
|---|---|---|---|---|---|
| Measured Parameter | Median | IQR | Median | IQR | p |
| Change in Body Mass [%] | −0.35 | 0.15 | +0.11 | 0.35 | 0.02 * |
| Fluid Intake [L] | 1.08 | 0.91 | 1.08 | 0.25 | 0.94 |
| Relative Fluid Intake [%] | 1.01 | 1.18 | 1.25 | 0.42 | 0.83 |
| Fluid Intake Rate [L/h] | 0.68 | 0.58 | 0.55 | 0.12 | 0.72 |
| Sweat Rate [L/h] | 0.93 | 0.58 | 0.48 | 0.19 | 0.02 * |
| ∆ Body Core Temperature [°C] | 0.8 | 0.4 | 1.05 | 0.15 | 0.01 * |
| Max. Core Temperature [°C] | 38.6 | 0.6 | 38.3 | 0.5 | 0.50 |
| Mean Heart Rate [bpm] | 122 | 22 | 119 | 31 | 1.00 |
| ∆ Thermal Sensation | 2 | 1 | 2 | 1 | 0.45 |
| Max. Thermal Sensation | 3 | 0 | 3 | 1 | 0.11 |
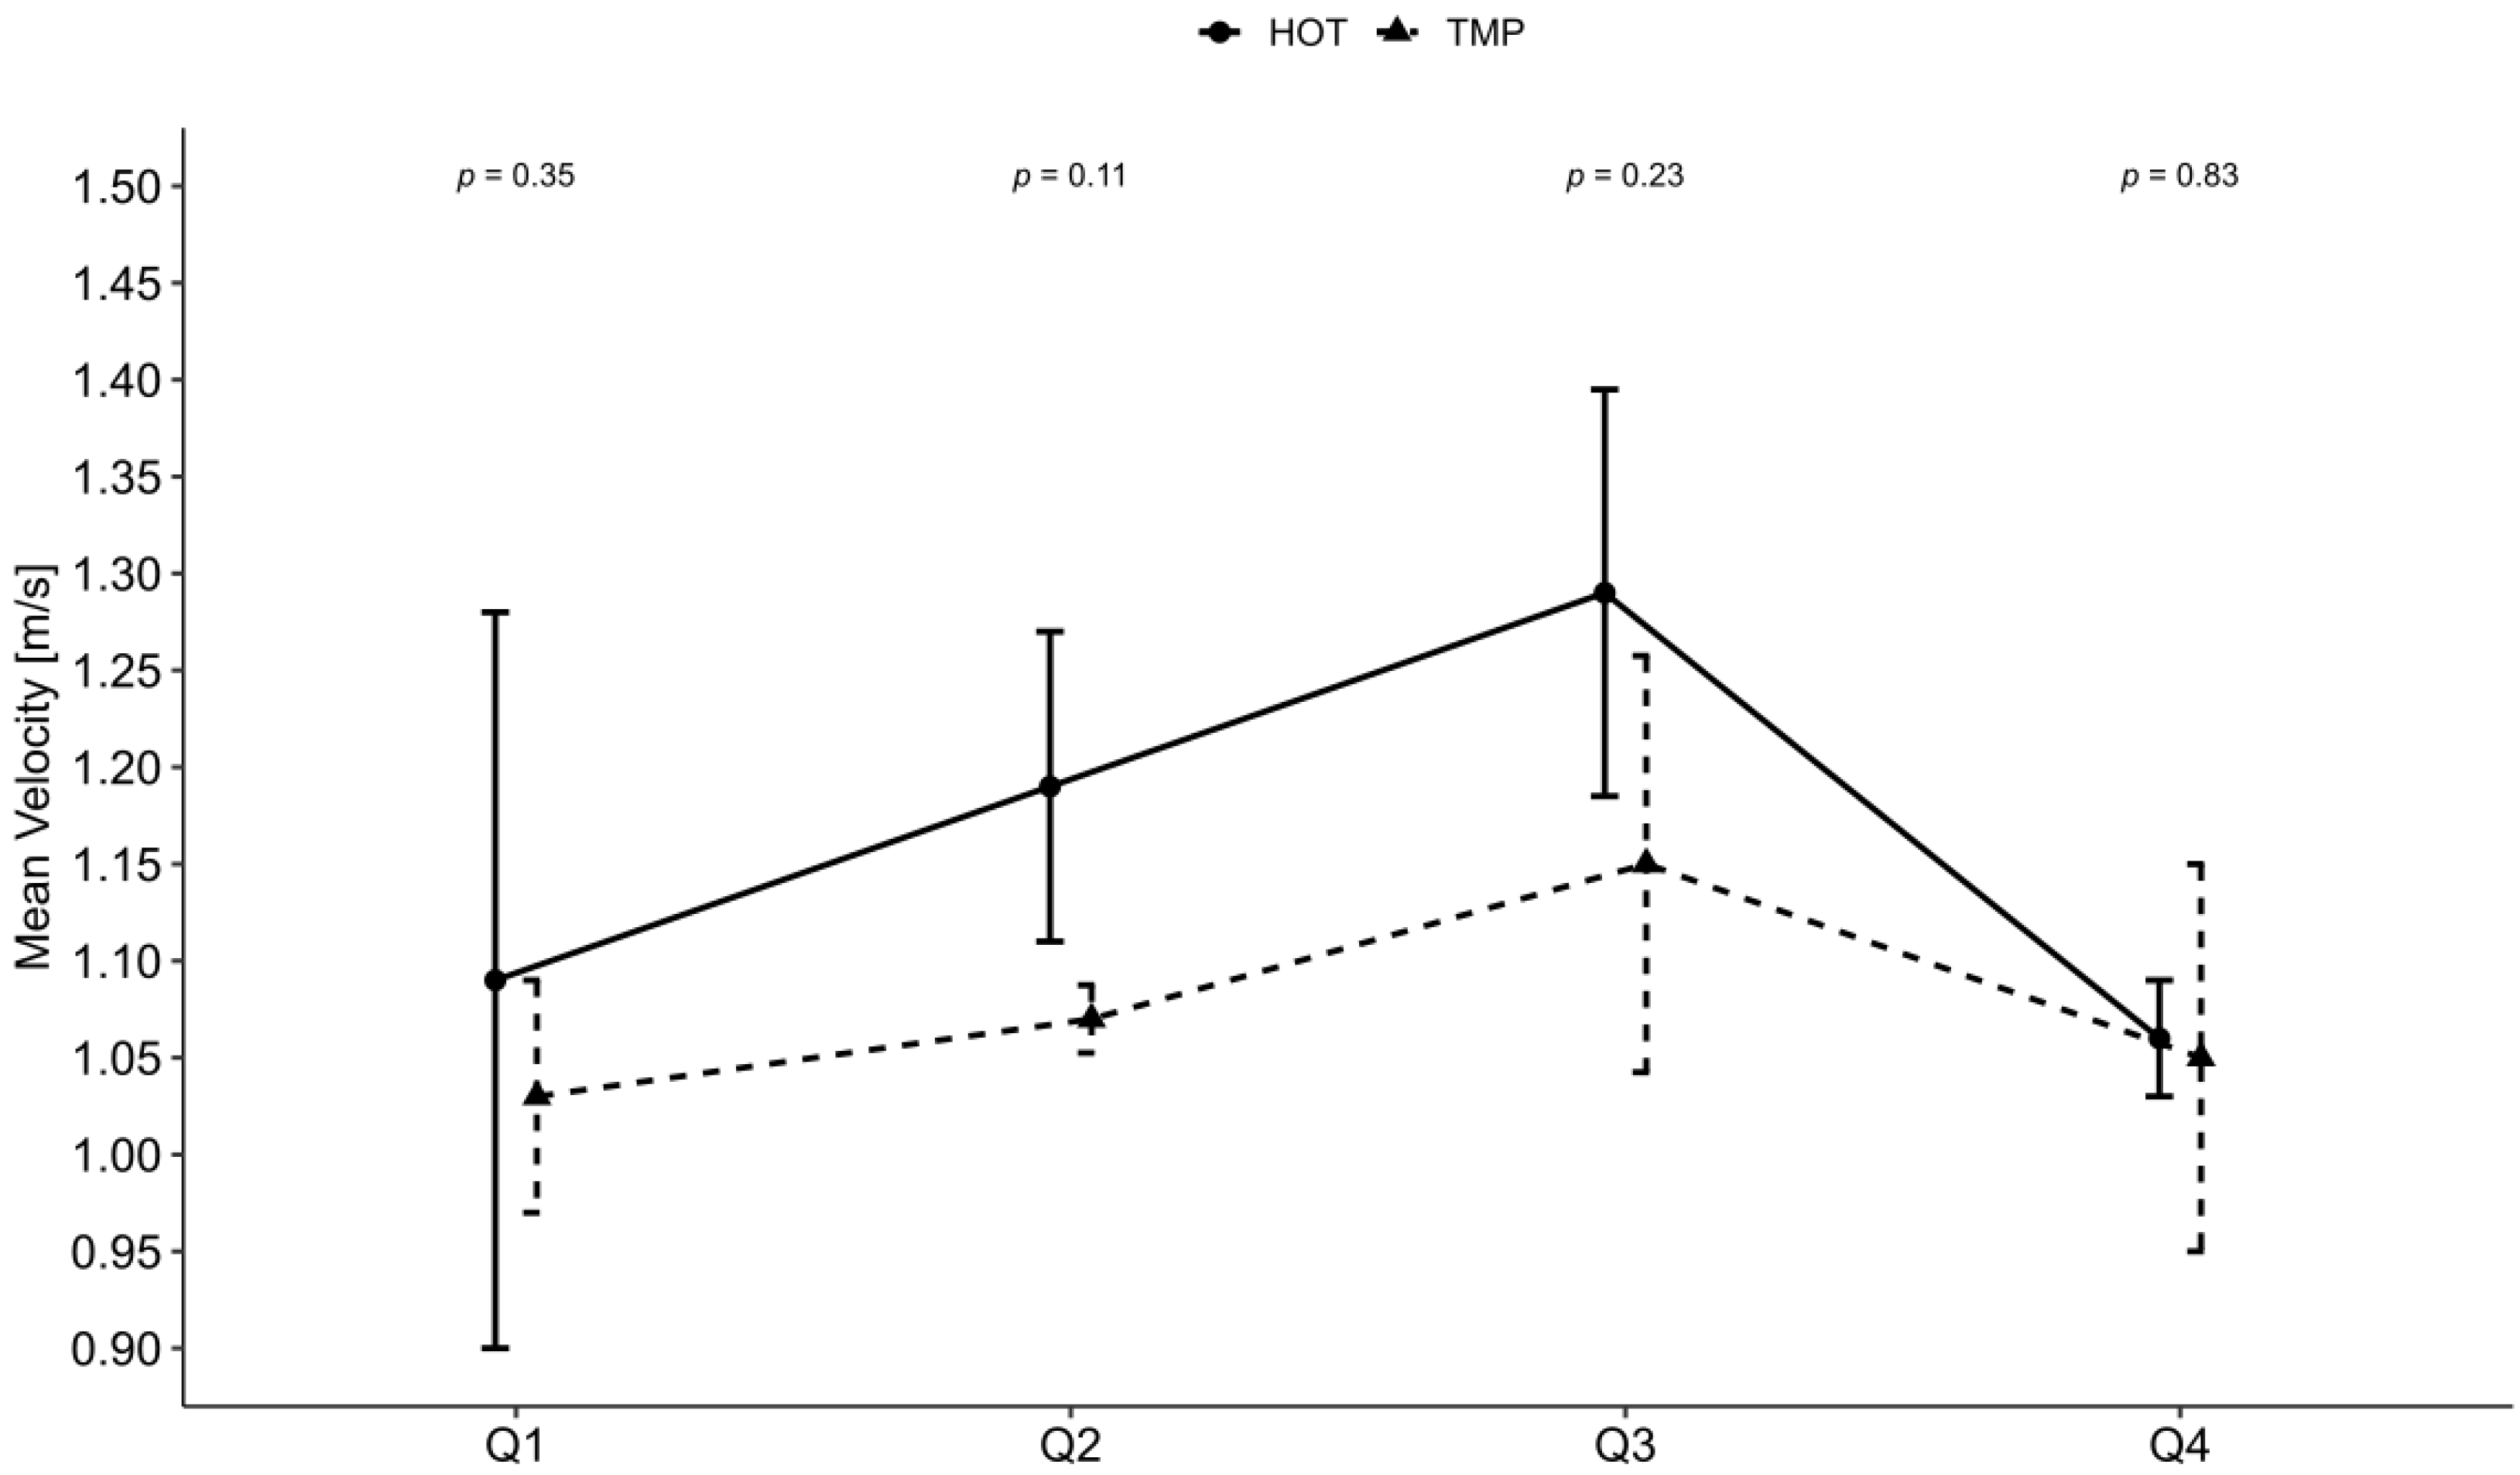
| Mean Velocity [m/s] | 1.12 | 0.11 | 1.07 | 0.08 | 0.54 |
| Playing Time [min] | 54.8 | 27.0 | 70.3 | 38.6 | 0.17 |
Publisher’s Note: MDPI stays neutral with regard to jurisdictional claims in published maps and institutional affiliations. |
© 2022 by the authors. Licensee MDPI, Basel, Switzerland. This article is an open access article distributed under the terms and conditions of the Creative Commons Attribution (CC BY) license (https://creativecommons.org/licenses/by/4.0/).
Share and Cite
Grossmann, F.; Perret, C.; Roelands, B.; Meeusen, R.; Flueck, J.L. Fluid Balance and Thermoregulatory Responses during Wheelchair Basketball Games in Hot vs. Temperate Conditions. Nutrients 2022, 14, 2930. https://doi.org/10.3390/nu14142930
Grossmann F, Perret C, Roelands B, Meeusen R, Flueck JL. Fluid Balance and Thermoregulatory Responses during Wheelchair Basketball Games in Hot vs. Temperate Conditions. Nutrients. 2022; 14(14):2930. https://doi.org/10.3390/nu14142930
Chicago/Turabian StyleGrossmann, Fabian, Claudio Perret, Bart Roelands, Romain Meeusen, and Joelle Leonie Flueck. 2022. "Fluid Balance and Thermoregulatory Responses during Wheelchair Basketball Games in Hot vs. Temperate Conditions" Nutrients 14, no. 14: 2930. https://doi.org/10.3390/nu14142930