
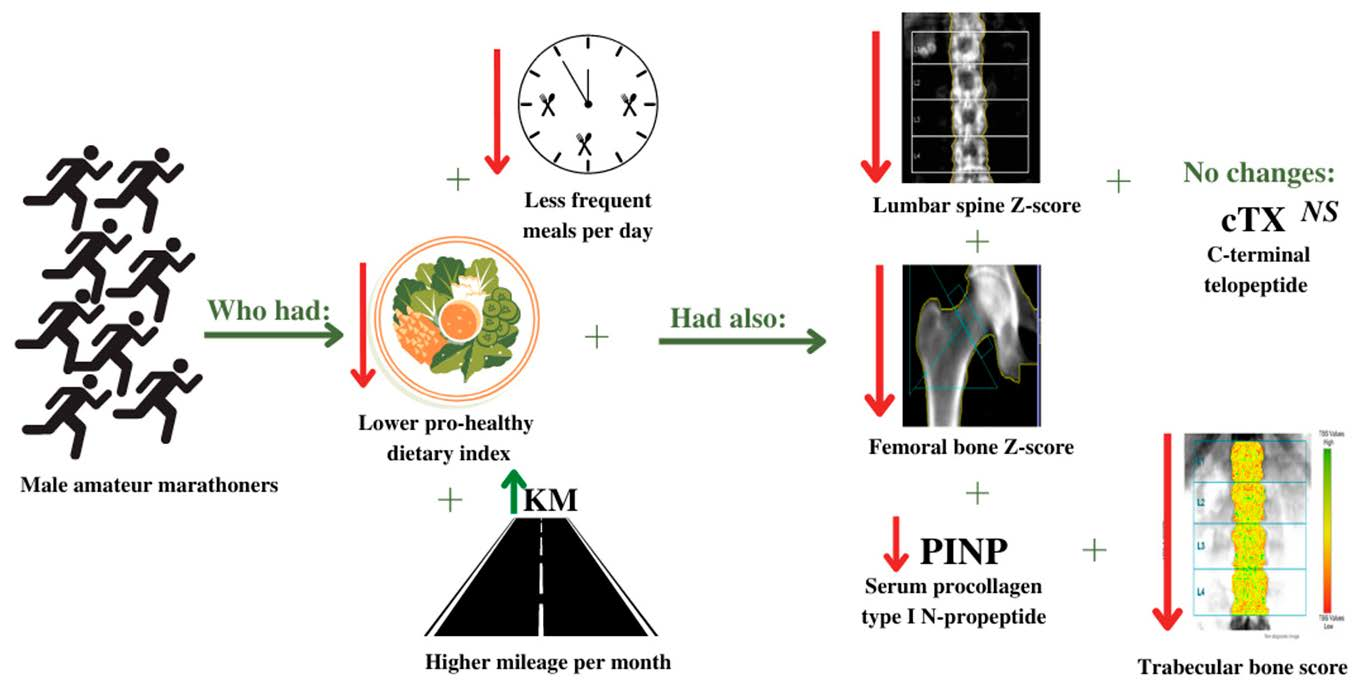
Dietary-Lifestyle Patterns Associated with Bone Turnover Markers, and Bone Mineral Density in Adult Male Distance Amateur Runners—A Cross-Sectional Study


Abstract
:
1. Introduction
2. Materials and Methods
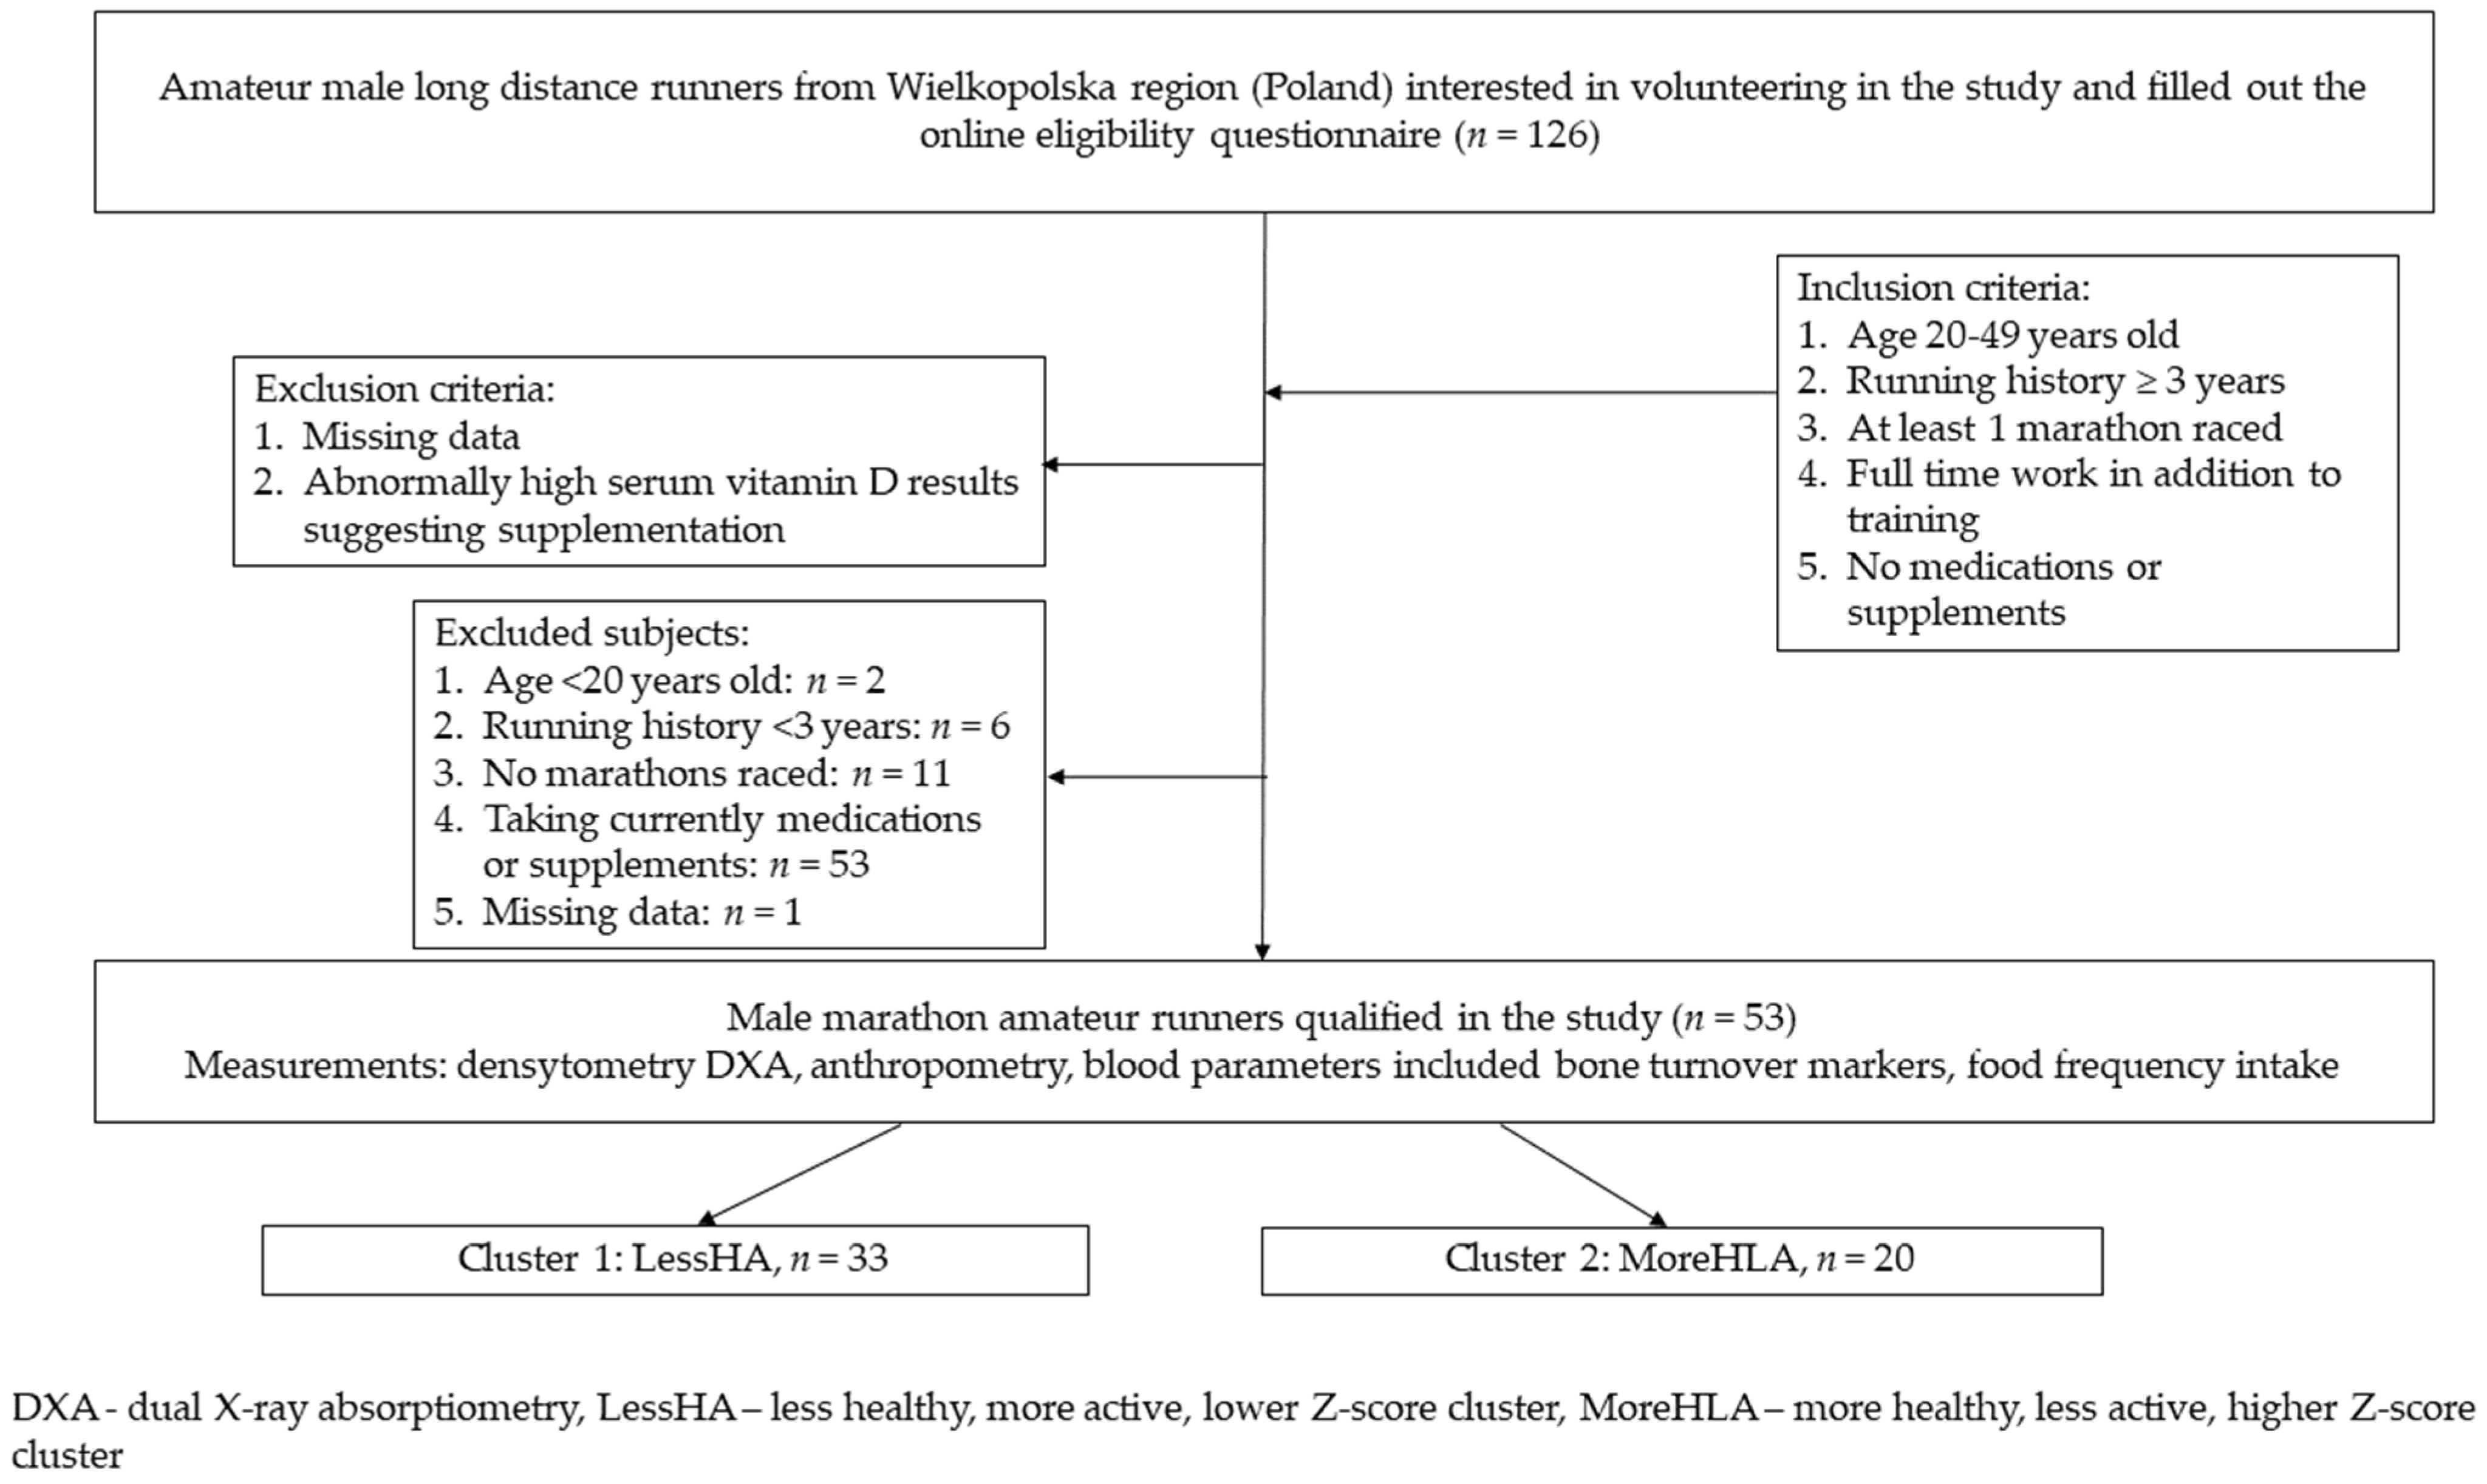
2.1. Participant’s Characteristics and Study Design
2.2. Dietary-Lifestyle Patterns
2.3. Nutritional Habits and Food Frequency Intake
2.4. Bone Mineral Density Measurements
2.5. Bone Turnover Markers and Vitamin D
2.6. Statistical Analysis
3. Results
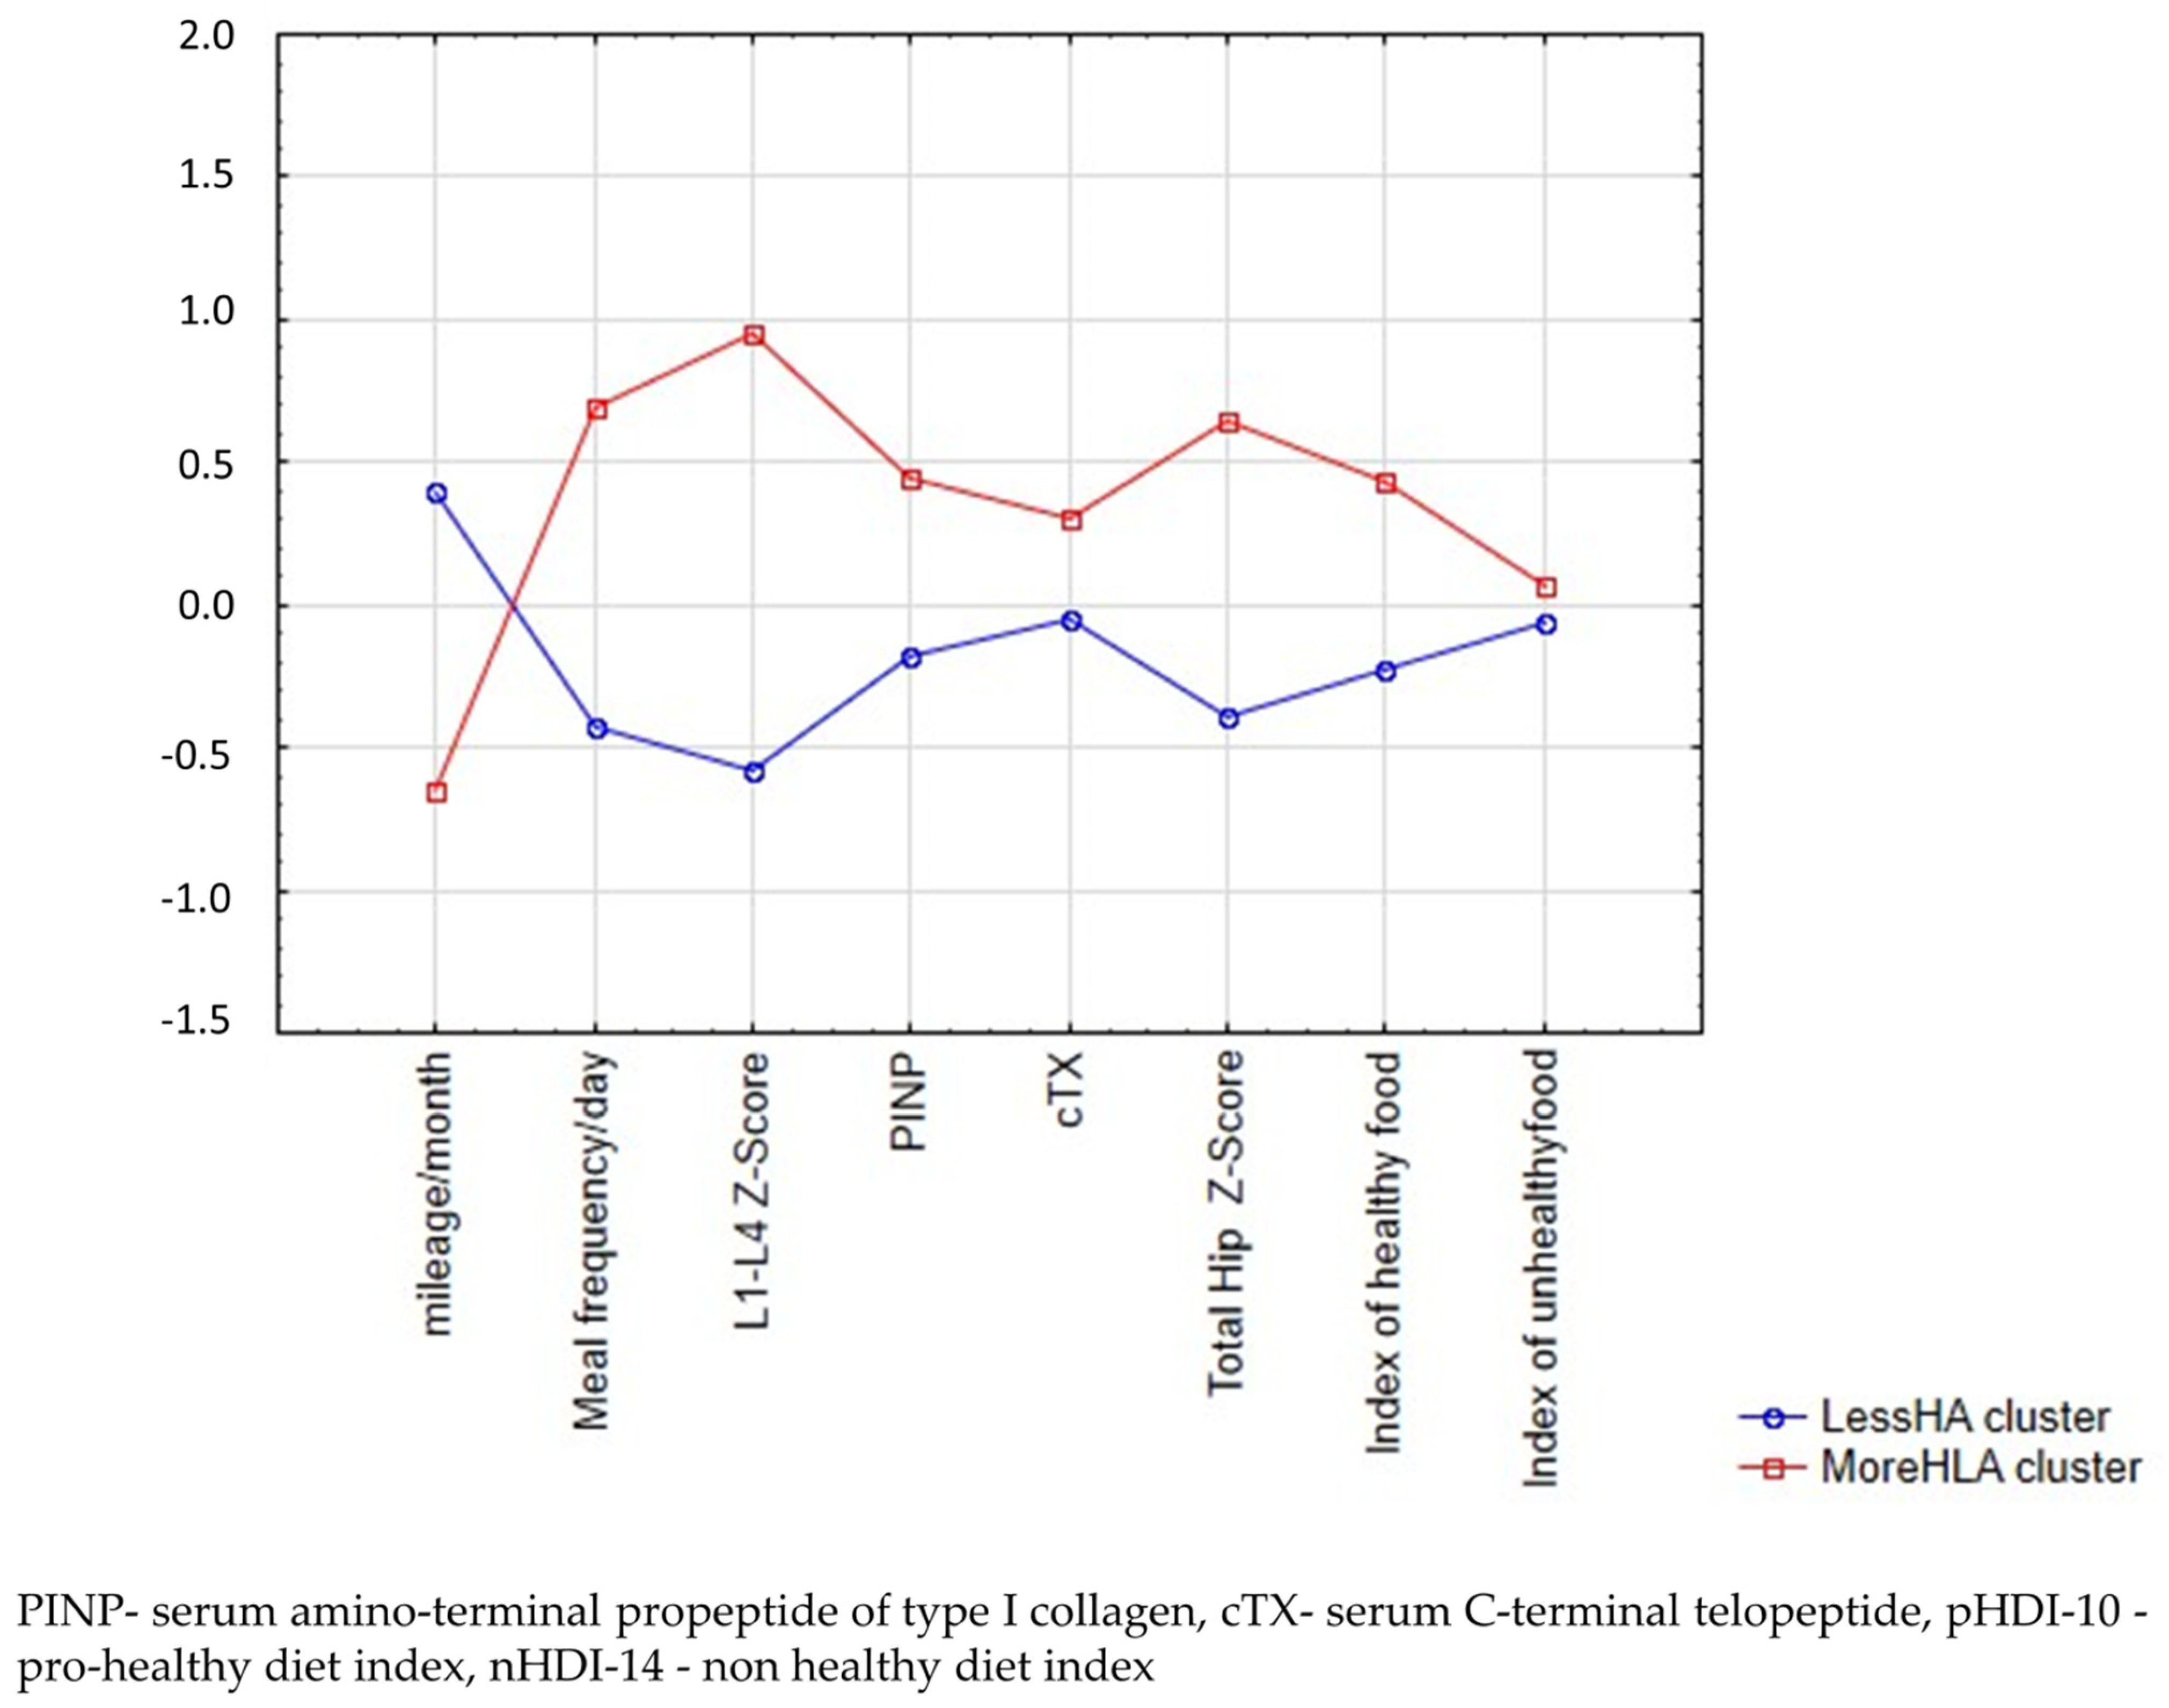
3.1. Dietary Lifestyle-Patterns
3.2. Participants’ Characteristics
3.3. Frequency of Food Intake
3.4. Bone Turnover Markers
4. Discussion
4.1. Bone Mineral Density
4.2. Bone Turnover Markers
4.3. Nutrition and Bone Health
4.4. Training Volume and Bone Health
5. Conclusions
Author Contributions
Funding
Institutional Review Board Statement
Informed Consent Statement
Data Availability Statement
Conflicts of Interest
References
- Running/Jogging Participants US 2006–2017 Statista. Available online: https://www.statista.com/statistics/190303/running-participants-in-the-us-since-2006/ (accessed on 11 March 2022).
- ARC Rynek i Opinia Jakie Dyscypliny Uprawiają Polacy? What Disciplines Do Poles Practice? Available online: https://arc.com.pl/jakie-dyscypliny-uprawiaja-polacy/ (accessed on 11 March 2022).
- Scott, J.P.R.; Sale, C.; Greeves, J.P.; Casey, A.; Dutton, J.; Fraser, W.D. The role of exercise intensity in the bone metabolic response to an acute bout of weight-bearing exercise. J. Appl. Physiol. 2011, 110, 423–432. [Google Scholar] [CrossRef] [PubMed]
- Maron, B.J. The paradox of exercise. N. Engl. J. Med. 2000, 343, 1409–1411. [Google Scholar] [CrossRef] [PubMed]
- O’Keefe, J.H.; Patil, H.R.; Lavie, C.J.; Magalski, A.; Vogel, R.A.; McCullough, P.A. Potential adverse cardiovascular effects from excessive endurance exercise. Mayo Clin. Proc. 2012, 87, 587–595. [Google Scholar] [CrossRef] [PubMed] [Green Version]
- Patil, H.R.; O’Keefe, J.H.; Lavie, C.J.; Magalski, A.; Vogel, R.A.; McCullough, P.A. Cardiovascular Damage Resulting from Chronic Excessive Endurance Exercise. Mo. Med. 2012, 109, 312. [Google Scholar]
- Tenforde, A.S.; Carlson, J.L.; Sainani, K.L.; Chang, A.O.; Kim, J.H.; Diaz, R.; Golden, N.H.; Fredericson, M. Lower Trabecular Bone Score and Spine Bone Mineral Density Are Associated with Bone Stress Injuries and Triad Risk Factors in Collegiate Athletes. PM R 2021, 13, 945–953. [Google Scholar] [CrossRef]
- Robling, A.G.; Turner, C.H. Mechanical signaling for bone modeling and remodeling. Crit. Rev. Eukaryot. Gene Expr. 2009, 19, 319–338. [Google Scholar] [CrossRef] [Green Version]
- Scofield, K.L.; Hecht, S. Bone health in endurance athletes: Runners, cyclists, and swimmers. Curr. Sports Med. Rep. 2012, 11, 328–334. [Google Scholar] [CrossRef]
- Fredericson, M.; Chew, K.; Ngo, J.; Cleek, T.; Kiratli, J.; Cobb, K. Regional bone mineral density in male athletes: A comparison of soccer players, runners and controls. Br. J. Sports Med. 2007, 41, 664–668. [Google Scholar] [CrossRef]
- Hamilton, B.R.; Staines, K.A.; Kelley, G.A.; Kelley, K.S.; Kohrt, W.M.; Pitsiladis, Y.; Guppy, F.M. The Effects of Exercise on Bone Mineral Density in Men: A Systematic Review and Meta-Analysis of Randomised Controlled Trials. Calcif. Tissue Int. 2022, 110, 41–56. [Google Scholar] [CrossRef]
- Burrows, M.; Nevill, A.M.; Bird, S.; Simpson, D. Physiological factors associated with low bone mineral density in female endurance runners. Br. J. Sports Med. 2003, 32, 67–71. [Google Scholar] [CrossRef] [Green Version]
- Burke, L.M.; Close, G.L.; Lundy, B.; Mooses, M.; Morton, J.P.; Tenforde, A.S. Relative energy deficiency in sport in male athletes: A commentary on its presentation among selected groups of male athletes. Int. J. Sport Nutr. Exerc. Metab. 2018, 28, 364–374. [Google Scholar] [CrossRef] [PubMed]
- Papageorgiou, M.; Dolan, E.; Elliott-Sale, K.J.; Sale, C. Reduced energy availability: Implications for bone health in physically active populations. Eur. J. Nutr. 2018, 57, 847–859. [Google Scholar] [CrossRef] [PubMed]
- Morel, J.; Combe, B.; Francisco, J.; Bernard, J. Bone mineral density of 704 amateur sportsmen involved in different physical activities. Osteoporos. Int. 2001, 12, 152–157. [Google Scholar] [CrossRef]
- Barrack, M.T.; Fredericson, M.; Tenforde, A.S.; Nattiv, A. Evidence of a cumulative effect for risk factors predicting low bone mass among male adolescent athletes. Br. J. Sports Med. 2017, 51, 200–205. [Google Scholar] [CrossRef] [PubMed]
- Škof, B.; Rotovnik Kozjek, N. A Comparison of Dietary Habits between Recreational Runners and a Randomly Selected Adult Population in Slovenia. Zdr. Varst. 2015, 54, 212–221. [Google Scholar]
- Kowalkowska, J.; Wadolowska, L.; Czarnocinska, J.; Czlapka-Matyasik, M.; Galinski, G.; Jezewska-Zychowicz, M.; Bronkowska, M.; Dlugosz, A.; Loboda, D.; Wyka, J. Reproducibility of a Questionnaire for Dietary Habits, Lifestyle and Nutrition Knowledge Assessment (KomPAN) in Polish Adolescents and Adults. Nutrients 2018, 10, 1845. [Google Scholar] [CrossRef] [Green Version]
- Bykowska-Derda, A.; Czlapka-Matyasik, M.; Kaluzna, M.; Ruchala, M.; Ziemnicka, K. Diet quality scores in relation to fatness and nutritional knowledge in women with polycystic ovary syndrome: Case–control study. Public Health Nutr. 2021, 24, 3389–3398. [Google Scholar] [CrossRef]
- Czlapka-Matyasik, M.; Lonnie, M.; Wadolowska, L.; Frelich, A. “Cutting down on sugar” by non-dieting young women: An impact on diet quality on weekdays and the weekend. Nutrients 2018, 10, 1463. [Google Scholar] [CrossRef] [Green Version]
- Kowalkowska, J.; Wadolowska, L.; Hamulka, J.; Wojtas, N.; Czlapka-Matyasik, M.; Kozirok, W.; Bronkowska, M.; Sadowska, J.; Naliwajko, S.; Dziaduch, I.; et al. Reproducibility of a short-form, multicomponent dietary questionnaire to assess food frequency consumption, nutrition knowledge, and lifestyle (SF-FFQ4polishchildren) in Polish children and adolescents. Nutrients 2019, 11, 2929. [Google Scholar] [CrossRef] [Green Version]
- Kowalkowska, J.; Wadolowska, L.; Czarnocinska, J.; Galinski, G.; Dlugosz, A.; Loboda, D.; Czlapka-Matyasik, M. Data-driven dietary patterns and diet quality scores: Reproducibility and consistency in sex and age subgroups of poles aged 15–65 years. Nutrients 2020, 12, 3598. [Google Scholar] [CrossRef]
- International Society for Clinical Densitometry ISCD Official Position on FRAX®. 2010. Available online: https://iscd.org/wp-content/uploads/2021/09/Official-Positions-ISCD-IOF-FRAX.pdf (accessed on 11 March 2022).
- Harvey, N.C.; Glüer, C.C.; Binkley, N.; McCloskey, E.V.; Brandi, M.-L.; Cooper, C.; Kendler, D.; Lamy, O.; Laslop, A.; Camargos, B.M.; et al. Trabecular bone score (TBS) as a new complementary approach for osteoporosis evaluation in clinical practice. Bone 2015, 78, 216–224. [Google Scholar] [CrossRef] [PubMed] [Green Version]
- Sobas, K.; Wadolowska, L.; Slowinska, M.A.; Wuenstel, J.; Niedzwiedzka, E.; Czlapka-Matyasik, M. Like mother, like daughter? Dietary and non-dietary bone fracture risk factors in mothers and their daughters. Iran. J. Public Health 2015, 44, 939–952. [Google Scholar] [PubMed]
- Lee, K.J.; Kim, K.S.; Kim, H.N.; Seo, J.A.; Song, S.W. Association between dietary calcium and phosphorus intakes, dietary calcium/phosphorus ratio and bone mass in the Korean population. Nutr. J. 2014, 13, 114. [Google Scholar] [CrossRef] [PubMed] [Green Version]
- Etherington, J.; Harris, P.A.; Nandra, D.; Hart, D.J.; Wolman, R.L.; Doyle, D.V.; Spector, T.D. The effect of weight-bearing exercise on bone mineral density: A study of female ex-elite athletes and the general population. J. Bone Miner. Res. Off. J. Am. Soc. Bone Miner. Res. 1996, 11, 1333–1338. [Google Scholar] [CrossRef]
- Hoxha, R.; Islami, H.; Qorraj-Bytyqi, H.; Thaçi, S.; Bahtiri, E. Relationship of weight and body mass index with bone mineral density in adult men from kosovo. Mater. Sociomed. 2014, 26, 306–308. [Google Scholar] [CrossRef] [Green Version]
- Tenforde, A.S.; Parziale, A.L.; Popp, K.L.; Ackerman, K.E. Low Bone Mineral Density in Male Athletes Is Associated With Bone Stress Injuries at Anatomic Sites With Greater Trabecular Composition. Am. J. Sports Med. 2018, 46, 30–36. [Google Scholar] [CrossRef] [Green Version]
- Heiniö, L.; Nikander, R.; Sievänen, H. Association between long-term exercise loading and lumbar spine trabecular bone score (TBS) in different exercise loading groups. J. Musculoskelet. Neuronal Interact. 2015, 15, 279–285. [Google Scholar]
- Garnero, P. The Utility of Biomarkers in Osteoporosis Management. Mol. Diagn. Ther. 2017, 21, 401–418. [Google Scholar] [CrossRef]
- Pirilä, S.; Taskinen, M.; Turanlahti, M.; Kajosaari, M.; Mäkitie, O.; Saarinen-Pihkala, U.M.; Viljakainen, H. Bone Health and Risk Factors of Cardiovascular Disease-A Cross-Sectional Study in Healthy Young Adults. PLoS ONE 2014, 9, e108040. [Google Scholar] [CrossRef]
- Banfi, G.; Lombardi, G.; Colombini, A.; Lippi, G. Bone Metabolism Markers in Sports Medicine. Sport. Med. 2010, 40, 697–714. [Google Scholar] [CrossRef]
- Oosthuyse, T.; Badenhorst, M.; Avidon, I. Bone resorption is suppressed immediately after the third and fourth days of multiday cycling but persistently increased following overnight recovery. Appl. Physiol. Nutr. Metab. 2014, 39, 64–73. [Google Scholar] [CrossRef] [PubMed] [Green Version]
- Jon Schoenfeld, B.; Albert Aragon, A.; Krieger, J.W. Effects of meal frequency on weight loss and body composition: A meta-analysis. Nutr. Rev. 2015, 73, 69–82. [Google Scholar] [CrossRef] [PubMed] [Green Version]
- Schwedhelm, C.; Lipsky, L.M.; Temmen, C.D.; Nansel, T.R. Eating Patterns during Pregnancy and Postpartum and Their Association with Diet Quality and Energy Intake. Nutrients 2022, 14, 1167. [Google Scholar] [CrossRef] [PubMed]
- Durkalec-Michalski, K.; Kusy, K.; Ciekot-Sołtysiak, M.; Zieliński, J. The Effect of Beta-Alanine versus Alkaline Agent Supplementation Combined with Branched-Chain Amino Acids and Creatine Malate in Highly-Trained Sprinters and Endurance Athletes: A Randomized Double-Blind Crossover Study. Nutrients 2019, 11, 1961. [Google Scholar] [CrossRef] [PubMed] [Green Version]
- Ratajczak, J.; Czerniak, U.; Wieliński, D.; Ciekot-Sołtysiak, M.; Zieliński, J.; Gronek, P.; Demuth, A. Pro-Healthy Diet Properties and Its Determinants among Aging Masters Athletes. Int. J. Environ. Res. Public Health 2021, 18, 7614. [Google Scholar] [CrossRef]
- Martinovic, D.; Tokic, D.; Martinovic, L.; Vilovic, M.; Vrdoljak, J.; Kumric, M.; Bukic, J.; Ticinovic Kurir, T.; Tavra, M.; Bozic, J. Adherence to Mediterranean Diet and Tendency to Orthorexia Nervosa in Professional Athletes. Nutrients 2022, 14, 2237. [Google Scholar] [CrossRef]


| SS-between | df | SS-within | df | F | p | |
|---|---|---|---|---|---|---|
| Mileage/month | 13.70 | 1 | 41.68 | 51 | 16.77 | 0.00 |
| Meal frequency/day | 15.70 | 1 | 40.79 | 51 | 19.63 | 0.00 |
| Lumbar L1-L4 Z-Score | 29.13 | 1 | 23.85 | 51 | 62.29 | 0.00 |
| PINP 1 | 4.89 | 1 | 51.64 | 51 | 4.83 | 0.03 |
| cTX 2 | 1.48 | 1 | 44.17 | 51 | 1.70 | 0.20 |
| Femoral Z-Score | 13.44 | 1 | 38.56 | 51 | 17.78 | 0.00 |
| pHDI-10 3 | 5.34 | 1 | 46.19 | 51 | 5.90 | 0.02 |
| nHDI-14 4 | 0.19 | 1 | 52.58 | 51 | 0.19 | 0.67 |
| Characteristics | Less-Healthy-More Active-Low-Z-Score (n = 33) | More-Healthy-Less-Active-High-Z-Score (n = 20) | Total Sample (n = 53) | p |
|---|---|---|---|---|
| Age (years): | 40.82 ± 5.80 | 36.65 ± 7.21 | 39.07 ± 6.32 | |
| Mean ± SD | 42.00 (38.64; 42.57) | 37.00 (33.22; 39.88) | 41.00 (37.30; 40.84) | |
| Median (CI 95%) <30 n (%) | 2 (6) | 4 (20) | 6 (11) | 0.04 * |
| 30–34 | 2 (6) | 4 (20) | 6 (11) | |
| 35–39 | 7 (21) | 4 (20) | 11 (21) | 0.14 |
| 40–44 | 13 (39) | 3 (15) | 16 (30) | |
| ≥45 | 9 (27) | 5 (25) | 14 (26) | |
| BMI (kg/m2) | 23.98 ± 2.27 | 24.58 ± 2.29 | 24.21 ± 2.27 | 0.41 |
| Mean ± SD | 23.60 (23.17; 24.78) | 24.30 (23.51; 25.66) | 23.80 (23.58; 24.80) | |
| Median (CI 95%) <25 | 21 (64) | 14 (70) | 35 (66) | 0.64 |
| ≥25 | 12 (36) | 6 (30) | 18 (34) | |
| Fat percentage 1 | 21.32 ± 4.04 | 20.15 ± 4.06 | 21.00 ± 4.07 | 0.39 |
| Mean ± SD | 21.38 (19.60; 23.04) | 19.97 (17.98; 22.33) | 20.87 (19.57; 22.20) | |
| Median (CI 95%) Athletes (6–13%) | 2 (6) | 2 (10) | 4 (7) | |
| Fitness (14–17%) | 7 (21) | 2 (10) | 9 (17) | 0.73 |
| Average (18–24%) | 17 (51) | 11 (55) | 28 (53) | |
| Obese (≥25%) | 7 (21) | 5 (25) | 12 (23) | |
| Education level | ||||
| Lower secondary | 2 (6) | 1 (5) | 3 (6) | |
| Upper secondary | 10 (30) | 3 (15) | 13 (24) | 0.34 |
| Higher (e.g., B.S., M.S.) | 21 (64) | 16 (80) | 37 (70) | |
| Physical activity at work/school (self-reported) | ||||
| Low | 15 (45) | 10 (50) | 25 (47) | |
| Medium | 7 (21) | 5 (25) | 12 (23) | 0.81 |
| High | 11 (33) | 5 (25) | 26 (49) | |
| Financial situation (self-reported) | ||||
| Below average | 0 | 0 | 0 | |
| Average | 21 (64) | 7 (35) | 28 (53) | 0.06 |
| Above average | 12 (36) | 13 (65) | 25 (47) | |
| Average yearly mileage/month | ||||
| Mean ± SD | 263 ± 89 | 169 ± 66 | 227 ± 92 | |
| Median (CI 95%) | 250 (231.43; 294.64) | 165 (137.89; 199.60) | 200 (201.88; 253.02) | |
| <100 km | 0 | 3 (15) | 3 (6) | |
| 100–150 km | 4 (12) | 5 (25) | 9 (17) | 0.00 * |
| 151–200 km | 8 (24) | 7 (35) | 15 (28) | |
| 201–250 km | 6 (18) | 4 (20) | 10 (19) | 0.00 * |
| 251–300 km | 5 (15) | 1 (5) | 6 (11) | |
| 301–350 km | 3 (9) | 0 | 3 (6) | |
| >350 km | 7 (21) | 0 | 7 (13) | |
| Running history | ||||
| Less than 5 years | 5 (15) | 8 (40) | 13 (24) | 0.04 * |
| More than 5 years | 28 (84) | 12 (60) | 40 (75) |
| Less-Healthy-More Active-Low-Z-Score | More-Healthy-Less-Active-High-Z-Score | p | |||||||||
|---|---|---|---|---|---|---|---|---|---|---|---|
| Mean | ±SD | Median | CI (95%) | Mean | ±SD | Median | CI (95%) | ||||
| White bread | 0.83 | 0.73 | 0.50 | 0.57 | 1.08 | 0.92 | 0.69 | 0.50 | 0.60 | 1.24 | 0.64 |
| Wholemeal bread | 0.66 | 0.65 | 0.50 | 0.43 | 0.88 | 0.76 | 0.71 | 0.50 | 0.43 | 1.10 | 0.57 |
| White rice, pasta, fine-ground groats | 0.38 | 0.24 | 0.50 | 0.30 | 0.47 | 0.50 | 0.41 | 0.50 | 0.31 | 0.70 | 0.19 |
| Buckwheat, oats, wholegrain pasta, or other coarse-ground groats | 0.36 | 0.33 | 0.14 | 0.24 | 0.48 | 0.55 | 0.38 | 0.50 | 0.37 | 0.73 | 0.06 |
| Fast food | 0.07 | 0.08 | 0.06 | 0.04 | 0.10 | 0.07 | 0.04 | 0.06 | 0.06 | 0.09 | 0.96 |
| Fried dishes | 0.38 | 0.25 | 0.50 | 0.29 | 0.46 | 0.37 | 0.25 | 0.50 | 0.25 | 0.48 | 0.90 |
| Butter | 0.58 | 0.70 | 0.50 | 0.33 | 0.83 | 1.03 | 0.87 | 1.00 | 0.63 | 1.44 | 0.04 * |
| Lard | 0.02 | 0.03 | 0.00 | 0.00 | 0.03 | 0.01 | 0.02 | 0.00 | 0.00 | 0.02 | 0.71 |
| Vegetable oils | 0.39 | 0.38 | 0.50 | 0.25 | 0.52 | 0.25 | 0.46 | 0.06 | 0.03 | 0.47 | 0.25 |
| Milk | 0.77 | 0.48 | 1.00 | 0.60 | 0.94 | 0.80 | 0.65 | 1.00 | 0.50 | 1.10 | 0.86 |
| Fermented milk products | 0.42 | 0.36 | 0.50 | 0.29 | 0.55 | 0.53 | 0.33 | 0.50 | 0.37 | 0.68 | 0.28 |
| Fresh cheese curd products | 0.30 | 0.27 | 0.14 | 0.21 | 0.40 | 0.51 | 0.34 | 0.50 | 0.35 | 0.67 | 0.02 * |
| Hard cheese | 0.51 | 0.44 | 0.50 | 0.36 | 0.67 | 0.56 | 0.34 | 0.50 | 0.40 | 0.72 | 0.67 |
| Cured meat, smoked sausages | 0.68 | 0.68 | 0.50 | 0.44 | 0.92 | 0.51 | 0.50 | 0.50 | 0.28 | 0.74 | 0.34 |
| Red meat | 0.31 | 0.36 | 0.14 | 0.18 | 0.44 | 0.32 | 0.26 | 0.32 | 0.20 | 0.44 | 0.92 |
| White meat | 0.38 | 0.18 | 0.50 | 0.32 | 0.45 | 0.43 | 0.26 | 0.50 | 0.31 | 0.56 | 0.42 |
| Fish | 0.14 | 0.12 | 0.14 | 0.09 | 0.18 | 0.19 | 0.16 | 0.14 | 0.12 | 0.27 | 0.16 |
| Eggs | 0.43 | 0.39 | 0.50 | 0.29 | 0.57 | 0.50 | 0.26 | 0.50 | 0.38 | 0.62 | 0.51 |
| Pulses-based foods | 0.14 | 0.16 | 0.06 | 0.08 | 0.19 | 0.17 | 0.24 | 0.10 | 0.06 | 0.28 | 0.49 |
| Potatoes | 0.28 | 0.19 | 0.14 | 0.21 | 0.35 | 0.27 | 0.20 | 0.14 | 0.17 | 0.36 | 0.77 |
| Fruit | 0.98 | 0.64 | 1.00 | 0.75 | 1.20 | 1.13 | 0.56 | 1.00 | 0.86 | 1.39 | 0.40 |
| Vegetables | 0.85 | 0.56 | 0.50 | 0.65 | 1.05 | 1.23 | 0.68 | 1.00 | 0.91 | 1.55 | 0.03 * |
| Sweets | 0.57 | 0.48 | 0.50 | 0.40 | 0.74 | 0.60 | 0.41 | 0.50 | 0.41 | 0.80 | 0.80 |
| Instant soups or ready-made soups | 0.06 | 0.15 | 0.00 | 0.01 | 0.11 | 0.02 | 0.04 | 0.00 | −0.00 | 0.04 | 0.19 |
| Tinned meats | 0.02 | 0.03 | 0.00 | 0.01 | 0.03 | 0.01 | 0.02 | 0.00 | −0.00 | 0.01 | 0.04 * |
| Tinned vegetables | 0.18 | 0.18 | 0.14 | 0.11 | 0.24 | 0.15 | 0.19 | 0.06 | 0.06 | 0.23 | 0.57 |
| Fruit juices | 0.32 | 0.27 | 0.14 | 0.22 | 0.41 | 0.33 | 0.30 | 0.14 | 0.18 | 0.47 | 0.91 |
| Vegetable juices | 0.18 | 0.23 | 0.06 | 0.10 | 0.26 | 0.31 | 0.31 | 0.14 | 0.17 | 0.46 | 0.07 |
| Sweetened hot drinks | 0.70 | 0.85 | 0.14 | 0.39 | 1.00 | 0.52 | 0.88 | 0.00 | 0.11 | 0.93 | 0.47 |
| Sweetened drinks | 0.08 | 0.17 | 0.06 | 0.02 | 0.14 | 0.07 | 0.11 | 0.06 | 0.02 | 0.13 | 0.79 |
| Energy drinks | 0.79 | 0.39 | 1.00 | 0.65 | 0.92 | 0.91 | 0.28 | 1.00 | 0.78 | 1.04 | 0.22 |
| Water | 1.34 | 0.79 | 2.00 | 1.06 | 1.62 | 1.70 | 0.55 | 2.00 | 1.44 | 1.96 | 0.08 |
| Alcoholic beverages | 0.22 | 0.24 | 0.14 | 0.14 | 0.31 | 0.25 | 0.27 | 0.10 | 0.13 | 0.38 | 0.70 |
| pHDI-10 1 | 24.98 | 9.51 | 23.10 | 21.61 | 28.35 | 31.54 | 9.57 | 30.80 | 27.06 | 36.02 | 0.02 * |
| n-HDI-14 2 | 19.31 | 6.90 | 18.74 | 16.86 | 21.76 | 20.11 | 5.64 | 20.11 | 17.47 | 22.74 | 0.67 |
| Less-Healthy-More Active-Low-Z-Score | More-Healthy-Less-Active-High-Z-Score | ||||||||||
|---|---|---|---|---|---|---|---|---|---|---|---|
| Mean | ±SD | Median | CI (95%) | Mean | ±SD | Median | CI (95%) | p | |||
| 25OH-D3 1 (ng/mL) | 30.58 | 11.27 | 29.30 | 26.58 | 34.58 | 27.99 | 8.12 | 28.15 | 24.18 | 31.79 | 0.49 |
| cTX 2 (ng/mL) | 0.28 | 0.11 | 0.29 | 0.24 | 0.32 | 0.33 | 0.19 | 0.26 | 0.24 | 0.43 | 0.58 |
| PINP 3 (ng/mL) | 61.60 | 19.58 | 58.10 | 54.65 | 68.54 | 75.87 | 27.60 | 72.20 | 62.95 | 88.78 | 0.05 * |
| Total BMD 4 (g/m2) | 1.15 | 0.13 | 1.14 | 1.10 | 1.19 | 1.11 | 0.17 | 1.00 | 1.03 | 1.19 | 0.35 |
| Total Hip T-Score (-) | −0.17 | 0.80 | −0.10 | −0.46 | 0.11 | 0.85 | 0.82 | 0.90 | 0.47 | 1.24 | 0.00 * |
| Femoral Neck Z-Score (-) | 0.10 | 0.78 | 0.17 | −0.18 | 0.38 | 1.04 | 0.94 | 1.01 | 0.60 | 1.48 | 0.00 * |
| Ward’s Triangle Z-Score (-) | −0.30 | 0.84 | −0.15 | −0.60 | −0.00 | 0.93 | 1.32 | 0.71 | 0.31 | 1.55 | 0.00 * |
| Trochanter Z-Score (-) | −0.12 | 1.06 | 0.04 | −0.50 | 0.25 | 0.99 | 0.85 | 1.04 | 0.59 | 1.39 | 0.00 * |
| Total Hip Z-Score (-) | 0.07 | 0.78 | 0.23 | −0.21 | 0.35 | 0.99 | 0.73 | 1.01 | 0.64 | 1.33 | 0.00 * |
| L1-L4 BMD 4 (g/m2) | 1.15 | 0.09 | 1.17 | 1.11 | 1.18 | 1.38 | 0.12 | 1.39 | 1.33 | 1.44 | 0.00 * |
| L1-L4 T-Score (-) | −0.65 | 0.74 | −0.52 | −0.91 | −0.39 | 1.34 | 1.01 | 1.35 | 0.87 | 1.82 | 0.00 * |
| L1-L4 Z-Score (-) | −0.58 | 0.80 | −0.56 | −0.86 | −0.29 | 1.34 | 0.94 | 1.43 | 0.90 | 1.78 | 0.00 * |
| TBS (-) 5 | 1.38 | 0.08 | 1.36 | 0.06 | 0.11 | 1.45 | 0.08 | 1.46 | 0.06 | 0.12 | 0.00 * |
Publisher’s Note: MDPI stays neutral with regard to jurisdictional claims in published maps and institutional affiliations. |
© 2022 by the authors. Licensee MDPI, Basel, Switzerland. This article is an open access article distributed under the terms and conditions of the Creative Commons Attribution (CC BY) license (https://creativecommons.org/licenses/by/4.0/).
Share and Cite
Bykowska-Derda, A.; Zielińska-Dawidziak, M.; Czlapka-Matyasik, M. Dietary-Lifestyle Patterns Associated with Bone Turnover Markers, and Bone Mineral Density in Adult Male Distance Amateur Runners—A Cross-Sectional Study. Nutrients 2022, 14, 2048. https://doi.org/10.3390/nu14102048
Bykowska-Derda A, Zielińska-Dawidziak M, Czlapka-Matyasik M. Dietary-Lifestyle Patterns Associated with Bone Turnover Markers, and Bone Mineral Density in Adult Male Distance Amateur Runners—A Cross-Sectional Study. Nutrients. 2022; 14(10):2048. https://doi.org/10.3390/nu14102048
Chicago/Turabian StyleBykowska-Derda, Aleksandra, Magdalena Zielińska-Dawidziak, and Magdalena Czlapka-Matyasik. 2022. "Dietary-Lifestyle Patterns Associated with Bone Turnover Markers, and Bone Mineral Density in Adult Male Distance Amateur Runners—A Cross-Sectional Study" Nutrients 14, no. 10: 2048. https://doi.org/10.3390/nu14102048