
Effects of Dietary Intervention and Education on Selected Biochemical Parameters and Nutritional Habits of Young Soccer Players
 , ,
, ,  ,
,  and
and 
Abstract
:
1. Introduction
2. Materials and Methods
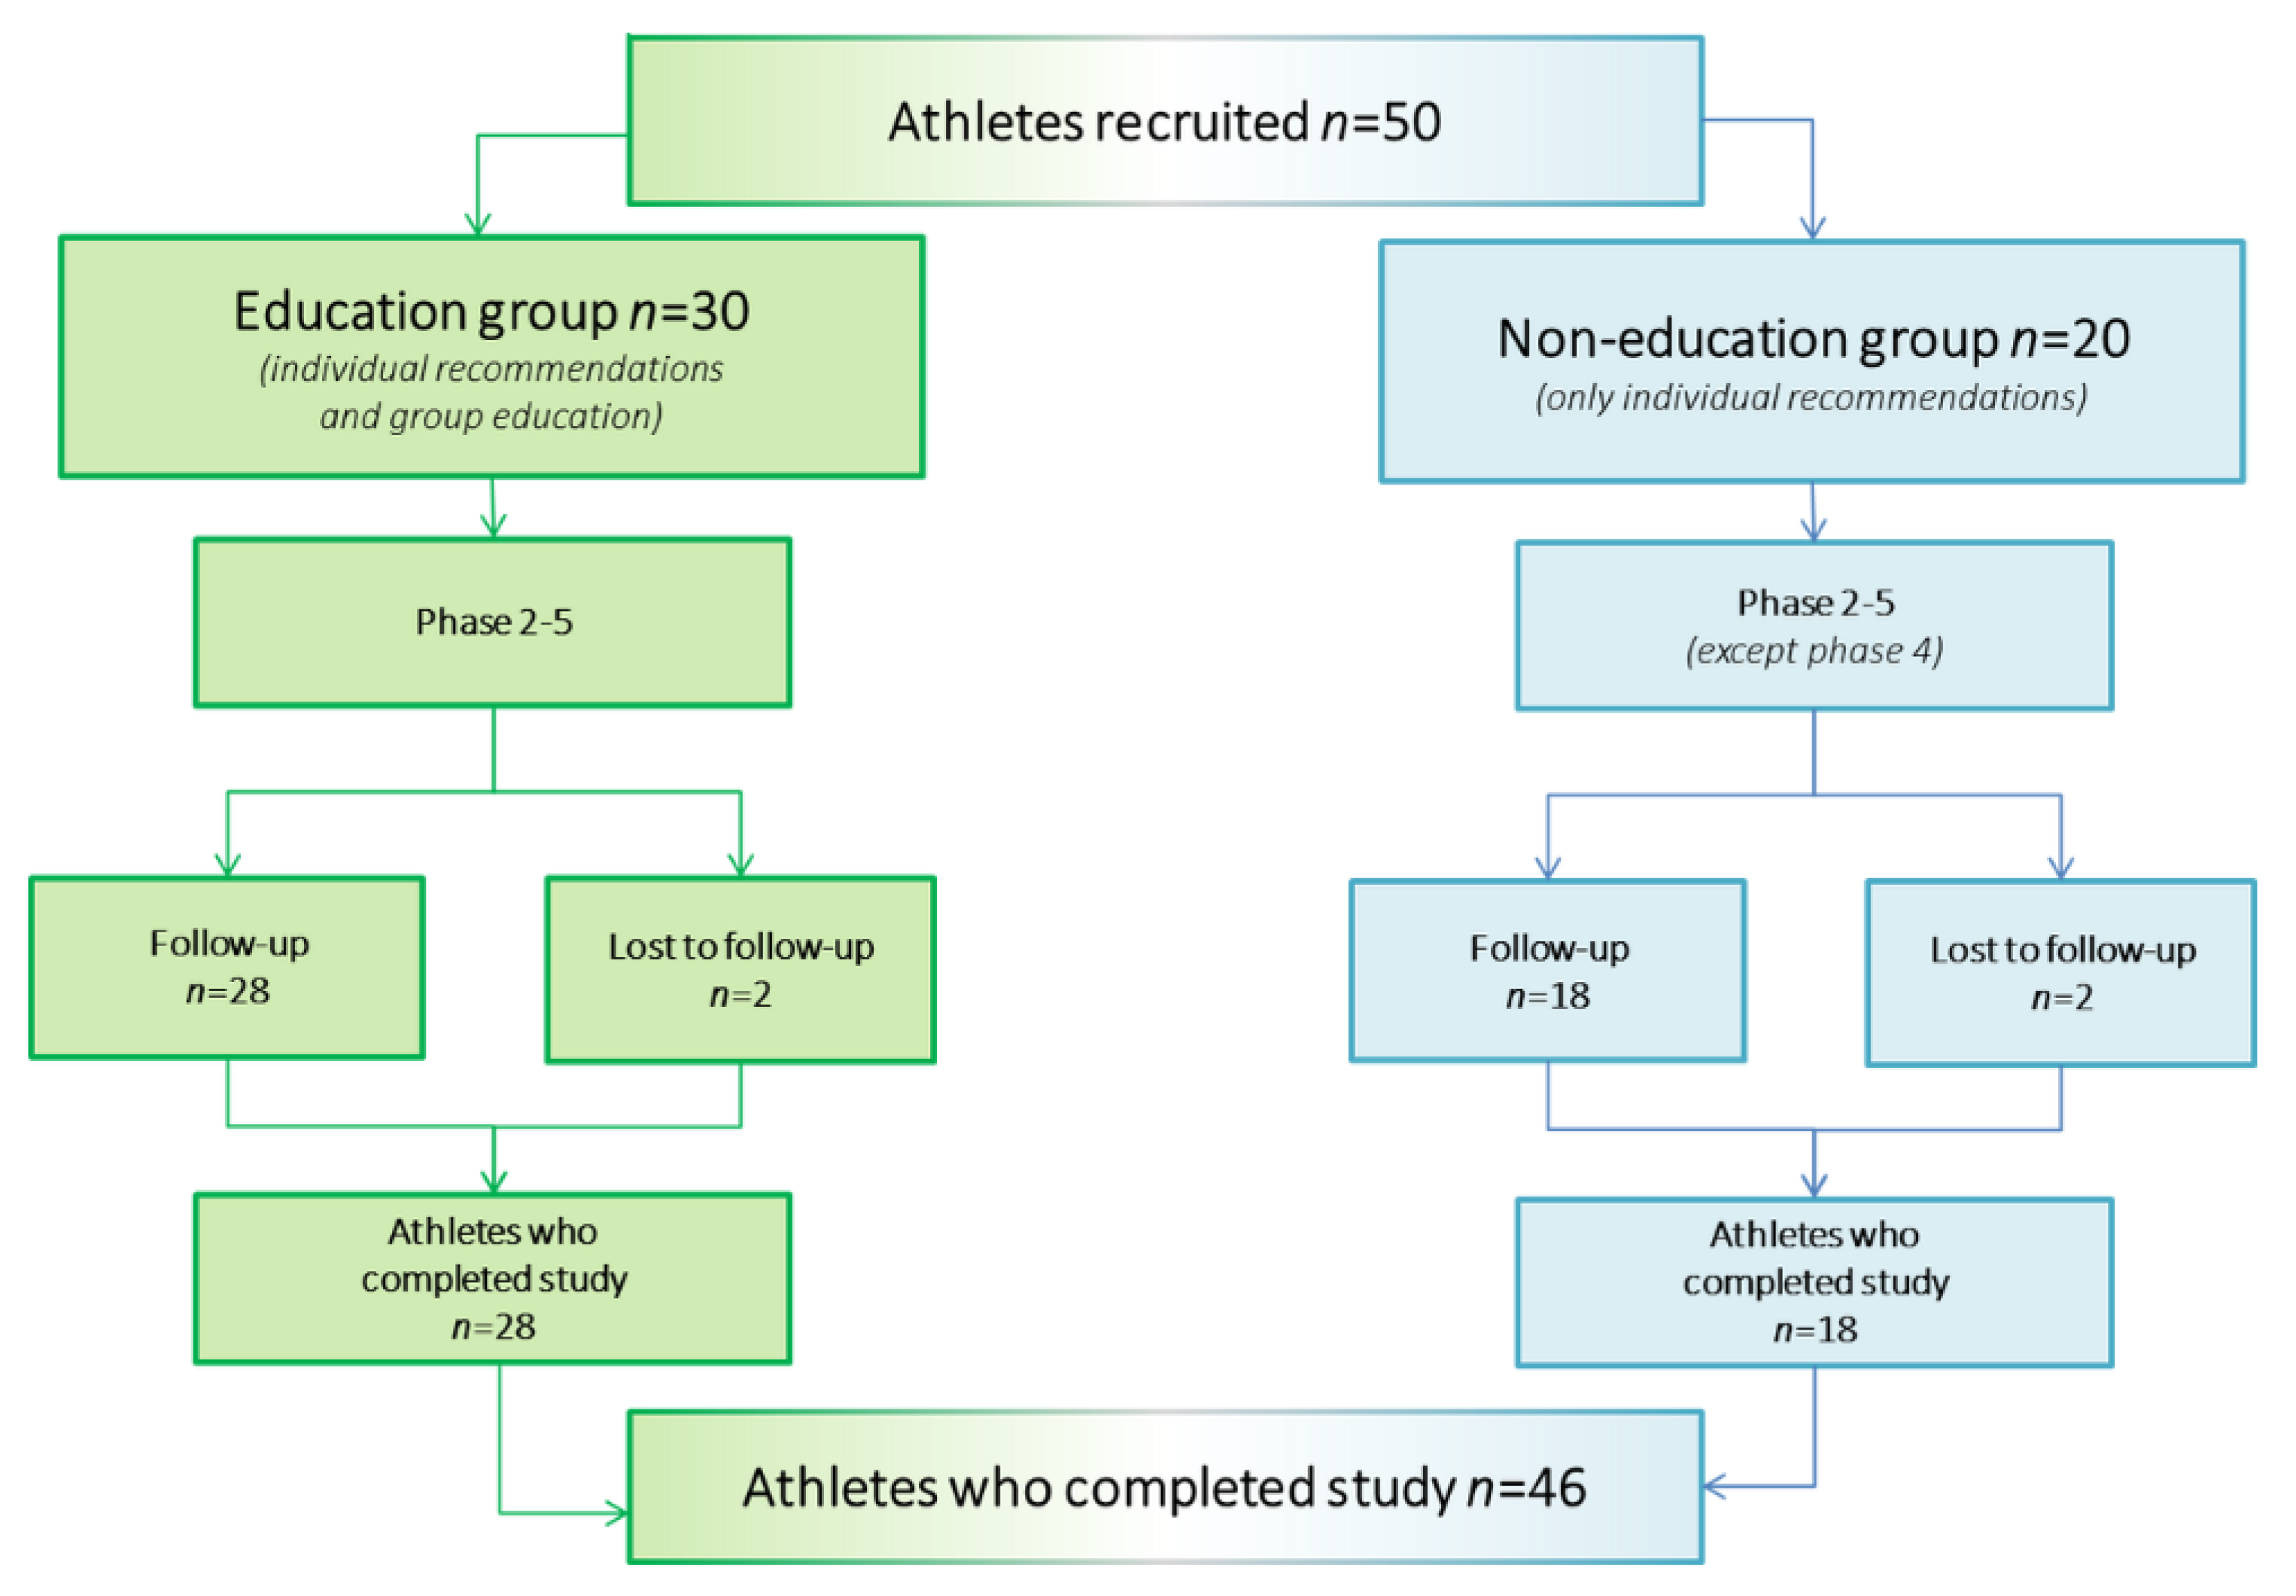
2.1. Study Group
2.2. Study Design
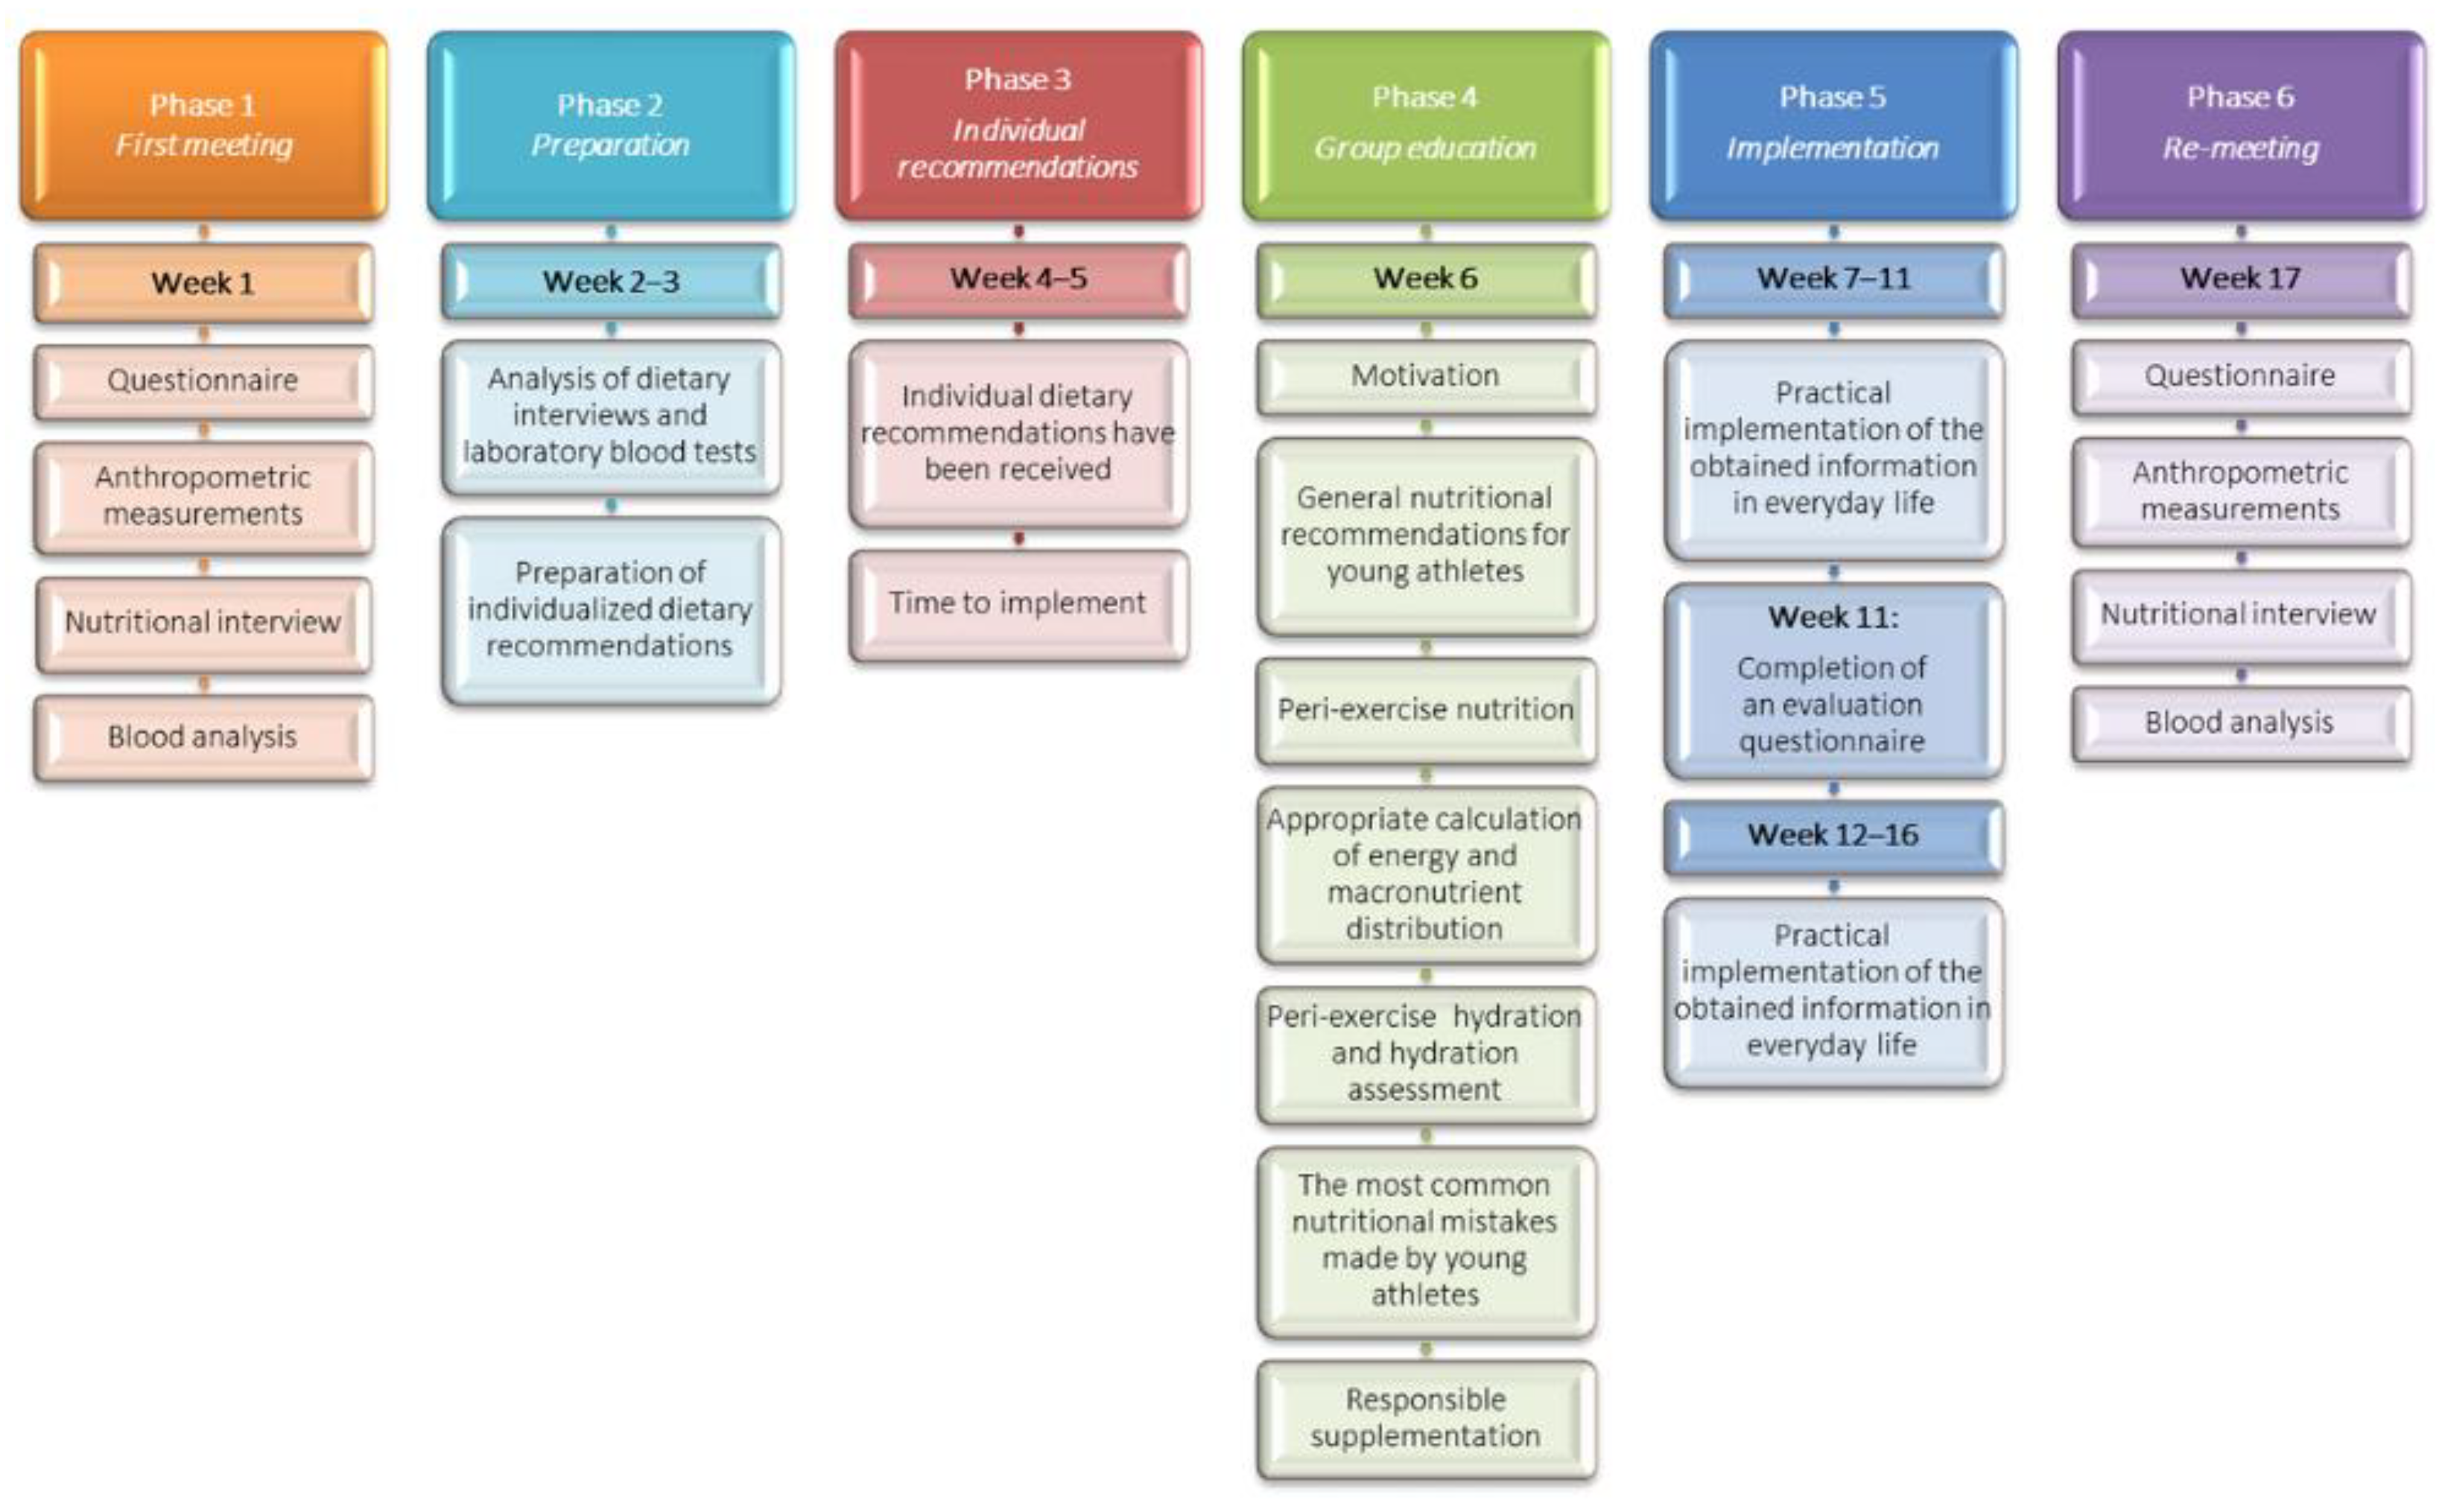
- (1)
- At the first visit, the participants brought a completed questionnaire and a food diary from the previous three days, which they had been requested to fill out. During the examination, anthropometric measurements and blood sampling for laboratory tests were performed.
- (2)
- The provided food diaries were entered into the “Diet 6” program, which contains Polish databases of nutritional values of food products. After evaluation of dietary nutrient intake and laboratory tests, individual nutrition recommendations were developed for each athlete. These included quantitative information on the intake of macro- and micro-nutrients and their richest sources. Detailed guidance was provided on qualitative dietary analysis and dietary mistakes, with instructions on how to correct them.
- (3)
- Respondents were then given 2 weeks to review the individual nutrition recommendations and attempt to implement them.
- (4)
- Afterwards, a group nutritional education workshop was conducted, which included a 7-part program consisting of sections on motivation, nutritional recommendations for young athletes, peri-exercise nutrition and hydration, supplementation, as well as common nutritional mistakes and improper eating habits. In addition, participants were instructed in how to calculate energy requirements and macronutrient distribution in relation to the training period.
- (5)
- The next phase was to implement the learnt principles and proposed changes over the following 10 weeks. In the middle of this phase (week 11), the participants were given a follow-up questionnaire containing the same questions as previously, but with additional inquiries about the changes implemented and about their subjective perceptions.
- (6)
- At week 17, the examination was repeated as in phase 1.
2.3. Nutrition Assessment
2.4. Body Weight and Height Measurements
2.5. Blood Samples Analysis
2.6. Statistical Analysis
3. Results
3.1. Baseline Characteristics of the Study Cohort
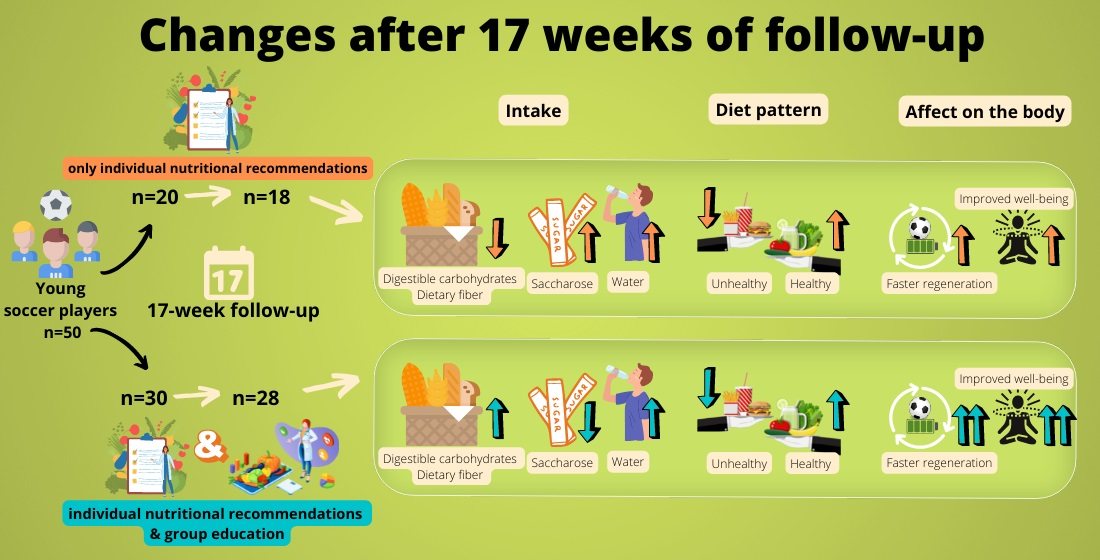
3.2. Results of Nutritional Intervention
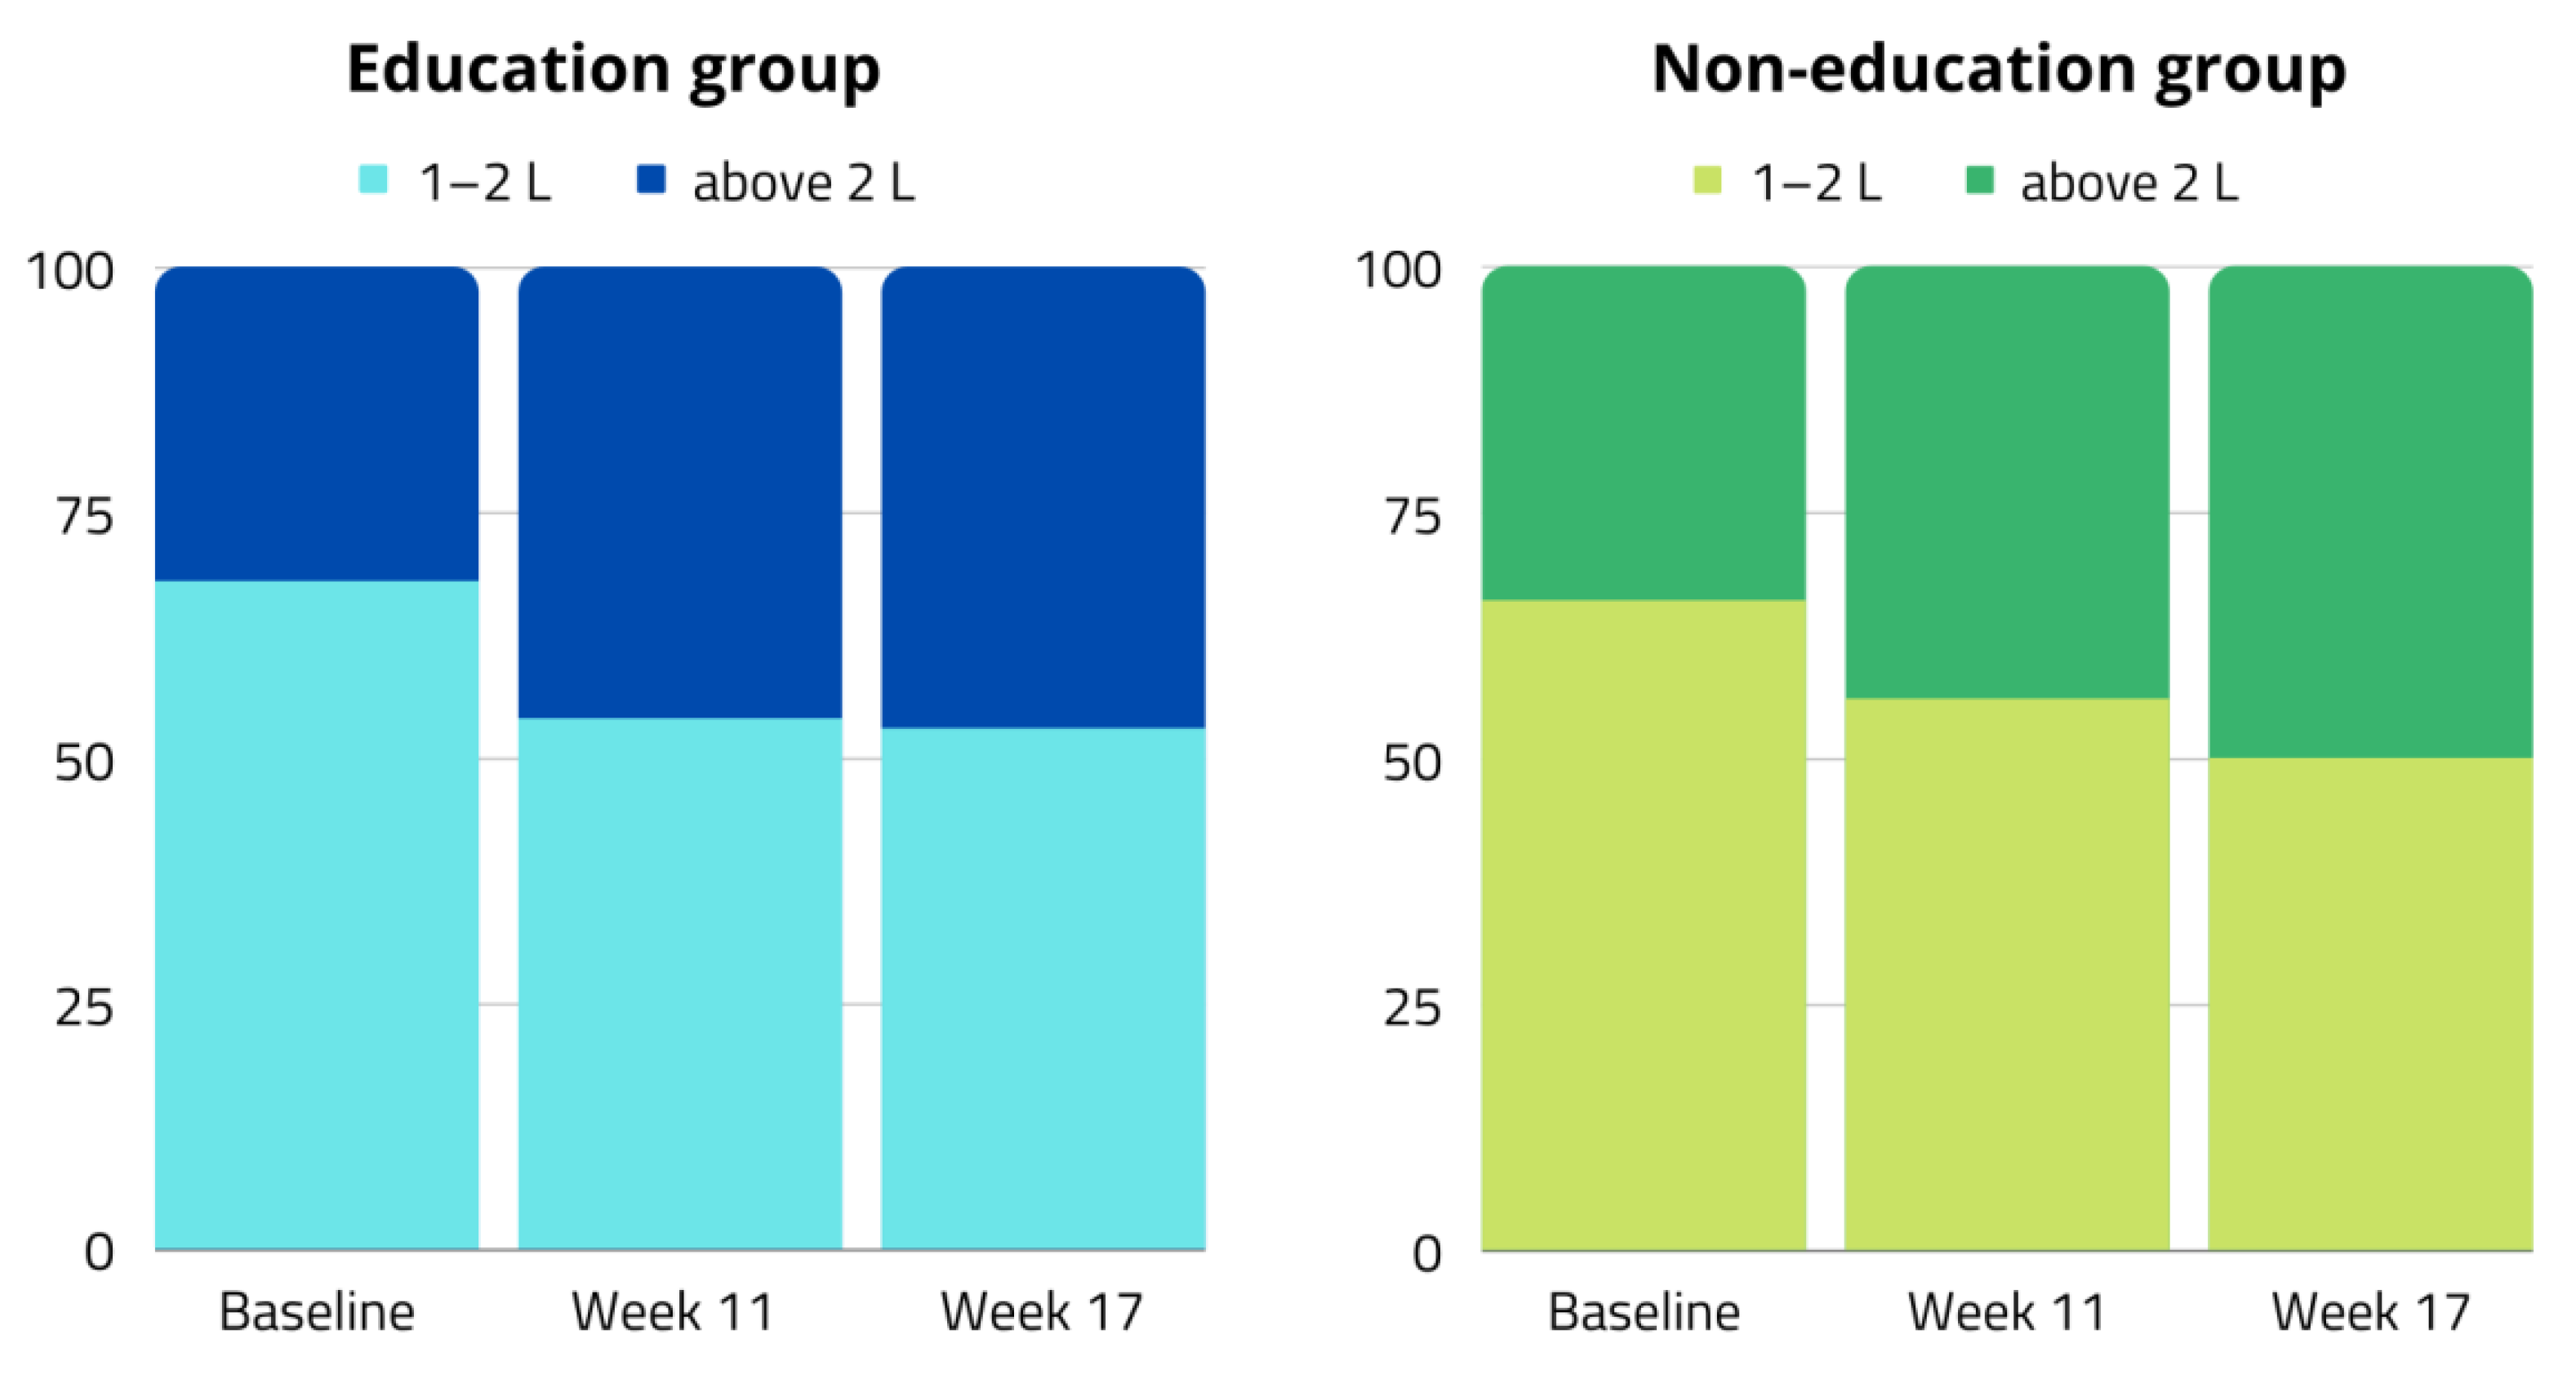
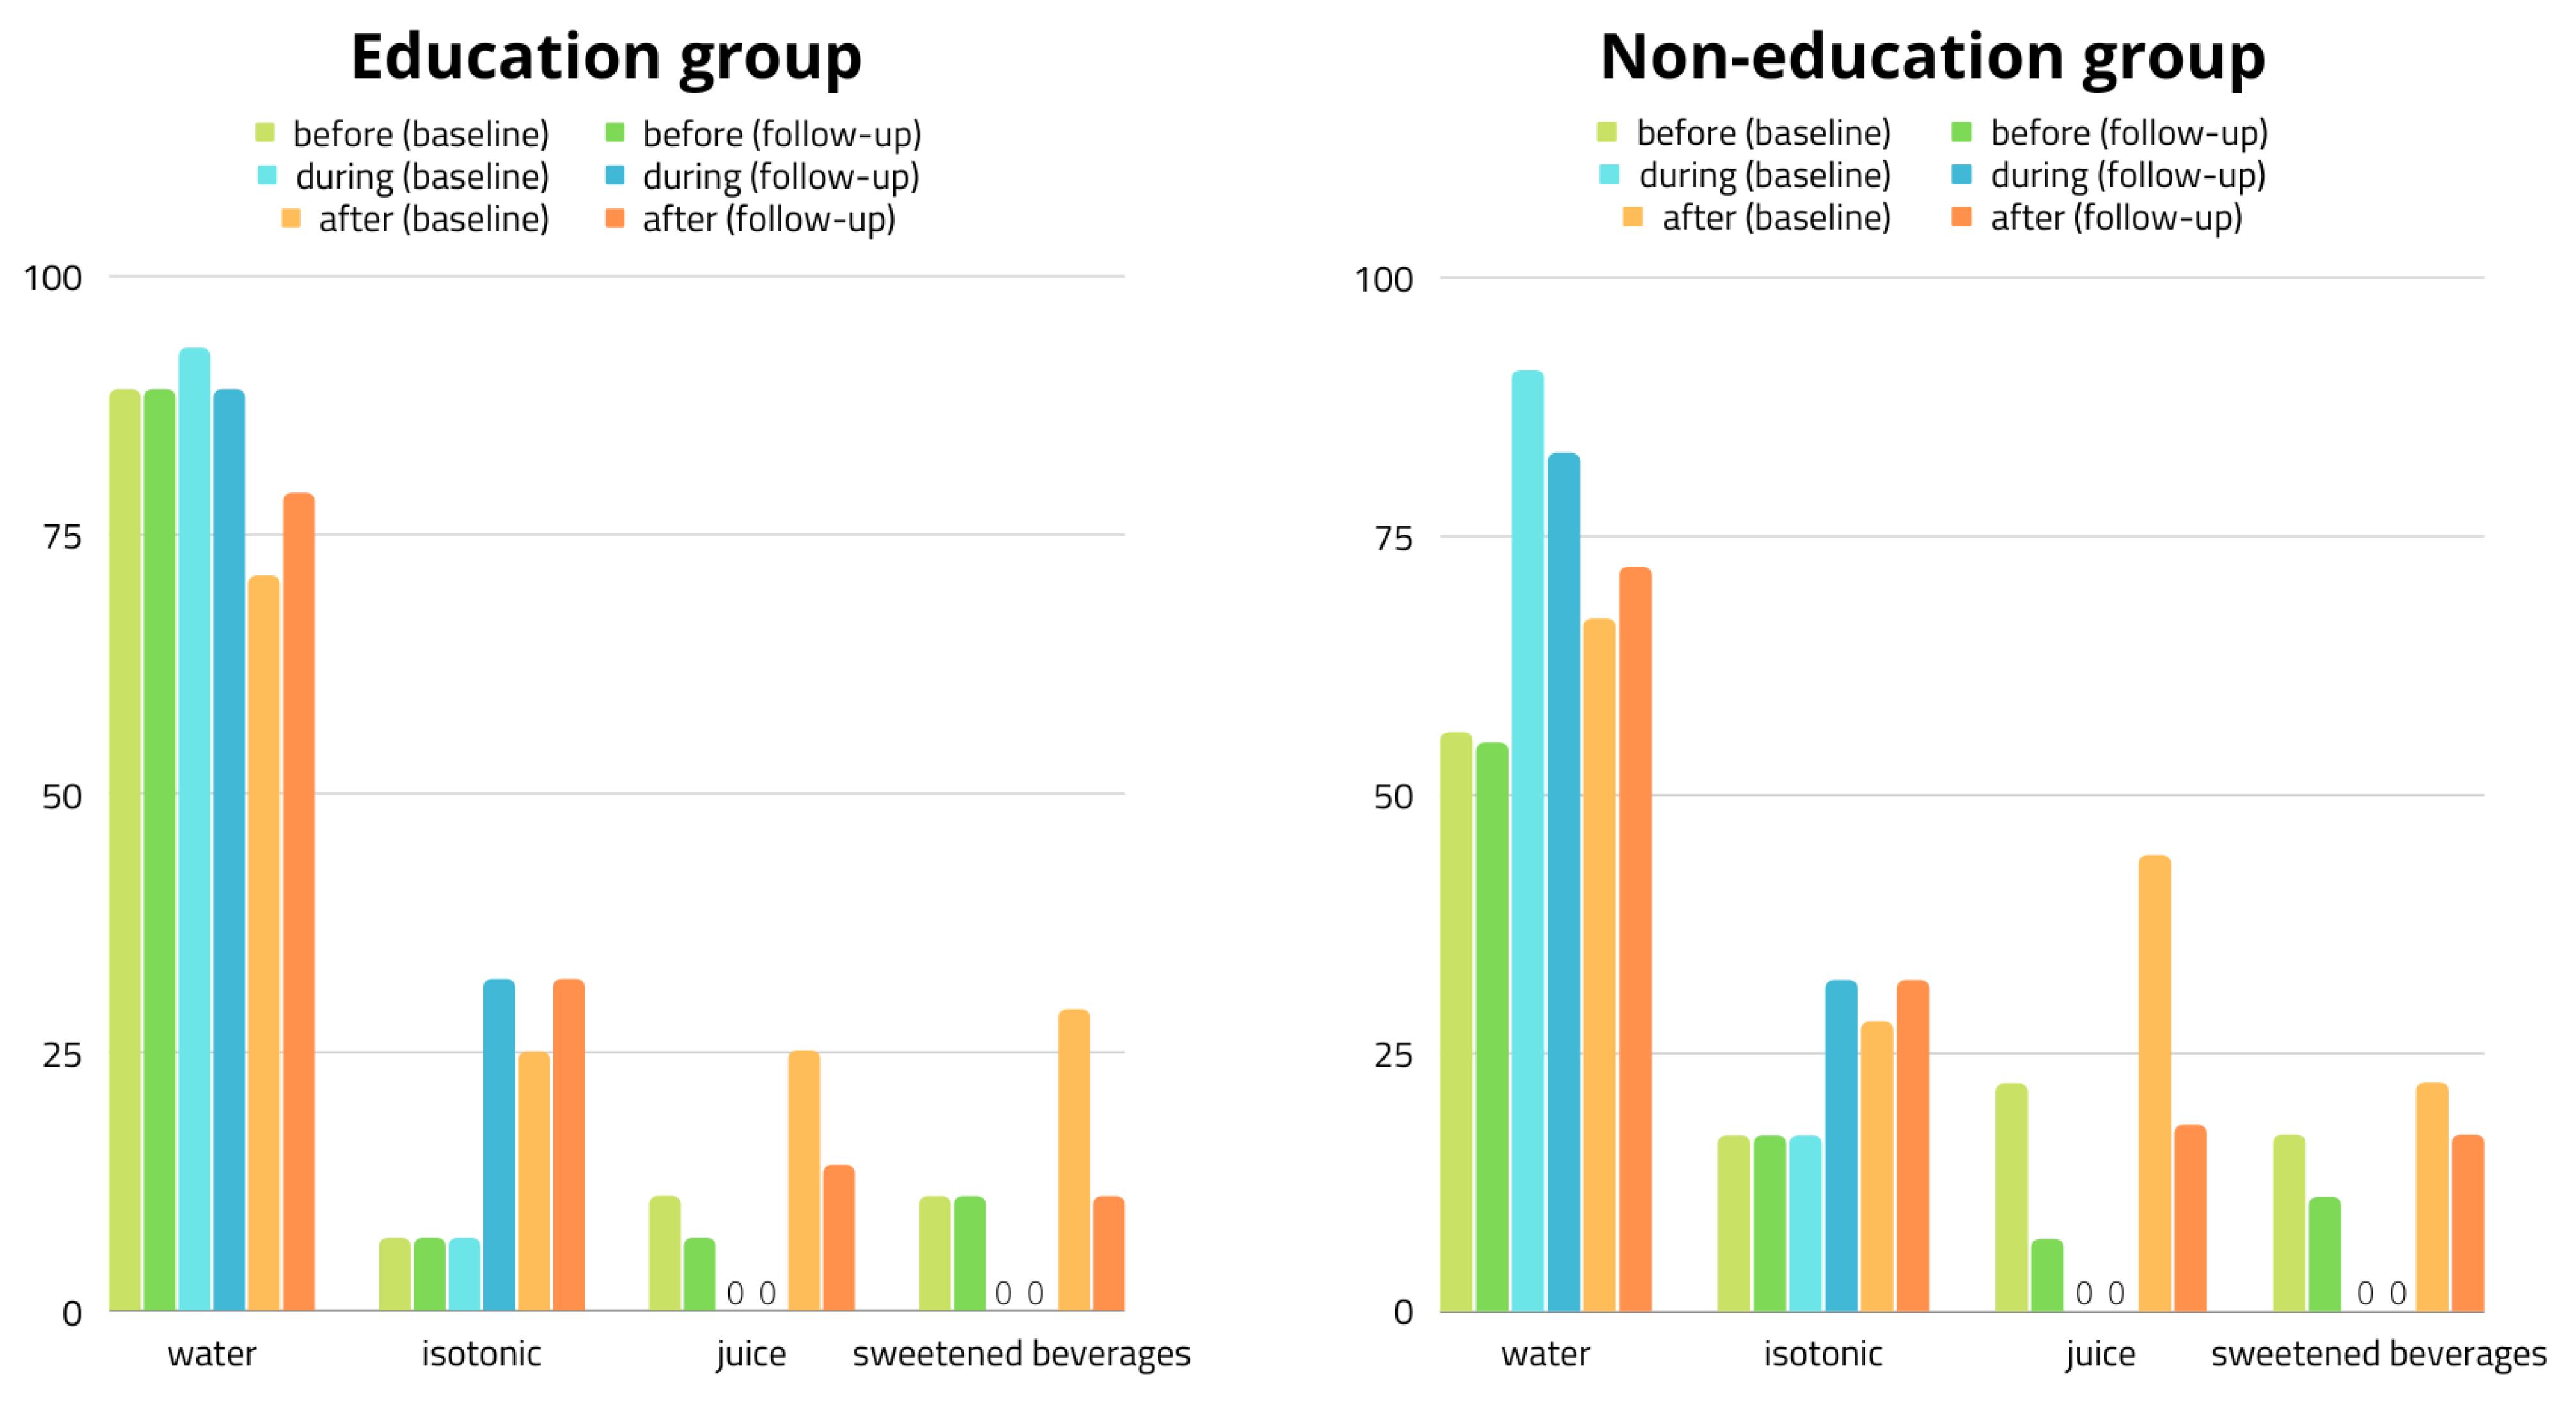
3.3. Hydration Status
3.4. Participants’ Subjective Evaluation of Interventions
4. Discussion
5. Conclusions
Author Contributions
Funding
Institutional Review Board Statement
Informed Consent Statement
Data Availability Statement
Conflicts of Interest
References
- Hoch, A.Z.; Goossen, K.; Kretschmer, T. Nutritional requirements of the child and teenage athlete. Phys. Med. Rehabil. Clin. N. Am. 2008, 19, 373–398. [Google Scholar] [CrossRef] [PubMed]
- Purcell, L.K. Sport nutrition for young athletes. Paediatr. Child. Health 2013, 18, 200–205. [Google Scholar] [CrossRef] [PubMed]
- Das, J.K.; Salam, R.A.; Thornburg, K.L.; Prentice, A.M.; Campisi, S.; Lassi, Z.S.; Koletzko, B.; Bhutta, Z.A. Nutrition in adolescents: Physiology, metabolism, and nutritional needs. Ann. N. Y. Acad. Sci. 2017, 1393, 21–33. [Google Scholar] [CrossRef] [PubMed]
- García-Rovés, P.M.; García-Zapico, P.; Patterson, A.M.; Iglesias-Gutiérrez, E. Nutrient intake and food habits of soccer players: Analyzing the correlates of eating practice. Nutrients 2014, 6, 2697–2717. [Google Scholar] [CrossRef] [PubMed]
- Oliveira, C.C.; Ferreira, D.; Caetano, C.; Granja, D.; Pinto, R.; Mendes, B.; Sousa, M. Nutrition and Supplementation in Soccer. Sports 2017, 5, 28. [Google Scholar] [CrossRef] [PubMed]
- National Research Council and Institute of Medicine. Adolescent Health Services: Missing Opportunities; National Academies Press: Washington, DC, USA, 2009; pp. 1–293. [Google Scholar]
- Meyer, F.; O’Connor, H.; Shirreffs, S.M. Nutrition for the young athlete. J. Sports Sci. 2007, 25 (Suppl. 1), S73–S82. [Google Scholar] [CrossRef] [PubMed]
- Kowalkowska, J.; Wadolowska, L.; Czarnocinska, J.; Czlapka-Matyasik, M.; Galinski, G.; Jezewska-Zychowicz, M.; Bronkowska, M.; Dlugosz, A.; Loboda, D.; Wyka, J. Reproducibility of a Questionnaire for Dietary Habits, Lifestyle and Nutrition Knowledge Assessment (KomPAN) in Polish Adolescents and Adults. Nutrients 2018, 10, 1845. [Google Scholar] [CrossRef] [PubMed]
- Frączek, B.; Gacek, M. Nutrition of children and adolescents engaged in sports. In Sport Dietetics; Frączek, B., Krzywański, J., Krysztofiak, H., Eds.; PZWL Wydawnictwo Lekarskie: Warsaw, Poland, 2022; pp. 597–610. [Google Scholar]
- Jarosz, M.; Rychlik, E.; Stoś, K.; Charzewska, J. Nutrition Standards for the Population of Poland and Their Application. Available online: https://www.pzh.gov.pl/normy-zywienia-2020/ (accessed on 20 January 2021).
- Dembińska-Kieć, A.; Naskalski, J.; Solnica, B. Diagnostyka laboratoryjna z elementami biochemii klinicznej; Edra Urban & Partner: Wrocław, Polska, 2018; pp. 661–706. [Google Scholar]
- Di Salvo, V.; Gregson, W.; Atkinson, G.; Tordoff, P.; Drust, B. Analysis of High Intensity Activity in Premier League Soccer. Int. J. Sports Med. 2009, 30, 205–212. [Google Scholar] [CrossRef] [PubMed]
- Zeng, D.; Fang, Z.L.; Qin, L.; Yu, A.Q.; Ren, Y.B.; Xue, B.Y.; Zhou, X.; Gao, Z.Y.; Ding, M.; An, N.; et al. Evaluation for the effects of nutritional education on Chinese elite male young soccer players: The application of adjusted dietary balance index (DBI). J. Exerc. Sci. Fit. 2020, 18, 1–6. [Google Scholar] [CrossRef] [PubMed]
- Briggs, M.A.; Cockburn, E.; Rumbold, P.L.S.; Rae, G.; Stevenson, E.J.; Russell, M. Assessment of Energy Intake and Energy Expenditure of Male Adolescent Academy-Level Soccer Players during a Competitive Week. Nutrients 2015, 7, 8392–8401. [Google Scholar] [CrossRef] [PubMed]
- Caccialanza, R.; Cameletti, B.; Cavallaro, G. Nutritional intake of young Italian high-level soccer players: Under-reporting is the essential outcome. J. Sports Sci. Med. 2007, 6, 538. [Google Scholar] [PubMed]
- Parnell, J.A.; Wiens, K.; Erdman, K.A. Evaluation of congruence among dietary supplement use and motivation for supplementation in young, Canadian athletes. J. Int. Soc. Sports Nutr. 2015, 12, 49. [Google Scholar] [CrossRef] [PubMed]
- Manore, M.M.; Patton-Lopez, M.M.; Meng, Y.; Wong, S.S. Sport Nutrition Knowledge, Behaviors and Beliefs of High School Soccer Players. Nutrients 2017, 9, 350. [Google Scholar] [CrossRef]
- Kavouras, S.; Arnaoutis, G.; Makrillos, M.; Garagouni, C.; Nikolaou, E.; Chira, O.; Ellinikaki, E.; Sidossis, L. Educational intervention on water intake improves hydration status and enhances exercise performance in athletic youth. Scand. J. Med. Sci. Sports 2012, 22, 684–689. [Google Scholar] [CrossRef] [PubMed]
- Cleary, M.A.; Hetzler, R.K.; Wasson, D.; Wages, J.J.; Stickley, C.; Kimura, I.F. Hydration Behaviors Before and After an Educational and Prescribed Hydration Intervention in Adolescent Athletes. J. Athl. Train. 2012, 47, 273–281. [Google Scholar] [CrossRef] [PubMed]
- McCrink, C.M.; McSorley, E.M.; Grant, K.; McNeilly, A.M.; Magee, P.J. An investigation of dietary intake, nutrition knowledge and hydration status of Gaelic Football players. Eur. J. Nutr. 2021, 60, 1465–1473. [Google Scholar] [CrossRef] [PubMed]
- Fernández-Álvarez, M.M.; Martín-Payo, R.; García-García, R.; Cuesta, M.; Carrasco-Santos, S. A nutrition education intervention in adolescents who play soccer: The IDEHA-F project. Psicothema 2020, 32, 359–365. [Google Scholar] [CrossRef] [PubMed]


| Parameter | Total (n = 46) | Education Group (n = 28) | Non-Education Group (n = 18) |
|---|---|---|---|
| Age (years) | 15 (14–16) | 15 (14–16) | 15 (14–16) |
| Body height (cm) | 175 (170–181) | 177 (168–182) | 177 (174–181) |
| Body weight (kg) | 63 (56–71) | 62 (56–68) | 65 (58–72) |
| Resides | |||
| With parents At school dormitory | 70% 30% | 71% 29% | 75% 25% |
| Place of residence | |||
| Village (<10 k inh.) Small city (10–150 k inh.) Large city (≥150 k inh.) | 15% 20% 65% | 11% 11% 78% | 22% 33% 45% |
| Soccer position | |||
| Goalkeeper Midfielder Striker Defender | 11% 41% 17% 31% | 4% 50% 14% 32% | 22% 28% 22% 28% |
| Parameter | Education Group (n = 28) | Non-Education Group (n = 18) | ||
|---|---|---|---|---|
| Baseline (Week 1) | Follow-Up (Week 17) | Baseline (Week 1) | Follow-Up (Week 17) | |
| Me (Q1–Q3) | ||||
| Energy (kcal) | 2237 (1642–2592) | 2107 (1815–2643) | 2339 (1881–2845) | 2310 (1944–2549) |
| Protein (%TDEE) | 19 (17–21) | 18 (18–22) | 18 (16–20) | 19 (17–22) |
| Protein (g) | 97.6 (84.7–126.5) | 105.0 (93.5–125.6) | 98.8 (87.8–121.1) | 107.5 (81.3–122.3) |
| Protein (g/kg) | 1.7 (1.2–2.0) | 1.7 (1.4–2.1) | 1.5 (1.3–1.9) | 1.6 (1.2–1.8) |
| Animal protein (g) | 71.3 (55.6–84.0) | 70.5 (57.6–87.6) | 65.3 (57.0–76.6) | 68.5 (55.8–78.1) |
| Vegetable protein (g) | 30.5 (22.3–40.3) | 29.6 (23.2–43.0) | 31.8 (27.9–36.2) | 30.1 (24.4–40.8) |
| Fat (%TDEE) | 27.3 (23.4–31.7) | 25.5 (22.5–27.5) | 24.1 (21.0–29.5) | 25.6 (22.7–32.4) |
| Fat (g) | 64.3 (49.0–85.5) | 59.4 (47.8–78.4) | 65.8 (58.8–74.0) | 67.8 (48.6–88.9) |
| Fat (g/kg) | 1.1 (0.8–1.4) | 1.0 (0.9–1.1) | 1.0 (0.8–1.1) | 1.0 (0.8–1.2) |
| Carbohydrates (%TDEE) | 51.8 (48.6–55.2) | 54.2 (49.3–58.3) | 55.3 (51.9–60.3) | 56.3 (50.7–58.1) |
| Carbohydrates (g) | 285 (232–361) | 294 (240–417) | 333 (243–418) | 332 (238–360) |
| Carbohydrates (g/kg) | 5.2 (3.7–6.0) | 4.8 (3.8–5.7) | 5.1 (4.5–5.8) | 4.7 (3.6–5.8) |
| Digestible carbohydrates (g) | 266 (216–338) | 273 (223–387) | 304 (228–383) | 310 (223–334) |
| Saccharose (g) | 44.0 (29.1–70.7) | 39.2 (32.6–60.0) | 61.2 (43.8–79.5) | 67.3 (39.7–83.2) |
| Dietary fiber (g) | 19.7 (15.2–23.8) | 22.2 (14.5–27.5) | 20.7 (16.4–22.5) | 18.1 (14.7–22.9) |
| Diet Type | Feature Intensity | Education Group (n = 28) | Non-Education Group (n = 18) | ||||||||||
|---|---|---|---|---|---|---|---|---|---|---|---|---|---|
| Baseline (Week 1) | 1st Follow-Up (Week 11) | 2nd Follow-Up (Week 17) | Baseline (Week 1) | 1st Follow-Up (Week 11) | 2nd Follow-Up (Week 17) | ||||||||
| Me (Q1–Q3) | % | Me (Q1–Q3) | % | Me (Q1–Q3) | % | Me (Q1–Q3) | % | Me (Q1–Q3) | % | Me (Q1–Q3) | % | ||
| Healthy | Low | 27 (19–38) | 61 | 33 (20–36) | 54 | 30 ‡ (20–38) | 54 | 29 (19–37) | 72 | 30 (20–40) | 50 | 39 ‡ (24–50) | 33 |
| Moderate | 39 | 46 | 46 | 28 | 50 | 67 | |||||||
| Unhealthy | Low | 15 * (13–21) | 96 | 18 * (12–21) | 100 | 13 *‡ (11–17) | 100 | 16 (15–26) | 89 | 17 (10–24) | 89 | 19 ‡ (16–24) | 94 |
| Moderate | 4 | 0 | 0 | 11 | 11 | 6 | |||||||
| Parameter | Baseline (Week 1) | Follow-Up (Week 17) | ||||||
|---|---|---|---|---|---|---|---|---|
| Me (Q1–Q3) | Percentage of Respondents (%) | Me (Q1–Q3) | Percentage of Respondents (%) | |||||
| Below Norm | Norm | Above Norm | Below Norm | Norm | Above Norm | |||
| Dietary intake | ||||||||
|
Sodium (mg) Potassium (mg) | 3513 (2629–4218) | - | 22 | 44 & 34 | 3996 (2852–4639) | - | 2 | 50 & 48 |
| 3192 (2415–3854) | 39 | 52 | 9 | 3389 (2788–3981) | 33 | 54 | 13 | |
| Calcium (mg) | 880 (610–1196) | 85 | 15 | - | 929 (670–1247) | 59 | 41 | - |
| Phosphorus (mg) | 1581 (1269–1965) | 17 | 37 | 46 | 1600 (1253–1884) | 11 | 50 | 39 |
|
Calcium: Phosphorus | 0.57 (0.47–0.64) | 98 | 2 | - | 0.63 (0.48–0.73) | 96 | 4 | - |
| Blood laboratory test results | ||||||||
| Sodium (mmol/L) | 141 (140–142) | - | 100 | - | 141 (140–141) | - | 100 | - |
| Potassium (mmol/L) | 5 (4–5) | - | 61 | 39 | 4 (4–5) | - | 70 | 30 |
| Chlorides (mmol/L) | 102 (101–103) | - | 100 | - | 103 (102–104) | - | 100 | - |
| Glucose (mg/dL) | 98 (94–103) | - | 59 | 41 | 90 (84–95) | - | 85 | 15 |
| Urea (mg/dL) | 31 (25–36) | - | 91 | 9 | 33 (29–37) | - | 85 | 15 |
| Creatinine (mg/dL) | 1.0 (0.9–1.1) | - | 83 | 17 | 1.1 (1.0–1.2) | - | 70 | 30 |
| Osmolality (mOsm/kg H2O) | 299 (297–301) | - | 100 | - | 296 (294–298) | - | 100 | - |
| Effective osmolality (mOsm/kg H2O) | 294 (292–296) | - | 100 | - | 290 (289–292) | - | 100 | - |
| Osmolal gap | 5 (4–6) | - | 100 | - | 5 (5–6) | - | 100 | - |
Publisher’s Note: MDPI stays neutral with regard to jurisdictional claims in published maps and institutional affiliations. |
© 2022 by the authors. Licensee MDPI, Basel, Switzerland. This article is an open access article distributed under the terms and conditions of the Creative Commons Attribution (CC BY) license (https://creativecommons.org/licenses/by/4.0/).
Share and Cite
Grabia, M.; Markiewicz-Żukowska, R.; Bielecka, J.; Puścion-Jakubik, A.; Socha, K. Effects of Dietary Intervention and Education on Selected Biochemical Parameters and Nutritional Habits of Young Soccer Players. Nutrients 2022, 14, 3681. https://doi.org/10.3390/nu14183681
Grabia M, Markiewicz-Żukowska R, Bielecka J, Puścion-Jakubik A, Socha K. Effects of Dietary Intervention and Education on Selected Biochemical Parameters and Nutritional Habits of Young Soccer Players. Nutrients. 2022; 14(18):3681. https://doi.org/10.3390/nu14183681
Chicago/Turabian StyleGrabia, Monika, Renata Markiewicz-Żukowska, Joanna Bielecka, Anna Puścion-Jakubik, and Katarzyna Socha. 2022. "Effects of Dietary Intervention and Education on Selected Biochemical Parameters and Nutritional Habits of Young Soccer Players" Nutrients 14, no. 18: 3681. https://doi.org/10.3390/nu14183681