Article

Associations between Consumption of Dietary Fibers and the Risk of Type 2 Diabetes, Hypertension, Obesity, Cardiovascular Diseases, and Mortality in Chinese Adults: Longitudinal Analyses from the China Health and Nutrition Survey

1
Center for Clinical Evidence-Based and Translational Medicine, Xiangyang Central Hospital, Affiliated Hospital of Hubei University of Arts and Science, Xiangyang 441021, China
2
Department of Endocrinology, Daxing Hospital, Xi’an 710000, China
3
School of Public Health, Tongji Medical College, Huazhong University of Science and Technology, Wuhan 430000, China
4
College of Medicine, Wuhan University of Science and Technology, Wuhan 430065, China
5
Department of Endocrinology, Xiangyang Central Hospital, Affiliated Hospital of Hubei University of Arts and Science, Xiangyang 441021, China
*
Authors to whom correspondence should be addressed.
These authors contributed equally to this work.
Nutrients 2022, 14(13), 2650; https://doi.org/10.3390/nu14132650
Submission received: 29 May 2022 / Revised: 21 June 2022 / Accepted: 23 June 2022 / Published: 27 June 2022
(This article belongs to the Special Issue Dietary Patterns and Nutritional Value in Non-communicable Diseases)

Abstract

:
Although many studies have explored the relationship between total dietary fiber intake and the risk of chronic non-communicable diseases, the results are mixed. There is also a lack of research on the association between dietary fiber intake from different food sources and disease. Using data from the China Nutrition and Health Database from 2004 to 2015, Cox proportional risk models were used to explore the associations between total dietary fiber and fiber intake from different food sources and the occurrence of type 2 diabetes, hypertension, obesity, cardiovascular disease, and all-cause mortality. After multi-factorial adjustment, the hazard ratios (95% confidence interval) of total dietary fiber intake (quartile 4 vs. quartile 1) in type 2 diabetes, hypertension, obesity, cardiovascular disease, and all-cause mortality cohorts were 1.20 (0.93, 1.55), 0.91 (0.75, 1.12), 0.93 (0.64, 1.35), 1.13 (0.60, 2.12), 1.13 (0.60, 2.12), and 1.13 (0.84, 1.52). Whole-grain fiber intake was positively associated with hypertension but not with the occurrence of other diseases. No association was observed between legume fibers, fruit fibers, and vegetable fibers in the cohorts of type 2 diabetes, hypertension, obesity, cardiovascular diseases and all-cause mortality. Our study did not find any association between total dietary fiber and dietary fiber intake from different food sources and type 2 diabetes, obesity, cardiovascular disease, and all-cause mortality in the Chinese population. The role of dietary fiber in the Chinese population may be overestimated. More extraordinary efforts are needed to further confirm the association between dietary fiber and these diseases in the Chinese population.

1. Introduction

Chronic non-communicable diseases such as diabetes, hypertension, obesity, and cardiovascular disease (CVD) have high incidence and mortality rates worldwide, with type 2 diabetes (T2D) and cardiovascular disease accounting for 11.3% and 30% of total deaths worldwide, respectively [1,2]. The incidence of adult obesity is about 20% [3]. More than 1.39 billion people suffer from hypertension [4], and the public health risks caused by these diseases should not be disregarded.
Many experts have focused their research on preventing the onset of chronic diseases. Dietary fiber consumption has been linked to the prevention of various chronic diseases [5,6,7,8,9]. Dietary fiber is a type of nutrient that is difficult to digest and absorb in the small intestine, and it has several potential mechanisms for preventing chronic diseases, including (1) increasing satiety and possibly promoting weight loss; (2) encouraging intestinal microorganisms to produce short-chain fatty acids with immunomodulatory and anti-inflammatory properties; and (3) experiments in animal models have shown that dietary fiber intake is associated with lower levels of inflammatory and oxidative stress markers [10,11,12]. However, with the continuous refinement and classification of the concept of dietary fiber, studies have found that dietary fiber from different food sources is not all negatively associated with the development of disease [5,7,8,13].
Although more studies have explored the relationship between total dietary fiber intake and the risk of T2D, hypertension, obesity, cardiovascular disease, and all-cause mortality, the results are mixed [5,6,8,14,15,16,17,18]. There is a lack of research on the association between dietary fiber intake from different food sources and disease, especially hypertension, and only a few studies focus on all-cause mortality [9,13,14]. Furthermore, while T2D and cardiovascular disease research are becoming more common, the results from studies of fiber from various dietary sources are also inconsistent [5,7,13]. More importantly, no research has examined the association between dietary fiber intake from various food sources and chronic disease in the Chinese population. Therefore, considering the heterogeneity found in the total dietary fiber intake and dietary fiber intake from different food sources in different populations and its effects on the health statuses, these associations may require further analysis in Chinese populations that traditionally consume diets rich in plant foods.
This study aimed to determine the association between fiber consumption from various dietary sources and T2D, hypertension, obesity, cardiovascular disease, and all-cause mortality in the Chinese population.

2. Materials and Methods

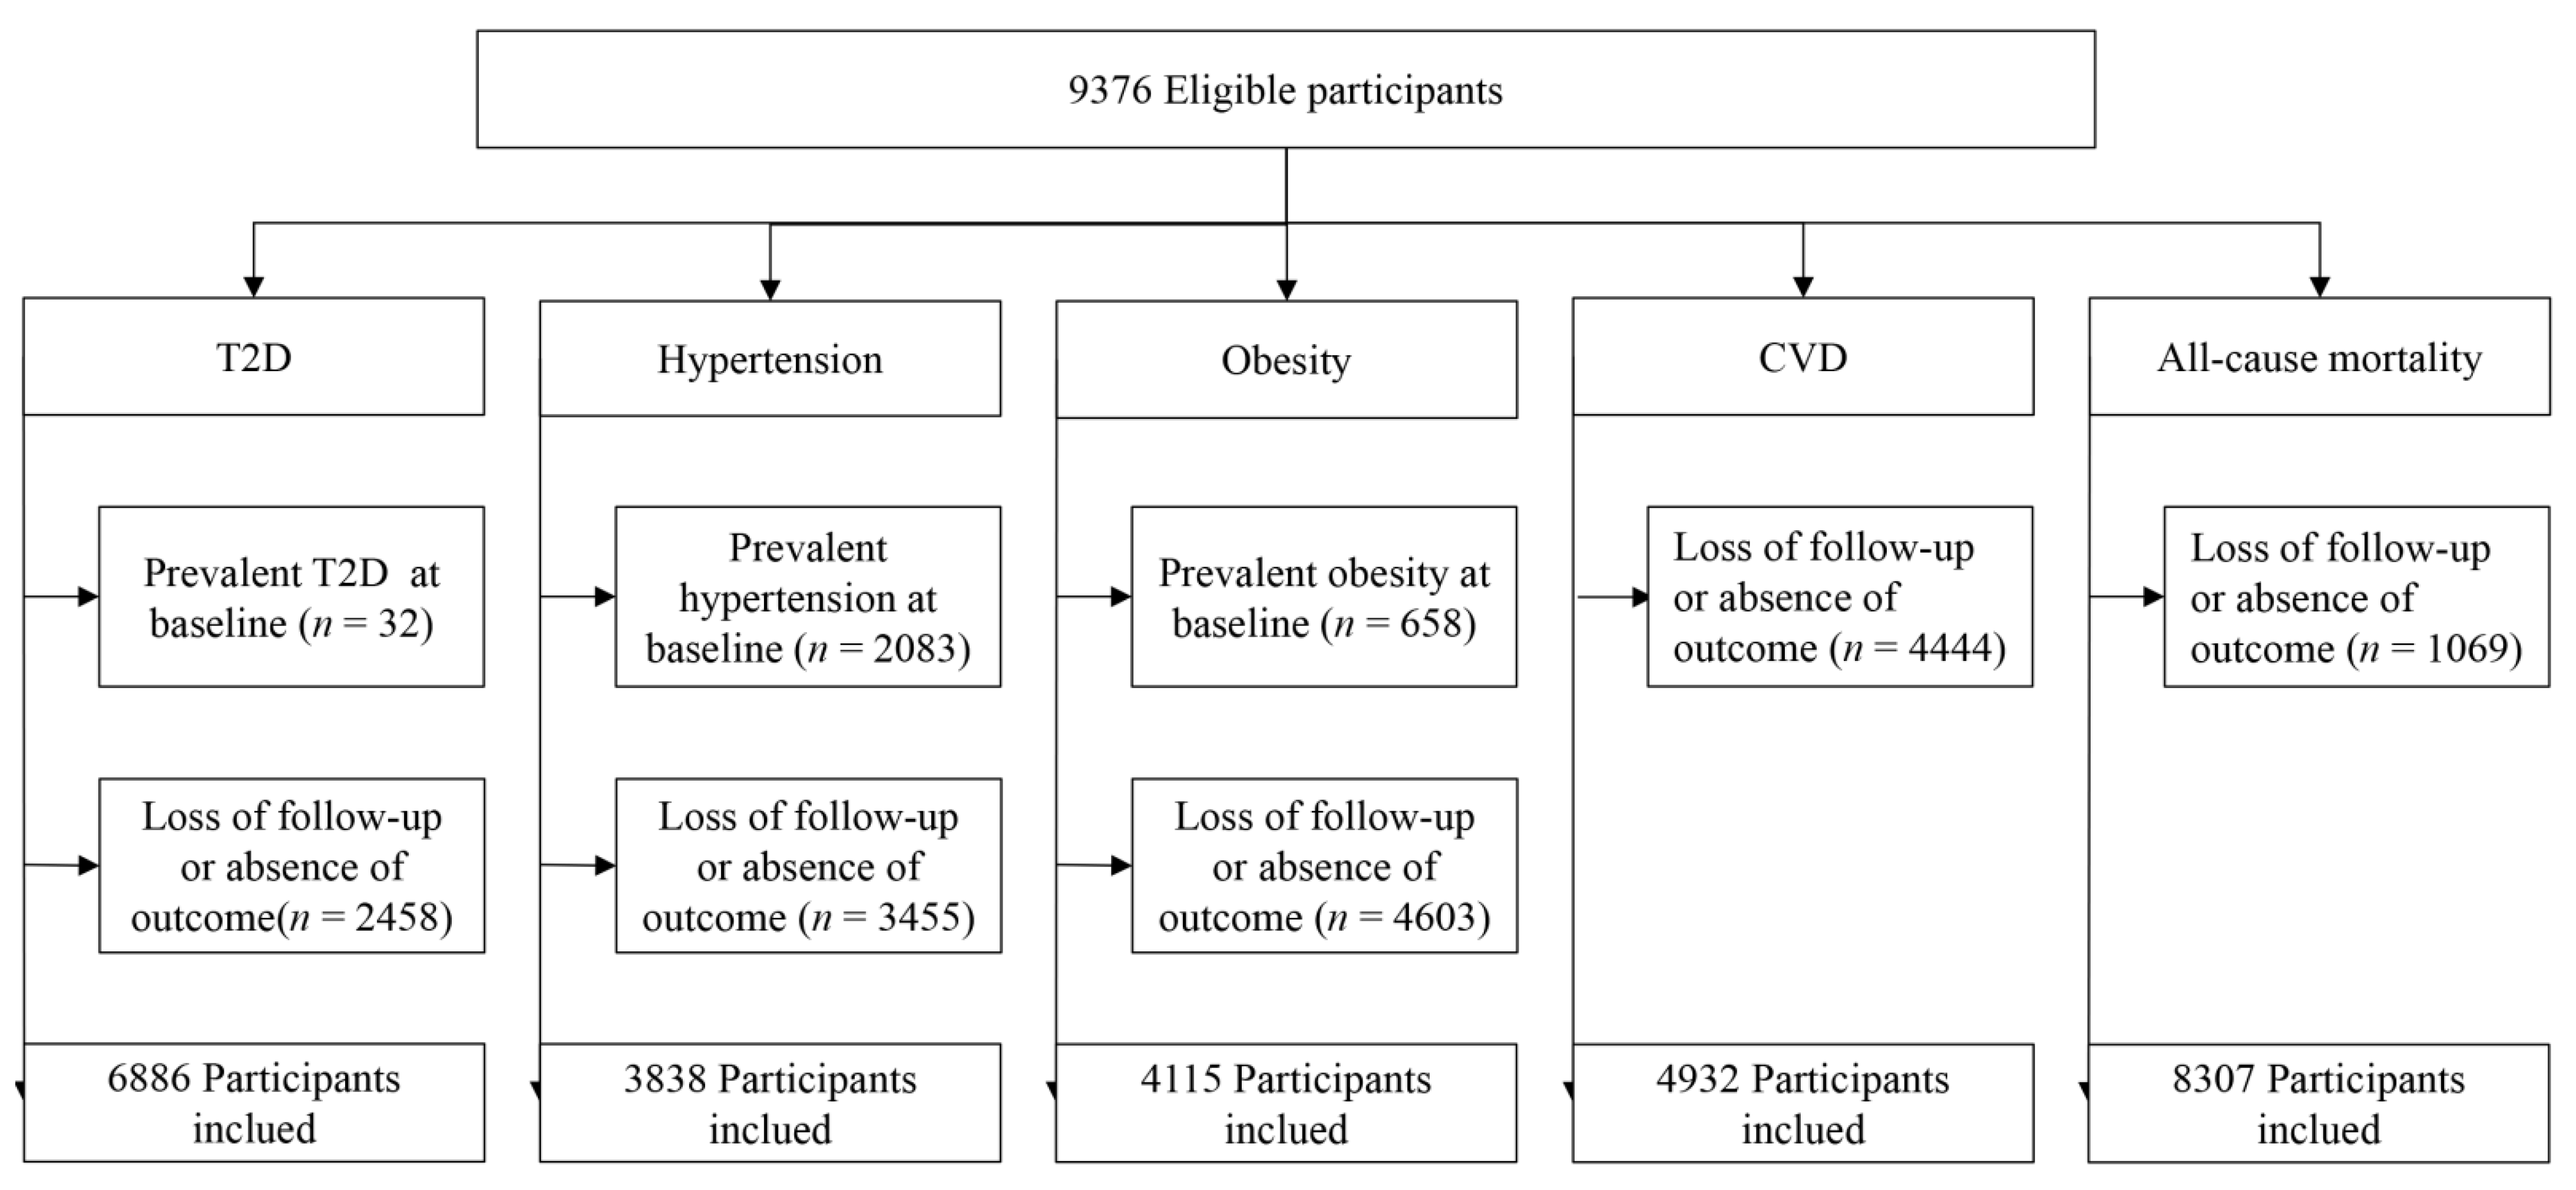
2.1. Study Design and Participants

Data from the China Nutrition and Health Database (CHNS) were used in this study, a multi-purpose longitudinal open cohort study that began in 1989 and was followed up in 1991, 1993, 1997, 2000, 2004, 2006, 2009, 2011, and 2015. CHNS used a multi-stage stratified whole-group random sampling strategy to sample people from 15 provinces with different populations, geography, economy and public resources in the eastern, central and western regions of China. Demographic, socioeconomic, lifestyle, dietary, and health data is collected during each survey wave. Blood samples were collected and analyzed during the 2009 CHNS. The scientific rationale and design of the CHNS were previously reported [19,20]. The survey was conducted according to the guidelines of the Declaration of Helsinki and was approved by the Institutional Review Committees of the University of North Carolina at Chapel Hill (UNC-CH) and the National Institute for Nutrition and Health, Chinese Center for Disease Control and Prevention; each participant provided informed consent.
Because new food codes were implemented in 2004, CHNS data from 2004 to 2015 were used in this analysis. We first excluded participants who were under 18 years old at baseline, participants with abnormal dietary energy data (e.g., a daily energy intake <800 kcal or >4200 kcal for men and <600 kcal or >3500 kcal for women), and participants with a history of cardiovascular disease, cancer, death, or pregnancy at baseline. The initial wave of these surveys served as a baseline. Finally, the final analysis comprised a total of 9376 participants.

2.2. Dietary Assessment

Details on dietary measures are available elsewhere [21]. In brief, at the time of the baseline (2004 or 2006) survey, qualified investigators obtained individual dietary data through face-to-face interviews in each survey round. Individual diets were evaluated several times by recalling the food consumed by individuals during three 24-hour periods. Participants were asked to list all foods and beverages consumed during 24 h, with the types and amounts of items documented based on food models and images, supported by standard sizes (household containers, grams indicated on the packaging). Three consecutive days (2 weekdays and 1 weekend day) were assigned at random during the week, and each sampling unit was nearly balanced across the seven days of the week. The Chinese Food Composition Table (2004 edition) was used to compute dietary component intakes (energy, protein, fat, carbohydrate, dietary fiber), and food groups such as cereals, legumes, vegetables, and fruits were also categorized using the Chinese Food Composition Table. This study did not cover supplement consumption.
To ensure the stability of the dietary data, we used average year data for 2004 and 2006 as the baseline dietary assessment. When participants participated in only one of the survey years, the current year’s dietary intake could be utilized as the baseline assessment. This research method can also be seen in other articles [13,22].

2.3. Measurement

Questionnaires were used to collect demographics and lifestyle information, such as age, gender, cigarette and alcohol use, education, physical activity, place of residence, and area. Physical activity was estimated as the duration of total physical activity and reported as the metabolic equivalent task (MET)-minutes/week. Height and weight were assessed using conventional protocols and calibrated equipment by certified medical practitioners. Body mass index (BMI) was calculated as weight (kg)/squared height (m2). Professional researchers estimated blood pressure as the mean of three independent measurements.

2.4. Case Ascertainment

T2D. A questionnaire-based interview was used to establish diabetes status at each follow-up appointment. Blood samples were also taken and examined in 2009. T2D was characterized as meeting at least one of the following criteria in the 2009 study, according to the American Diabetes Association diagnostic criteria: (1) fasting blood glucose concentration ≥ 7.0 mmol/L (126 mg/dL); (2) HbA1c ≥ 6.5%; (3) self-reported T2D diagnosis or use of hypoglycemic medicine. T2D was defined as self-reported diabetes or use of hypoglycemic medication in 2015. Previous research demonstrated that self-reported diabetes is a relatively useful approach for determining the diabetes status of Chinese study participants [23].
Hypertension. At 10 min of rest, a standard mercury sphygmomanometer was used to monitor diastolic and systolic blood pressures on subjects’ left or right arms, and the mean readings were measured three times and recorded. Hypertension was defined as (1) a systolic blood pressure ≥140 mm Hg; (2) a diastolic blood pressure ≥90 mm Hg; or (3) self-reporting of a diagnosis of hypertension or currently on oral anti-hypertensive medication during follow-up.
Obesity. Each participant’s weight and height were measured by a trained health worker. BMI ≥ 28.0 kg/m2 was considered obese according to the Expert Consensus on Weight Management Process for Overweight or Obese People (2021).
Cardiovascular disease. Myocardial infarction or stroke was used to characterize the cardiovascular disease. The following questions were used to determine myocardial infarction and stroke information: “Has your doctor ever told you that you have a myocardial infarction?”. “Have you been diagnosed with stroke by your doctor?” cardiovascular disease was defined as answering yes to any of these questions.
All-cause mortality. The census confirmed participants’ death status based on information submitted in each survey wave and the household system. The year of death was recorded if the participant died.

2.5. Statistical Analysis

Descriptive analyses were reported as the mean ± standard deviation (SD) or median (interquartile range) for continuous variables and frequency (percentage) for categorical variables. ANOVA, Kruskal–Wallis test or chi-square test showed statistical differences between quartiles.
We used Cox proportional risk models to assess the association between total dietary fiber and fiber intake from different food sources and the occurrence of type 2 diabetes, hypertension, obesity, cardiovascular disease, and all-cause mortality. The time indicator was the follow-up time from 2004 to the disease onset or cut-off date. To test for potential nonlinear associations, we tested for linear trends using the median score per quantile. All statistical tests were two-sided and performed using SAS 9.4 (SAS Institute, Cary, NC, USA). p < 0.05 was considered statistically significant.

3. Results

3.1. Description of the Study Population

For each particular disease, 9376 participants were eligible; the baseline data excluded cases with existing disease and cases with lost follow-up or missing outcomes, as shown in Figure 1. A total of 6886 cases in the T2D cohort, 3838 cases in the hypertension cohort, 4115 cases in the obesity cohort, 4932 cases in the cardiovascular disease cohort, and 8307 cases in the all-cause mortality cohort were finally included. The T2D cohort of participants was divided into quartiles based on dietary fiber intake, and their baseline characteristics are shown in Table 1. Notably, only 25% of participants had a daily dietary fiber intake of more than 13.5 g/day, which is well below the 25–30 g/day recommended in the Chinese Dietary Guidelines 2022 [24]. Baseline characteristics of hypertension, obesity, cardiovascular disease, and all-cause mortality cohorts are shown in Tables S1–S4 in the Supplementary Materials.

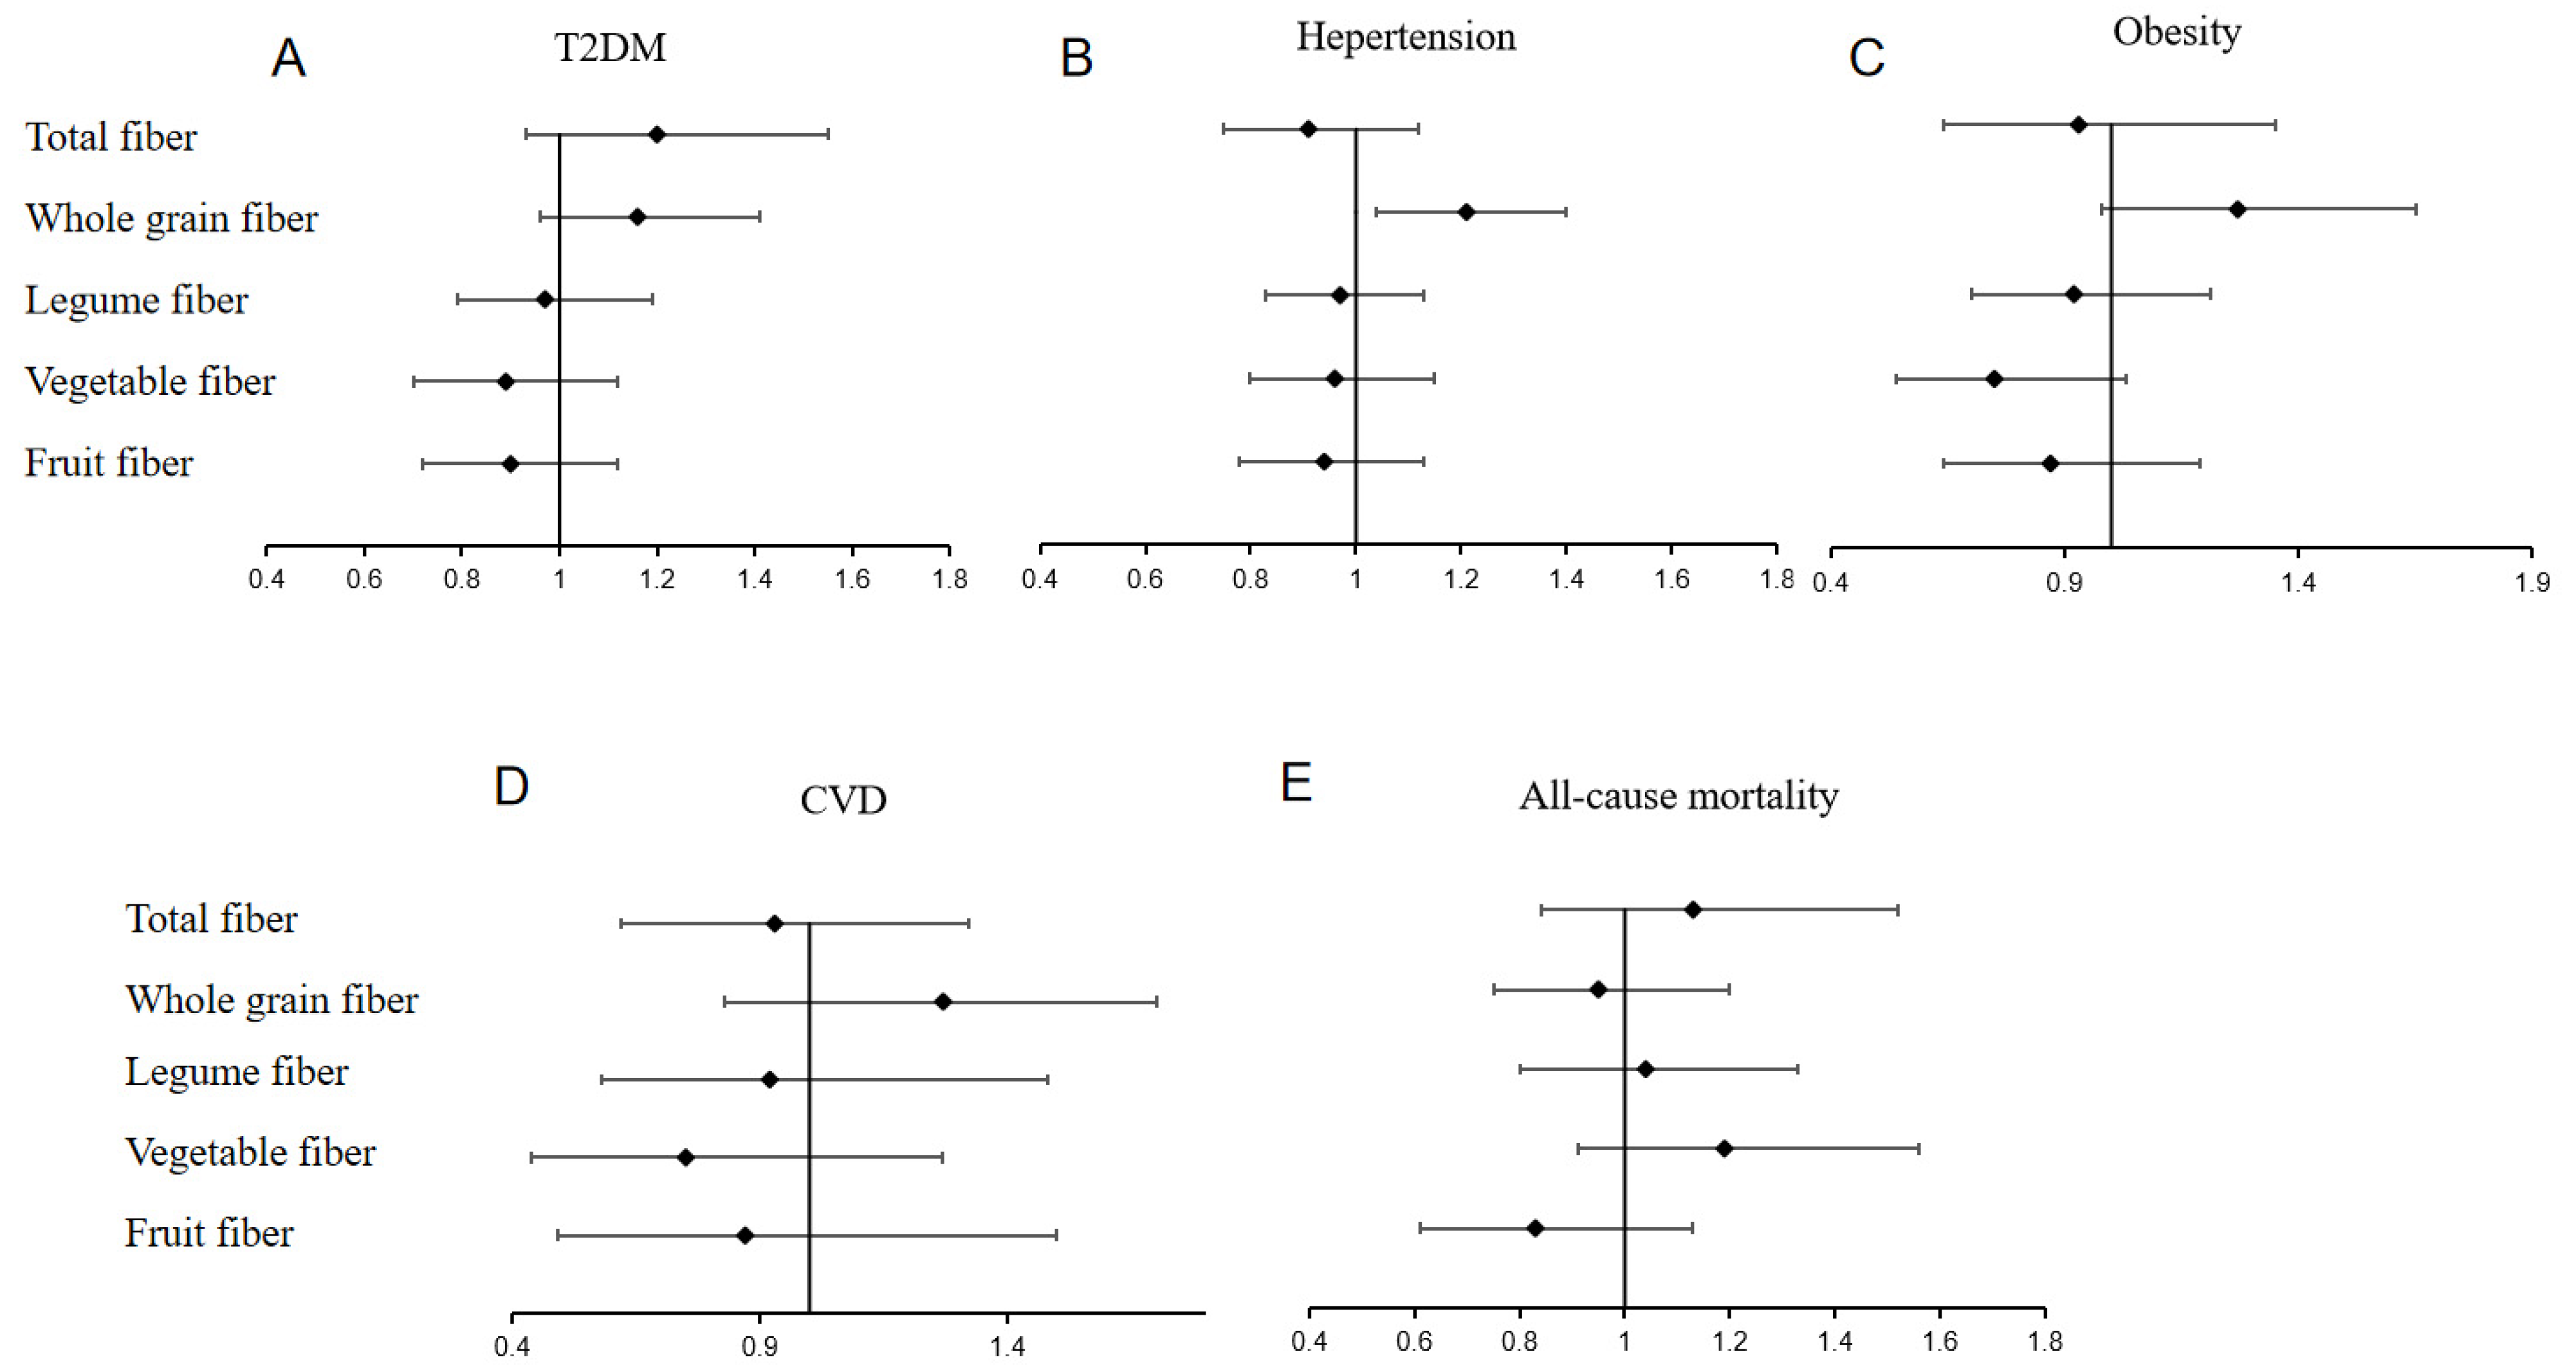
3.2. Associations between Total Dietary Fiber Intake and T2D, Hypertension, Obesity, CVD, and All-Cause Mortality

Among the 6886 participants with T2D followed up, 650 cases developed T2D, and the incidence density (1000 person-years) of T2D by quartiles of total dietary fiber intake was 7.81, 9.28, 9.38, and 9.61 from quartile 1 (Q1) to quartile 4 (Q4), respectively, with a hazard ratio (HR)Q4 vs. Q1 and 95% confidence interval (95% CI) of 1.22 (0.97, 1.53), p > 0.05. Among the 3838 participants with hypertension at follow-up, a total of 1178 developed hypertension, and the incidence density (1000 person-years) of hypertension by quartiles of total dietary fiber intake was 29.21, 29.35, 28.78, and 28.81 for Q1–Q4. HRQ4 vs. Q1 was 0.99 (0.84, 1.17), p > 0.05. In the follow-up cohort of 4115 cases with obesity, 379 cases developed obesity, and the incidence density (1000 person-years) of obesity in Q1–Q4 was 7.43, 8.67, 9.01, and 9.23, and HRQ4 vs. Q1 was 1.11 (95% CI: 0.82, 1.50), p > 0.05. In the follow-up cohort of 4932 cases with cardiovascular disease cohort, a total of 127 cases developed cardiovascular disease, and the incidence density (1000 person-years) of cardiovascular disease in Q1–Q4 was 1.79, 2.47, 2.48, and 2.23, respectively; HRQ4 vs. Q1 was 1.25 (95% CI: 0.73, 2.15), p > 0.05. In the followed-up cohort of 8307 all-cause deaths, a total of 468 cases of mortality occurred, and the incidence density (1000 person-years) of mortality from Q1–Q4, it was 6.16, 4.68, 4.45, and 5.72, respectively, with an HRQ4 vs. Q1 of 0.93 (95% CI: 0.73, 1.18), p > 0.05.
After multi-factorial adjustment, HRQ4 vs. Q1 was 1.20 (95% CI: 0.93,1.55), 0.91 (95% CI: 0.75, 1.12), 0.93 (95% CI: 0.64, 1.35), 1.13 (95% CI: 0.60, 2.12), and 1.13 (95%CI: 0.84, 1.52) in the cohorts with diabetes, hypertension, obesity, cardiovascular disease, and all-cause mortality, respectively; p-trend > 0.05 (see Table 2, Figure 2).

3.3. Associations between Whole-Grain Fiber Intake and T2D, Hypertension, Obesity, CVD, and All-Cause Mortality

The whole-grain fiber intake was divided into terciles (T1–T3). In the cohort of T2D, hypertension, obesity, CVD and all-cause mortality, the HRT3 vs. T1 were 1.31 (95% CI: 1.09, 1.57), 1.29 (95% CI: 1.13, 1.47), 1.62 (95% CI: 1.28, 2.05), 1.43 (95% CI: 0.97, 2.12), and 0.87 (95% CI: 0.69, 1.08), p > 0.05. With the addition of fruit fiber, vegetable fiber, and legume fiber on the basis of the adjustment for multiple factors of total dietary fiber, HRT3 vs. T1 in the cohorts of T2D, hypertension, obesity, CVD, and all-cause mortality were 1.16 (95% CI: 0.96, 1.41), 1.21 (95% CI: 1.04, 1.40), 1.27 (95% CI: 0.98, 1.65), 1.29 (95% CI: 0.85, 1.96), and 0.95 (95% CI: 0.75, 1.20), p > 0.05 (Table 3, Figure 2). The results show that whole-grain fiber is positively associated with the incidence of T2D, hypertension, and obesity in the unadjusted model and not with the incidence of cardiovascular disease and all-cause mortality. After multi-factorial adjustment, whole-grain fiber intake was positively associated with hypertension but not with the onset of other diseases.

3.4. Associations between Legume Fiber Intake and T2D, Hypertension, Obesity, CVD, and All-Cause Mortality

In the terciles of legume fiber intake, The HRT3 vs. T1 in the cohorts of T2D, hypertension, obesity, CVD, and all-cause mortality were 1.12 (95% CI: 0.93, 1.33), 1.07 (95% CI: 0.94, 1.22), 1.06 (95%CI: 0.84, 1.33), 1.06 (95%CI: 0.70, 1.60), and 0.86 (95%CI: 0.69, 1.07), p > 0.05. After adding fruit fiber, vegetable fiber, and whole-grain fiber to adjust for the multiple factors of total dietary fiber, HRT3 vs. T1 in T2D, hypertension, obesity, CVD and all-cause mortality cohorts were 0.97 (95% CI: 0.79, 1.19), 0.97 (95% CI: 0.83, 1.13), 0.92 (95% CI: 0.70, 1.21), 0.90 (95% CI: 0.56, 1.46), and 1.04 (95% CI: 0.80, 1.33), p > 0.05 (Table 4, Figure 2). The results show that legume fiber was not associated with the development of T2D, hypertension, obesity, CVD and all-cause mortality.

3.5. Associations between Vegetable Fiber Intake and T2D, Hypertension, Obesity, CVD, and All-Cause Mortality

After vegetable fiber intake by quartiles classification, HRQ4 vs. Q1 in the cohorts of T2D, hypertension, obesity, CVD, and all-cause mortality were 0.85 (95% CI: 0.68, 1.06), 0.90 (95% CI: 0.77, 1.06), 0.72 (95% CI: 0.54, 0.96), 0.85 (95% CI: 0.53, 1.36), and 1.14 (95% CI: 0.89, 1.46), respectively, p > 0.05. After adding fruit fiber, legume fiber, and whole-grain fiber to adjust for multiple factors of total dietary fiber, HRQ3 vs. Q1 in the cohorts of T2D, hypertension, obesity, CVD and all-cause mortality were 0.89 (95% CI: 0.70, 1.12), 0.96 (95% CI: 0.80, 1.15), 0.75 (95% CI: 0.54, 1.03), 0.77 (95% CI: 0.46, 1.29), 1.19 (95% CI: 0.91, 1.56), respectively, p > 0.05 (Table 5, Figure 2). The results show that vegetable fiber was not associated with the onset of T2D, hypertension, obesity, CVD and all-cause mortality.

3.6. Associations between Fruit Fiber Intake and T2D, Hypertension, Obesity, CVD, and All-Cause Mortality

Because the number of people who did not eat fruit fiber was more than half, the fruit fiber intake was divided into the fruit fiber intake group and the non-fruit fiber intake group. Compared to the non-fruit fiber intake group, the HR in the intake group in the cohorts of T2D, hypertension, obesity, CVD, and all-cause mortality were 0.98 (95% CI: 0.80, 1.20), 0.86 (95% CI: 0.73, 1.02), 1.01 (95% CI: 0.77, 1.33), 0.89 (95%CI: 0.55, 1.46), and 0.58 (95%CI: 0.44, 0.77). After adding the factors of legume fiber, vegetable fiber, and whole-grain fiber to adjust for the multiple factors of total dietary fiber, the HR of the intake group were 0.90 (95% CI: 0.72, 1.12), 0.94 (95% CI: 0.78, 1.13), 0.87 (95% CI: 0.64, 1.19), 0.91 (95% CI: 0.53, 1.54), 0.83 (95% CI: 0.61, 1.13) (Table 6, Figure 2). The results show that fruit fiber was negatively associated with the onset of all-cause mortality in the unadjusted model but not with other diseases. However, after adding vegetable fiber, legume fiber, and whole-grain fiber to adjust for multiple factors of total dietary fiber, fruit fiber was not associated with the onset of T2D, hypertension, obesity, CVD, and all-cause mortality.

4. Discussion

In a large prospective cohort of Chinese adults, we concluded that total dietary fiber and dietary fiber intake from different food sources were not significantly associated with chronic diseases, such as T2D, hypertension, obesity, cardiovascular disease, and all-cause mortality.
There are inconsistent findings from previous studies on dietary fiber intake and the incidence of type 2 diabetes, hypertension, obesity, cardiovascular disease, and all-cause mortality. On the relationship between dietary fiber intake and the risk of developing type 2 diabetes, a meta-analysis conducted in 2015 [5], which included 18 cohort studies, suggested that dietary fiber intake was associated with a lower risk of diabetes (HR: 0.82; 95% CI: 0.69, 0.97) but was no longer statistically significant after adjusting for BMI. However, a study in Japan in (2021) [25] and a study in France in (2020) [13] suggested a negative association between fiber intake and T2D. On the relationship between dietary fiber intake and the risk of developing hypertension, two earlier studies showed that fiber intake was not associated with developing hypertension [26,27]. However, a 2021 US study [28] suggested dietary fiber was independently associated with a reduced risk of diastolic hypertension (OR = 0.848, 95% CI 0.770, 0.934) and systolic hypertension (OR = 0.906, 95% CI 0.826, 0.993) after adjustments were made for confounding factors. On the relationship between dietary fiber intake and the risk of cardiovascular disease, a 2016 Iranian study [7] and a 2022 study from NHNES [29] suggested a negative association between fiber intake and the development of cardiovascular disease, but a 2020 French study [13] concluded that dietary fiber intake was not associated with the development of cardiovascular disease (OR = 0.86, 95% CI: 0.70, 1.06). On the relationship between dietary fiber intake and the risk of obesity development, a 2010 European study [8] suggested that total fiber intake was negatively associated with increased body weight and waist circumference. For total fiber intake above 10 g/day, the combined estimated change in body weight was −39 g/year (95% CI: −71, −7), and the change in waist circumference was −0.08 cm/year (95% CI: −0.11, −0.05). Studies on fiber intake and all-cause mortality yielded inconsistent findings, such as a meta-analysis in 2015 [30], and a 2020 Japanese study [17], which suggested a negative association between dietary fiber intake and all-cause mortality. However, a 2020 French cohort study [13] suggested that dietary fiber was not associated with all-cause mortality (OR = 0.98, 95% CI: 0.72, 1.33).
Our results only partially reproduce some of the findings of previous studies, which may be related to demographic differences (e.g., country, race, age, sex), and differences in dietary patterns. In addition, the dietary fiber intake in our population is relatively low and may be lower than an intake that would provide significant health benefits. For example, a meta-analysis that included 13 prospective studies [31] and a French cohort study [6] showed that when the total dietary fiber intake was higher than 25 g/day, it was negatively associated with developing T2D and hypertension. In contrast, the highest quartile of dietary fiber intake in our study population was >13.5 g/day, which is much lower than the dietary fiber intake in previous study populations, which may be one of the reasons why our study yielded no association.
Ample evidence on dietary fiber suggests that whole-grain fiber may be more likely than other fibers to reduce the risk of developing diabetes and obesity [8,32,33,34,35,36]. Many studies suggested that the beneficial effects of whole-grain fiber may be due to the fiber co-intake of other nutrients (e.g., magnesium and vitamins B1, C, and E), while the lower glycemic index of higher whole-grain fiber diets may have reduced the risk of diabetes and obesity development [35]. However, whole-grain fiber was not associated with either diabetes or obesity in our study. This result may be due to our study population’s relatively low intake of whole-grain fiber, with the Chinese population generally consuming refined grains with shallow fiber content. Some studies reported that the effect of cereal fiber on reducing the risk of developing diabetes and obesity is mainly related to the intake of whole-grains [11], while other characteristics of refined grains, such as the nature of their high glycemic index, may influence the observed results.
Some studies reported that high dietary fiber consumption decreased the risk of hypertension or BP [37,38,39], although other research studies reported that fiber intake was not significantly associated with hypertension [40,41]. Compared with the lowest tercile, the HR (95% CI) of hypertension for the highest tercile intakes of cereal fiber was 0.80 (0.67, 0.96) in US research [37]. The data from SWAN Study suggest that dietary fiber intake, especially from grains, contributes to a lower risk of systolic and diastolic BP in middle-aged women [28]. However, our study shows that whole-grain fiber is positively associated with the incidence of hypertension, which is inconsistent with previous findings. Differences in results may be related to sample size, ethnicity, dietary patterns, and the environment of the study population. More research is needed to confirm this result.
Some prospective cohort studies suggest that vegetable and fruit fibers may reduce the risk of cardiovascular disease more than other fibers [7,14]. It has been proposed that vegetable and fruit fibers, due to their higher content of soluble and insoluble fibers, can reduce the activity of fibrinogen activator inhibitor type 1 and coagulation factor VII [42,43,44,45] and affect gut microbiota, modifying the inflammatory response of the body [46]. These may be some of the mechanisms through which they reduce the risk of cardiovascular disease. However, our study did not yield relevant conclusions, which may be influenced by the method of investigation, and differences in the amount and type of fruits and vegetables consumed in different seasons may impact our findings.
Prospective studies in the United States and Europe have shown that cereal fiber intake is significantly associated with a lower total mortality [47,48]. In contrast, studies from Japan concluded that cereal fiber intake was not associated with mortality, but fiber intake in legumes, vegetables, and fruits was significantly and negatively associated with total mortality [17]. However, our study concluded that neither total dietary fiber nor fiber intake from various food sources was significantly associated with mortality. Several studies have reached different conclusions, with genetic differences among countries and races and differences in dietary habits contributing to the final results, in addition to the low dietary fiber intake of our study population.
Studies on dietary fiber and chronic diseases such as hypertension, obesity, cardiovascular disease, and all-cause mortality in the Chinese population are lacking. A 2021 study [49] involving 3250 middle-aged and elderly participants in Hangzhou reported that dietary fiber intake was associated with a reduced risk of newly diagnosed T2D (odds ratio (OR) = 0.70, 95% CI: 0.49, 1.0), and another study [50] reported that dietary fiber intake was associated with a reduced risk of prediabetes in a population in Tianjin (OR = 0.85, 95% CI: 0.75, 0.98). We found that the highest quantile of dietary fiber intake in both study populations (>15.1 g and >21.4 g, respectively) was higher than in our study population (>13.5 g). This further confirms that the dietary fiber intake of our study population is too small to reduce the risk of disease. Of course, the region, age, gender, and dietary habits of the study population also contribute to a different fiber intake.
The strength of our study is it’s prospective study, the large sample size, and the systematic exploration of the relationship between dietary fiber intake and various chronic diseases and all-cause mortality in the Chinese population. Another major strength of our study is the detailed collection of dietary intakes, collected through repeatedly validated 24-hour dietary records based on an extensive database of more than 6900 food items. This allowed us to examine the associations between different food groups and various chronic diseases [51]. However, some limitations should also be acknowledged. Firstly, limited by the database, although our model adjusted for various potential confounders, residual confounding by the family history of the disease, certain medical conditions and drugs variables, or metabolic factors may persist. Secondly, due to the limitations of the cohort study itself, dietary intake may be influenced by economic and social development, which may affect the associations with disease. However, to ensure the stability of the dietary data, we used average year data for 2004 and 2006 as the baseline dietary assessment. Lastly, in our study, disease detection was primarily based on self-report, and despite this relatively valid method, misclassification bias could not be ruled out.

5. Conclusions

Our study did not find an association between total dietary fiber and dietary fiber intake from various food sources with type 2 diabetes, hypertension, obesity, cardiovascular disease, and all-cause mortality in the Chinese population. However, our study shows that whole-grain fiber is positively associated with the incidence of hypertension. The role of dietary fiber in the Chinese population may be overestimated. To further confirm the association between dietary fiber and these diseases in the Chinese population, more extraordinary efforts are needed in the future to increase the intake of dietary fiber in the Chinese population and to try to diversify the food groups in the dietary pattern (whole-grains, legumes, vegetables, fruits, and meat).

Supplementary Materials

The following supporting information can be downloaded at: https://www.mdpi.com/article/10.3390/nu14132650/s1, Table S1: Characteristics of the study population at inclusion in the hypertension cohort, according to quartiles of total dietary fiber intakes. Table S2: Characteristics of the study population at inclusion in the obesity cohort, according to quartiles of total dietary fiber intakes. Table S3: Characteristics of the study population at inclusion in the CVD cohort, according to quartiles of total dietary fiber intakes. Table S4: Characteristics of the study population at inclusion in the all-cause mortality cohort, according to quartiles of total dietary fiber intakes.

Author Contributions

Conceptualization, S.X. and Y.X.; methodology, S.X.; validation, M.F. and J.Z.; formal analysis, B.C.; writing—original draft preparation, Z.Z. and B.C.; writing—review and editing, Z.Z. and B.C.; visualization, B.C.; supervision, J.Z., X.L., and W.X.; project administration, Y.X.; funding acquisition, S.X. All authors have read and agreed to the published version of the manuscript.

Funding

The study was partly supported by the Young Talents Project of Hubei Provincial Health Commission, China (Grand number WJ2021Q012); Science and Technology Research Key Project of Education Department of Hubei Province, China (Grand number D20212602); Sanuo Diabetes Charity Foundation, China; and Xiangyang Science and Technology Plan Project, China (Grand number 2019ZD12).

Institutional Review Board Statement

On the basis of the guidelines of the Declaration of Helsinki, this study was approved by the Institutional Review Committees of UNC-CH and the NINH, China CDC.

Informed Consent Statement

All subjects involved in the study signed an informed consent statement.

Data Availability Statement

Data from CHNS described in the manuscript will be made publicly and freely available without restriction at China Health and Nutrition Survey. Available online: https://www.cpc.unc.edu/projects/china/data/datasets/index.html (accessed on 12 May 2022).

Acknowledgments

Data in this research were from China Health and Nutrition Survey (CHNS). The authors are grateful to all subjects who participated in the nationwide population-based study. We also thank the National Institute for Nutrition and Health, China Center for Disease Control and Prevention. All authors have consented to the acknowledgement.

Conflicts of Interest

The authors declare no conflict of interest.

References

  1. Saeedi, P.; Salpea, P.; Karuranga, S.; Petersohn, I.; Malanda, B.; Gregg, E.W.; Unwin, N.; Wild, S.H.; Williams, R. Mortality attributable to diabetes in 20–79 years old adults, 2019 estimates: Results from the international diabetes federation diabetes atlas, 9th edition. Diabetes Res. Clin. Pract. 2020, 162, 108086. [Google Scholar] [CrossRef] [Green Version]
  2. Watkins, D.A.; Johnson, C.O.; Colquhoun, S.M.; Karthikeyan, G.; Beaton, A.; Bukhman, G.; Forouzanfar, M.H.; Longenecker, C.T.; Mayosi, B.M.; Mensah, G.A.; et al. Global, regional, and national burden of rheumatic heart disease, 1990–2015. N. Engl. J. Med. 2017, 377, 713–722. [Google Scholar] [CrossRef]
  3. Blüher, M. Obesity: Global epidemiology and pathogenesis. Nat. Rev. Endocrinol. 2019, 15, 288–298. [Google Scholar] [CrossRef]
  4. Mills, K.T.; Bundy, J.D.; Kelly, T.N.; Reed, J.E.; Kearney, P.M.; Reynolds, K.; Chen, J.; He, J. Global disparities of hypertension prevalence and control: A systematic analysis of population-based studies from 90 countries. Circulation 2016, 134, 441–450. [Google Scholar] [CrossRef]
  5. InterAct Consortium. Dietary fibre and incidence of type 2 diabetes in eight European countries: The EPIC-InterAct Study and a meta-analysis of prospective studies. Diabetologia 2015, 58, 1394–1408. [Google Scholar] [CrossRef] [Green Version]
  6. Lairon, D.; Arnault, N.; Bertrais, S.; Planells, R.; Clero, E.; Hercberg, S.; Boutron-Ruault, M.C. Dietary fiber intake and risk factors for cardiovascular disease in French adults. Am. J. Clin. Nutr. 2005, 82, 1185–1194. [Google Scholar] [CrossRef] [Green Version]
  7. Mirmiran, P.; Bahadoran, Z.; Khalili Moghadam, S.; Zadeh Vakili, A.; Azizi, F. A Prospective study of different types of dietary fiber and risk of cardiovascular disease: Tehran lipid and glucose study. Nutrients 2016, 8, 686. [Google Scholar] [CrossRef] [Green Version]
  8. Du, H.; van der A, D.L.; Boshuizen, H.C.; Forouhi, N.G.; Wareham, N.J.; Halkjaer, J.; Tjønneland, A.; Overvad, K.; Jakobsen, M.U.; Boeing, H.; et al. Dietary fiber and subsequent changes in body weight and waist circumference in European men and women. Am. J. Clin. Nutr. 2010, 91, 329–336. [Google Scholar] [CrossRef] [Green Version]
  9. Buil-Cosiales, P.; Zazpe, I.; Toledo, E.; Corella, D.; Salas-Salvadó, J.; Diez-Espino, J.; Ros, E.; Navajas, J.F.-N.; Santos-Lozano, J.M.; Arós, F.; et al. Fiber intake and all-cause mortality in the Prevención con Dieta Mediterránea (PREDIMED) study. Am. J. Clin. Nutr. 2014, 100, 1498–1507. [Google Scholar] [CrossRef]
  10. Xu, H.; Huang, X.; Risérus, U.; Krishnamurthy, V.M.; Cederholm, T.; Arnlöv, J.; Lindholm, B.; Sjögren, P.; Carrero, J.J. Dietary fiber, kidney function, inflammation, and mortality risk. Clin. J. Am. Soc. Nephrol. 2014, 9, 2104–2110. [Google Scholar] [CrossRef]
  11. Miller, S.J.; Batra, A.K.; Shearrer, G.E.; House, B.T.; Cook, L.T.; Pont, S.J.; Goran, M.I.; Davis, J.N. Dietary fibre linked to decreased inflammation in overweight minority youth. Pediatr. Obes. 2016, 11, 33–39. [Google Scholar] [CrossRef]
  12. Erkkilä, A.T.; Lichtenstein, A.H. Fiber and cardiovascular disease risk: How strong is the evidence? J. Cardiovasc. Nurs. 2006, 21, 3–8. [Google Scholar] [CrossRef]
  13. Partula, V.; Deschasaux, M.; Druesne-Pecollo, N.; Latino-Martel, P.; Desmetz, E.; Chazelas, E.; Kesse-Guyot, E.; Julia, C.; Fezeu, L.K.; Galan, P.; et al. Associations between consumption of dietary fibers and the risk of cardiovascular diseases, cancers, type 2 diabetes, and mortality in the prospective NutriNet-Santé cohort. Am. J. Clin. Nutr. 2020, 112, 195–207. [Google Scholar] [CrossRef]
  14. Threapleton, D.E.; Greenwood, D.C.; Evans, C.E.; Cleghorn, C.L.; Nykjaer, C.; Woodhead, C.; Cade, J.E.; Gale, C.P.; Burley, V.J. Dietary fibre intake and risk of cardiovascular disease: Systematic review and meta-analysis. BMJ 2013, 347, f6879. [Google Scholar] [CrossRef] [Green Version]
  15. Yang, Y.; Zhao, L.G.; Wu, Q.J.; Ma, X.; Xiang, Y.B. Association between dietary fiber and lower risk of all-cause mortality: A meta-analysis of cohort studies. Am. J. Epidemiol. 2015, 181, 83–91. [Google Scholar] [CrossRef]
  16. Dominguez, L.J.; Bes-Rastrollo, M.; Toledo, E.; Gea, A.; Fresán, U.; Barbagallo, M.; Martínez-González, M.A. Dietary fiber intake and mortality in a Mediterranean population: The “Seguimiento Universidad de Navarra” (SUN) project. Eur. J. Nutr. 2019, 58, 3009–3022. [Google Scholar] [CrossRef]
  17. Katagiri, R.; Goto, A.; Sawada, N.; Yamaji, T.; Iwasaki, M.; Noda, M.; Iso, H.; Tsugane, S. Dietary fiber intake and total and cause-specific mortality: The Japan Public Health Center-based prospective study. Am. J. Clin. Nutr. 2020, 111, 1027–1035. [Google Scholar] [CrossRef]
  18. Steffen, L.M.; Jacobs, D.R., Jr.; Stevens, J.; Shahar, E.; Carithers, T.; Folsom, A.R. Associations of whole-grain, refined-grain, and fruit and vegetable consumption with risks of all-cause mortality and incident coronary artery disease and ischemic stroke: The Atherosclerosis Risk in Communities (ARIC) Study. Am. J. Clin. Nutr. 2003, 78, 383–390. [Google Scholar] [CrossRef]
  19. Popkin, B.M.; Du, S.; Zhai, F.; Zhang, B. Cohort profile: The China Health and Nutrition Survey--monitoring and understanding socio-economic and health change in China, 1989–2011. Int. J. Epidemiol. 2010, 39, 1435–1440. [Google Scholar] [CrossRef] [Green Version]
  20. Zhang, B.; Zhai, F.Y.; Du, S.F.; Popkin, B.M. The China Health and Nutrition Survey, 1989–2011. Obes. Rev. 2014, 15, 2–7. [Google Scholar] [CrossRef] [Green Version]
  21. Zhai, F.Y.; Du, S.F.; Wang, Z.H.; Zhang, J.G.; Du, W.W.; Popkin, B.M. Dynamics of the Chinese diet and the role of urbanicity, 1991–2011. Obes. Rev. 2014, 15, 16–26. [Google Scholar] [CrossRef] [Green Version]
  22. Kim, H.; Lee, K.; Rebholz, C.M.; Kim, J. Plant-based diets and incident metabolic syndrome: Results from a South Korean prospective cohort study. PLoS Med. 2020, 17, e1003371. [Google Scholar] [CrossRef]
  23. Yuan, X.; Liu, T.; Wu, L.; Zou, Z.Y.; Li, C. Validity of self-reported diabetes among middle-aged and older Chinese adults: The China health and retirement longitudinal study. BMJ Open 2015, 5, e006633. [Google Scholar] [CrossRef] [Green Version]
  24. China Nutrition Association. The Chinese Dietary Guidline 2022. Available online: http://dg.cnsoc.org/ (accessed on 23 April 2022).
  25. Kimura, Y.; Yoshida, D.; Hirakawa, Y.; Hata, J.; Honda, T.; Shibata, M.; Sakata, S.; Uchida, K.; Kitazono, T.; Ninomiya, T. Dietary fiber intake and risk of type 2 diabetes in a general Japanese population: The Hisayama Study. J. Diabetes Investig. 2021, 12, 527–536. [Google Scholar] [CrossRef]
  26. Witteman, J.C.; Willett, W.C.; Stampfer, M.J.; Colditz, G.A.; Sacks, F.M.; Speizer, F.E.; Rosner, B.; Hennekens, C.H. A prospective study of nutritional factors and hypertension among US women. Circulation 1989, 80, 1320–1327. [Google Scholar] [CrossRef] [Green Version]
  27. Ascherio, A.; Rimm, E.B.; Giovannucci, E.L.; Colditz, G.A.; Rosner, B.; Willett, W.C.; Sacks, F.; Stampfer, M.J. A prospective study of nutritional factors and hypertension among US men. Circulation 1992, 86, 1475–1484. [Google Scholar] [CrossRef] [Green Version]
  28. Du, P.; Luo, K.; Wang, Y.; Xiao, Q.; Xiao, J.; Li, Y.; Zhang, X. Intake of dietary fiber from grains and the risk of hypertension in late midlife women: Results from the SWAN study. Front. Nutr. 2021, 8, 730205. [Google Scholar] [CrossRef]
  29. Zhang, S.; Tian, J.; Lei, M.; Zhong, C.; Zhang, Y. Association between dietary fiber intake and atherosclerotic cardiovascular disease risk in adults: A cross-sectional study of 14,947 population based on the National Health and Nutrition Examination Surveys. BMC Public Health 2022, 22, 1076. [Google Scholar] [CrossRef]
  30. Liu, L.; Wang, S.; Liu, J. Fiber consumption and all-cause, cardiovascular, and cancer mortalities: A systematic review and meta-analysis of cohort studies. Mol. Nutr. Food Res. 2015, 59, 139–146. [Google Scholar] [CrossRef]
  31. Khan, K.; Jovanovski, E.; Ho, H.; Marques, A.; Zurbau, A.; Mejia, S.B.; Sievenpiper, J.L.; Vuksan, V. The effect of viscous soluble fiber on blood pressure: A systematic review and meta-analysis of randomized controlled trials. Nutr. Metab. Cardiovasc. Dis. NMCD. 2018, 28, 3–13. [Google Scholar] [CrossRef]
  32. Yao, B.; Fang, H.; Xu, W.; Yan, Y.; Xu, H.; Liu, Y.; Mo, M.; Zhang, H.; Zhao, Y. Dietary fiber intake and risk of type 2 diabetes: A dose-response analysis of prospective studies. Eur. J. Epidemiol. 2014, 29, 79–88. [Google Scholar] [CrossRef] [PubMed]
  33. Salmerón, J.; Ascherio, A.; Rimm, E.B.; Colditz, G.A.; Spiegelman, D.; Jenkins, D.J.; Stampfer, M.J.; Wing, A.L.; Willett, W.C. Dietary fiber, glycemic load, and risk of NIDDM in men. Diabetes Care 1997, 20, 545–550. [Google Scholar] [CrossRef] [PubMed]
  34. Schulze, M.B.; Liu, S.; Rimm, E.B.; Manson, J.E.; Willett, W.C.; Hu, F.B. Glycemic index, glycemic load, and dietary fiber intake and incidence of type 2 diabetes in younger and middle-aged women. Am. J. Clin. Nutr. 2004, 80, 348–356. [Google Scholar] [CrossRef] [PubMed]
  35. Koh-Banerjee, P.; Franz, M.; Sampson, L.; Liu, S.; Jacobs, D.R., Jr.; Spiegelman, D.; Willett, W.; Rimm, E. Changes in whole-grain, bran, and cereal fiber consumption in relation to 8-y weight gain among men. Am. J. Clin. Nutr. 2004, 80, 1237–1245. [Google Scholar] [CrossRef] [Green Version]
  36. Bakker, S.J.; Hoogeveen, E.K.; Nijpels, G.; Kostense, P.J.; Dekker, J.M.; Gans, R.O.; Heine, R.J. The association of dietary fibres with glucose tolerance is partly explained by concomitant intake of thiamine: The hoorn study. Diabetologia 1998, 41, 1168–1175. [Google Scholar] [CrossRef] [Green Version]
  37. Sun, B.; Shi, X.; Wang, T.; Zhang, D. Exploration of the association between dietary fiber intake and hypertension among U.S. adults using 2017 american college of cardiology/american heart association blood pressure guidelines: NHANES 2007–2014. Nutrients 2018, 10, 1091. [Google Scholar] [CrossRef] [Green Version]
  38. Kochar, J.; Gaziano, J.M.; Djoussé, L. Breakfast cereals and risk of hypertension in the Physicians’ Health Study I. Clin. Nutr. 2012, 31, 89–92. [Google Scholar] [CrossRef] [Green Version]
  39. Borgi, L.; Muraki, I.; Satija, A.; Willett, W.C.; Rimm, E.B.; Forman, J.P. Fruit and vegetable consumption and the incidence of hypertension in three prospective cohort studies. Hypertension 2016, 67, 288–293. [Google Scholar] [CrossRef] [Green Version]
  40. Masala, G.; Bendinelli, B.; Versari, D.; Saieva, C.; Ceroti, M.; Santagiuliana, F.; Caini, S.; Salvini, S.; Sera, F.; Taddei, S.; et al. Anthropometric and dietary determinants of blood pressure in over 7000 Mediterranean women: The European prospective investigation into cancer and nutrition-florence cohort. J. Hypertens. 2008, 26, 2112–2120. [Google Scholar] [CrossRef]
  41. Davy, B.M.; Melby, C.L.; Beske, S.D.; Ho, R.C.; Davrath, L.R.; Davy, K.P. Oat consumption does not affect resting casual and ambulatory 24-h arterial blood pressure in men with high-normal blood pressure to stage I hypertension. J. Nutr. 2002, 132, 394–398. [Google Scholar] [CrossRef] [Green Version]
  42. Anderson, J.W.; Tietyen-Clark, J. Dietary fiber: Hyperlipidemia, hypertension, and coronary heart disease. Am. J. Gastroenterol. 1986, 81, 907–919. [Google Scholar] [PubMed]
  43. Anderson, J.W.; Chen, W.J. Plant fiber. Carbohydrate and lipid metabolism. Am. J. Clin. Nutr. 1979, 32, 346–363. [Google Scholar] [CrossRef] [PubMed]
  44. Hamaker, B.R.; Tuncil, Y.E. A perspective on the complexity of dietary fiber structures and their potential effect on the gut microbiota. J. Mol. Biol. 2014, 426, 3838–3850. [Google Scholar] [CrossRef]
  45. Parnell, J.A.; Reimer, R.A. Prebiotic fiber modulation of the gut microbiota improves risk factors for obesity and the metabolic syndrome. Gut Microbes. 2012, 3, 29–34. [Google Scholar] [CrossRef] [PubMed] [Green Version]
  46. Kuo, S.M. The interplay between fiber and the intestinal microbiome in the inflammatory response. Adv. Nutr. 2013, 4, 16–28. [Google Scholar] [CrossRef] [PubMed] [Green Version]
  47. Chuang, S.C.; Norat, T.; Murphy, N.; Olsen, A.; Tjønneland, A.; Overvad, K.; Boutron-Ruault, M.C.; Perquier, F.; Dartois, L.; Kaaks, R.; et al. Fiber intake and total and cause-specific mortality in the European Prospective Investigation into Cancer and Nutrition cohort. Am. J. Clin. Nutr. 2012, 96, 164–174. [Google Scholar] [CrossRef] [PubMed]
  48. Ark, Y.; Subar, A.F.; Hollenbeck, A.; Schatzkin, A. Dietary fiber intake and mortality in the NIH-AARP diet and health study. Arch. Intern. Med. 2011, 171, 1061–1068. [Google Scholar]
  49. Jin, F.; Zhang, J.; Shu, L.; Han, W. Association of dietary fiber intake with newly-diagnosed type 2 diabetes mellitus in middle-aged Chinese population. Nutr. J. 2021, 20, 81. [Google Scholar] [CrossRef]
  50. Zhang, S.; Meng, G.; Zhang, Q.; Liu, L.; Yao, Z.; Wu, H.; Gu, Y.; Wang, Y.; Zhang, T.; Wang, X.; et al. Dietary fiber intake and risk of prediabetes in China: Results from the TCLSIH Cohort Study. Br. J. Nutr. 2021, 1–20. [Google Scholar] [CrossRef]
  51. Kim, H.; Rebholz, C.M.; Garcia-Larsen, V.; Steffen, L.M.; Coresh, J.; Caulfield, L.E. Operational differences in plant-based diet indices affect the ability to detect associations with incident hypertension in middle-aged US adults. J. Nutr. 2020, 150, 842–850. [Google Scholar] [CrossRef]
Figure 1. Participants flowchart.
Nutrients 14 02650 g001
Figure 2. Associations between the consumption of dietary fibers from different sources and (A) T2DM, (B) hypertension, (C) obesity, (D) CVD, (E) mortality from all causes.
Nutrients 14 02650 g002
Table 1. Characteristics of the study population at inclusion in the T2D cohort, according to quartiles of total dietary fiber intakes.
CharacteristicsFiber Intake (g/d)p
Quartile 1 (<6.21)Quartile 2 (6.21–8.81)Quartile 3 (8.81–13.50)Quartile 4 (>13.50)
Number1611171817991778
Age (years)47.62 ± 14.8946.93 ± 13.7147.44 ± 13.4147.77 ± 13.340.307
Male, n (%)667 (42.14)797 (46.69)865 (49.01)931 (52.57)<0.001
BMI (kg/m2)22.97 ± 3.3323.04 ± 3.4123.25 ± 3.2823.10 ± 3.290.097
Waist circumference (cm)80.04 ± 9.9880.44 ± 9.8581.34 ± 9.7881.32 ± 9.58 0.001
Systolic blood pressure (mmHg)122.46 ± 17.89121.43 ± 17.35121.97 ± 18.70121.04 ± 17.290.136
Diastolic blood pressure (mmHg)79.24 ± 10.7978.58 ± 10.4778.57 ± 11.9478.11 ± 10.920.048
Physical activity (MET-MIN/day)274.28 (0.00–1531.29)978.96 (0.00–1992.86)993.01 (0.00–2090.14)1079.04 (0.00–2220.01)<0.001
Smoking, n (%)
 Yes461 (29.21)555 (32.44)613 (34.61)628 (35.44)0.006
 No1117 (70.79)1156 (67.56)1158 (65.39)1144 (64.56)
Alcohol drinking, n (%)
 Yes444 (28.14)555 (32.44)638 (36.09)649 (36.60)<0.001
 No1134 (71.861156 (67.56)1130 (63.91)1124 (63.40)
Educational level, n (%) 0.004
 Primary school or below699 (44.16)768 (44.99)835 (47.34)916 (51.72)
 Junior high school497 (31.40)558 (32.69)571 (32.37)515 (29.08)
 Senior high school237 (14.97)229 (13.42)214 (12.13)211 (11.91)
 College and above150 (9.48)152 (8.90)144 (8.16)129 (7.28)
Regions, n (%)
 Urban600 (37.24)535 (31.14)531 (29.85)444 (24.97)<0.001
 Rural1011 (62.76)1183 (68.86)1248 (70.15)1334 (75.03)
Total energy intake (kcal/day)1869.11 ± 547.142115.88 ± 550.742280.64 ± 576.402479.94 ± 598.07<0.001
Total carbohydrate intake (g/d)263.19 ± 79.91311.06 ± 85.94338.77 ± 100.03378.01 ± 108.77<0.001
Total protein intake (g/d)55.26 ± 18.9762.11 ± 19.0869.03 ± 20.5976.46 ± 25.01<0.001
Total fatty intake (g/d)63.99 ± 35.0966.95 ± 35.8768.67 ± 35.7470.90 ± 37.45<0.001
Na intake (mg/d)60.91 (14.41–485.21)52.81 (16.20–829.61)60.60 (16.63–1130.85)49.61 (16.74–850.52)<0.001
Whole-grain fiber intake (g/d)0.37 ± 0.790.72 ± 1.261.18 ± 1.992.58 ± 5.49<0.001
Legume fiber intake (g/d)0.11 ± 0.320.33 ± 0.740.76 ± 1.532.56 ± 5.52<0.001
Vegetable fiber intake (g/d)2.01 ± 0.963.37 ± 1.324.82 ± 2.3610.86 ± 9.53<0.001
Fruit fiber intake (g/d)0.10 ± 0.330.21 ± 0.590.37 ± 0.930.48 ± 1.37<0.001
Descriptive analyses of continuous variables were conducted by means ± standard deviations (SD) or medians (interquartile range), and categorical variables were described by number (percentage). Analysis of variance or Kruskal–Wallis test was used for continuous variables, and chi-square test was used for categorical variables. BMI: body mass index.
Table 2. Multi-variable adjusted HRs (95% CI) of T2D, hypertension, obesity, CVD, and all-cause mortality according to quartiles of total dietary fiber.
Total Fiber Intake
Quartile 1Quartile 2Quartile 3Quartile 4p-Trend
T2D
Number of cases132166174178
Person-years16,90217,88818,54518,515
Incidence density
(1000 person-years)
7.819.289.389.61
T2D a1.01.18 (0.94, 1.48)1.19 (0.95, 1.50)1.22 (0.97, 1.53)0.12
T2D b1.01.12 (0.88, 1.43)1.13 (0.88, 1.44)1.20 (0.93, 1.55)0.08
Hypertension
Number of cases270297307304
Person-years924110,11610,66710,552
Incidence density
(1000 person-years)
29.2129.3528.7828.81
Hypertension a1.01.01 (0.86, 1.19)0.99 (0.84, 1.17)0.99 (0.84, 1.17)0.63
Hypertension c1.00.98 (0.82, 1.18)0.86 (0.71, 1.04)0.91 (0.75, 1.12)0.25
Obesity
Number of cases759810997
Person-years10,08711,30812,08911,781
Incidence density
(1000 person-years)
7.438.679.018.23
Obesity a1.01.17 (0.86, 1.57)1.21 (0.90, 1.63)1.11 (0.82, 1.50)0.14
Obesity c1.01.09 (0.78, 1.52)1.02 (0.73, 1.44)0.93 (0.64, 1.35)0.40
CVD
Number of cases22383532
Person-years12,27615,36314,12414,289
Incidence density
(1000 person-years)
1.792.472.482.23
CVD a1.01.56 (0.93, 2.64)1.38 (0.81, 2.36)1.25 (0.73, 2.15)0.34
CVD c1.01.56 (0.90, 2.70)1.24 (0.70, 2.23)1.13 (0.60, 2.12)0.07
All-cause mortality
Number of cases133105101129
Person-years21,57122,39822,66322,543
Incidence density
(1000 person-year)
6.164.684.455.72
All-cause mortality a1.00.76 (0.59, 0.98)0.72 (0.56, 0.94)0.93 (0.73, 1.18)0.11
All-cause mortality c1.01.05 (0.79, 1.38)0.95 (0.70, 1.27)1.13 (0.84, 1.52)0.14
HRs were examined using Cox proportional hazard models. a: Confounding factors were not adjusted. b: Adjusted for age, sex, BMI, education, regions, physical activity, smoking status, alcohol drinking, total energy intake, total carbohydrate intake, protein intake, and fatty intake. c: Adjusted for age, sex, BMI, education, regions, physical activity, smoking status, alcohol drinking, total energy intake, total carbohydrate intake, protein intake, fatty intake, systolic blood pressure, diastolic blood pressure, and Na intake.
Table 3. Multi-variable adjusted HRs (95%CI) of T2D, hypertension, obesity, CVD, and all-cause mortality according to terciles of whole-grain fiber.
Whole-Grain Fiber
Tercile 1Tercile 2Tercile 3p-Trend
T2D a1.001.33 (1.11, 1.62)1.31 (1.09, 1.57)0.06
T2D b11.001.16 (0.94, 1.43)1.16 (0.96, 1.41)0.12
Hypertension a1.001.13 (0.96, 1.31)1.29 (1.13, 1.47)0.04
Hypertension c11.001.05 (0.88, 1.25)1.21 (1.04, 1.40)0.03
Obesity a1.001.67 (1.29, 2.15)1.62 (1.28, 2.05)0.73
Obesity c11.001.23 (0.91, 1.65)1.27 (0.98, 1.65)0.55
CVD a1.001.04 (0.64, 1.70)1.43 (0.97, 2.12)0.16
CVD c11.000.94 (0.56, 1.59)1.29 (0.85, 1.96)0.52
All-cause mortality a1.000.83 (0.65, 1.06)0.87 (0.69, 1.08)0.14
All-cause mortality c11.000.98 (0.75, 1.28)0.95 (0.75, 1.20)0.09
a: Confounding factors were not adjusted. b1: HRs were examined using Cox proportional hazard models. adjusted for age, sex, BMI, education, regions physical activity, smoking status, alcohol drinking, total energy intake, total carbohydrate intake, protein intake, fatty intake, legume fiber, fruit fiber, and vegetable fiber. c1: HRs were examined using Cox proportional hazard models adjusted for age, sex, BMI, education, regions, physical activity, smoking status, alcohol drinking, total energy intake, total carbohydrate intake, protein intake, fatty intake, systolic blood pressure, diastolic blood pressure, Na intake, legume fiber, fruit fiber, and vegetable fiber.
Table 4. Multi-variable adjusted HR (95% CI) of T2D, hypertension, obesity, CVD, and all-cause mortality according to terciles of legume fiber.
Legume Fiber
Tercile 1Tercile 2Tercile 3p-Trend
T2D a1.001.15 (0.92, 1.43)1.12 (0.93, 1.33)0.43
T2D b21.001.09 (0.87, 1.38)0.97 (0.79, 1.19)0.24
Hypertension a1.000.95 (0.79, 1.15)1.07 (0.94, 1.22)0.37
Hypertension c21.001.01 (0.82, 1.24)0.97 (0.83, 1.13)0.16
Obesity a1.000.84 (0.59, 1.20)1.06 (0.84, 1.33)0.20
Obesity c21.000.84 (0.57, 1.25)0.92 (0.70, 1.21)0.08
CVD a1.001.06 (0.63, 1.76)1.06 (0.70, 1.60)0.12
CVD c21.001.09 (0.64, 1.85)0.90 (0.56, 1.46)0.67
All-cause mortality a1.000.91 (0.70, 1.20)0.86 (0.69, 1.07)0.19
All-cause mortality c21.001.07 (0.81, 1.42)1.04 (0.80, 1.33)0.46
a: Confounding factors were not adjusted. b2: HRs were examined using Cox proportional hazard models. Adjusted for age, sex, BMI, education, regions physical activity, smoking status, alcohol drinking, total energy intake, total carbohydrate intake, protein intake, fatty intake, whole-grain fiber, fruit fiber, and vegetable fiber. c2: HRs were examined using Cox proportional hazard models. Adjusted for age, sex, BMI, education, regions, physical activity, smoking status, alcohol drinking, total energy intake, total carbohydrate intake, protein intake, fatty intake, systolic blood pressure, diastolic blood pressure, Na intake, whole-grain fiber, fruit fiber, and vegetable fiber.
Table 5. Multivariable adjusted HRs (95% CI) of T2D, hypertension, obesity, CVD, and all-cause mortality according to quartiles of vegetable fiber.
Vegetable Fiber
Quartile 1Quartile 2Quartile 3Quartile 4p-Trend
T2D a1.000.85 (0.68, 1.06)0.97 (0.79, 1.20)0.85 (0.68, 1.06)0.24
T2D b31.000.83 (0.66, 1.05)0.97 (0.77, 1.21)0.89 (0.70, 1.12)0.34
Hypertension a1.000.93 (0.79, 1.09)0.92 (0.78, 1.08)0.90 (0.77, 1.06)0.18
Hypertension c31.001.01 (0.85, 1.20)0.96 (0.81, 1.15)0.96 (0.80, 1.15)0.12
Obesity a1.000.72 (0.54, 0.96)0.84 (0.64, 1.10)0.72 (0.54, 0.96)0.46
Obesity c31.000.78 (0.57, 1.08)0.87 (0.64, 1.19)0.75 (0.54, 1.03)0.71
CVD a1.000.72 (0.43, 1.18)0.83 (0.51, 1.33)0.85 (0.53, 1.36)0.19
CVD c31.000.70 (0.41, 1.18)0.75 (0.45, 1.26)0.77 (0.46, 1.29)0.83
All-cause mortality a1.000.97 (0.75, 1.25)0.88 (0.67, 1.14)1.14 (0.89, 1.46)0.16
All-cause mortality c31.001.01 (0.77, 1.34)1.14 (0.85, 1.51)1.19 (0.91, 1.56)0.47
a: Confounding factors were not adjusted. b3: HRs were examined using Cox proportional hazard models. adjusted for age, sex, BMI, education, regions, physical activity, smoking status, alcohol drinking, total energy intake, total carbohydrate intake, protein intake, fatty intake, whole-grain fiber, fruit fiber, and legume fiber. c3: HRs were examined using Cox proportional hazard models. Adjusted for age, sex, BMI, education, regions, physical activity, smoking status, alcohol drinking, total energy intake, total carbohydrate intake, protein intake, fatty intake, systolic blood pressure, diastolic blood pressure, Na intake, whole-grain fiber, fruit fiber, and legume fiber.
Table 6. Multivariable adjusted HRs (95%CI) of T2D, hypertension, obesity, CVD, and all-cause mortality according to the classification of intake of fruit fiber or not.
Fruit Fiber
No Intake GroupIntake Group
T2D a1.000.98 (0.80, 1.20)
T2D b41.000.90 (0.72, 1.12)
Hypertension a1.000.86 (0.73, 1.02)
Hypertension c41.000.94 (0.78, 1.13)
Obesity a1.001.01 (0.77, 1.33)
Obesity c41.000.87 (0.64, 1.19)
CVD a1.000.89 (0.55, 1.46)
CVD c41.000.91 (0.53, 1.54)
All-cause mortality a1.000.58 (0.44, 0.77)
All-cause mortality c41.000.83 (0.61, 1.13)
a: Confounding factors were not adjusted. b4: HRs were examined using Cox proportional hazard models. adjusted for age, sex, BMI, education, regions, physical activity, smoking status, alcohol drinking, total energy intake, total carbohydrate intake, protein intake, fatty intake, whole-grain fiber, vegetable fiber, and legume fiber. c4: HRs were examined using Cox proportional hazard models. adjusted for age, sex, BMI, education, regions, physical activity, smoking status, alcohol drinking, total energy intake, total carbohydrate intake, protein intake, fatty intake, systolic blood pressure, diastolic blood pressure, Na intake, whole-grain fiber, vegetable fiber, and legume fiber.
Publisher’s Note: MDPI stays neutral with regard to jurisdictional claims in published maps and institutional affiliations.

