
Association of Body Mass Index and Plant-Based Diet with Cognitive Impairment among Older Chinese Adults: A Prospective, Nationwide Cohort Study


 and
and 
Abstract
:1. Introduction
2. Methods
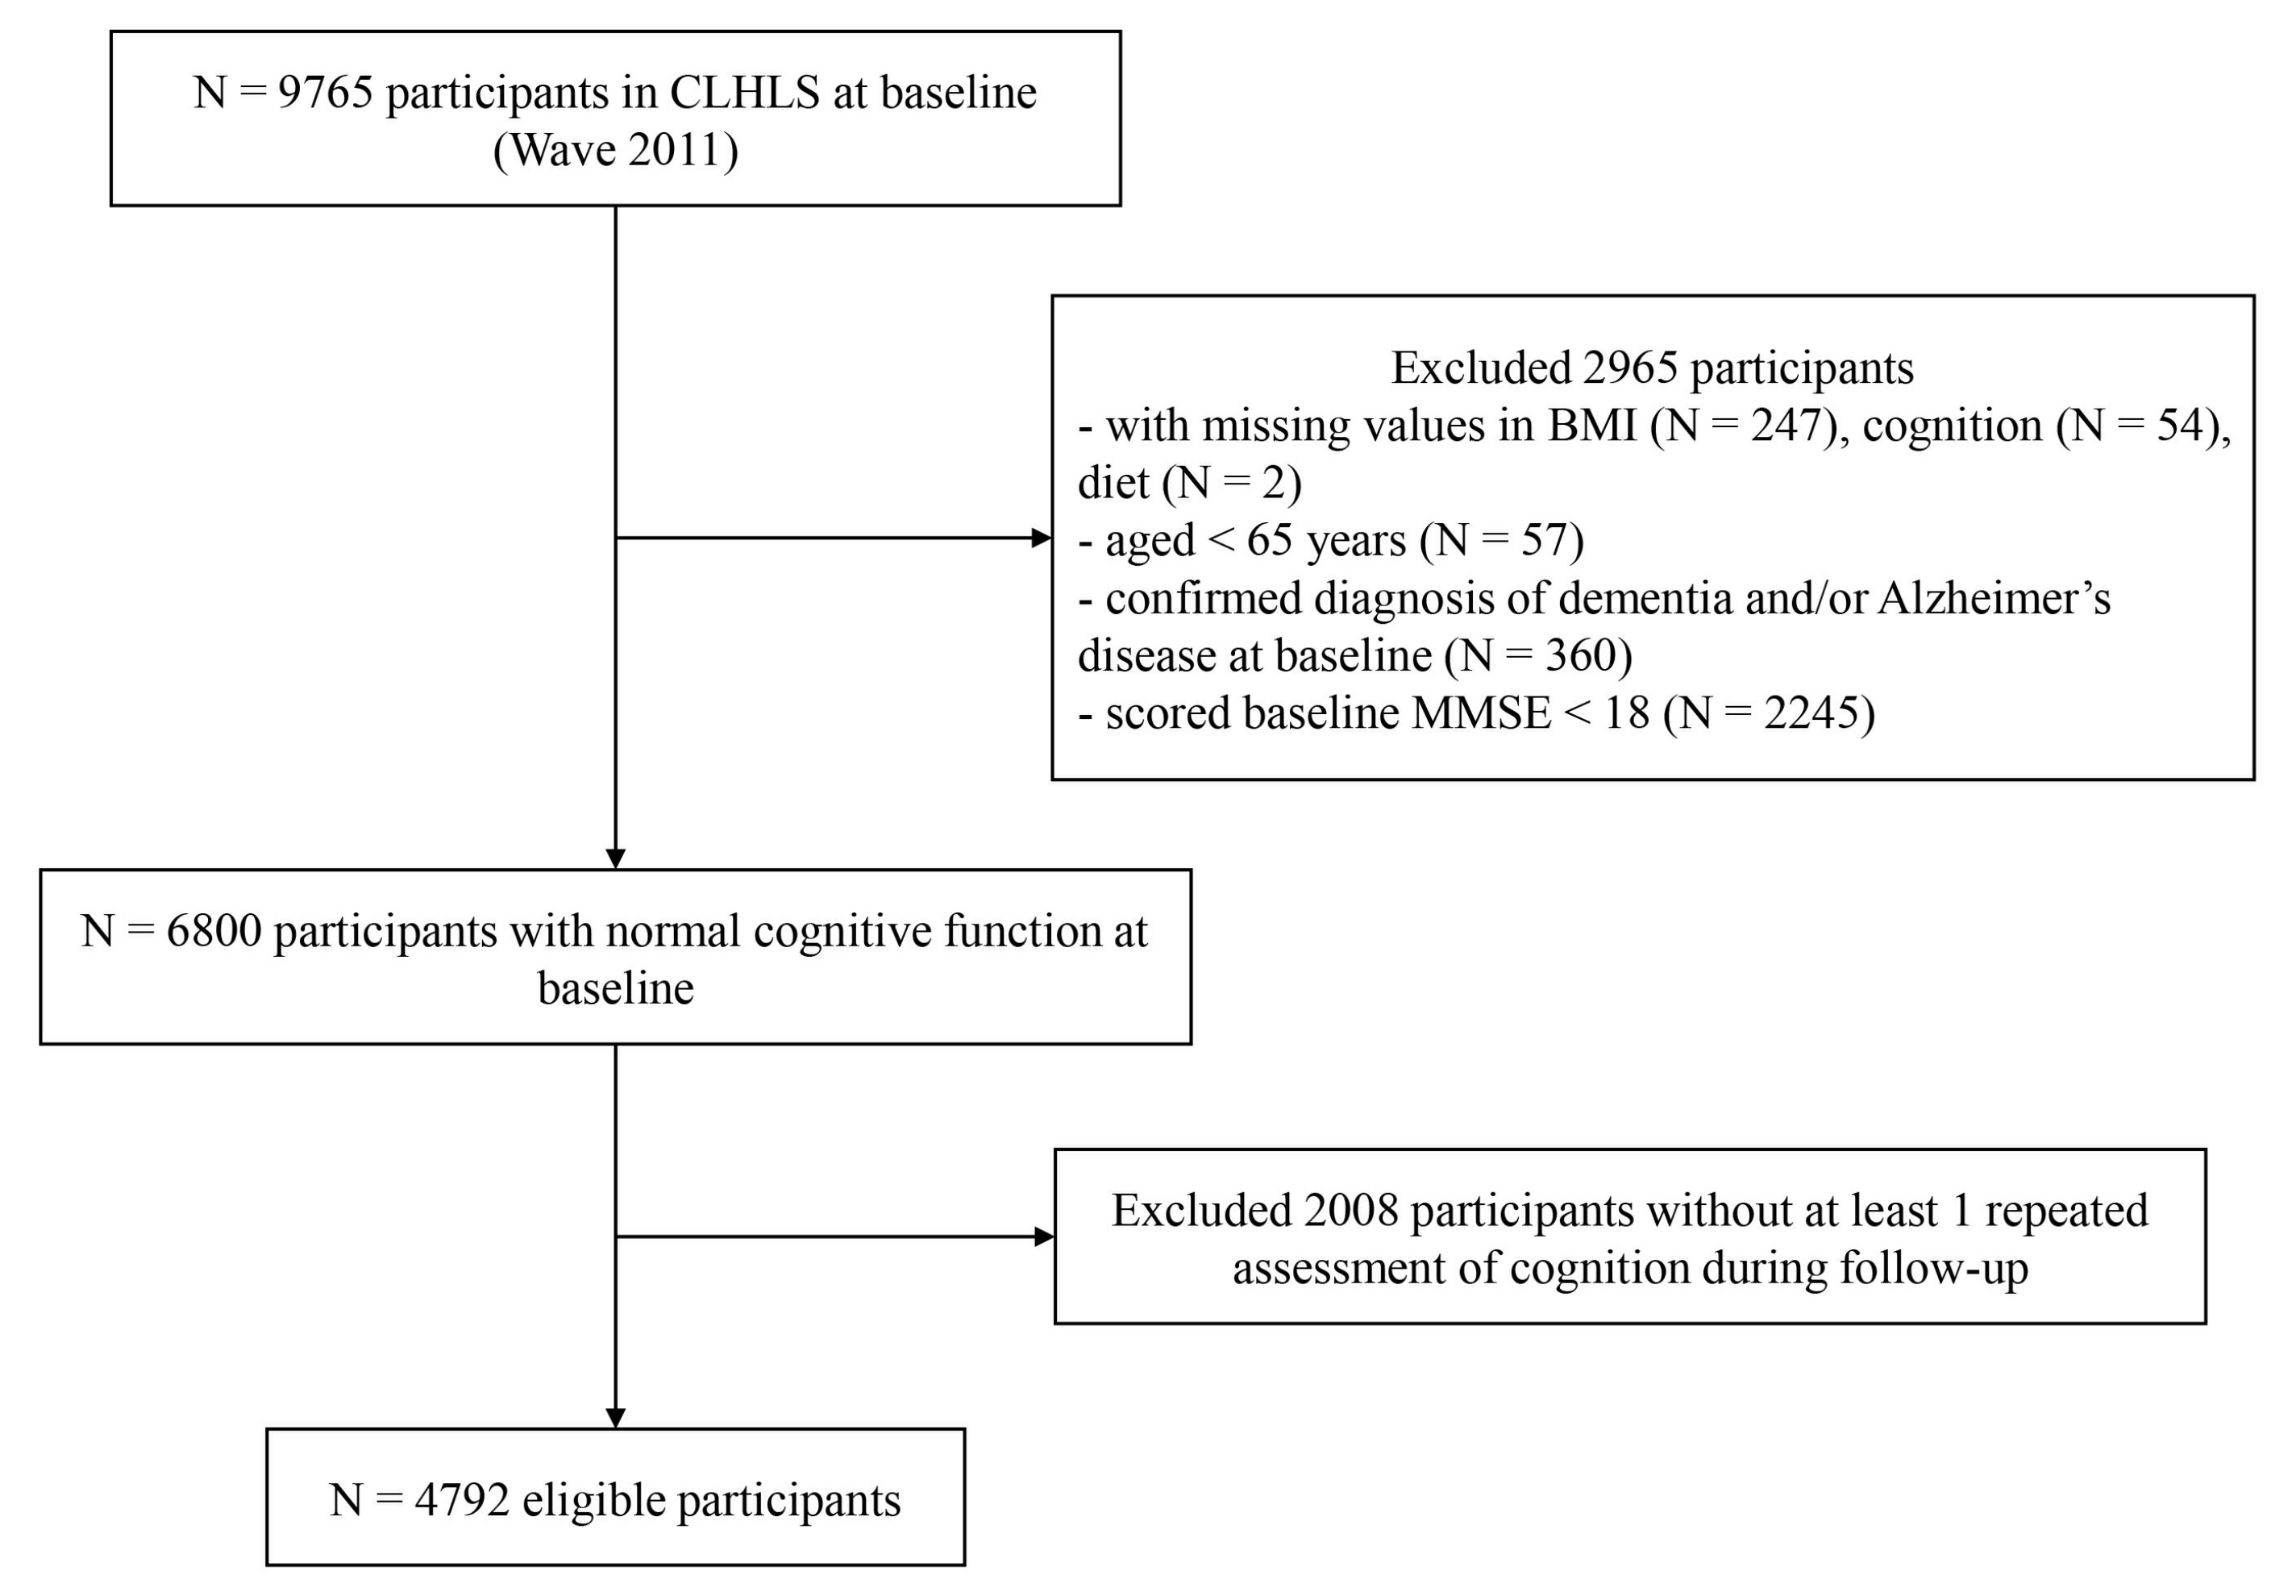
2.1. Study Population
2.2. Measurement and Calculation of Body Mass Index
2.3. Assessment of Cognitive Function
2.4. Measurement and Calculation of Plant-Based Diet Indices
2.5. Assessment of Covariates
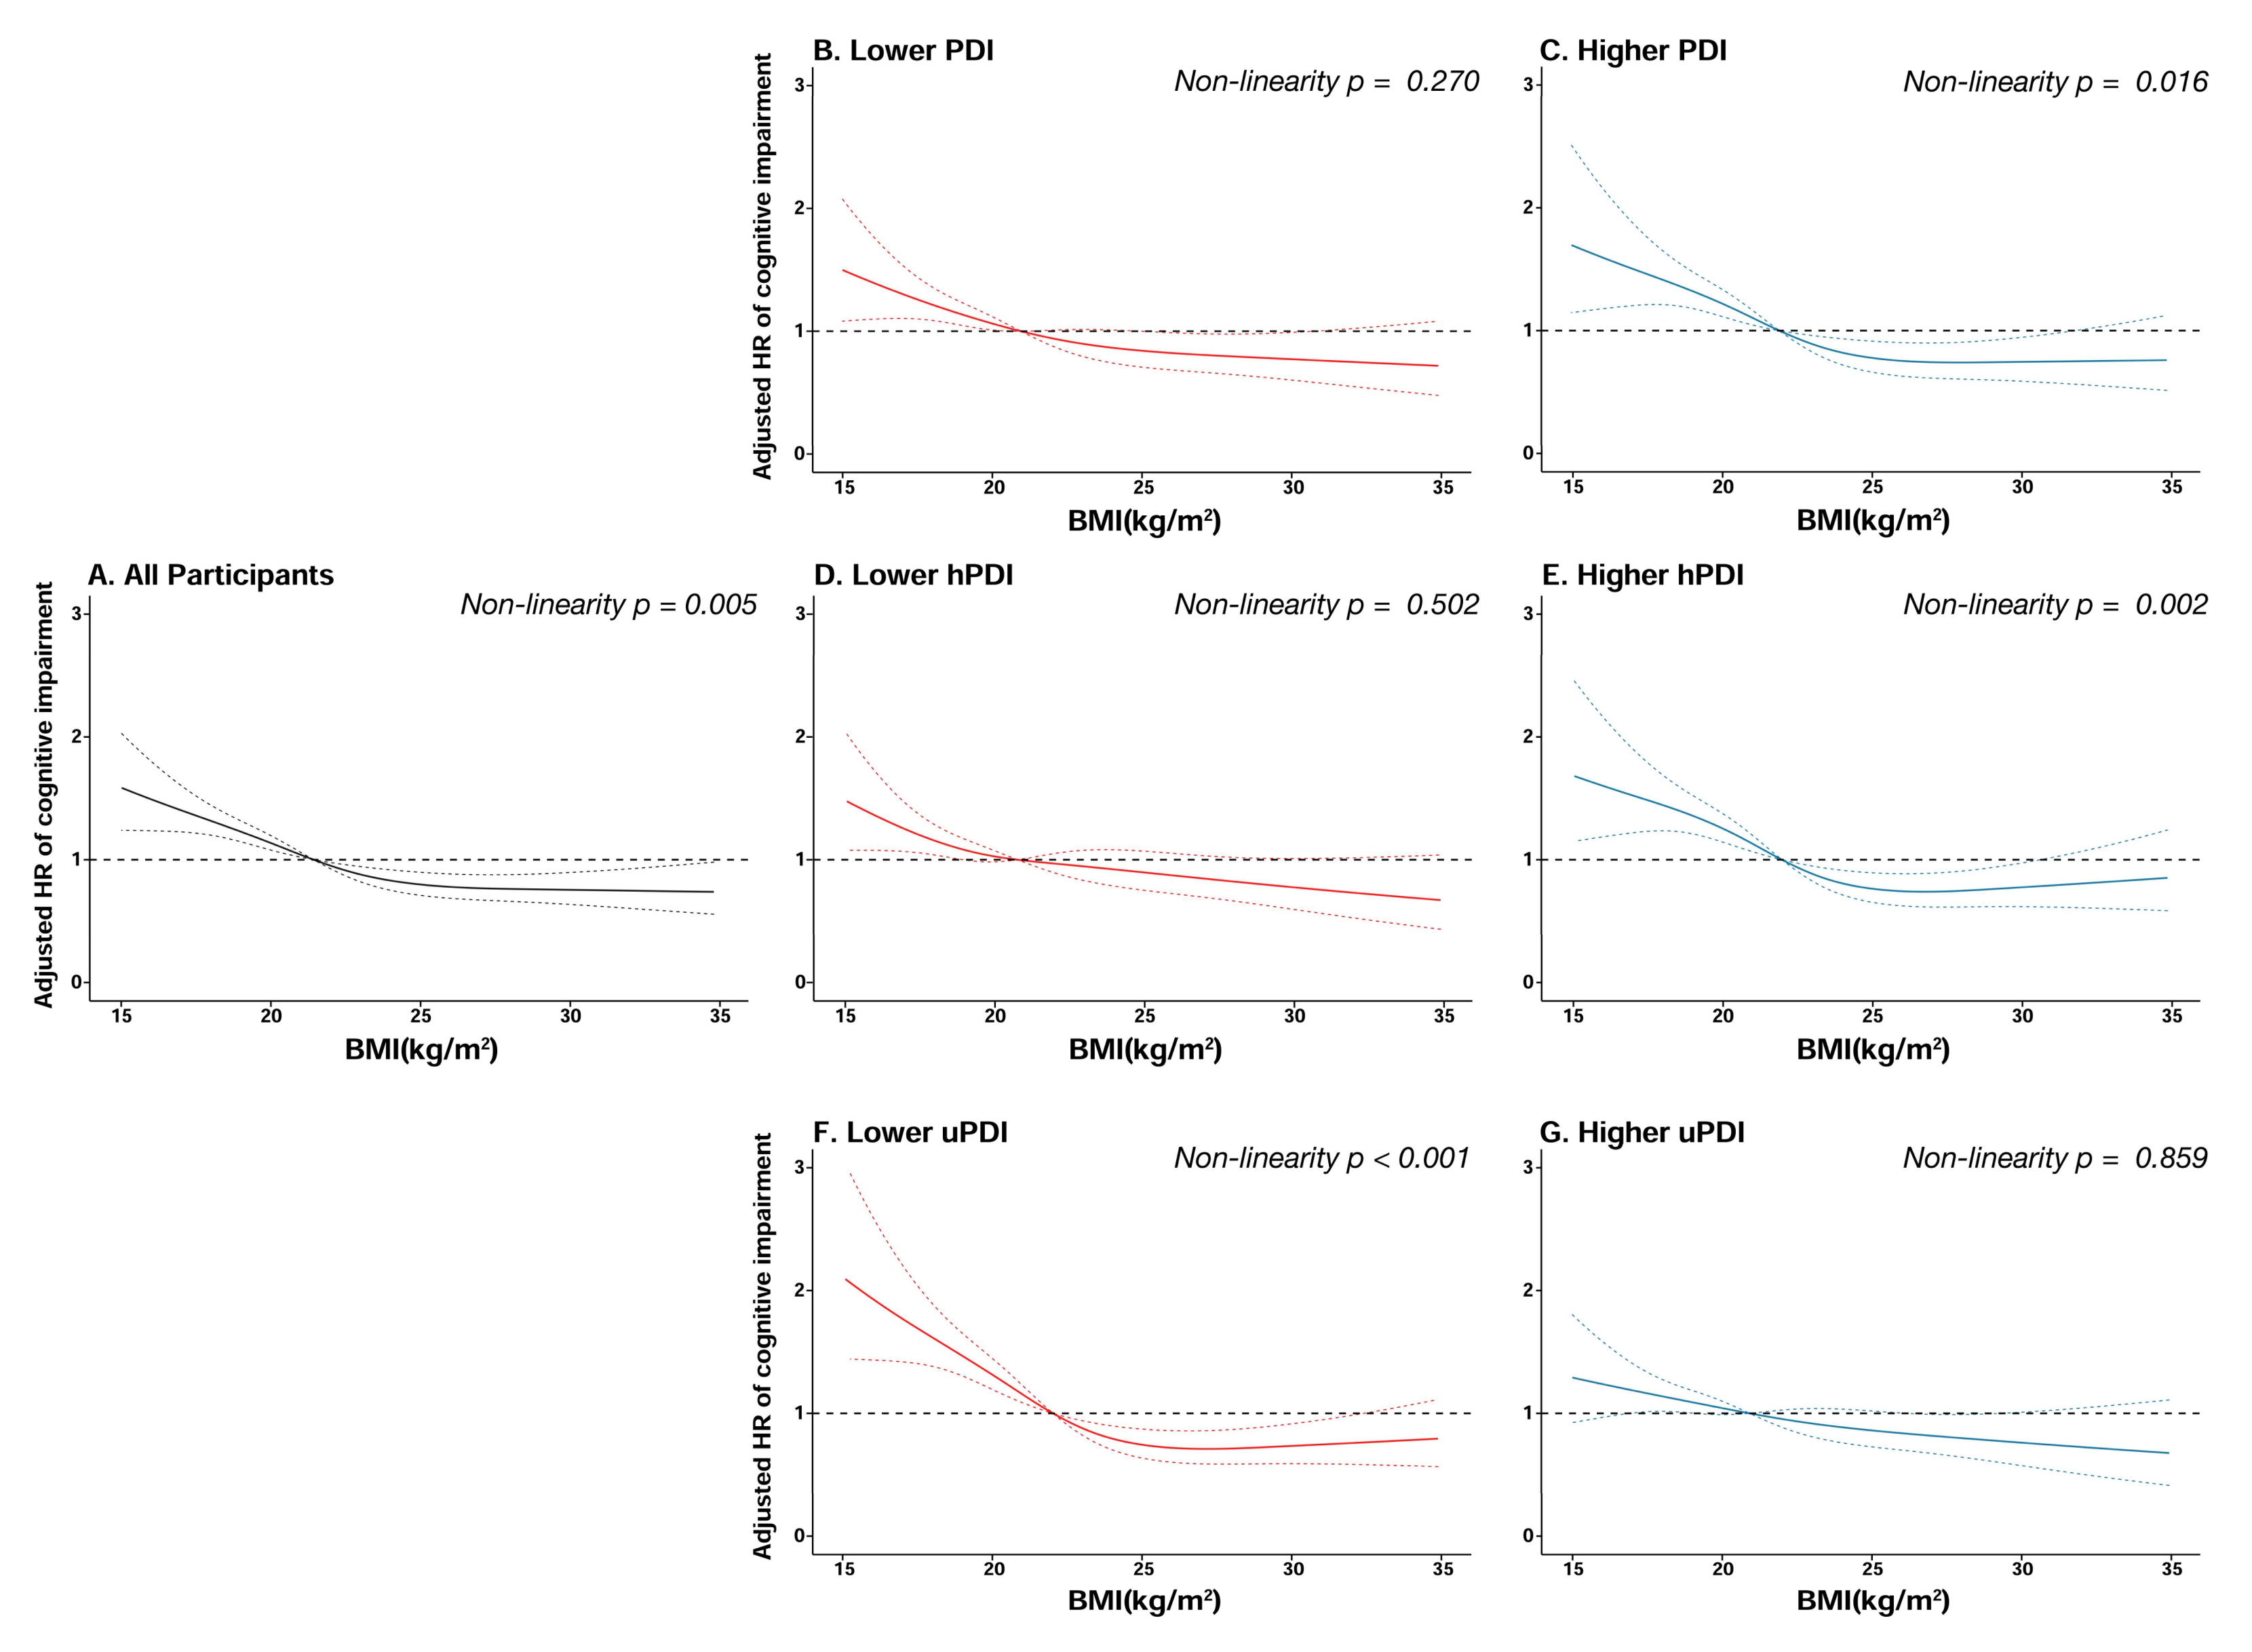
2.6. Statistical Analysis
3. Results
4. Discussion
5. Conclusions
Author Contributions
Funding
Institutional Review Board Statement
Informed Consent Statement
Data Availability Statement
Acknowledgments
Conflicts of Interest
Appendix A

| Food Category | Food Groups | Frequency | PDI | hPDI | uPDI | |
|---|---|---|---|---|---|---|
| Plant-based food | Healthful | Whole grain | Yes | 5 | 5 | 1 |
| No | 1 | 1 | 5 | |||
| Vegetable oils | Yes | 5 | 5 | 1 | ||
| No | 1 | 1 | 5 | |||
| Fresh fruits | Almost everyday | 5 | 5 | 1 | ||
| Quite often | 4 | 4 | 2 | |||
| Occasionally | 2 | 2 | 4 | |||
| Rarely or never | 1 | 1 | 5 | |||
| Fresh vegetables | Almost everyday | 5 | 5 | 1 | ||
| Quite often | 4 | 4 | 2 | |||
| Occasionally | 2 | 2 | 4 | |||
| Rarely or never | 1 | 1 | 5 | |||
| Legumes | Almost everyday | 5 | 5 | 1 | ||
| ≥1 time/week | 4 | 4 | 2 | |||
| ≥1 time/month | 3 | 3 | 3 | |||
| Occasionally | 2 | 2 | 4 | |||
| Rarely or never | 1 | 1 | 5 | |||
| Garlic | Almost everyday | 5 | 5 | 1 | ||
| ≥1 time/week | 4 | 4 | 2 | |||
| ≥1 time/month | 3 | 3 | 3 | |||
| Occasionally | 2 | 2 | 4 | |||
| Rarely or never | 1 | 1 | 5 | |||
| Nuts | Almost everyday | 5 | 5 | 1 | ||
| ≥1 time/week | 4 | 4 | 2 | |||
| ≥1 time/month | 3 | 3 | 3 | |||
| Occasionally | 2 | 2 | 4 | |||
| Rarely or never | 1 | 1 | 5 | |||
| Tea | Almost everyday | 5 | 5 | 1 | ||
| ≥1 time/week | 4 | 4 | 2 | |||
| ≥1 time/month | 3 | 3 | 3 | |||
| Occasionally | 2 | 2 | 4 | |||
| Rarely or never | 1 | 1 | 5 | |||
| Unhealthful | Refined grains | Yes | 5 | 1 | 5 | |
| No | 1 | 5 | 1 | |||
| Sugar (white granulated sugar or candies) | Almost everyday | 5 | 1 | 5 | ||
| ≥1 time/week | 4 | 2 | 4 | |||
| ≥1 time/month | 3 | 3 | 3 | |||
| Occasionally | 2 | 4 | 2 | |||
| Rarely or never | 1 | 5 | 1 | |||
| Preserved vegetables | Almost everyday | 5 | 1 | 5 | ||
| ≥1 time/week | 4 | 2 | 4 | |||
| ≥1 time/month | 3 | 3 | 3 | |||
| Occasionally | 2 | 4 | 2 | |||
| Rarely or never | 1 | 5 | 1 | |||
| Animal-based food | Animal fat | Yes | 1 | 1 | 1 | |
| No | 5 | 5 | 5 | |||
| Meat | Almost everyday | 1 | 1 | 1 | ||
| ≥1 time/week | 2 | 2 | 2 | |||
| ≥1 time/month | 3 | 3 | 3 | |||
| Occasionally | 4 | 4 | 4 | |||
| Rarely or never | 5 | 5 | 5 | |||
| Fish | Almost everyday | 1 | 1 | 1 | ||
| ≥1 time/week | 2 | 2 | 2 | |||
| ≥1 time/month | 3 | 3 | 3 | |||
| Occasionally | 4 | 4 | 4 | |||
| Rarely or never | 5 | 5 | 5 | |||
| Eggs | Almost everyday | 1 | 1 | 1 | ||
| ≥1 time/month | 3 | 3 | 3 | |||
| Occasionally | 4 | 4 | 4 | |||
| Rarely or never | 5 | 5 | 5 | |||
| Dairy products | Almost everyday | 1 | 1 | 1 | ||
| ≥1 time/week | 2 | 2 | 2 | |||
| ≥1 time/month | 3 | 3 | 3 | |||
| Occasionally | 4 | 4 | 4 | |||
| Rarely or never | 5 | 5 | 5 | |||
References
- Livingston, G.; Sommerlad, A.; Orgeta, V.; Costafreda, S.G.; Huntley, J.; Ames, D.; Ballard, C.; Banerjee, S.; Burns, A.; Cohen-Mansfield, J.; et al. Dementia prevention, intervention, and care. Lancet 2017, 390, 2673–2734. [Google Scholar] [CrossRef] [Green Version]
- Alzheimer’s, A. 2018 Alzheimer’s disease facts and figures. Alzheimers Dement. 2018, 14, 367–425. [Google Scholar] [CrossRef]
- Livingston, G.; Huntley, J.; Sommerlad, A.; Ames, D.; Ballard, C.; Banerjee, S.; Brayne, C.; Burns, A.; Cohen-Mansfield, J.; Cooper, C.; et al. Dementia prevention, intervention, and care: 2020 report of the Lancet Commission. Lancet 2020, 396, 413–446. [Google Scholar] [CrossRef]
- Rabin, L.A.; Smart, C.M.; Amariglio, R.E. Subjective Cognitive Decline in Preclinical Alzheimer’s Disease. Annu. Rev. Clin. Psychol. 2017, 13, 369–396. [Google Scholar] [CrossRef]
- Grillner, S. Human Brain Project. Nat. Neurosci. 2016, 19, 1118. [Google Scholar] [CrossRef]
- Rubin, L.H.; Gustafson, D.; Hawkins, K.L.; Zhang, L.; Jacobson, L.P.; Becker, J.T.; Munro, C.A.; Lake, J.E.; Martin, E.; Levine, A.; et al. Midlife adiposity predicts cognitive decline in the prospective Multicenter AIDS Cohort Study. Neurology 2019, 93, E261–E271. [Google Scholar] [CrossRef]
- Liu, Z.Z.; Yang, H.Q.; Chen, S.Y.; Cai, J.; Huang, Z.J. The association between body mass index, waist circumference, waist-hip ratio and cognitive disorder in older adults. J. Public Health 2019, 41, 305–312. [Google Scholar] [CrossRef]
- Gunstad, J.; Lhotsky, A.; Wendell, C.R.; Ferrucci, L.; Zonderman, A.B. Longitudinal Examination of Obesity and Cognitive Function: Results from the Baltimore Longitudinal Study of Aging. Neuroepidemiology 2010, 34, 222–229. [Google Scholar] [CrossRef] [Green Version]
- Ntlholang, O.; McCarroll, K.; Laird, E.; Molloy, A.M.; Ward, M.; McNult, H.; Hory, L.; Hughes, C.F.; Strain, J.J.; Casey, M.; et al. The relationship between adiposity and cognitive function in a large community-dwelling population: Data from the Trinity Ulster Department of Agriculture (TUDA) ageing cohort study. Br. J. Nutr. 2018, 120, 517–527. [Google Scholar] [CrossRef] [Green Version]
- West, N.A.; Lirette, S.T.; Cannon, V.A.; Turner, S.T.; Mosley, T.H.; Windham, B.G. Adiposity, Change in Adiposity, and Cognitive Decline in Mid- and Late Life. J. Am. Geriatr. Soc. 2017, 65, 1282–1288. [Google Scholar] [CrossRef]
- Arvanitakis, Z.; Capuano, A.W.; Bennett, D.A.; Barnes, L.L. Body Mass Index and Decline in Cognitive Function in Older Black and White Persons. J. Gerontol. Ser. A Biol. Sci. Med. Sci. 2018, 73, 198–203. [Google Scholar] [CrossRef] [Green Version]
- Nianogo, R.A.; Rosenwohl-Mack, A.; Yaffe, K.; Carrasco, A.; Hoffmann, C.M.; Barnes, D.E. Risk Factors Associated With Alzheimer Disease and Related Dementias by Sex and Race and Ethnicity in the US. JAMA Neurol. 2022, 79, 584–591. [Google Scholar] [CrossRef]
- Liang, F.; Fu, J.L.; Moore, J.B.; Zhang, X.E.; Xu, Y.J.; Qiu, N.; Wang, Y.C.; Li, R. Body Mass Index, Waist Circumference, and Cognitive Decline Among Chinese Older Adults: A Nationwide Retrospective Cohort Study. Front. Aging Neurosci. 2022, 14, 9. [Google Scholar] [CrossRef]
- Kim, S.; Kim, Y.; Park, S.M. Body Mass Index and Decline of Cognitive Function. PLoS ONE 2016, 11, 14. [Google Scholar] [CrossRef] [Green Version]
- Aiken-Morgan, A.T.; Capuano, A.W.; Arvanitakis, Z.; Barnes, L.L. Changes in Body Mass Index Are Related to Faster Cognitive Decline Among African American Older Adults. J. Am. Geriatr. Soc. 2020, 68, 2662–2667. [Google Scholar] [CrossRef]
- Michaud, T.L.; Siahpush, M.; Farazi, P.A.; Kim, J.; Yu, F.; Su, D.J.; Murman, D.L. The Association Between Body Mass Index, and Cognitive, Functional, and Behavioral Declines for Incident Dementia. J. Alzheimers Dis. 2018, 66, 1507–1517. [Google Scholar] [CrossRef]
- Rodriguez-Fernandez, J.M.; Danies, E.; Martinez-Ortega, J.; Chen, W.C. Cognitive Decline, Body Mass Index, and Waist Circumference in Community-Dwelling Elderly Participants: Results From a Nationally Representative Sample. J. Geriatr. Psychiatry Neurol. 2017, 30, 67–76. [Google Scholar] [CrossRef]
- Deckers, K.; van Boxtel, M.P.J.; Verhey, F.R.J.; Kohler, S. Obesity and cognitive decline in adults: Effect of methodological choices and confounding by age in a longitudinal study. J. Nutr. Health Aging 2017, 21, 546–553. [Google Scholar] [CrossRef]
- Kim, G.; Choi, S.; Lyu, J. Body mass index and trajectories of cognitive decline among older Korean adults. Aging Ment. Health 2020, 24, 758–764. [Google Scholar] [CrossRef]
- Tolppanen, A.M.; Ngandu, T.; Kareholt, I.; Laatikainen, T.; Rusanen, M.; Soininen, H.; Kivipelto, M. Midlife and Late-Life Body Mass Index and Late-Life Dementia: Results from a Prospective Population-Based Cohort. J. Alzheimers Dis. 2014, 38, 201–209. [Google Scholar] [CrossRef]
- Hou, Q.T.; Guan, Y.; Yu, W.H.; Liu, X.T.; Wu, L.H.; Xiao, M.Z.; Lu, Y. Associations between obesity and cognitive impairment in the Chinese elderly: An observational study. Clin. Interv. Aging 2019, 14, 367–373. [Google Scholar] [CrossRef] [Green Version]
- Wu, S.S.; Lv, X.Z.; Shen, J.; Chen, H.; Ma, Y.; Jin, X.R.; Yang, J.X.; Cao, Y.Y.; Zong, G.; Wang, H.L.; et al. Association between body mass index, its change and cognitive impairment among Chinese older adults: A community-based, 9-year prospective cohort study. Eur. J. Epidemiol. 2021, 36, 1043–1054. [Google Scholar] [CrossRef]
- Ren, Z.; Li, Y.Y.; Li, X.R.; Shi, H.; Zhao, H.F.; He, M.F.; Zha, S.; Qiao, S.Y.; Pu, Y.J.; Liu, H.J.; et al. Associations of body mass index, waist circumference and waist-to-height ratio with cognitive impairment among Chinese older adults: Based on the CLHLS. J. Affect. Disord. 2021, 295, 463–470. [Google Scholar] [CrossRef]
- Zhang, H.; Tsao, R. Dietary polyphenols, oxidative stress and antioxidant and anti-inflammatory effects. Curr. Opin. Food Sci. 2016, 8, 33–42. [Google Scholar] [CrossRef]
- Ricker, M.A.; Haas, W.C. Anti-Inflammatory Diet in Clinical Practice: A Review. Nutr. Clin. Pract. 2017, 32, 318–325. [Google Scholar] [CrossRef]
- Medawar, E.; Huhn, S.; Villringer, A.; Witte, A.V. The effects of plant-based diets on the body and the brain: A systematic review. Transl. Psychiatr. 2019, 9, 17. [Google Scholar] [CrossRef]
- Rajaram, S.; Jones, J.; Lee, G.J. Plant-Based Dietary Patterns, Plant Foods, and Age-Related Cognitive Decline. Adv. Nutr. 2019, 10, S422–S436. [Google Scholar] [CrossRef] [Green Version]
- Chen, H.; Shen, J.; Xuan, J.; Zhu, A.; Ji, J.S.; Liu, X.; Cao, Y.; Zong, G.; Zeng, Y.; Wang, X.J.N.A. Plant-based dietary patterns in relation to mortality among older adults in China. Nat. Aging 2022, 2, 1–7. [Google Scholar] [CrossRef]
- Satija, A.; Bhupathiraju, S.N.; Rimm, E.B.; Spiegelman, D.; Chiuve, S.E.; Borgi, L.; Willett, W.C.; Manson, J.E.; Sun, Q.; Hu, F.B. Plant-Based Dietary Patterns and Incidence of Type 2 Diabetes in US Men and Women: Results from Three Prospective Cohort Studies. PLos Med. 2016, 13, 18. [Google Scholar] [CrossRef] [Green Version]
- Baden, M.Y.; Liu, G.; Satija, A.; Li, Y.P.; Sun, Q.; Fung, T.T.; Rimm, E.B.; Willett, W.C.; Hu, F.B.; Bhupathiraju, S.N. Changes in Plant-Based Diet Quality and Total and Cause-Specific Mortality. Circulation 2019, 140, 979–991. [Google Scholar] [CrossRef]
- Scarmeas, N.; Anastasiou, C.A.; Yannakoulia, M. Nutrition and prevention of cognitive impairment. Lancet Neurol. 2018, 17, 1006–1015. [Google Scholar] [CrossRef]
- Wu, J.; Song, X.Y.; Chen, G.C.; Neelakantan, N.; van Dam, R.M.; Feng, L.; Yuan, J.M.; Pan, A.; Koh, W.P. Dietary pattern in midlife and cognitive impairment in late life: A prospective study in Chinese adults. Am. J. Clin. Nutr. 2019, 110, 912–920. [Google Scholar] [CrossRef] [PubMed] [Green Version]
- Liu, X.; Dhana, K.; Barnes, L.; Tangney, C.; Aggarwal, P.; Agarwal, N.; Holland, T.; Rajan, K.J.C. A Healthy Plant-based Diet Was Associated With Slower Cognitive Decline In African Americans: A Biracial Community-based Cohort Of Older Adults. Circulation 2022, 145, A066. [Google Scholar] [CrossRef]
- Yi, Z. Introduction to the chinese longitudinal healthy longevity survey (CLHLS). In Healthy Longevity in China; Springer: Dordrecht, The Netherlands, 2008; pp. 23–38. [Google Scholar]
- Zeng, Y.; Feng, Q.; Hesketh, T.; Christensen, K.; Vaupel, J.W.J.T.L. Survival, disabilities in activities of daily living, and physical and cognitive functioning among the oldest-old in China: A cohort study. Lancet 2017, 389, 1619–1629. [Google Scholar] [CrossRef]
- Folstein, M.F.; Folstein, S.E.; McHugh, P.R. “Mini-mental state”: A practical method for grading the cognitive state of patients for the clinician. J. Psychiatr. Res. 1975, 12, 189–198. [Google Scholar] [CrossRef]
- Tombaugh, T.N.; McIntyre, N.J. The mini-mental-state-examination—A comprehensive review. J. Am. Geriatr. Soc. 1992, 40, 922–935. [Google Scholar] [CrossRef]
- Sun, R.J.; Gu, D.N. Air Pollution, Economic Development of Communities, and Health Status Among the Elderly in Urban China. Am. J. Epidemiol. 2008, 168, 1311–1318. [Google Scholar] [CrossRef]
- Wang, J.; Li, T.; Lv, Y.; Kraus, V.B.; Zhang, Y.; Mao, C.; Yin, Z.; Shi, W.; Zhou, J.; Zheng, T.; et al. Fine Particulate Matter and Poor Cognitive Function among Chinese Older Adults: Evidence from a Community-Based, 12-Year Prospective Cohort Study. Environ. Health Perspect. 2020, 128, 67013. [Google Scholar] [CrossRef]
- Zhu, A.; Chen, H.; Shen, J.; Wang, X.; Li, Z.; Zhao, A.; Shi, X.; Yan, L.; Zeng, Y.; Yuan, C.; et al. Interaction between plant-based dietary pattern and air pollution on cognitive function: A prospective cohort analysis of Chinese older adults. Lancet Reg. Health West. Pac. 2022, 20, 100372. [Google Scholar] [CrossRef]
- Lv, Y.B.; Gao, X.; Yin, Z.X.; Chen, H.S.; Luo, J.S.; Brasher, M.S.; Kraus, V.B.; Li, T.T.; Zeng, Y.; Shi, X.M. Revisiting the association of blood pressure with mortality in oldest old people in China: Community based, longitudinal prospective study. BMJ Br. Med. J. 2018, 361, 11. [Google Scholar] [CrossRef] [Green Version]
- Jin, X.R.; He, W.Y.; Zhang, Y.; Gong, E.; Niu, Z.M.; Ji, J.; Li, Y.X.; Zeng, Y.; Yan, L.L.J. Association of APOE epsilon 4 genotype and lifestyle with cognitive function among Chinese adults aged 80 years and older: A cross-sectional study. PLoS Med. 2021, 18, 18. [Google Scholar] [CrossRef]
- Zhang, Y.; Jin, X.R.; Lutz, M.W.; Ju, S.Y.; Liu, K.Y.; Guo, G.; Zeng, Y.; Yao, Y. Interaction between APOE epsilon 4 and dietary protein intake on cognitive decline: A longitudinal cohort study. Clin. Nutr. 2021, 40, 2716–2725. [Google Scholar] [CrossRef]
- Wang, Z.B.; Pang, Y.J.; Liu, J.; Wang, J.; Xie, Z.; Huang, T. Association of healthy lifestyle with cognitive function among Chinese older adults. Eur. J. Clin. Nutr. 2021, 75, 325–334. [Google Scholar] [CrossRef]
- Satija, A.; Malik, V.; Rimm, E.B.; Sacks, F.; Willett, W.; Hu, F.B. Changes in intake of plant-based diets and weight change: Results from 3 prospective cohort studies. Am. J. Clin. Nutr. 2019, 110, 574–582. [Google Scholar] [CrossRef] [Green Version]
- Satija, A.; Bhupathiraju, S.N.; Spiegelman, D.; Chiuve, S.E.; Manson, J.E.; Willett, W.; Rexrode, K.M.; Rimm, E.B.; Hu, F.B. Healthful and Unhealthful Plant-Based Diets and the Risk of Coronary Heart Disease in US Adults. J. Am. Coll. Cardiol. 2017, 70, 411–422. [Google Scholar] [CrossRef]
- Power, B.D.; Alfonso, H.; Flicker, L.; Hankey, G.J.; Yeap, B.B.; Almeida, O.P. Changes in body mass in later life and incident dementia. Int. Psychogeriatr. 2013, 25, 467–478. [Google Scholar] [CrossRef]
- Coin, A.; Veronese, N.; De Rui, M.; Mosele, M.; Bolzetta, F.; Girardi, A.; Manzato, E.; Sergi, G. Nutritional predictors of cognitive impairment severity in demented elderly patients: The key role of BMI. J. Nutr. Health Aging 2012, 16, 553–556. [Google Scholar] [CrossRef]
- Yamamoto, H.; Kato, Y. Relationship between plasma insulin-like growth factor-i (igf-i) levels and body-mass index (bmi) in adults. Endocr. J. 1993, 40, 41–45. [Google Scholar] [CrossRef] [Green Version]
- Harvey, J.; Solovyova, N.; Irving, A. Leptin and its role in hippocampal synaptic plasticity. Prog. Lipid Res. 2006, 45, 369–378. [Google Scholar] [CrossRef] [Green Version]
- Singh, M.; Dykens, J.A.; Simpkins, J.W. Novel mechanisms for estrogen-induced neuroprotection. Exp. Biol. Med. 2006, 231, 514–521. [Google Scholar] [CrossRef]
- Oomura, Y.; Hori, N.; Shiraishi, T.; Fukunaga, K.; Takeda, H.; Tsuji, M.; Matsurihiya, T.; Ishibashi, M.; Aou, S.; Li, X.L.; et al. Leptin facilitates learning and memory performance and enhances hippocampal CA1 long-term potentiation and CaMK II phosphorylation in rats. Peptides 2006, 27, 2738–2749. [Google Scholar] [CrossRef]
- Okereke, O.; Kang, J.H.; Ma, J.; Hankinson, S.E.; Pollak, M.N.; Grodstein, F. Plasma IGF-I levels and cognitive performance in older women. Neurobiol. Aging 2007, 28, 135–142. [Google Scholar] [CrossRef]
- Snijder, M.B.; Dekker, J.M.; Visser, M.; Bouter, L.M.; Stehouwer, C.D.A.; Yudkin, J.S.; Heine, R.; Nijpels, G.; Seidell, J.C. Trunk fat and log fat have independent and opposite associations with fasting and postload glucose levels—The Hoorn Study. Diabetes Care 2004, 27, 372–377. [Google Scholar] [CrossRef] [Green Version]
- Butterfield, D.A.; Halliwell, B. Oxidative stress, dysfunctional glucose metabolism and Alzheimer disease. Nat. Rev. Neurosci. 2019, 20, 148–160. [Google Scholar] [CrossRef]
- Chen, H.L.; Mosley, T.H.; Alonso, A.; Huang, X.M. Plasma Urate and Parkinson’s Disease in the Atherosclerosis Risk in Communities (ARIC) Study. Am. J. Epidemiol. 2009, 169, 1064–1069. [Google Scholar] [CrossRef]
- Van den Brink, A.C.; Brouwer-Brolsma, E.M.; Berendsen, A.A.M.; van de Rest, O. The Mediterranean, Dietary Approaches to Stop Hypertension (DASH), and Mediterranean-DASH Intervention for Neurodegenerative Delay (MIND) Diets Are Associated with Less Cognitive Decline and a Lower Risk of Alzheimer’s Disease—A Review. Adv. Nutr. 2019, 10, 1040–1065. [Google Scholar] [CrossRef]
- Colho, H.J.; Trichopoulou, A.; Panza, F. Cross-sectional and longitudinal associations between adherence to Mediterranean diet with physical performance and cognitive function in older adults: A systematic review and meta-analysis. Ageing Res. Rev. 2021, 70, 20. [Google Scholar] [CrossRef]
- Shishtar, E.; Rogers, G.T.; Blumberg, J.B.; Au, R.D.; Jacques, P.F. Long-term dietary flavonoid intake and change in cognitive function in the Framingham Offspring cohort. Public Health Nutr. 2020, 23, 1576–1588. [Google Scholar] [CrossRef]
- Suh, S.W.; Kim, H.S.; Han, J.H.; Bae, J.B.; Oh, D.J.; Han, J.W.; Kim, K.W. Efficacy of Vitamins on Cognitive Function of Non-Demented People: A Systematic Review and Meta-Analysis. Nutrients 2020, 12, 17. [Google Scholar] [CrossRef] [Green Version]
- Calder, P.C. Marine omega-3 fatty acids and inflammatory processes: Effects, mechanisms and clinical relevance. Biochim. Biophys. Acta Mol. Cell Biol. Lipids 2015, 1851, 469–484. [Google Scholar] [CrossRef]
- Duvall, M.G.; Levy, B.D. DHA- and EPA-derived resolvins, protectins, and maresins in airway inflammation. Eur. J. Pharmacol. 2016, 785, 144–155. [Google Scholar] [CrossRef] [PubMed] [Green Version]
- Aleksandrova, K.; Koelman, L.; Rodrigues, C.E. Dietary patterns and biomarkers of oxidative stress and inflammation: A systematic review of observational and intervention studies. Redox Biol. 2021, 42, 16. [Google Scholar] [CrossRef] [PubMed]
- Marsland, A.L.; Gianaros, P.J.; Kuan, D.C.H.; Sheu, L.K.; Krajina, K.; Manuck, S.B. Brain morphology links systemic inflammation to cognitive function in midlife adults. Brain Behav. Immun. 2015, 48, 195–204. [Google Scholar] [CrossRef] [PubMed] [Green Version]
- Liu, Z.W.; Zhou, T.Y.; Ziegler, A.C.; Dimitrion, P.; Zuo, L. Oxidative Stress in Neurodegenerative Diseases: From Molecular Mechanisms to Clinical Applications. Oxidative Med. Cell. Longev. 2017, 2017, 11. [Google Scholar] [CrossRef] [PubMed]
- Mohan, D.; Yap, K.H.; Reidpath, D.; Soh, Y.C.; McGrattan, A.; Stephan, B.C.M.; Robinson, L.; Chaiyakunapruk, N.; Siervo, M.; De, P.E.C.T. Link Between Dietary Sodium Intake, Cognitive Function, and Dementia Risk in Middle-Aged and Older Adults: A Systematic Review. J. Alzheimers Dis. 2020, 76, 1347–1373. [Google Scholar] [CrossRef]
- Muth, A.K.; Park, S.Q. The impact of dietary macronutrient intake on cognitive function and the brain. Clin. Nutr. 2021, 40, 3999–4010. [Google Scholar] [CrossRef]
- Pearson, T.A.; Mensah, G.A.; Alexander, R.W.; Anderson, J.L.; Cannon, R.O.; Criqui, M.; Fadl, Y.Y.; Fortmann, S.P.; Hong, Y.; Myers, G.L.; et al. Markers of inflammation and cardiovascular disease application to clinical and public health practice—A statement for healthcare professionals from the centers for disease control and prevention and the American Heart Association. Circulation 2003, 107, 499–511. [Google Scholar] [CrossRef]
- Biessels, G.J.; Whitmer, R.A. Cognitive dysfunction in diabetes: How to implement emerging guidelines. Diabetologia 2020, 63, 3–9. [Google Scholar] [CrossRef] [Green Version]
- Villringer, A.; Laufs, U. Heart failure, cognition, and brain damage. Eur. Heart J. 2021, 42, 1579–1581. [Google Scholar] [CrossRef]


| Characteristics | Total | Underweight | Normal | Overweight | Obese | p Value |
|---|---|---|---|---|---|---|
| N | 4792 | 888 | 2658 | 929 | 317 | |
| BMI (kg/m2) * | 22.02 ± 4.46 | 16.98 ± 1.28 | 21.20 ± 1.52 | 25.58 ± 1.12 | 32.53 ± 6.94 | <0.001 |
| PDI score * | 48.71 ± 6.05 | 47.02 ± 6.34 | 48.69 ± 6.02 | 49.90 ± 5.43 | 50.12 ± 5.98 | <0.001 |
| hPDI score * | 54.09 ± 5.38 | 52.56 ± 5.49 | 54.06 ± 5.40 | 55.32 ± 4.83 | 55.07 ± 5.31 | <0.001 |
| uPDI score * | 42.78 ± 6.65 | 44.43 ± 6.53 | 42.87 ± 6.55 | 41.50 ± 6.58 | 41.18 ± 6.95 | <0.001 |
| Age, years * | 80.70 ± 9.58 | 84.38 ± 9.87 | 80.71 ± 9.49 | 78.11 ± 8.76 | 77.91 ± 8.37 | <0.001 |
| Sex, male ** | 2425 (50.61) | 390 (43.92) | 1447 (54.44) | 466 (50.16) | 122 (38.49) | <0.001 |
| Residence ** | <0.001 | |||||
| City | 782 (16.32) | 78 (8.78) | 400 (15.05) | 224 (24.11) | 80 (25.24) | |
| Town | 1517 (31.66) | 261 (29.39) | 861 (32.39) | 287 (30.89) | 108 (34.07) | |
| Rural | 2493 (52.02) | 549 (61.82) | 1397 (52.56) | 418 (44.99) | 129 (40.69) | |
| Illiterate ** | 2339 (48.81) | 508 (57.21) | 1280 (48.16) | 406 (43.70) | 145 (45.74) | <0.001 |
| Financial independence ** | 1157 (24.14) | 114 (12.84) | 595 (22.39) | 324 (34.88) | 124 (39.12) | <0.001 |
| With regular exercise ** | 1997 (41.67) | 301 (33.90) | 1090 (41.01) | 439 (47.26) | 147 (46.37) | <0.001 |
| Smoking status ** | <0.001 | |||||
| Never smoker | 2972 (62.02) | 560 (63.06) | 1571 (59.10) | 604 (65.02) | 237 (74.76) | |
| Former smoker | 772 (16.11) | 122 (13.74) | 460 (17.31) | 153 (16.47) | 37 (11.67) | |
| Current smoker | 1048 (21.87) | 206 (23.20) | 627 (23.59) | 172 (18.51) | 43 (13.56) | |
| Alcohol consumption ** | <0.001 | |||||
| Never drinker | 3133 (65.38) | 612 (68.92) | 1676 (63.05) | 616 (66.31) | 229 (72.24) | |
| Former drinker | 681 (14.21) | 97 (10.92) | 403 (15.16) | 134 (14.42) | 47 (14.83) | |
| Current drinker | 978 (20.41) | 179 (20.16) | 579 (21.78) | 179 (19.27) | 41 (12.93) | |
| Occupation ** | 0.156 | |||||
| Professional and technical personnel | 201 (4.19) | 18 (2.03) | 111 (4.18) | 55 (5.92) | 17 (5.36) | |
| Governmental, institutional, or managerial personnel | 165 (3.44) | 13 (1.46) | 78 (2.93) | 52 (5.60) | 22 (6.94) | |
| Commercial, service, or industrial worker | 578 (12.06) | 56 (6.31) | 300 (11.29) | 161 (17.33) | 61 (19.24) | |
| Self-employed | 81 (1.69) | 12 (1.35) | 42 (1.58) | 22 (2.37) | 5 (1.58) | |
| Agricultural, forestry, animal husbandry, or fishery worker | 2972 (62.02) | 638 (71.85) | 1692 (63.66) | 482 (51.88) | 160 (50.47) | |
| Houseworker | 213 (4.44) | 50 (5.63) | 101 (3.80) | 47 (5.06) | 15 (4.73) | |
| Military personnel | 32 (0.67) | 3 (0.34) | 22 (0.83) | 5 (0.54) | 2 (0.63) | |
| Never worked | 16 (0.33) | 2 (0.23) | 9 (0.34) | 3 (0.32) | 2 (0.63) | |
| Others | 534 (11.14) | 96 (10.81) | 303 (11.40) | 102 (10.98) | 33 (10.41) | |
| Disease score *** | 1 (1) | 1 (1) | 1 (1) | 1 (1) | 1 (1) | <0.001 |
| Hypertension ** | 1480 (30.88) | 177 (19.93) | 749 (28.18) | 394 (42.41) | 160 (50.47) | <0.001 |
| Diabetes ** | 230 (4.80) | 16 (1.80) | 95 (3.57) | 83 (8.93) | 36 (11.36) | <0.001 |
| Heart diseases ** | 332 (6.93) | 42 (4.73) | 174 (6.55) | 90 (9.69) | 26 (8.20) | <0.001 |
| Stroke ** | 342 (7.14) | 44 (4.95) | 44 (1.66) | 109 (11.73) | 189 (59.62) | 0.001 |
| Cancer ** | 27 (0.56) | 4 (0.45) | 13 (0.49) | 10 (1.08) | 0 (0.00) | 0.093 |
| Respiratory disease ** | 534 (11.14) | 124 (13.96) | 281 (10.57) | 90 (9.69) | 39 (12.30) | 0.008 |
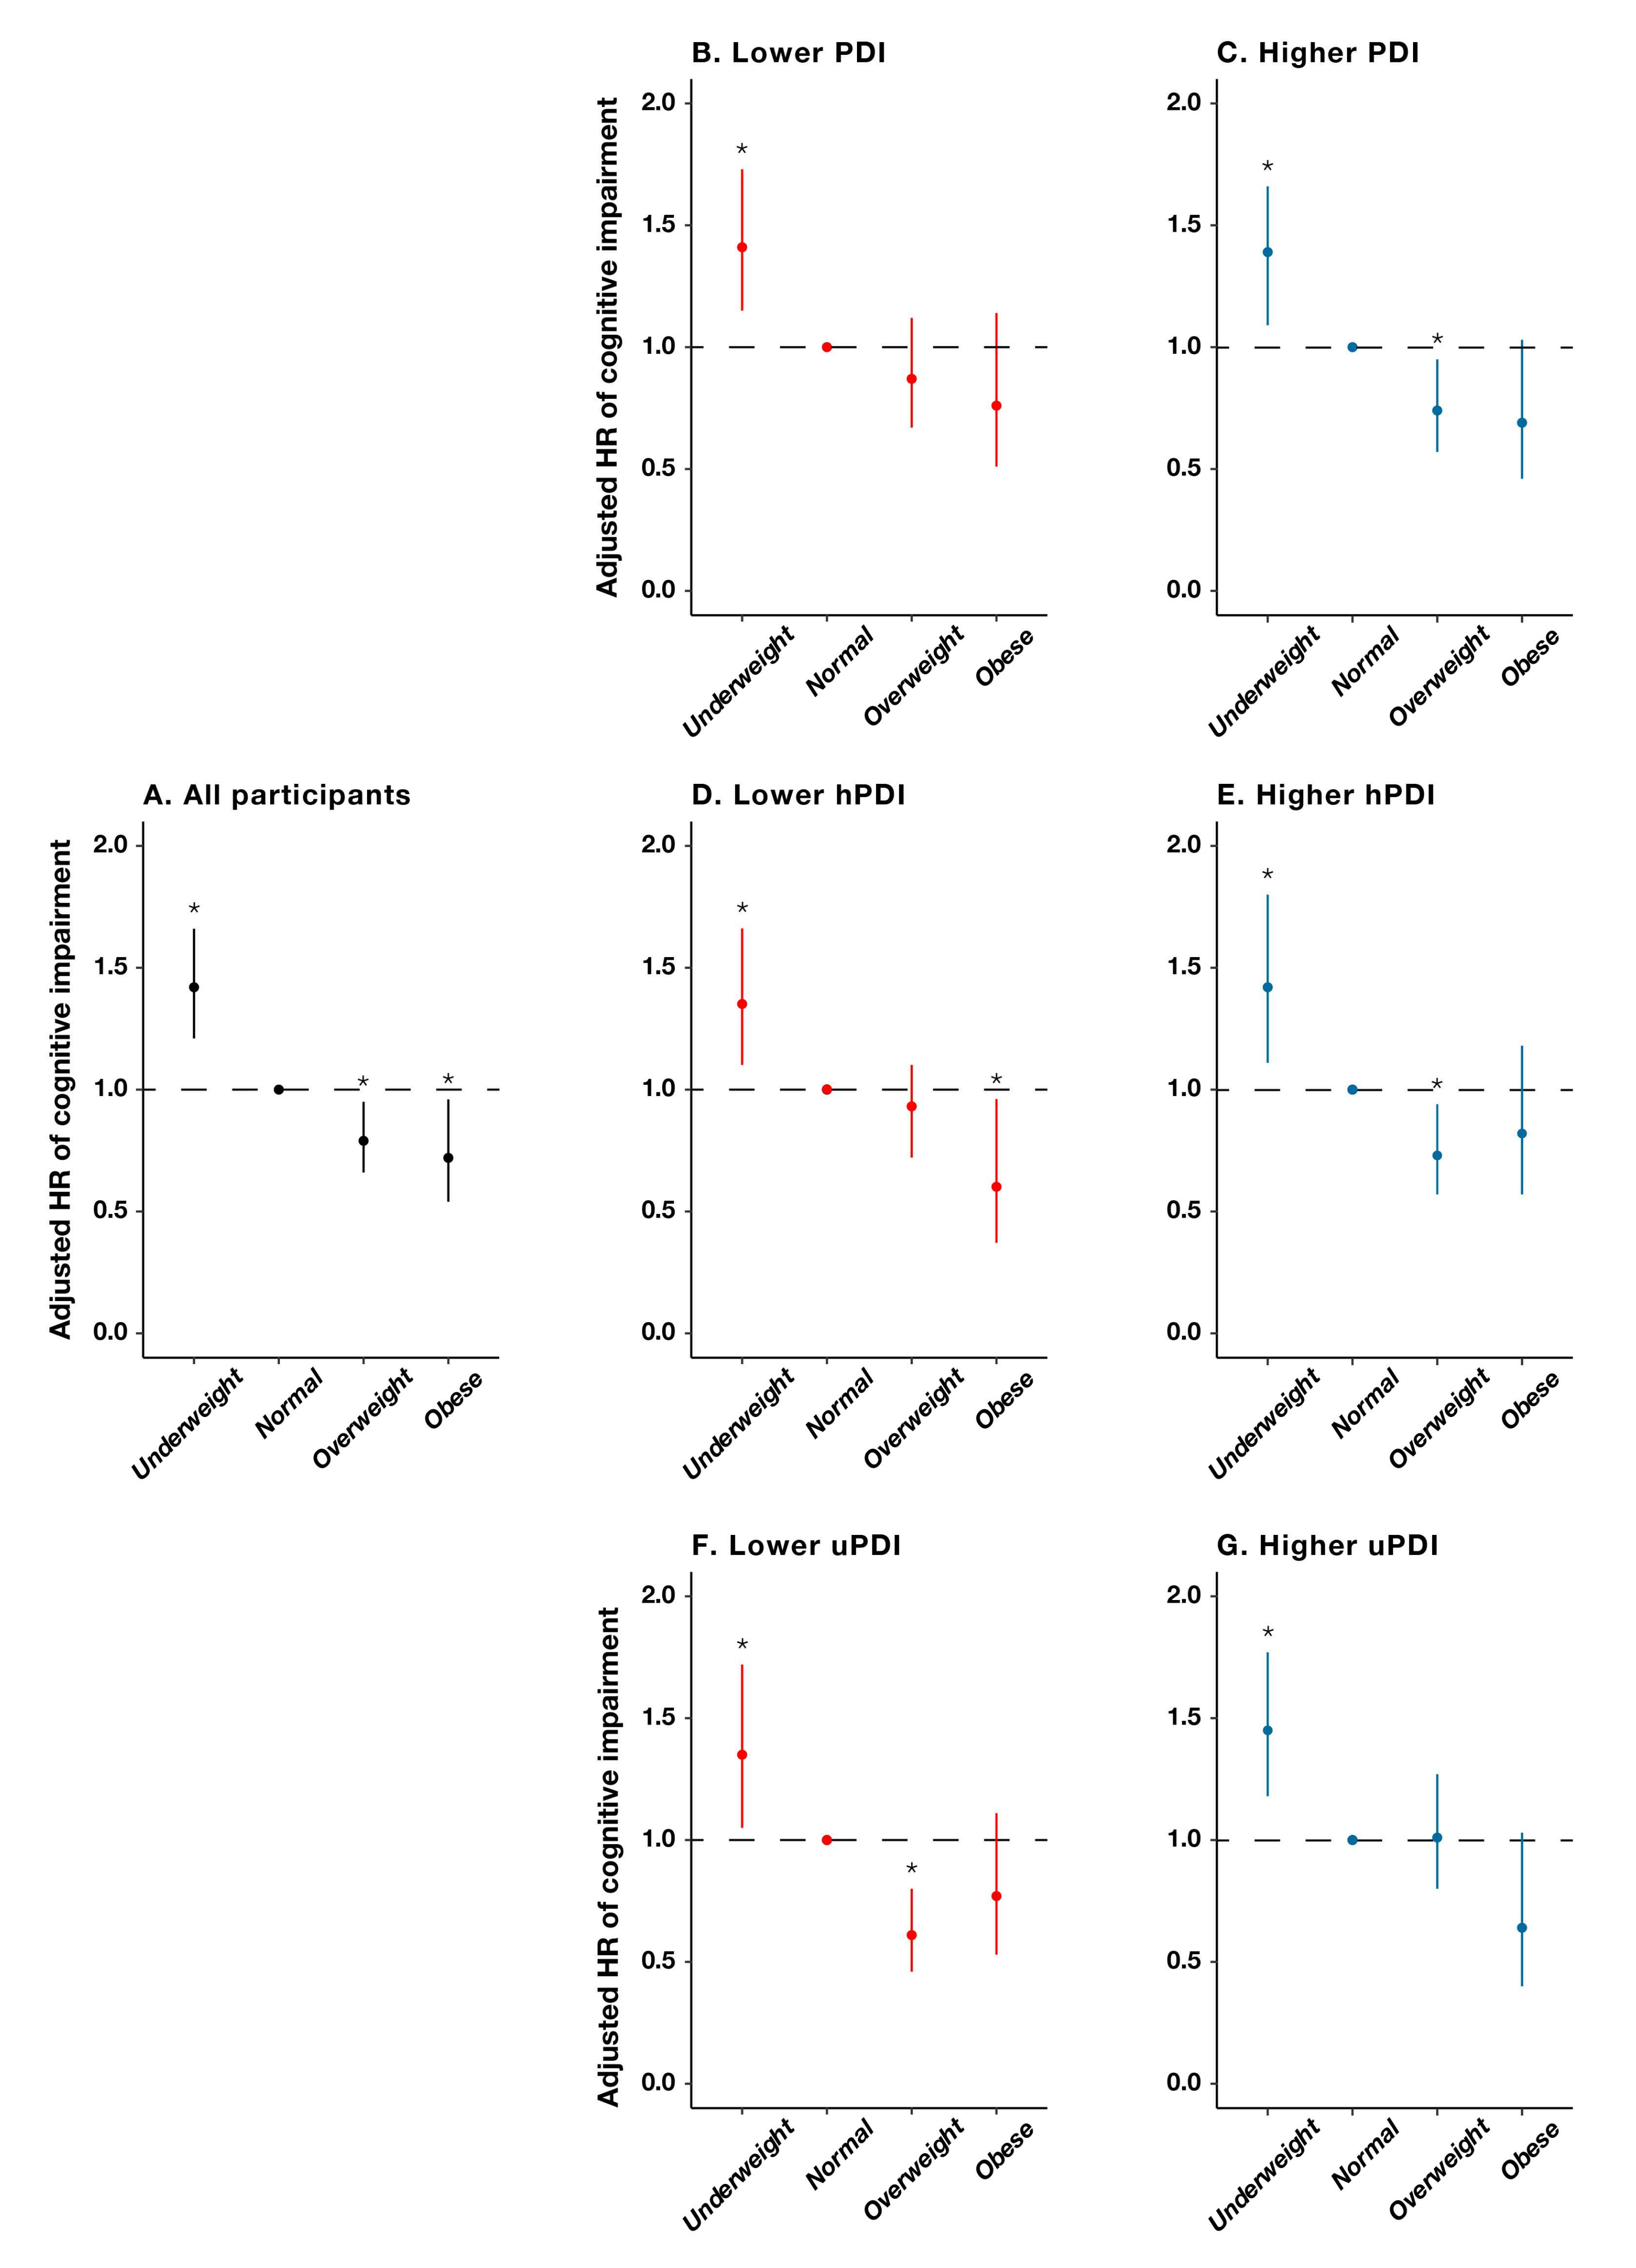
| Events | Participants | Person-Years | HR (95% CI) a | p Value | |
|---|---|---|---|---|---|
| Underweight | 263 | 888 | 4072 | 1.42 (1.21–1.66) | <0.001 |
| Normal | 579 | 2658 | 13,498 | 1.00 | |
| Overweight | 172 | 929 | 4891 | 0.79 (0.66–0.95) | 0.010 |
| Obese | 63 | 317 | 1695 | 0.72 (0.54–0.96) | 0.026 |
| Events | Participants | Person-Years | HR (95% CI) a | p Value | |
|---|---|---|---|---|---|
| Stratified by PDI | |||||
| Lower PDI | 594 | 2274 | 11,330 | 1.32 (1.16–1.50) | <0.001 |
| Higher PDI | 483 | 2518 | 12,826 | 1.00 | |
| Stratified by hPDI | |||||
| Lower hPDI | 561 | 2081 | 10,295 | 1.46 (1.29–1.66) | <0.001 |
| Higher hPDI | 516 | 2711 | 13,861 | 1.00 | |
| Stratified by uPDI | |||||
| Lower uPDI | 480 | 2462 | 12,490 | 1.00 | |
| Higher uPDI | 597 | 2330 | 11,666 | 1.21 (1.06–1.38) | 0.004 |
| Events | Participants | Person-Years | HR (95% CI) a | p Value | |
|---|---|---|---|---|---|
| Stratified by PDI | |||||
| Lower PDI | |||||
| Underweight | 163 | 514 | 2346 | 1.41 (1.15–1.73) | 0.001 |
| Normal | 314 | 1263 | 6373 | 1.00 | |
| Overweight | 88 | 370 | 1966 | 0.87 (0.67–1.12) | 0.267 |
| Obese | 29 | 127 | 645 | 0.76 (0.51–1.14) | 0.188 |
| Higher PDI | |||||
| Underweight | 100 | 374 | 1726 | 1.39 (1.09–1.77) | 0.007 |
| Normal | 265 | 1395 | 7125 | 1.00 | |
| Overweight | 84 | 559 | 2925 | 0.74 (0.57–0.95) | 0.017 |
| Obese | 34 | 190 | 1050 | 0.69 (0.46–1.03) | 0.068 |
| Stratified by hPDI | |||||
| Lower hPDI | |||||
| Underweight | 163 | 487 | 2221 | 1.35 (1.10–1.66) | 0.004 |
| Normal | 299 | 1172 | 5840 | 1.00 | |
| Overweight | 77 | 310 | 1630 | 0.93 (0.72–1.10) | 0.568 |
| Obese | 22 | 112 | 604 | 0.60 (0.37–0.96) | 0.035 |
| Higher hPDI | |||||
| Underweight | 100 | 401 | 1851 | 1.42 (1.11–1.80) | 0.005 |
| Normal | 280 | 1486 | 7658 | 1.00 | |
| Overweight | 95 | 619 | 3261 | 0.73 (0.57 –0.94) | 0.013 |
| Obese | 41 | 205 | 1091 | 0.82 (0.57–1.18) | 0.284 |
| Stratified by uPDI | |||||
| Lower uPDI | |||||
| Underweight | 98 | 372 | 1692 | 1.35 (1.05–1.72) | 0.017 |
| Normal | 271 | 1348 | 6860 | 1.00 | |
| Overweight | 71 | 539 | 2837 | 0.61 (0.46–0.80) | <0.001 |
| Obese | 40 | 203 | 1101 | 0.77 (0.53–1.11) | 0.158 |
| Higher uPDI | |||||
| Underweight | 165 | 516 | 2380 | 1.45 (1.18–1.77) | <0.001 |
| Normal | 308 | 1310 | 6638 | 1.00 | |
| Overweight | 101 | 390 | 2054 | 1.01 (0.80–1.27) | 0.955 |
| Obese | 23 | 114 | 594 | 0.64 (0.40–1.03) | 0.066 |
Publisher’s Note: MDPI stays neutral with regard to jurisdictional claims in published maps and institutional affiliations. |
© 2022 by the authors. Licensee MDPI, Basel, Switzerland. This article is an open access article distributed under the terms and conditions of the Creative Commons Attribution (CC BY) license (https://creativecommons.org/licenses/by/4.0/).
Share and Cite
Liang, F.; Fu, J.; Turner-McGrievy, G.; Wang, Y.; Qiu, N.; Ding, K.; Zeng, J.; Moore, J.B.; Li, R. Association of Body Mass Index and Plant-Based Diet with Cognitive Impairment among Older Chinese Adults: A Prospective, Nationwide Cohort Study. Nutrients 2022, 14, 3132. https://doi.org/10.3390/nu14153132
Liang F, Fu J, Turner-McGrievy G, Wang Y, Qiu N, Ding K, Zeng J, Moore JB, Li R. Association of Body Mass Index and Plant-Based Diet with Cognitive Impairment among Older Chinese Adults: A Prospective, Nationwide Cohort Study. Nutrients. 2022; 14(15):3132. https://doi.org/10.3390/nu14153132
Chicago/Turabian StyleLiang, Fang, Jialin Fu, Gabrielle Turner-McGrievy, Yechuang Wang, Nan Qiu, Kai Ding, Jing Zeng, Justin B. Moore, and Rui Li. 2022. "Association of Body Mass Index and Plant-Based Diet with Cognitive Impairment among Older Chinese Adults: A Prospective, Nationwide Cohort Study" Nutrients 14, no. 15: 3132. https://doi.org/10.3390/nu14153132