Review

Latest Trends on Tree Classification and Segmentation Using UAV Data—A Review of Agroforestry Applications

1
Associação para o Desenvolvimento da Aerodinâmica Industrial, Universidade de Coimbra, 3030-289 Coimbra, Portugal
2
IDMEC, Instituto Superior Técnico, Universidade de Lisboa, 1049-001 Lisbon, Portugal
*
Author to whom correspondence should be addressed.
Remote Sens. 2023, 15(9), 2263; https://doi.org/10.3390/rs15092263
Submission received: 13 March 2023 / Revised: 13 April 2023 / Accepted: 18 April 2023 / Published: 25 April 2023
(This article belongs to the Special Issue Image Analysis for Forest Environmental Monitoring)

Abstract

:
When it comes to forest management and protection, knowledge is key. Therefore, forest mapping is crucial to obtain the required knowledge towards profitable resource exploitation and increased resilience against wildfires. Within this context, this paper presents a literature review on tree classification and segmentation using data acquired by unmanned aerial vehicles, with special focus on the last decade (2013–2023). The latest research trends in this field are presented and analyzed in two main vectors, namely: (1) data, where used sensors and data structures are resumed; and (2) methods, where remote sensing and data analysis methods are described, with particular focus on machine learning approaches. The study and review methodology filtered 979 papers, which were then screened, resulting in the 144 works included in this paper. These are systematically analyzed and organized by year, keywords, purpose, sensors, and methods used, easily allowing the readers to have a wide, but at the same time detailed, view of the latest trends in automatic tree classification and segmentation using unmanned aerial vehicles. This review shows that image processing and machine learning techniques applied to forestry and segmentation and classification tasks are focused on improving the accuracy and interpretability of the results by using multi-modal data, 3D information, and AI methods. Most works use RGB or multispectral cameras, or LiDAR scanners, individually. Classification is mostly carried out using supervised methods, while segmentation mostly uses unsupervised machine learning techniques.

Graphical Abstract

1. Introduction

Forests play a crucial role in maintaining the Earth’s biodiversity and ecological balance, regulating the climate, and providing a wide range of resources for human use. Mapping forests is an essential tool for understanding, managing, and protecting these vital ecosystems. One of the primary reasons for mapping forests is conservation [1]. Forest maps can be used to identify and protect areas of high biodiversity and ecological significance. These maps can also help to identify and prioritize areas for conservation efforts, such as the creation of protected areas or the implementation of sustainable forestry practices. Another important reason for mapping forests is to monitor and understand the impact of climate change [2]. Forests play a critical role in regulating the Earth’s climate by absorbing and storing carbon, and changes in forest cover can have a significant impact on global carbon cycles. Forest maps can be used to track changes in forest cover over time, and to assess the impact of these changes on the Earth’s climate. In addition, forest maps are an important tool for resource management [3]. They can be used to manage and sustainably utilize forest resources, such as timber and non-timber products. These maps can also help to identify areas where the extraction of resources would have the least impact on the ecosystem. Disaster risk management is another important motivation for mapping forests [4]. Forest maps can be used to identify areas at risk from natural hazards such as wildfires and landslides, and to support emergency response planning and prevention actions. This is especially important in the so-called wildland-urban interface, which are areas where human settlements and infrastructure are located near or within forests. Finally, forest maps are an important tool for land-use planning and infrastructure development [5]. These maps can help to minimize the negative impact on forests and other ecosystems by identifying areas where development should be avoided or limited. They also inform about the possibilities of sustainable development in the forested area.
Unmanned aerial vehicles (UAVs), also known as drones, have revolutionized the way forests are mapped [6]. UAVs may be equipped with a variety of sensors [7], such as high-resolution [8] and multi- and hyperspectral cameras [9] and LiDAR (light detection and ranging) scanners, which can collect detailed data on forest structure, composition, and change. These data can then be used to create accurate and up-to-date forest maps. One of the main advantages of UAV technology is its ability to collect high-resolution data at a relatively low cost. Traditional mapping methods, such as satellite imagery or ground-based surveys, can be expensive and time-consuming. UAVs, on the other hand, can quickly and efficiently collect data over large areas, even in remote or inaccessible locations. Another advantage of UAVs is their ability to collect data at different scales [10]. For example, UAVs can be flown at low altitudes to collect high-resolution data on individual trees, or at higher altitudes to map large areas of forest. This flexibility allows for the creation of detailed maps that can be used for a wide range of applications. UAVs are also useful for monitoring changes in forest cover over time. By collecting data on a regular basis, UAVs can help to identify areas where forest cover is decreasing or changing in other ways. This information can be used to support conservation and management decisions, as well as to assess the impact of human activities on forests. UAVs also have the ability to fly at lower altitudes with high accuracy and control; therefore, becoming very useful in the mapping of topography [11]. This is important for determining the forest slope, aspect, and elevation, which are important factors in understanding its structure and its ecological characteristics. These data are also important for natural hazard models, such as wildfires [12] or landslides [13]. Although clearly contributing to the state-of-art of forests mapping, UAV usage still has growth potential [14], as they are not without limitations, e.g., endurance, operation conditions, or payload capacity [15]. Nevertheless, they still prove to be interesting platforms to complement existing remote sensing means.
Besides platforms and sensors, data processing methods are another key part of the mapping process with remote sensing [16]. Data analysis and machine learning are powerful tools that are increasingly being used to map and understand forests. These techniques allow for the efficient processing and interpretation of large amounts of data, which can be used to create accurate and detailed maps of forest structure and composition. Similar to platforms and sensors, machine learning algorithms and techniques have also been improved substantially over the past decade. The latest advances in neural networks and deep learning methods in applications such as autonomous vehicles have paved the way for these image-processing techniques to be developed and tailored specifically for vegetation mapping applications [17]. Despite still being in the early stages of development for this specific application when compared, e.g., with autonomous driving [18], these methods show great potential in terms of accuracy and ease of data handling [19,20].
Although there have been numerous review papers addressing the use of UAV systems in remote sensing and forestry applications [6,21,22,23,24,25], as well as reviews that focus on the methods used [8,26], this work goes one step further by identifying and relating UAV sensors’ payload with the methods used for forestry applications of tree classification and segmentation.
To summarize, there are several aspects to take into account when it comes to using UAVs for vegetation mapping: the object of interest, the platforms, the sensors and the data structure, and the data processing methods. This work aims to review the existing methods and latest emerging techniques used in vegetation mapping that fall under these categories. The reviewed works included in this paper, after search and screening procedures, are systematically analyzed and organized by year, keywords, purpose, sensors, and methods used, easily allowing the readers to have a wide, but at the same time detailed, view of the latest trends in automatic tree classification and segmentation using unmanned aerial vehicles.
The remainder of this paper is structured as follows: Section 2 describes the methodology used in this work and the review procedure. Section 3 describes different types of sensors used with UAV platforms in forest and tree mapping applications and their corresponding data structure. Section 4 contains a description of well-known methods in remote sensing and data analysis for the creation of basic tools used in forestry and land mapping applications. Section 5 dwells on machine learning (ML) and data analysis methods for image and data processing. Finally, Section 6 presents the study conclusions.

2. Review Methodology

Choosing a collection of papers to review requires a systematic and repeatable approach that highlights that particular collection’s scientific significance. This section focuses on explaining the methodology followed in this review work, providing analysis on relative aspects of the reviewed papers that can be helpful for grasping the ideas and methods behind them, which are further explained in the next sections.
There are four main aspects in vegetation mapping using remote sensing: 1—the object of interest, 2—platforms that carry the sensors, 3—sensors and data structures, and 4—data analysis. Regarding the object of interest, the focus of this work can be generally described as trees, which includes forest environments, orchards, etc. Regarding the platforms, this paper focuses on UAVs as the latest emerging technology in vegetation and land mapping. Narrowing down the carrying platforms to UAVs also eliminates a wide range of sensors, data structures, and formats that require manned aircraft or satellites, consequently also affecting the respective analysis methods and techniques. A total of four keywords, namely, UAV, tree, segmentation, and classification, were used to search peer-reviewed papers, using the Google Scholar search engine implemented in Harzing’s Publish or Perish software. The search was limited to the time span of 2013 to 2023 and the searching process was closed in November 2022. The search resulted in 979 peer-reviewed papers. Elimination of irrelevant search results (non-UAV platforms and non-tree objects of interest) was carried out based on context, derived from the title, keywords, abstract, and methodology. The final number of chosen papers after screening and filtering is 144 peer-reviewed papers. It is worth mentioning that a number of relevant papers may have been left out of this review, due to the selection methodology adopted or search keyword mismatch. However, it is believed that selected papers are representative of the current state-of-the-art in this topic. Figure 1 shows the process of selecting the papers and the number of resulting papers at each stage.
The search with the four keywords and within the indicated time-span revealed an exponential growth over the years (see Figure 2), an indication of the emergence of the UAV technology and analysis methods such as Deep Learning in vegetation mapping in the past few years.
A word-cloud info-graph created from all the keywords of the 144 selected papers is presented in Figure 3, highlighting the most frequent or significant keywords in the papers.
Furthermore, an analysis of the terms used in the title and the abstract of the papers is carried out using VOSViewer [27]—see Figure 4. VOSviewer is a software tool for creating maps using network data and to visualize and explore these maps. By default, VOSviewer assigns the nodes in a network to clusters. A cluster is a set of closely related nodes. Each node in a network is assigned to exactly one cluster. The terms frequency is represented by the respective node size and the node color represents statistically derived clusters determined using the node-repulsion LinLog method [28].
By reading through each one of these 144 papers and identifying the methodology used for data processing, a general high-level procedure pipeline was defined that aggregates and condenses this information. Although not all the papers follow the entire pipeline (depending on the objectives and methodologies used in them), the big majority of them follow at least one part of it. Figure 5 demonstrates this pipeline, where rectangles represent data and round-corner rectangles represent actions. Also note that if two arrows enter an action that means the action may be applied to either of the inputs or data types, and not that both inputs are required (e.g., neural network-based machine learning can be applied both to segmented images or point clouds). Similarly, if a data type receives two arrows, it means that the data may be obtained by either of the input actions, e.g., point clouds may either be obtained from UAV-born laser scanning or applying the structure from the motion procedure. It is important to mention that the depicted pipeline represents the general and most common procedure employed in the reviewed papers and does not cover every possible approach. For example, aerial images or point clouds can be directly fed to a neural network pipeline without any prior pre-processing steps, but this will reduce the assessment quality since the data are not normalized, denoised, or filtered, and therefore, errors may be introduced into the system.

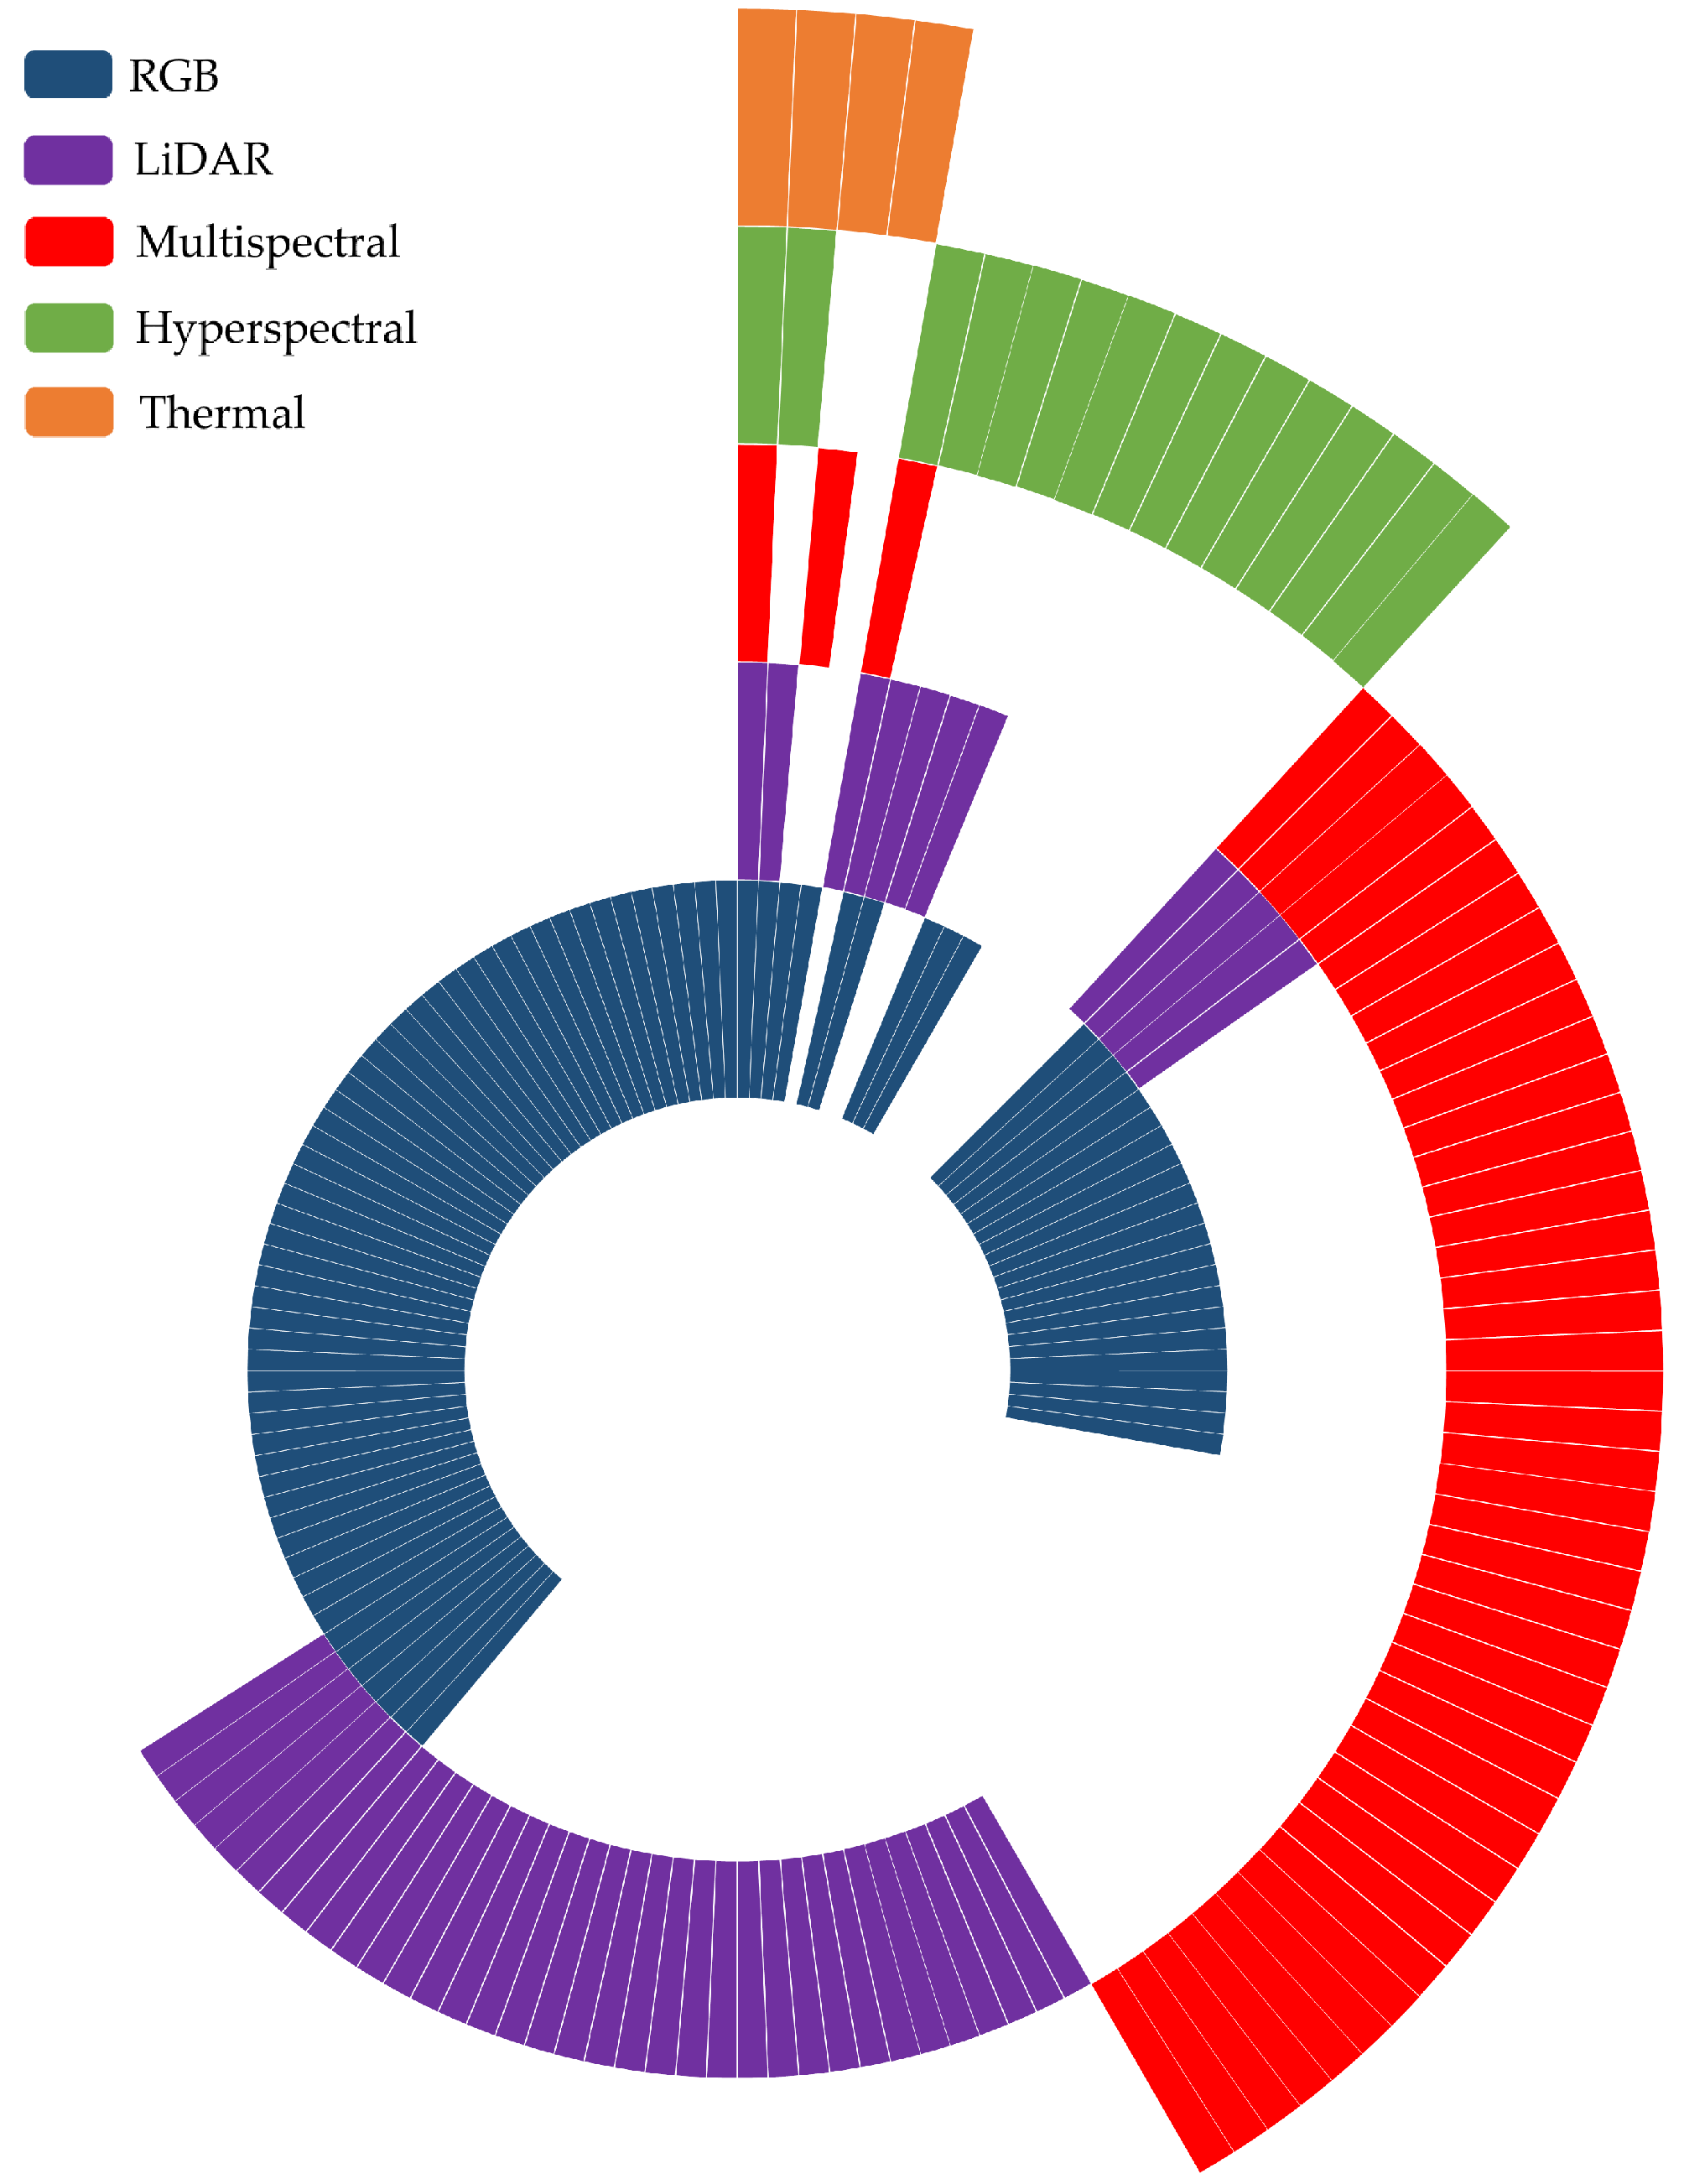
3. Sensors and Data Structure
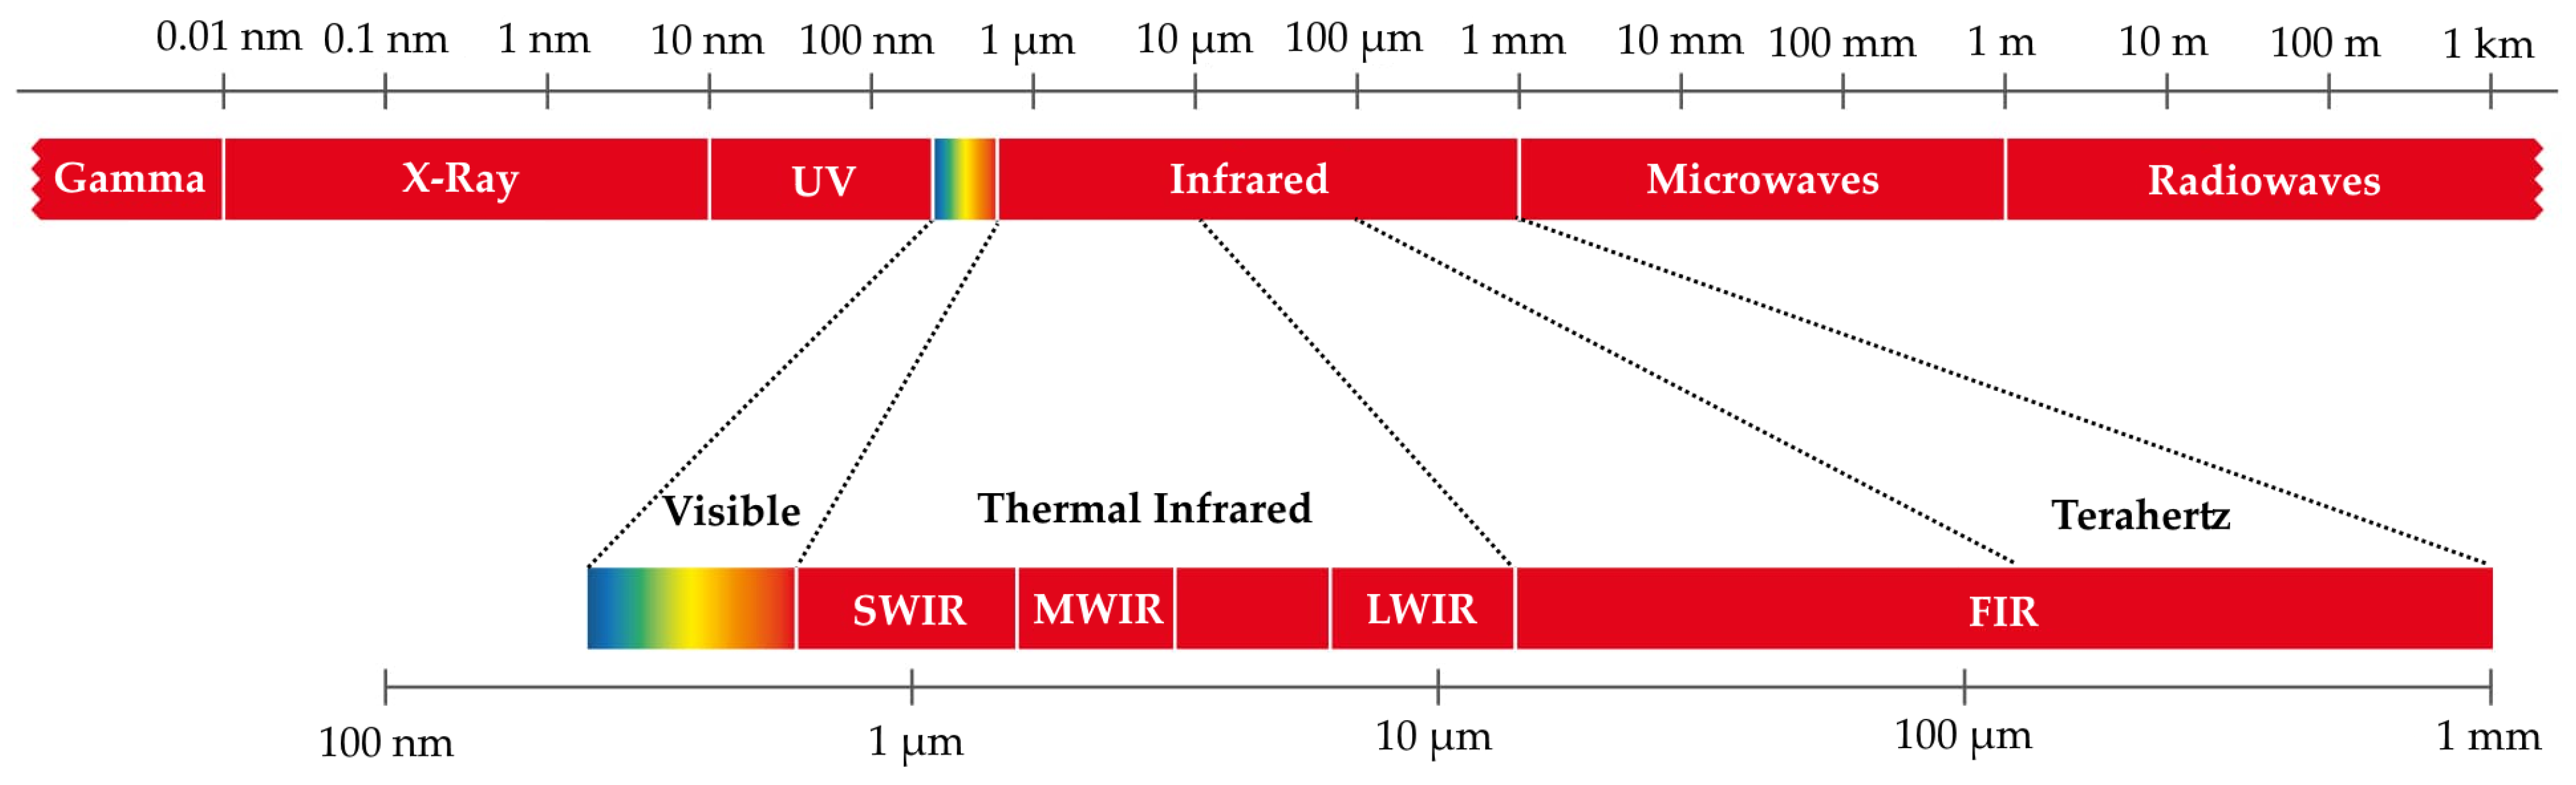
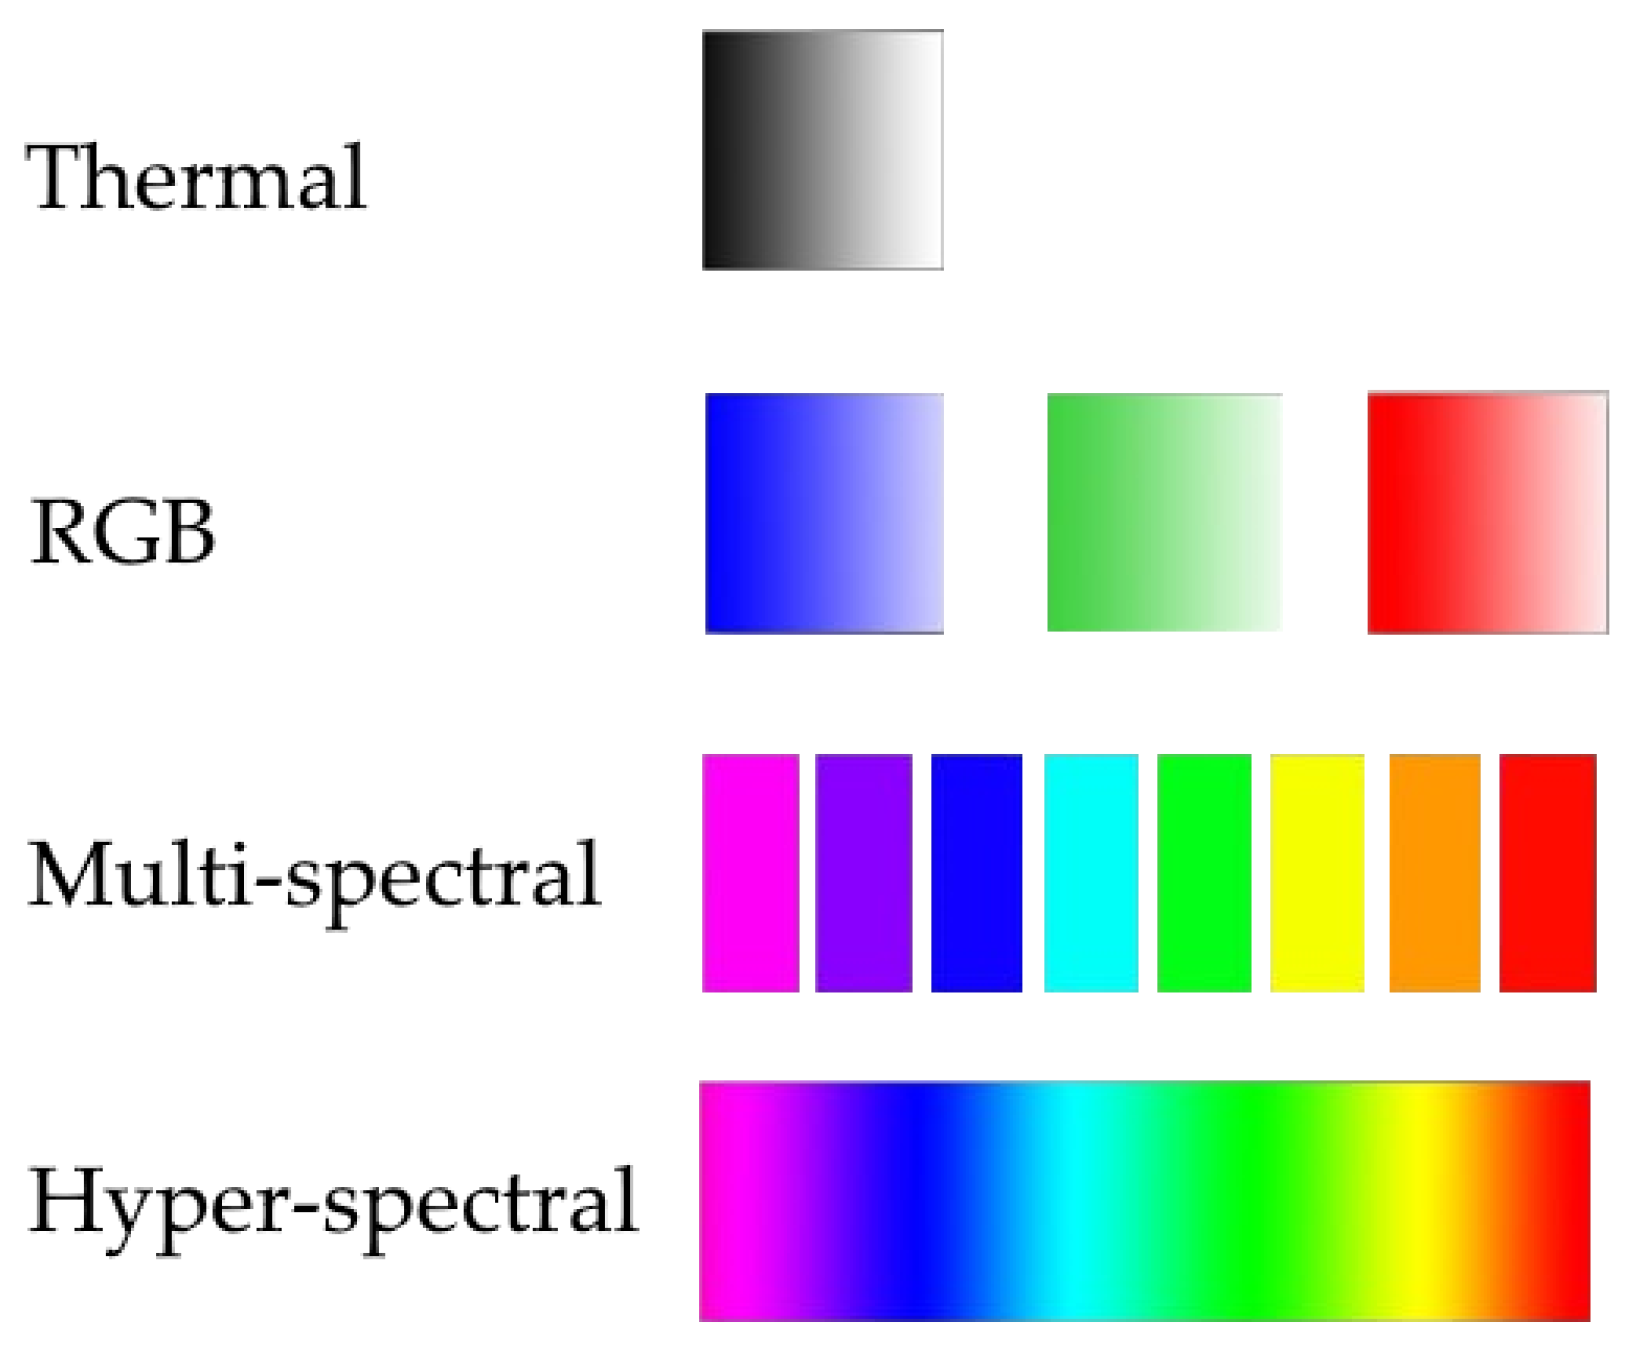
Going through the literature, one can see that five types of sensors are commonly used with UAV platforms in forestry and forest mapping applications: RGB cameras, multispectral cameras, hyperspectral cameras, thermal cameras, and LiDAR sensors, where these can either be used individually or combined. Figure 6 depicts the sensors used in the reviewed papers, where each slice of the pie is one paper. One can see that some papers only use one type of sensor, while others use different combinations of them. The most used sensor is the RGB camera, followed by the LiDAR and multispectral cameras.
The fundamental difference between these sensors is the type of data structure they provide as an output. This section describes the different sensors and respective data structures used in the reviewed papers, as well as the basic digital models or representations constructed from the data.

3.1. Spectral Data

Spectral sensors (thermal, RGB, multi- and hyperspectral cameras) are passive sensors, relying on external illumination, recording a certain number of spectral bands in a specific wavelength range in the electromagnetic spectrum (Figure 7 and Figure 8). The output format is a multilayered tensor in which the number of layers depends on the number of the spectral bands that the sensor records, e.g., the thermal camera output is an intensity or gray-scale image (one-layer tensor) covering part of the infra-red spectrum, while the RGB camera output is a three-layer tensor for the Red, Green and Blue bands of the visible spectrum. Multi- and hyperspectral cameras normally record 4 to 15 and 100 to 200 bands, respectively, of the visible spectrum as well. Note that it is not the number of bands alone that differentiates the multi- and hyperspectral cameras, but the sensitivity of the camera itself. For example, a camera capable of recording 20 bands can also be a hyperspectral camera if the bands are narrow enough and cover a small range of the spectrum, giving a sense of continuous measurement of the spectrum as opposed to a more discrete one [29,30]. The representation of this data type is a single or multi-layered image in which each image or tensor layer describes a color (or spectral channel) and tensor arrays over layers describe pixels, the extension of which depends on the format, e.g., JPG, PNG, or TIF.
Spectral indices, the primary tools for spectral analysis, are combinations of spectral reflectance from two or more wavelengths that indicate the relative abundance (or lack) of spectral features of interest. Therefore, spectral indices are formulated based on the reflectivity behavior of objects of interest, e.g., vegetation, soil, man-made objects, etc. Vegetation indices have been studied thoroughly and reviewed in different works such as [31]. Choosing the right set of bands or indices (and the appropriate sensor) plays a crucial role in the assessment quality, because when it comes to machine learning methods, feature engineering is a critical and decisive step. This will be further discussed in Section 5.

3.2. Structural Data

Structural data is the other data type used in vegetation mapping applications, a digital three-dimensional representation of objects of interest. Known as a point cloud, it is a set of data points in 3D space, where each point may be identified in the data structure by its coordinates, intensity, semantic label, or any other relevant attribute. Generally speaking, any type of geometry in space can be considered structural data, but in forestry and vegetation mapping applications point clouds are the basis for further geometrical analysis.
LiDARs used to be the primary source of point cloud sets, but with the recent advances in the field of computer vision and the increase in computer processing capacity, photogrammetry techniques are now reliable and robust solutions to reconstruct the 3D scenery, being performed in the majority of papers that use spectral sensors. The dominant technique used is Structure from motion (SfM). Structure from motion is a computer vision technique for estimating the 3D structure of a scene from a set of 2D images. The basic idea is to take a series of photos of a scene from different viewpoints, and then use the information in those photos to reconstruct a 3D model of the scene. In practice, SfM algorithms typically work by first detecting and matching feature points across the images (such as corners or blobs) using techniques such as Dense Image Matching [32,33,34,35,36], and then using those correspondences to estimate the camera poses (i.e., the position and orientation of the camera in each image). Once the camera poses have been estimated, the 3D structure of the scene can be reconstructed by triangulation, which involves finding the intersection of the rays that project the feature points in each image back into 3D space. SfM is a popular method due to its efficiency in handling large amounts of data and with relatively low computational complexity. These papers have used SfM to reconstruct the 3D scene (point cloud) from UAV-obtained images [37,38,39,40,41,42,43,44,45,46,47,48,49,50,51,52,53,54,55,56,57,58,59,60,61,62,63,64,65,66,67,68,69,70,71,72,73,74,75,76,77].
However, LiDAR is still dominant in terms of data quality, accuracy, and point density. In addition, the fact that the LiDAR does not need external illumination and is not impaired by shadowed areas, like spectral sensors are, makes it widely and increasingly used [78,79,80,81,82,83,84,85,86,87,88,89,90,91,92,93,94,95,96,97], and still considered the optimal choice for point cloud generation.
Other sensors such as RADAR—Radio Detection and Ranging—also produce 3D data, but are not included in this paper for lack of evidence of being used in UAV-born vegetation mapping.
Whatever the method, the resulting point cloud is then used to build some basic models from it, namely, digital surfaces, i.e., the Digital Elevation Model (DEM), describing height distribution of all the scenery, the Digital Terrain Model (DTM), describing bare ground, and lastly, the Canopy Height Model (CHM), being the result of the subtraction of the DTM to the DEM. CHM describes the height distribution of the vegetation, which serves as a main statistical basis in forestry applications such as counting trees and segmenting tree crowns using the base crown height. Figure 9 quantitatively relates the papers that used each of the mentioned techniques for 3D data generation with the sensors used. To identify the specific works in detail please refer to Table A1 in the Appendix A section, which relates the reviewed papers to the described methods implemented for 3D data generation technique tasks and the sensors used, ordered from less to more used sensors.
The combination of datasets from different sources (also referred to as Data Fusion) plays an important role in mapping applications, often increasing the assessment quality. For example, in delineation and segmentation tasks, data fusion will, at least, increase the number of specific features of the object, and in classification tasks, it will improve classification accuracy. Even when representing a basic map with no further analysis on top of it, overlaying different datasets on top of one another in a comprehensible way will greatly support the decision-making process. For applications such as topography and vegetation mapping, these data representations are the basis of further statistical analysis (see Section 4) and machine learning tasks (see Section 5).

4. Forestry and Statistics

Remote sensing in forestry applications serves as a powerful tool that allows quick extraction of raw data regarding the forest (composed of individual trees). These raw data-sets can be comprehensible without further processing, like an RGB image, or they may require pre-processing to be understandable, e.g., raw LiDAR data must be pre-processed into a point cloud map of the scene. However, the in-depth information and analysis of the scene can be achieved using image processing, statistics, and machine learning. Statistics allows for several fundamental actions, including estimation of forestry parameters based on remotely sensed data and pre-processing of data for machine learning tasks, as well as feature extraction, unsupervised and supervised segmentation, and classification of data.
Feature extraction, feature engineering, and analysis are basic fundamental steps in classical machine learning methods (the classical term is used here because in novel methods, namely, neural network-based models, the learning stage is end-to-end encrypted so feature engineering is obsolete). Choosing and building the right set of features plays a critical role in the assessment quality, being therefore common practice to manually extract the features or check the performance of an automated extraction process. For example, features were manually extracted from 3D data generated by the SfM method in [39,41,42,43,65,69,98], and from LiDAR-generated data in [80,90,92].
Another important application of statistics (not only in forestry but in remote sensing in general) is the quality assessment and characteristics of data. Analysis of Variance (ANOVA) is a common test to check if there are any statistical differences between the means of three or more independent groups in a dataset [47,62,64,80,99]. Other statistical tests that were used in the reviewed papers are Tukey’s range test [80] (used to find means that are significantly different from each other), the Shapiro Wilk test [43,64] (a normality test in statistics used to determine if a dataset is well modeled by a normal distribution and to calculate how likely it is for a random variable underlying the dataset to be normally distributed), Bartlett’s test [64] (used to test homoscedasticity, which determines if multiple samples are from populations with equal variances), Mann–Whitney U test [71] (a non-parametric test of the null hypothesis that is for randomly selected values X and Y from two populations, the probability of X being greater than Y is equal to the probability of Y being greater than X), and the Kruskal–Wallis test [71] (a non-parametric equivalent of ANOVA).
Segmentation of the scenery is a task performed manually and with both supervised and unsupervised machine learning techniques. The result can be used for statistical analysis, data quality assessment, extraction of forest parameters, or as training data for machine learning algorithms performing classification tasks. Papers that use segmentation of scenery for analysis of data quality and extraction of forest parameters are reviewed in this section, and the ones in which segmentation is a pre-processing step for training machine learning algorithms are presented in Section 5.
Unsupervised machine learning refers to the use of artificial intelligence (AI) algorithms to identify patterns in datasets containing data points that are neither classified nor labeled. In this category, Threshold Conditioning is one of the most straightforward used methods, being based on a condition or set of conditions defined by the user. For example, in [100], a | r | < 0.70 threshold of correlation coefficients between LiDAR metrics is used as an appropriate indicator for when colinearity begins to severely distort the model estimation and subsequent predictions; [38,87] threshold height values were used to classify the point cloud into vertical strata to study a forest vertical structure. From a technical point of view, Threshold Conditioning can be considered a clustering-based method as it divides data points into different clusters based on a set of value conditions. However, this is not mentioned or clearly stated in the reviewed papers, being therefore referred to here only as an unsupervised method.
In the reviewed papers, clustering-based methods that are used for data analysis are k-Means, Euclidean distance, and Principle component analysis. k-Means is a popular and widely used clustering method. It is an iterative algorithm that starts by randomly selecting a set of k cluster centers, and then assigns each data point to the cluster whose center is closest to it. The algorithm then adjusts the cluster centers by computing the mean of all the points in each cluster, and repeats this process until the clusters converge. One key characteristic of k-Means is that it does not allow for the creation of new clusters or the merging of existing clusters, but it allows for the assignment of points to existing clusters. k-Means is a fast and efficient algorithm that is easy to implement, but it can be sensitive to the initial selection of cluster centers and may not always find the optimal clusters. In [96], k-Means is used for noise filtering. In [92], an iterative optimization process using Euclidean distance is used to minimize the distance between points and potential circles in the scenery to gain more insights into which LiDAR scan conditions can be beneficial to record stem points. Principle Component Analysis (PCA) is a statistics technique for reducing the dimensionality of large datasets containing a high number of dimensions/features per observation, increasing interpretability but at the same time minimizing information loss. It does so by creating new uncorrelated variables that successively maximize variance. In [36], PCA is used to reduce the dimensions of the dataset, being shown that having more data is not necessarily a positive attribute to analysis since the reduced dataset results in higher accuracy. In [82], PCA is used to reduce the dimensions of the point cloud dataset by replacing all the stem points of an individual tree with a new space composed of three orthogonal components, and in [84,85] PCA was used just to identify stem points for individual trees modeling.
Another group of unsupervised algorithms are Fitting Algorithms. Fitting is the process of constructing a curve or a mathematical function (in this case, known geometrical shapes) that has the best fit to a series of data points. The ones used for data analysis in the reviewed papers are Least square fitting, Hough transform, and RANSAC (Random Sample Consensus). Least square fitting is the procedure for finding the best-fitting function to a given set of points by minimizing the sum of the squares of the offsets of the points from the given function. This technique is widely used in forestry applications for the measurement of tree stems and trunk diameter by fitting a circle to the point cloud data, such as in [79,86]. A modified version of the method called robust least trimmed squares (RLTS) is proposed in [101] to cope with noisy datasets. The Hough transform is a feature extraction technique to find imperfect instances of objects within a certain class of shapes by a voting procedure. In [79,83,85,101], the Hough transformation is used for fitting circles to tree stems and trunks for further measurements. In [97], a direct unsupervised method is used to segment the point cloud into “skeleton points” and “stem-based points” in an iterative process. RANSAC is an iterative algorithm for estimating the parameters of a mathematical model from a set of observed data that contains outliers. It is a robust method for fitting a model to data that can be used when the data are contaminated with a large number of outliers. RANSAC works by selecting a random subset of the data (called inliers) that are consistent with the model, and then estimating the model parameters using only the inliers. This process is repeated multiple times, and the best model is chosen based on the number of inliers. Examples of using the RANSAC technique can be found in [50,96,101,102].
In contrast to unsupervised learning, Supervised Machine Learning is defined by its use of labeled datasets to train algorithms to classify data or predict outcomes accurately. Supervised methods used for data analysis in the reviewed papers are k-Nearest Neighborhood (k-NN), Regression Models, Support Vector Machine (SVM), Random Forest, Extreme Gradient Boosting, and Multilayer perceptron (MLP). k-NN is a non-parametric supervised learning method used for both classification and regression. In [95], this method is used and compared with other non-parametric and parametric methods for the prediction of the tree diameter at breast height (DBH). Regression analysis models are a set of statistical processes estimating the relationships between a dependent variable (in this case the label) and one or more independent variables (often called features). In [37], a linear regression model is used on UAV-driven photogrammetric point clouds to predict forest inventory variables and the results are compared with other methods. In [41], a simple linear regression model is used to compare the LiDAR CHM metrics with field-measured heights, and in [43], a linear regression model is used to compare UAV-SfM-driven point cloud data (Mangrove tree density and height, canopy diameter, and Above Ground Biomass (AGB) medians) with field measurements. In [102], logistic regression is used to fit functions to the measured data for calculating the Forest Canopy Coverage Area (CA) and the Leaf Area Index (LAI), and in [42], a DTM-independent (Digital Terrain Model) model is proposed for the prediction of the forest growing stock volume following an Area-Based Approach (ABA), which was tested in a boreal forest on a flat area. Multivariate linear regression models are used to fit data independently using growing stock volume as a response variable and separately for the three different sets of remotely sensed metrics. The authors in [89] used UAV-LiDAR data to estimate five forest canopy structure parameters—stand density, basic area, above-ground biomass (AGB), Lorey’s mean height, and under-crown height—using and comparing several models including a linear regression model. In [96], the authors used a linear regression model in the feature engineering step, calculating 93 explanatory variables from the UAV-LiDAR point cloud, including height percentiles, intensity percentiles, density variables, slope, and the intercept of a linear regression line fitted to the density variables, crown geometry variables, and spectral variables from the RGB values assigned to each point using the UAV-orthomosaic such as band averages, standard deviations, and their ratios. See [103,104] for use cases of this model in yield prediction and AGB prediction.
Support Vector Machines are supervised models with associated learning algorithms that analyze data for both classification and regression analysis. In the latter case, SVMs are referred to as Support Vector Regression. In [89,91], support vector regression is used and compared to other predictive models to estimate forest inventory parameters such as DBH and AGB. SVMs will be explained in more detail in Section 5. Like SVM, Random Forest is a widely used supervised model for classification and regression tasks comprising an ensemble of decision trees. For classification tasks, the output of the random forest is the class selected by most trees, while for regression tasks, the mean or average prediction of the individual trees is returned. This technique will be explained in more detail in Section 5. Random Forest is used in [82,89,91,95,96] as a regression model for estimating forest and tree attributes from UAV-LiDAR point clouds.
Extreme Gradient Boosting is a software library offering a more efficient and scalable implementation of the framework Gradient Boosting Machine, a supervised learning technique used in regression and classification. It provides a prediction model in the form of an ensemble of weak prediction models, which are typically decision trees. In [91], the authors used it to estimate individual tree attributes and compare it to other machine learning models. Finally, Multilayer Perceptron (MLP) is a fully connected class of feedforward artificial neural network (ANN). The term MLP is used ambiguously, sometimes loosely, to mean any feedforward ANN, sometimes strictly to refer to networks composed of multiple layers of perceptrons (with threshold activation). Multilayer perceptrons are sometimes colloquially referred to as “vanilla” neural networks, especially when they have a single hidden layer [105]. In [91], a MLP is used and compared with other methods to extract individual tree attributes or features.
Figure 10 depicts the distribution of the reviewed papers over the described methods for feature extraction and statistical analysis of data.
Figure 11 quantitatively relates the use of each technique to the used sensors’ type. To identify the specific works in detail please refer to Table A2 in the Appendix A section, which relates the reviewed papers with the described methods implemented for feature extraction and statistical analysis tasks, and the sensors used, ordered from less to more used sensors.

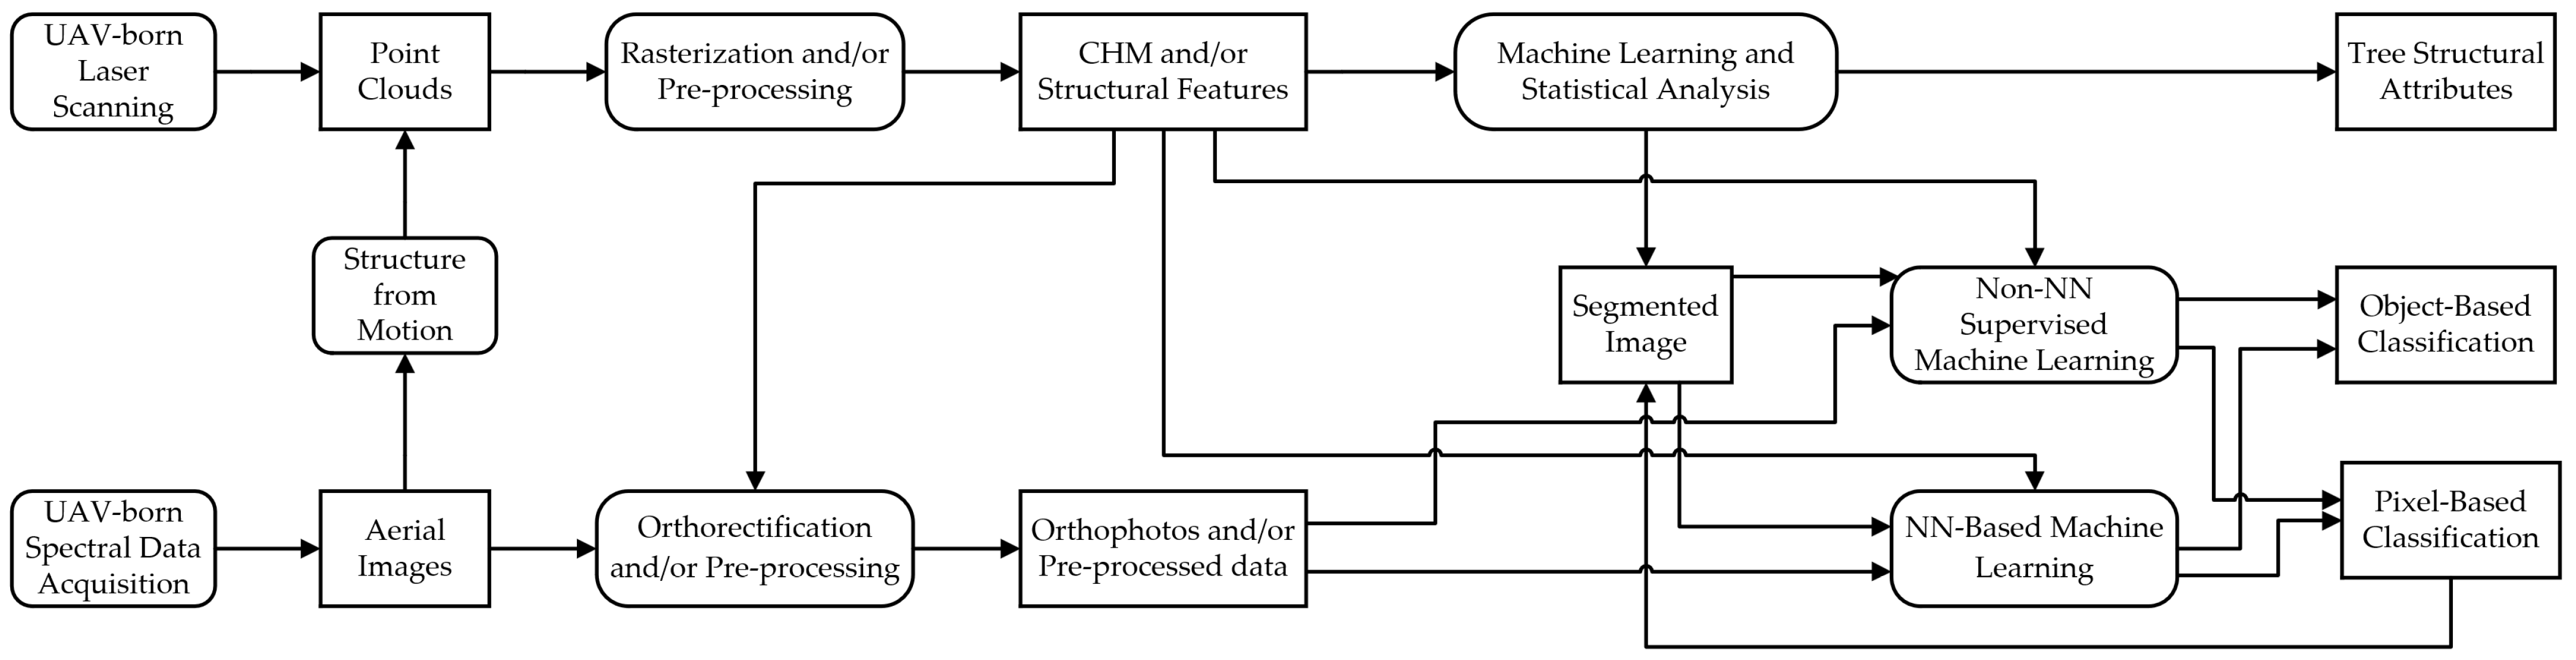
5. Image Processing and Machine Learning

Remote sensing, and in particular aerial and satellite imagery, play a key role in forestry applications. The increasing availability of data and their high spatial and even temporal resolutions, currently available on demand and with sub-metric resolution, allow automatic tools to be developed that can analyze and monitor forests by accurately assessing the vegetation resources, i.e., monitoring the health and growth of forests, detecting changes in land use and vegetation cover, mapping the distribution of different tree species, identifying areas that have been damaged by pests, disease, or natural disasters, or detecting signs of illegal logging or deforestation. Evidently, the field of application has played a key role in the development of novel methods based on aerial photogrammetry and remotely sensed data. For instance, in forestry applications, segmentation of the scenery (individual tree delineation) is a key task, either for counting trees, estimating their attributes and other forestry statistical analysis, or creating data for training machine learning frameworks to do classification tasks. Given its relevance, a significant effort has been dedicated to the development of more accurate and efficient segmentation methods.
By going through the selected literature and the corresponding procedure pipeline (please refer to Figure 5), one can see that segmentation - the process of dividing an image into distinct regions or segments, each corresponding to a different object or feature in the scene - may be a step before classification tasks. Such procedure can be seen in [67] or [106], i.e., segmentation of the scene may be a process linking pixel-based analysis to object-based analysis. Pixel-based image analysis is a traditional method of analyzing remotely sensed data in which each pixel in an image is analyzed individually, without considering the relationships between adjacent pixels or the context of the surrounding area. This type of analysis is typically used to classify an image into different categories, such as water, land, vegetation, or urban areas. Object-based image analysis, on the other hand, is a more recent approach that involves grouping pixels into distinct objects or features based on their visual characteristics and spatial relationships. In object-based image analysis, the focus is on the characteristics and behavior of the objects in an image, rather than on individual pixels. One of the main advantages of object-based image analysis is that it can more accurately represent real-world objects and features being studied, as it takes into account the spatial context and relationships between different objects. This can be particularly useful in forestry applications, where it is often necessary to accurately map and classify different types of trees or vegetation. However, object-based image analysis is generally more complex and time-consuming than pixel-based image analysis, and it requires more specialized software and training to perform.
In forestry applications, image segmentation can be used to identify and classify different types of trees or vegetation, as well as other features such as roads, buildings, and water bodies. There are various techniques that can be used for image segmentation, including thresholding, clustering, edge detection, and more. Image segmentation is an important step in the process of analyzing aerial imagery and remote sensing data, as it allows researchers to identify and analyze specific objects or features within an image. In forestry applications, image segmentation can be used to map the distribution and density of different tree species, estimate the biomass of a forest, and monitor the health and growth of trees over time. These techniques and methods are applied and developed based on spectral data structures and raster-based images, but also on point cloud (or structural) data.
Figure 12 summarizes the methods used for segmentation based on the sensors used in corresponding paper, being the methods organized hierarchically. Table A3 in Appendix A relates the reviewed papers with the described methods implemented for segmentation tasks, and the sensors used, ordered from less to more used sensors.
Manual Delineation, as the name suggests, refers to the process of manually identifying and outlining the boundaries of forested areas on a map or other visual representation. This can be done using a variety of tools, such as a GPS (Global Positioning System) device, a handheld mapping device, or even a pen and paper. The goal of manual delineation is to accurately and precisely define the boundaries of a forested area, typically for the purpose of managing, conserving, or studying the forest. This can involve identifying the edges of the forest, as well as identifying specific features within the forest, such as individual trees, streams, or wildlife habitats. Manual delineation can be a time-consuming and labor-intensive process, but it is often necessary in order to obtain accurate and detailed information about the characteristics of a forested area. Several papers [37,55,56,60,106,107,108,109,110,111,112,113,114,115] have used manual delineation either as their main method of segmentation or as the ground truth data for comparing their proposed automated methods.
Unsupervised machine learning methods are a type of machine learning algorithms that does not require labeled training data. Instead, unsupervised algorithms try to find patterns and relationships in the data on their own, without any guidance. Some common unsupervised learning methods include clustering, fitting algorithm and region growing. Unsupervised learning can be useful when one has a large amount of data and no clear idea of what to look for, or when one wants to discover hidden patterns in the data. Unsupervised learning can be more challenging than supervised learning because it does not have the benefit of labeled training examples to guide the learning process. Unsupervised methods used in the reviewed papers are described next.
Local Maxima algorithm is a computer program or mathematical procedure that is used to identify the local maxima (peaks or high points) in a dataset. Local maxima are points that are greater than their neighboring values, and they can be used to identify important or noteworthy features in a dataset. There are several different algorithms that can be used to identify local maxima, and the specific algorithm used will depend on the characteristics of the dataset and the goals of the analysis. In forestry, a local maxima refers to a peak or high point in a particular variable or attribute that is being measured or observed. For example, a local maxima might be a particularly tall tree in a forest, a section of the forest with especially high biomass, or a location with particularly high species diversity. The extremely common approach is to use the local maxima method as a peak detection algorithm, which looks for points in the data that are higher than their surrounding values and meet certain criteria (such as being above a certain threshold value). This method identifies these points as individual trees, and then the grouping of the data belonging to the same tree needs another step. These papers [45,50,53,56,63,67,70,73,76,77,82,87,91,93,96,99,100,116,117,118,119,120,121,122] have used a Local Maxima filter in their work for individual tree identification.
Threshold Conditioning, as explained in Section 4, is a well-known and widely used unsupervised method that groups data points together based on a value condition. This value can be pixel intensity in spectral data for discriminating vegetation from the background and/or other objects, discriminating different vegetation species based on their reflectivity behavior, height value, empirical parameters such as crown diameter, etc. Use cases of threshold conditioning in segmentation of scenery are described in [48,49,62,63,64,68,73,96,99,102,108,117,120,123,124,125,126,127].
Matched Filtering is a technique used in remote sensing to enhance the signal-to-noise ratio (SNR) of a signal by optimizing the detection of a known pattern or signal within a noisy dataset. It involves convolving the data with a filter that is designed to match the characteristics of the signal being sought. This can be used to improve the detectability of the signal and to reduce the impact of noise and other interfering factors on the measurement. In forestry applications, matched filtering is used to extract information about the forest canopy from images or other types of data collected by sensors on satellites or other platforms. The filter is designed to match the specific characteristics of the forest canopy, such as the spectral response or spatial pattern, and is used to process the data to enhance the visibility of the forest canopy and reduce the impact of noise and other factors. Matched filtering can be used to detect and measure various characteristics of the forest canopy, such as the structure, composition, and health of the trees. For example, in [40], authors used this technique for the segmentation of trees by filtering their UAV-born hyperspectral data.
Error correction output codes (ECOC) is a method for multi-class classification, where the goal is to predict one of the multiple possible classes for a given input. ECOC is a supervised learning method, which means that it requires a labeled training dataset consisting of input data and corresponding correct output labels. In ECOC, the classes are represented using a coding matrix, where each row corresponds to a class and each column corresponds to a classifier. The elements of the matrix are either 0 or 1, and they indicate which classifiers should be used to classify a given class. During training, the algorithm learns the parameters of the classifiers based on the input data and output labels. During inference, the classifiers are applied to the input data, and the class that corresponds to the row of the coding matrix with the highest score chosen as the final prediction. In [124], ECOC is used as a pixel-based classifier for tree crown segmentation.
Super-pixel Segmentation, used in [128], is a technique used in image processing to divide an image into smaller uniform regions known as “super-pixels”. Super-pixels are typically larger than traditional image segments or pixels, but smaller than the objects or regions of interest in the image. They are formed by grouping pixels together based on similarities in color, texture, or other image features. The goal of super-pixel segmentation is to reduce the amount of data in an image while preserving important image features and structures.
Edge detection is a technique used to identify the boundaries of objects or features within an image. It is often used as a pre-processing step for segmenting an image into different regions or objects. Edge detection involves identifying points in the image where the intensity or color changes significantly, as these points typically correspond to the boundaries between different objects or regions. There are various edge detection algorithms that can be used, each with its own set of characteristics and assumptions. Once the edges have been detected, they can be used to segment the image into different regions or objects. This can be done by connecting the detected edges to form contours around the objects or regions of interest. The resulting contours can then be used to define the boundaries of the objects or regions and to separate them from the rest of the image. This technique was used by [46,124,129,130] for segmenting tree crowns.
Watershed Segmentation is one of the most used techniques in forestry applications to identify and separate different objects or regions within an image. It is based on the concept of a watershed in hydrology, where a watershed is defined as the area of land that drains into a particular body of water. This algorithm works by treating the image as a topographic map, with the intensity or color of each pixel representing the elevation. A “flood” is then simulated, starting from the lowest points in the image and flowing outward to the higher points. As the flood progresses, it creates “catchment basins” or “water sheds” around local minima in the image. These catchment basins represent the regions or objects in the image. A watershed algorithm can be applied to a variety of image types, including grayscale, binary, and color images. It is particularly useful for segmenting images with complex or overlapping objects, or images with large intensity or color variations. This technique is used in forestry to analyze tree canopy structure and to measure various characteristics of the trees, such as crown diameter or canopy coverage. It can also be used to monitor changes in the forest canopy over time, such as the effects of natural disturbances or human activities on the forest. Examples of the use of this method in forestry applications can be seen in [39,43,50,56,59,63,67,71,73,77,78,81,82,93,112,118,122,131,132,133,134].
Multiresolution Segmentation is a technique used to decompose an image into multiple scales or resolutions. The goal of this technique is to extract features from an image at different scales in order to improve the accuracy and robustness of image segmentation. In multiresolution segmentation, an image is first decomposed into a series of images at different scales using techniques such as Gaussian pyramids or wavelet transforms. Each of these images is then segmented separately using a suitable algorithm, and the results are combined to produce the final segmentation. Multiresolution segmentation can be useful in cases where the features of interest in an image vary significantly in scale, such as in images containing both small and large objects. It can also be used to improve the efficiency of image segmentation by allowing the use of simpler and faster algorithms at coarser scales. There are several approaches to multiresolution segmentation in forestry, which may vary depending on the specific goals and characteristics of the images being analyzed, e.g., see [48,55,58,106,128,135,136,137,138,139]. For example, one approach might consist of using a combination of wavelet transforms and machine learning algorithms to classify pixels in the image as belonging to different tree species or forest types. In order to improve the accuracy and robustness of the segmentation, it may be necessary to incorporate additional information such as topographic data, field measurements, or previously mapped forest data. It may also be useful to apply image processing techniques such as noise reduction, contrast enhancement, or edge detection to pre-process the images before segmentation.
Region Growing Segmentation is a type of image segmentation algorithm that works by iteratively expanding regions in an image based on some predefined criteria. In the context of forestry, region growing segmentation could be used to extract features such as trees or forest stands from aerial or satellite images. In a region growing algorithm, the user typically specifies a seed point or set of seed points within the image, and the algorithm then grows the region around these points by adding adjacent pixels that meet certain criteria. The criteria for adding pixels to the region might be based on intensity, color, texture, or some combination of these features. One advantage of region-growing segmentation is that it can handle images with large variations in intensity or color, such as those commonly encountered in forestry applications. It can also be easily implemented and modified for different types of images and segmentation goals. However, region growing can be sensitive to noise and may not always produce the most accurate or precise segmentation results. This method is used in [45,48,49,70,71,73,79,95,99,112,118].
The Gaussian Mixture Model (GMM) is a probabilistic model that assumes that the data being modeled are generated from a mixture of several different underlying distributions, each being a Gaussian distribution. GMMs are often used in remote sensing and forestry applications as a way to classify pixels in an image based on their spectral properties, such as the reflectance of different wavelengths of light. In a GMM-based classification, the data are assumed to be a mixture of K different Gaussian distributions, where K is a pre-specified number. Each of these Gaussian distributions represents a different class or land cover type, such as forest, grassland, or water. The parameters of the Gaussian distributions (such as the mean and covariance) are estimated from the data, and then the data are classified by assigning each pixel to the class corresponding to the Gaussian distribution with the highest likelihood. GMM-based classification can be useful in forestry applications because it allows for the modeling of complex spectral profiles that may be encountered in different types of forests, for example, in [117], authors used GMM for the segmentation of interlacing orchard canopies using spectral data and used its output for training a Gradient boosting procedure. However, GMM-based classification can be sensitive to the initial parameter estimates and may not always produce the most accurate results.
Voronoi Tessellation (also known as Voronoi diagram) is a technique used to partition an image into regions or cells, such that all points within a given cell are closer to a particular seed point (also known as a generator) than to any other seed point. Voronoi tessellation is often used in conjunction with other image-processing techniques to extract features or patterns from an image. In forestry, Voronoi tessellation can be used to extract features such as individual trees or stands of trees from aerial or satellite images. For example, the seed points of the Voronoi tessellation can be chosen to correspond to the locations of individual trees or groups of trees in the image. The resulting Voronoi cells would then represent the area around each tree or group of trees [118].
Discrete Wavelet Transform (DWT) is a mathematical tool used to decompose a signal into different frequency components, in a way similar to the Fourier Transform. In image processing, DWT can be used to analyze the frequency content of images, and to perform various types of image processing tasks such as denoising, compression, and enhancement. In forestry, DWT can be used to analyze the spatial structure of forests, and to extract features such as tree crown size and shape, canopy density, and canopy gap fraction. DWT can also be used to analyze the temporal changes in forest structure by applying the transform to time series of remote sensing images. DWT can also be used to classify different types of forests based on their characteristic spatial patterns. In [123,124], DWT is used as a pre-processing filtering step before applying the segmentation technique.
Clustering is a technique in image processing and computer vision that involves dividing an image into distinct regions or segments, such that pixels within a region or segment share some common characteristics. Clustering can be used for various purposes, such as object recognition, image segmentation, and anomaly detection. In image processing and forestry applications, clustering can be used to segment images into different regions based on the properties of the pixels in those regions. For example, clustering can be used to identify different types of vegetation in an image of a forest, or to detect the presence of buildings or roads. There are many different clustering algorithms, being the choice dependent on the characteristics of the data and the specific requirements of the application. Examples of clustering algorithms used for segmentation task are HDBSCAN, ISODATA, k-Means, Fuzzy C-Means, Mean-Shift, Euclidean Distance, and Principle Component Analysis, described in the sequence.
Hierarchical Density-Based Spatial Clustering of Applications with Noise (HDBSCAN) is a clustering method that can be used to identify clusters in a dataset and to label points as either core points in a cluster, border points that are part of a cluster, or noise points that do not belong to any cluster. HDBSCAN is a density-based clustering method, which means that it is able to identify clusters of arbitrary shape in a dataset. It is particularly well-suited for datasets that contain noise or outliers, and does not require the user to specify the number of clusters in the data in advance. HDBSCAN works by first constructing a hierarchical cluster tree (also known as a dendrogram) using a measure of density, and then using this tree to identify clusters and label points. HDBSCAN has several advantages over other clustering methods, such as being able to handle large datasets and identifying clusters of varying densities. In [84], HDBSCAN was used to segment tree stems in their LiDAR-generated point cloud dataset.
The Iterative Self-Organizing Data Analysis Technique (ISODATA) is an iterative algorithm that starts with an initial set of cluster centers, and then iteratively refines the clusters by reassigning points to different clusters and adjusting the cluster centers. ISODATA can be used to cluster both continuous and categorical data. Developed in the 1960s, it has been substituted by more advanced clustering methods available. In [106], ISODATA clustering is used as a method for image segmentation.
k-Means was extensively explained in Section 4. This clustering technique can be used in forestry to group trees into clusters based on similarities in their characteristics, such as species, size, age, and health. In addition to the mentioned applications, k-Means clustering could potentially be used in other areas of forestry, such as in the prediction of future forest conditions or in the optimization of forest management strategies. k-Means clustering was used by [65,125,140] to segment the vegetation in their dataset.
Fuzzy C-Means (FCM) clustering is a variant of the k-Means clustering algorithm that allows for the “fuzzy” assignment of data points to clusters, rather than the strict assignment used in traditional k-Means. In FCM, each data point is assigned to each cluster with a degree of membership, which is represented by a membership value between 0 and 1. A data point can have a membership value of 0 in a cluster, which means it is not a member of the cluster at all, or a membership value of 1, which means it is a full member of the cluster. Data points can also have intermediate membership values, which indicate that they belong to multiple clusters to some degree. The FCM algorithm works by minimizing an objective function that measures the sum of the squared differences between the data points and the cluster centers, while also taking into account the membership values of the data points. The algorithm iteratively adjusts the cluster centers and the membership values of the data points until the objective function is minimized. FCM is often used in situations where data points may not clearly belong to a single cluster, or where there is an overlap between the clusters. It is also useful when the number of clusters is not known in advance, as the number of clusters can be specified as a hyperparameter. FCM was used in [125] as a step in their unsupervised method combined with decision fusion.
Mean-Shift is a clustering algorithm that was developed in the 1970s. It is an iterative algorithm that starts with a set of data points and then moves (or “shifts”) the points towards the densest regions of the data until they converge at local maxima of the density function. The resulting points are called “modes” and the clusters are defined as the regions of the data where the modes are located. Mean shift is a non-parametric method, which means that it does not make any assumptions about the form of the underlying data distribution. It can be used to cluster both continuous and categorical data, and it does not require the specification of the number of clusters in advance. Instead, the number of clusters is determined automatically based on the structure of the data. One key advantage of mean shift is that it is relatively robust to noise and outliers in the data. It is also relatively fast and efficient, and it can handle high-dimensional data. However, it can be sensitive to the choice of the bandwidth parameter, which controls the size of the region over which the mean is computed. Choosing the right bandwidth can be challenging, and it may require some experimentation to find the best value. The mean-shift method was used in [39,51,57,88,100,114,141] for data clustering with the objective of tree segmentation.
Euclidean Distance clustering is a method of clustering data points in a multi-dimensional space. It is based on the idea of finding the shortest distance between two points, and is often used in a variety of use cases in image processing and machine learning applications. In the context of clustering, Euclidean distance can be used to measure the distance between data points and to determine which points belong to the same cluster. For example, points that are close to each other in terms of Euclidean distance are likely to belong to the same cluster, while points that are far apart are likely to belong to different clusters. Euclidean distance was used for clustering of data for segmentation of individual trees in [69,79,131].
Fundamentals of Principal Component Analysis as a clustering method were explained in Section 4. While PCA can be used as a clustering algorithm, it is generally not considered to be a traditional clustering method. Clustering algorithms such as k-Means are designed to group data points into distinct clusters based on similarity, while PCA is more focused on identifying patterns in the data that can be used to explain variance. For example, in [51,54,79], this technique was used for feature extraction as part of the individual tree segmentation procedure.
The principles of mathematical Fitting were also explained in Section 4. Its use in the segmentation of scenery is demonstrated in [78] with Least square fitting and in [78,140] with Hough Transform.
Point Cloud Segmentation (PCS) is the process of dividing a point cloud into distinct regions or clusters. The goal of point cloud segmentation is to split the cloud into smaller, more manageable pieces, and to identify structures or patterns within the cloud. There are many approaches to point cloud segmentation, ranging from simple clustering methods to more advanced machine learning techniques using unsupervised and supervised methods. Some common approaches include k-Means, DBSCAN, Graph-based methods, and Machine Learning. PCS consists of several steps, and it may be broken down into the methods that make it. For example, Refs. [46,47,90] have used a top-down PCS algorithm proposed by [142] to segment (or delineate) individual trees based on geometrical threshold conditions and a local maxima filter, while [93] used a method by [143] that uses Euclidean distance between tree tops as a condition. More examples of PCS can be found in [97,99,112,121,131,132,144].
Layer Stacking is not a specific segmentation method in itself, but it is a technique that can be used in conjunction with various segmentation methods. In layer stacking, multiple layers or maps of the same area are overlaid on top of one another to create a composite map or image. Each layer may contain different types of information, such as different spectral bands in a satellite image or different types of data from a GIS (geographic information system) database. By stacking the layers, it is possible to combine the information from all the layers to create a more detailed and informative map or image. This technique can be particularly useful for image segmentation, as it allows the integration of multiple sources of information that can be used to more accurately identify and classify different features in the image. Layer stacking is commonly used in forestry to create composite maps or images that can be used for various purposes, such as mapping the distribution and types of vegetation, identifying areas that are prone to fire or other natural disasters, or planning the management of forests. In forestry applications, layer stacking is often used in conjunction with remote sensing techniques, such as satellite or aerial imagery, to create detailed maps of forested areas [93,132].
Voxel Space is a term used in computer graphics to describe a three-dimensional grid of points, or “voxels”, that make up a 3D image or model. Detection and delineation in voxel space refers to the process of identifying and outlining specific areas or features within a 3D image or model represented in voxel space. This can be performed for a variety of purposes, such as identifying objects or structures in a medical image, or extracting specific features from a 3D model for further analysis or manipulation. Techniques for voxel space detection and delineation may include image processing algorithms, machine learning techniques, or manual annotation by a human operator. Voxel space detection and delineation can be used in forestry to analyze and extract information from 3D models of forests or trees. For example, voxel space analysis can be used to estimate the volume of a tree or forest, or to measure the diameter at breast height (DBH) of individual trees. It can also be used to identify and classify different types of trees or vegetation, or to detect the presence of defects or abnormalities in trees. Additionally, voxel space analysis can be used to generate 3D models of forests or trees for visualization and analysis, or to create virtual replicas of real-world forests or trees for use in simulations. In other words, voxel space is one of the common “feature spaces” used in forestry applications on top of which further analysis is performed. For example, in [121], authors demonstrated three feature spaces produced from LiDAR data, i.e., point cloud, CHM, and voxel space and performed further analysis (individual tree segmentation) on top of each space and compared the results.
Supervised machine learning is a type of machine learning in which a model is trained on labeled training data, meaning that the data used to train the model include both input data and the corresponding correct output labels. The goal of supervised learning is to build a model that can make predictions about unseen data by learning the relationship between the input data and the corresponding output labels. For example, if one wanted to build a model to predict a tree species, one would need to provide the model with a set of labeled training data that includes both trees and labels indicating each tree species. The model would then use these training data to learn how to classify new, unseen, trees. Supervised learning algorithms include logistic regression, k-Nearest Neighbor, Linear Discrimination, support vector machines, and decision trees (other efficiency modules such as Gradient Boosting can be assembled on top of the main supervised algorithms). These algorithms can be used for a variety of different applications, such as speech recognition, image classification, and natural language processing.
k-Nearest Neighbors (k-NN) is a type of instance-based learning, which is a type of supervised learning. In k-NN, a model is trained on a set of labeled training data, and the model makes predictions based on the labels of the k nearest data points in the training set. For example, if one has a set of labeled data points that represent different types of trees, and wants to classify a new, unseen, data point as one of these types of trees, one can use k-NN to do so. The algorithm would find the k nearest data points in the training set (based on some distance measure) and classify the new data point based on the majority label of these nearest neighbors. See [65,69,136] for use cases of this method in the segmentation of individual trees.
Linear Discrimination is a supervised learning method (also referred to as a “dimension reduction technology”) in which the algorithm learns to predict the output by finding a linear relationship between the input features and the output. The linear relationship is represented by a linear equation, where the input features are the variables and the coefficients of the equation are the model parameters that the algorithm learns. The algorithm finds the best values for the model parameters by minimizing the error between the predicted output and the true output. Once the algorithm has learned the linear relationship, it can use it to make predictions on new, unseen, examples by using the learned model parameters to calculate the predicted output from the input features. In [68], linear discrimination was used as a second step in the proposed individual tree segmentation workflow for the detection of Xylella fastidiosa, a well-known bacterial plant pathogen infecting olive trees.
A Support Vector Machine (SVM) is a supervised machine learning algorithm that can be used for classification or regression tasks. It works by finding the hyperplane in an N-dimensional space that maximally separates the two classes. SVMs are particularly well-suited for the classification of complex but small- or medium-sized datasets. As a simple example, consider a dataset with two classes, “red” and “blue”, and where the objective is to use a SVM to build a classifier that can predict the class of a new data point based on its features. In this case, the features might be the x and y coordinates of the data point, and the goal is to find a line that separates the red points from the blue points. The line that the SVM finds is the one that maximally separates the two classes, which means that it is as far away as possible from both classes. This line is known as the maximum-margin hyperplane. There are several variations of SVMs, such as the linear SVM, nonlinear SVM, and the SVM with kernels. The choice of the appropriate SVM depends on the nature of the data and the task at hand. In the context of forestry, SVMs can be used to cluster data such as satellite imagery or sensor data collected from forests. For example, SVMs could be used to identify different types of vegetation or land cover in a forest, or to detect areas of forest damage. Although the most used cases of SVMs in forestry are for classification tasks, in [136] an SVM was used for the segmentation of individual banana tree crowns.
Gradient Boosting is a machine learning technique for regression and classification problems, which produces a prediction model in the form of an ensemble of weak prediction models, typically decision trees. It builds the model in a stage-wise fashion like other boosting methods do, and it generalizes them by allowing optimization of an arbitrary differentiable loss function. In the context of image segmentation, Gradient Boosting could be used as a method for assigning labels to pixels in an image, such as classifying pixels as foreground or background, or identifying different objects or regions in the image. To do this, one would need to construct a gradient boosting model and train it on a labeled dataset of images. In [117], gradient boosting was used to perform interlacing orchard canopy separation, and in [104] it was used to predict yield of citrus trees based on segmented tree canopies.
Figure 13 shows the relative usage of the described methods for image segmentation in the reviewed papers, highlighting the prevailing use of unsupervised machine learning algorithms. For the detailed relation between the papers and their respective segmentation method used please refer to Table A3. Figure 14 illustrates the evolution, since 2017, of the normalized usage of the different methods, aggregated in general categories (manual delineation and unsupervised and supervised machine learning), indicating a reduction trend in manual delineation compensated by an increasing trend in the use of supervised machine learning algorithms.
The final part of the reviewed papers procedure pipeline (Figure 5) is object-based (OB) classification. As explained before, when studying individual objects (in this case, trees) object-based classification can be more advantageous than pixel-based classification. Ultimately, the choice between OB and PB classification depends on the specific application and the type of data being analyzed. In some cases, a combination of both methods may be necessary to achieve the highest level of accuracy and precision).
In forestry, tree classification is the process of identifying and labeling trees based on their characteristics, such as their species, age, size, and other features. Machine learning algorithms can be used to automate and improve the accuracy of tree classification by learning from examples and making predictions based on patterns in the data. Algorithms that can be used for tree classification include random forest, support vector machines, neural networks, etc. These algorithms can be trained using labeled data, such as images of trees with known species labels, and can then be used to classify new, unlabeled trees based on their characteristics.
It is important to mention that image segmentation and image classification are two different tasks in computer vision, although they are related to each other. Image classification is the process of categorizing an image (regardless of whether the relevant information is only a subset of the image) into a specific class or category. For example, an image which contains a tree can be classified as a “tree” class, and an image with a bush can be classified as a “ground vegetation” class. Image segmentation, on the other hand, is the process of dividing an image into multiple subsets or regions based on some characteristics or features. Each region can represent a distinct object or region of interest in the image. While image segmentation and image classification are different tasks, they are often used together in various computer vision applications. For example, image segmentation can be used as a pre-processing step for object classification, where each segmented region can be further classified into specific object categories (Semantic Segmentation), examples of which can be seen, e.g., in [59,141]. Therefore, Figure 15 resumes the methods used in the reviewed papers for classification and semantic segmentation tasks, but not relating them explicitly. Table A4 in Appendix A relates the reviewed papers with the described methods implemented for classification and semantic segmentation tasks and the sensors used, ordered from less to more used sensors.
Threshold Conditioning, an unsupervised method as explained in Section 4, is used in [62] to classify structural features of forest.
k-Nearest Neighbors (k-NN) is a supervised classification method, as explained before in this section. This classifier is used both for pixel-based classification (Figure 12) and object-based classification (Figure 15). Papers [32,33,49,137,138,145] have used k-NN as an object-based classifier to classify tree species and [130] has used it to identify canopy gaps.
A Bayesian Classifier is a type of classifier that uses Bayesian probability theory to make predictions. It is based on the idea of applying Bayes’ theorem to determine the probability that an input feature belongs to a certain class, given the class prior to probability. In a Bayesian classifier, the classifier is trained on a labeled dataset, where the input data and corresponding output labels are known (therefore, it is a supervised method). The classifier uses this training data to estimate the prior probabilities of each class and the likelihood of each input feature given each class. During inference, the classifier applies Bayes’ theorem to compute the posterior probability of each class for a given input feature, and it chooses the class with the highest posterior probability as the final prediction. One advantage of Bayesian classifiers is that they can handle missing or uncertain data well, since they can compute probabilities for different possible values of the data. They are also generally simple to implement and can be very effective for certain types of classification problems. However, they can be computationally expensive to train and may not perform as well as some other types of classifiers on very large datasets. A Naive Bayes is a type of classifier that is based on the idea of applying Bayes’ theorem to make predictions. It is called “naive” because it makes the assumption that all the input features are independent of each other, which is often not true in practice. Despite this assumption, naive Bayes classifiers can still be very effective and are often used in practice. See [33,146] for use cases of the naive Bayes classifier.
Linear Discrimination is also a supervised classification method, as explained before. In [68], the authors have used a linear discriminator for species classification and in [114] it was used to classify riparian objects. The authors of [39] describe a use case of a canonical discriminant classifier for the classification of tree species. A canonical discriminant classifier is an extension of a linear discrimination method that is used to distinguish between two or more classes (rather than just two in case of linear discrimination) based on a set of linear combinations of the input features. Linear discrimination methods can be effective for classification tasks where the classes are linearly separable and the input features are continuous. However, they may not perform as well on tasks where the classes are not linearly separable or the input features are categorical.
Adaptive Boosting (AdaBoost) is a machine learning algorithm that is used to improve the accuracy of other learning algorithms. It works by training a series of weak learners (such as decision trees) and combining their predictions to form a strong overall prediction. The idea behind AdaBoost is to train each weak learner on a different weighting of the training data, with more weight given to examples that are difficult to classify. The weak learners are then combined to form a strong learner, which makes predictions by combining the predictions of the weak learners using weighted voting. The weights of the weak learners are adjusted based on their accuracy on the training data, with more accurate learners given higher weights. AdaBoost can be used with a variety of different types of weak learners, and it is often used in practice because it is relatively simple to implement and can often achieve good results. However, it can be sensitive to noisy data and outliers, and it can be slower to train than some other algorithms. See [147] for an example of its application.
A Spectral Angle Mapper (SAM) is a supervised machine learning algorithm that is used to classify data based on their spectral characteristics. It is often used in remote sensing and hyperspectral imaging applications to identify the materials or substances present in an image. To classify an image using a SAM, the algorithm computes the spectral angle between the spectrum of each pixel and the reference spectra for each class, where the reference spectra are typically measured in a laboratory or field setting and are used as the “ground truth” for classifying the image pixels. The class with the smallest spectral angle is chosen as the predicted class for that pixel. The spectral angles are typically computed using the dot product between the spectra, and they can be interpreted as a measure of the similarity between the pixel spectrum and the reference spectra. A SAM is a simple and efficient algorithm that can be used to classify hyperspectral and multispectral images with high accuracy. It is relatively robust to noise and can handle a wide range of different materials and substances. However, it can be sensitive to variations in the spectral characteristics of the materials within a class and may not perform as well in cases where the materials have highly complex or overlapping spectra. In [144], authors have used a SAM for spectral classification of multiple data sources (RGB, multispectral, and LiDAR).
Support Vector Machines, or SVMs, were extensively explained previously. Use cases of this popular and well-established method for classification tasks are demonstrated in [34,44,49,57,58,81,123,129,130,134,135,136,137,141,146,147,148,149,150].
The Maximum Likelihood algorithm is a method for estimating the parameters of a statistical model that describes the probability distribution of a dataset. It works by maximizing the likelihood function, which is a function that measures the probability of the observed data given a set of model parameters. The maximum likelihood algorithm has several desirable properties, including that it is asymptotically unbiased and that it has the highest possible convergence rate. It is widely used in a variety of fields, including statistics, machine learning, and signal processing. However, it can be sensitive to the initial values of the model parameters and may not always find the global maximum of the likelihood function. It must be noted that the maximum likelihood algorithm is not a supervised learning model, since it does not learn a function for making predictions, but rather it estimates the parameters of a statistical model that describes the probability distribution of the data. Nevertheless, the maximum likelihood algorithm can be used as a component of a supervised learning model, such as in the training of a probabilistic classifier. In this case, the classifier would be trained on a labeled dataset, and the maximum likelihood algorithm could be used to estimate the parameters of the probabilistic model that underlies the classifier. See [44,54,57,106,149] for examples of use of the maximum likelihood algorithm in classification tasks.
Random Forest is an ensemble learning method for classification, regression, and other tasks that operates by constructing a multitude of decision trees at training time and outputting the class that is the mode of the classes (classification) or mean prediction (regression) of the individual trees. A random forest is a meta-estimator that fits a number of decision tree classifiers on various sub-samples of the dataset and uses averaging to improve the predictive accuracy and control the decision trees habit of overfitting to their training set. The process for building a random forest classifier is as follows:
  • Select N random samples from the training data-set;
  • Build a decision tree for each sample;
  • Choose the number of trees in the algorithm and repeat steps 1 and 2;
  • In the prediction phase, each tree in the forest predicts the response. The final prediction is calculated by averaging the predictions of all the trees.
Random forest is a powerful and popular machine learning method due to its ability to achieve high accuracy on many tasks, and to work with large and high-dimensional datasets. It has been used extensively in a variety of fields, including forestry, for tasks such as species classification and predicting forest cover, as in [32,33,40,46,47,49,51,55,59,81,96,97,100,103,106,107,108,109,113,119,123,126,127,128,130,131,133,135,137,139,141,146,149,150,151,152,153,154].
Recursive Partitioning is a supervised machine learning method that is used to build decision tree models. To build a decision tree using recursive partitioning, one needs a labeled dataset consisting of input data and corresponding output labels. The algorithm starts at the root node of the tree and selects the feature that best splits the data into subgroups based on the target labels. It then divides the data into subgroups based on the values of this feature and repeats the process for each subgroup. This process is repeated until the subgroups are pure, meaning that they contain only a single class of target labels. Recursive partitioning is a simple and efficient way to build decision trees and is widely used in practice. It is well suited for tasks where the relationships between the features and the target labels are fairly simple and can be represented using a tree structure. However, it can be less effective on tasks where the relationships are more complex or where the data contain a large number of features. The authors of [49] used recursive partitioning as one of the classification techniques.
Neural Network-based Machine Learning is a type of machine learning that uses artificial neural networks to learn patterns in data and make predictions or decisions. Artificial neural networks are a supervised method inspired by the structure and function of the human brain and are composed of interconnected units called “neurons”. The neural network adjusts the weights and biases of the connections between the neurons in order to learn the relationships between the input data and the output labels. Once the neural network has been trained, it can be used to make predictions or decisions on new, unseen data by applying the learned relationships to the input data. Neural network-based machine learning systems are widely used in a variety of applications, including image and speech recognition, natural language processing, and predictive modeling. They are particularly well suited to tasks where the relationships between the input data and the output labels are complex and may not be easily captured by a linear model. However, they can be more computationally intensive to train and may require more data to achieve good performance.
Multi-layer Perceptron (MLP) is a type of artificial neural network that is composed of multiple layers of interconnected units called ‘neurons”. It is called a “multi-layer” perceptron because it has at least one hidden layer of neurons between the input and output layers. That is one of the main characteristics that sets MLP apart from other types of artificial neural networks. This hidden layer allows the MLP to learn more complex relationships between the input data and the output labels than a single-layer perceptron, which only has input and output layers. Another characteristic of MLPs is that they use fully connected layers, meaning that each neuron in a layer is connected to every neuron in the previous and following layers. This allows the MLP to learn a wide range of relationships between the input and output data, but it also means that the number of connections in the network can grow quickly as the number of input and output units increases. The authors of [33] show a use case of an MLP for tree detection and classification.
A Back propagation Neural Network (BP NN) is a type of artificial neural network that is trained using the back propagation algorithm. The back propagation algorithm is an iterative method for adjusting the weights and biases of the connections between the neurons in an artificial neural network in order to minimize the error between the predicted and true output labels. It is commonly used to train MLPs and other types of neural networks for supervised learning tasks where the goal is to learn a function that maps input data to output labels based on a labeled training dataset. The authors of [145,147] have used a BP NN for classification of tree species and compared the results with other methods.
An Extreme Learning Machine (ELM) is a type of artificial neural network that is designed to be fast and simple to use. It is composed of a single hidden layer of neurons and is trained using a method that does not require an iterative process such as back propagation. In an ELM, the weights and biases of the connections between the neurons in the hidden layer are randomly initialized and are then fixed during training. The input data are transformed into activations at the input layer, which are then transformed by the hidden layer into a set of activations at the output layer. The activations at the output layer are used to make predictions or decisions. The training process for an ELM involves finding the optimal weights and biases for the connections between the input and output layers that minimize the error between the predicted and true output labels. This is conducted using a method called the “extreme learning algorithm”, which is an efficient method for solving the optimization problem. ELMs are relatively fast to train and can be used for a variety of tasks, including classification and regression. However, they may not perform as well as some other types of neural networks on tasks where the relationships between the input and output data are very complex. In [155], authors have used an ELM for the detection and labeling of Palm trees.
Convolutional Neural Networks (CNNs) are a type of artificial neural network that is particularly well suited to tasks involving image and video data. They are called “convolutional” neural networks because they use a mathematical operation called convolution to process the input data. CNNs are composed of multiple layers of interconnected neurons, and each layer is responsible for learning a different set of features from the input data. The first layer of a CNN typically learns low-level features such as edges and corners, while deeper layers learn higher-level features such as shapes and objects. One key difference between CNNs and traditional machine learning methods is that CNNs can learn “end-to-end”, meaning that they can learn the entire process of mapping the input data to the output labels without the need for manual feature engineering. This makes them very powerful and flexible, but it also means that they may require more data and computational resources to learn the relationships between the input and output data. The defining feature of CNNs is that they use convolutional layers, which are specialized layers that perform the convolution operation on the input data. The convolution operation involves sliding a small matrix called a “kernel” or “filter” over the input data and performing an element-wise multiplication between the kernel and the input data, followed by summing the results. This process is repeated at multiple positions in the input data, and the output of the convolution is a feature map that encodes the presence and strength of certain features in the input data. CNNs are particularly effective in tasks such as image classification, object detection, and segmentation because they are able to learn hierarchies of features that are relevant to these tasks. They are also able to handle large amounts of data efficiently because they use shared weights and biases between the neurons in the same convolutional layer, which reduces the number of parameters that need to be learned. CNNs are popular in a wide variety of applications. Examples of forestry-related tasks include:
  • Forest type classification: used to classify different types of forests based on satellite or aerial imagery [19];
  • Tree species classification: used to classify different tree species or a specific feature (such as a disease) based on images of the trees taken from the ground or from aerial platforms [35,36,58,66,94,110,111,115,128,145,147,149,156,157,158,159,160,161,162,163,164,165,166,167];
  • Tree crown detection: used to detect and segment individual tree crowns in aerial imagery in order to measure the size and shape of the trees [35,56,60,61,66,110,111,117,126,128,136,166,168,169,170,171,172,173,174,175];
  • Segmentation of scenery: used to identify tree from non-tree objects [126,176]; and
  • Forest inventory: used to estimate the volume and biomass of forests based on the sizes and shapes of the trees in the forests [60,61,104,177].
Overall, CNNs have proven to be very effective at tasks involving image data, and they have the potential to improve the efficiency and accuracy of many forestry-related tasks. However, they may not be the best choice for all tasks, and other types of machine learning models may also be useful in forestry applications depending on the task and the availability of resources (data and computational power). Variations of the CNN architecture, such as the region-based convolutional neural network (R-CNN) [164,166,170,173], an efficient method for object detection, are being proposed and explored in this and other fields.
Figure 16 shows the relative usage of object-based classification methods divided into unsupervised and supervised (non-NN-based and NN-based) machine learning methods. Figure 17 depicts the usage of the methods in the past six years, with a clear growing trend of the NN-based methods. For the detailed citation of the papers relative to the methods refer to Table A4.

6. Conclusions

Mapping forests is an essential tool for understanding, managing, and conserving these vital ecosystems. The use of Unmanned Aerial Vehicles (UAVs) equipped with various sensors, in combination with data analysis and machine learning techniques, has revolutionized the way forests are mapped. UAVs have several advantages over traditional mapping methods, such as satellite imagery or ground-based surveys. They can quickly and efficiently collect high-resolution data over large areas, even in remote or inaccessible locations. Furthermore, UAVs can be flown at different altitudes, allowing for the collection of data at different scales, from individual trees to large areas of forest. This flexibility allows for the creation of detailed maps that can be used for a wide range of applications. One of the key advantages of using UAVs is the ability to collect high-resolution data on forest structure and composition. UAVs can be equipped with various sensors, such as high-resolution cameras, LiDAR scanners, multi- and hyperspectral sensors, which can collect detailed data on forest canopy structure, tree species, and even the chemical composition of the foliage. In the reviewed papers, most use RGB or multispectral cameras, or LiDAR scanners, individually.
Data analysis and machine learning techniques are also essential for processing and interpreting the large amounts of data collected by UAVs. These techniques can be used to process and interpret remote sensing data, as well as field data, to create detailed maps of forest structure and composition, and to identify patterns and trends in the data. Data quality is critical for the performance of machine learning models in the field of forestry. The quality of the data affects the accuracy, reliability, and generalizability of the model. For example, if the data used to train a model are of poor quality, the model will not perform well on new, unseen data. This can lead to inaccurate predictions, which can have serious consequences in the field of forestry, such as incorrect forest inventory and management, or wrong estimations of forest biomass and carbon sequestration. Additionally, data quality also plays a role in the interpretability of the model. For example, if the data used to train a model are not representative of the population of interest, it will be difficult to interpret the model’s predictions and make informed decisions. In order to ensure good data quality, it is important to have a robust and well-designed data collection process that is tailored to the specific task at hand. This may include using appropriate sensors, collecting data in a consistent manner, and using quality control measures to ensure that the data are accurate and free of errors. Additionally, it is important to have a good understanding of the underlying data and the problem being solved so that appropriate data pre-processing and cleaning can be applied. A trend is the use of multi- and hyperspectral data, such as near-infrared (NIR) and thermal imagery, in conjunction with visible light imagery to improve segmentation and classification results. Additionally, there is an increasing use of 3D information such as LiDAR data to extract tree crowns and stems, which can aid in segmentation and understanding forest structures. In the reviewed papers, feature extraction has no clear predominant method, being conducted manually, using statistical analysis or (un)supervised machine learning methods, while classification is mostly conducted using supervised methods, and segmentation mostly uses unsupervised machine learning techniques.
Data and data processing techniques are both important aspects. Along with the sensors and UAV platforms becoming lighter, smaller, and more affordable, the evolution of machine learning techniques is also an important factor in the latest trends of the field. The rise of deep learning methods in the past few years is the latest trend in the field, showing great potential and minimizing human intervention in data interpretation. However, this lack of human meddling might not result in the most efficient outcome. In other words, a sophisticated and complex neural network architecture might reduce human interference in data interpretation but it might require a lot of processing capacity and data availability. This necessity for resources might not be needed by using a classical method such as Random Forest or Support Vector Machine classifier and the right data and feature engineering.
Overall, the latest trends in image processing and machine learning techniques for forestry and segmentation and classification tasks are focused on improving the accuracy and interpretability of the results, by using 3D information, multi-modal data, and AI methods, and may be summarized as:
  • 3D Information: the use of 3D information such as LiDAR data to extract tree crowns and stems has proven to be beneficial by aiding in segmentation and classification tasks and giving more in-depth analysis of forest structures.
  • Multi-modal data: the use of multi-modal data, such as LiDAR, hyperspectral, and thermal imagery in conjunction with visible light imagery, has been growing extensively to improve segmentation and classification results.
  • AI methods: Convolutional Neural Networks (CNNs) and Deep Learning architectures have been increasingly used for image segmentation and classification tasks in forestry. These methods are able to achieve high accuracy in identifying and segmenting trees from UAV images. However, this trend is in its early stages and specifically tailored networks for specific forestry tasks are still missing.
Towards an explainable and more efficient AI, some methods already used in other fields might be used here:
  • Active learning: With active learning methods, the model can learn from human input to improve the segmentation and classification results. This means an end-to-end architecture is not necessarily the best possible approach and human interference (manufacturing features manually and feeding them to the NN architecture) at certain levels (or in this case of NNs layers) can improve the performance of the model significantly.
  • Transfer learning: Transfer learning allows the use of pre-trained models to reduce the amount of labeled data needed for a specific task, which can be especially useful in the case of forestry where data may be limited. Additionally, since NN methods, and in general machine learning model development, is an experimental endeavour, using already existing knowledge from other applications can reduce the development time substantially.
  • Data Augmentation: Data augmentation is a technique in machine learning and computer vision where new training data are generated from existing training data by applying transformations to the original data. These transformations can include various techniques such as cropping, rotating, scaling, flipping, adding noise, or changing the color. By increasing the size and diversity of the training data-set, one can improve the performance of the machine learning model. This pre-processing technique can be beneficial in forestry applications since UAV-born data are scarce.
This review study provides a comprehensive view of the latest trends in tree classification and segmentation using unmanned aerial vehicles, focusing on its two main vectors: data and processing methods. Its results can be used to tailor future studies on forest remote sensing, to better understand the underlying relations between data and methods, thus improving the quality of the results in this field.

Author Contributions

Conceptualization, B.C., A.M. and C.V.; methodology, B.C., A.M. and C.V.; investigation, B.C.; writing—original draft preparation, B.C.; writing—review and editing, B.C., A.M. and C.V.; visualization, B.C., A.M. and C.V.; supervision, A.M. and C.V.; project administration, C.V.; funding acquisition, C.V. All authors have read and agreed to the published version of the manuscript.

Funding

This work was supported by FCT, through IDMEC, under LAETA, project UIDB/50022/2020 and under the scope of the CMU Portugal Project Safeforest—Semi-Autonomous Robotic System for Forest Cleaning and Fire Prevention (Ref. CENTRO-01-0247-FEDER-045931).

Data Availability Statement

Not applicable.

Conflicts of Interest

The authors declare no conflict of interest.

Abbreviations

The following acronyms are used in this manuscript:
ABAArea-based Approach
AdaBoostAdaptive Boosting
AGBAbove Ground Biomass
ANNArtificial Neural Network
ANOVAAnalysis of Variance
BPBack Propagation
CACanopy Coverage Area
CHMCanopy Height Model
CNNConvolutional Neural Network
DBHDiameter at Breast Height
DEMDigital Elevation Model
DSMDigital Surface Model
DTMDigital Terrain Model
DWTDiscrete Wavelet Transform
ECOCError Correction Output Codes
EGBExtreme Gradient Boosting
ELMExtreme Learning Machine
FCMFuzzy C-Means
GMMGaussian Mixture Model
GPSGlobal Positioning System
HDBSCANHierarchical Density-Based Spatial Clustering of Applications with Noise
HSIHyperspectral Imaging
ISODATAIterative Self-Organizing Data Analysis Technique
k-NNk-Nearest Neighborhood
LAILeaf Area Index
LiDARLight Detection and Ranging
MLMachine Learning
MLPMultilayer Perceptron
MSIMultispectral Imaging
NNNeural Network
OBObject-based
PBPixel-based
PCAPrinciple Component Analysis
PCSPoint Cloud Segmentation
RADARRadio Detection And Ranging
RANSACRandom Sample Consensus
RFRandom Forest
RGBRed Green Blue
SAMSpectral Angle Mapper
SfMStructure from Motion
SNRSignal-to-Noise Ratio
SVMSupport Vector Machine
UAVUnmanned Aerial Vehicle
VDDVoxel space Detection and Delineation
VTVoroni Tessellation

Appendix A

Detailed tables categorizing the papers are presented here. Table A1, Table A2, Table A3, Table A4 present the papers that have performed 3D data generation, statistical analysis and feature extraction, tree and object segmentation and object-based classification, respectively. Papers are ordered by the number of sensors employed, from the least to the most sensors used. The terms in square brackets after each citation indicate the sensors used in that paper.
Table A1. Three-dimensional data generation techniques.
MethodsPapers
Structure from Motion (SfM)[37] [RGB], [39] [RGB], [41] [RGB], [43] [RGB], [45] [RGB], [49] [RGB], [58] [RGB], [59] [RGB], [63] [RGB], [70] [RGB], [53] [RGB], [102] [RGB]
[75] [RGB], [74] [RGB], [77] [RGB], [51] [MSI], [52] [MSI], [60] [MSI], [61] [MSI], [71] [MSI], [64] [MSI], [55] [MSI], [48] [GB+RE], [72] [RGB+NIR]
[42] [RGB+NIR], [54] [RGB+NIR], [44] [RGB+NIR], [46] [RGB+MSI], [47] [RGB+MSI], [56] [RGB+MSI], [57] [RGB+MSI], [62] [RGB+MSI]
[65] [RGB+MSI], [69] [RGB+MSI], [50] [RGB+LiDAR], [73] [RGB+LiDAR], [38] [RGB+LiDAR], [67] [RGB+LiDAR], [68] [RGB+MSI+Thermal]
[66] [RGB+MSI+LiDAR], [76] [RGB+MSI+LiDAR], [40] [MSI+HSI+LiDAR]
LiDAR[78] [LiDAR], [79] [LiDAR], [97] [LiDAR], [96] [LiDAR], [82] [LiDAR], [83] [LiDAR], [84] [LiDAR], [85] [LiDAR], [86] [LiDAR]
[87] [LiDAR], [88] [LiDAR], [89] [LiDAR], [90] [LiDAR], [91] [LiDAR], [92] [LiDAR], [93] [LiDAR], [94] [LiDAR], [95] [LiDAR]
[80] [RGB+HSI+Thermal+LiDAR], [81] [RGB+MSI+HSI+Thermal+LiDAR]
Table A2. Feature extraction and statistical analysis.
MethodsPapers
Manual Feature
Extraction
Structure from Motion (SfM)[39] [RGB], [41] [RGB], [43] [RGB], [42] [RGB+NIR]
[65] [RGB+MSI], [69] [RGB+MSI], [98] [RGB+Thermal]
LiDAR[92] [LiDAR], [90] [LiDAR], [80] [RGB+HSI+Thermal+LiDAR]
Statistical
Analysis
Analysis of Variance (ANOVA)[47] [RGB+MSI], [62] [RGB+MSI], [64] [MSI]
[80] [RGB+HSI+Thermal+LiDAR], [99] [LiDAR], [122] [LiDAR]
Tukey’s Range Test[47] [RGB+MSI], [62] [RGB+MSI], [64] [MSI]
[80] [RGB+HSI+Thermal+LiDAR], [99] [LiDAR], [122] [LiDAR]
Shapiro Wilk Test[43] [RGB], [64] [MSI]
Bartlett’s Test[64] [MSI]
Mann-Whitney U Test[71] [MSI]
Kruskal-Wallis Test[71] [MSI]
Unsupervised
Machine
Learning
Threshold Condition[100] [LiDAR], [87] [LiDAR], [38] [RGB+LiDAR]
Clustering-Based
Segmentation
k-Means[96] [LiDAR]
Euclidean Distance[92] [LiDAR]
Principal Component Analysis (PCA)[36] [HSI], [82] [LiDAR], [84] [LiDAR], [85] [LiDAR]
Fitting
Algorithms
Least square fitting[79] [LiDAR], [86] [LiDAR], [101] [LiDAR]
Hough Transform[79] [LiDAR], [83] [LiDAR], [85] [LiDAR], [101] [LiDAR]
RANSAC[102] [RGB], [101] [LiDAR], [96] [LiDAR], [50] [RGB+LiDAR]
Point Cloud Segmentation[97] [LiDAR]
Supervised
Machine
Learning
k-Nearest Neighborhood (k-NN)[95] [LiDAR]
Regression Models[37] [RGB], [41] [RGB], [43] [RGB], [102] [RGB], [42] [RGB+NIR]
[89] [LiDAR], [96] [LiDAR], [104] [MSI], [103] [RGB+LiDAR]
Support Vector Regression (SVR)[89] [LiDAR], [91] [LiDAR]
Random Forest (RF)[82] [LiDAR], [89] [LiDAR], [95] [LiDAR], [91] [LiDAR], [96] [LiDAR]
Extreme Gradient Boosting[91] [LiDAR]
Multilayer Perceptron (MLP)[91] [LiDAR]
Table A3. Segmentation (or delineation) methods.
MethodsPapers
Manual Delineation[37] [RGB], [109] [RGB], [110] [RGB], [111] [RGB], [115] [RGB], [60] [MSI], [55] [MSI], [108] [HSI], [106] [RGB+NIR]
[56] [RGB+MSI], [107] [RGB+MSI], [114] [RGB+MSI], [113] [HSI+LiDAR], [112] [RGB+HSI+LiDAR]
Unsupervised
Machine
Learning
Local Maxima[45] [RGB], [53] [RGB], [63] [RGB], [70] [RGB], [117] [RGB], [120] [RGB], [77] [RGB], [82] [LiDAR], [96] [LiDAR], [99] [LiDAR]
[100] [LiDAR], [121] [LiDAR], [118] [LiDAR], [87] [LiDAR], [91] [LiDAR], [93] [LiDAR], [122] [LiDAR], [116] [RGB+MSI]
[56] [RGB+MSI], [50] [RGB+LiDAR], [67] [RGB+LiDAR], [73] [RGB+LiDAR], [119] [HSI+LiDAR], [76] [RGB+MSI+LiDAR]
Threshold Condition[49] [RGB], [63] [RGB], [124] [RGB], [117] [RGB], [125] [RGB], [102] [RGB], [120] [RGB], [48] [BG+RE], [151] [BG+NIR]
[72] [RGB+NIR], [61] [MSI], [64] [MSI], [123] [MSI], [127] [MSI], [62] [RGB+MSI], [68] [RGB+MSI+Thermal]
[108] [HSI], [96] [LiDAR], [99] [LiDAR], [73] [RGB+LiDAR], [126] [RGB+LiDAR]
Matched Filtering[40] [MSI+HSI+LiDAR]
Error Correction Output Codes (ECOC)[124] [RGB]
Super-pixel Segmentation[128] [RGB+MSI]
Edge Detection-Based Segmentation[124] [RGB], [130] [RGB], [46] [RGB+MSI], [129] [RGB+HSI]
Watershed Segmentation[39] [RGB], [43] [RGB], [59] [RGB], [63] [RGB], [77] [RGB], [71] [MSI], [134] [HSI], [78] [LiDAR], [82] [LiDAR], [93] [LiDAR]
[132] [LiDAR], [118] [LiDAR], [122] [LiDAR], [56] [RGB+MSI], [50] [RGB+LiDAR], [67] [RGB+LiDAR], [73] [RGB+LiDAR]
[131] [HSI+LiDAR], [112] [RGB+HSI+LiDAR], [133] [RGB+HSI+LiDAR], [81] [RGB+MSI+HSI+Thermal+LiDAR]
Multiresolution Segmentation[58] [RGB], [136] [RGB], [138] [RGB], [139] [RGB], [48] [BG+RE], [106] [RGB+NIR], [55] [MSI], [137] [MSI], [135] [HSI]
[128] [RGB+MSI]
Region Growing-Based
Segmentation
[45] [RGB], [49] [RGB], [70] [RGB], [48] [BG+RE], [71] [MSI], [118] [LiDAR], [79] [LiDAR], [95] [LiDAR], [99] [LiDAR]
[73] [RGB+LiDAR], [112] [RGB+LiDAR+HSI]
Gaussian Mixture Model[117] [RGB]
Voroni Tessellation (VT)[118] [LiDAR]
Discrete Wavelet Transform[123] [MSI], [124] [RGB]
Clustering-
Based
Segmentation
HDBSCAN[84] [LiDAR]
ISODATA[106] [RGB+NIR]
k-Means[65] [RGB+MSI], [140] [RGB], [125] [RGB]
Fuzzy C-Means (FCM)[125] [RGB]
Mean-Shift[39] [RGB], [141] [RGB], [51] [MSI], [100] [LiDAR], [88] [LiDAR], [57] [RGB+MSI], [114] [RGB+MSI]
Euclidean Distance[79] [LiDAR], [69] [RGB+MSI], [131] [HSI+LiDAR]
Principle Component
Analysis (PCA)
[51] [MSI], [79] [LiDAR], [54] [RGB+NIR]
Fitting
Algorithm
Least Square Fitting[78] [LiDAR]
Hough Transform[78] [LiDAR], [140] [RGB]
Point Cloud Segmentation[132] [LiDAR], [90] [LiDAR], [93] [LiDAR], [99] [LiDAR], [97] [LiDAR], [121] [LiDAR], [46] [RGB+MSI], [47] [RGB+MSI]
[131] [HSI+LiDAR], [144] [RGB+MSI+LiDAR], [112] [RGB+HSI+LiDAR]
Layer Stacking[93] [LiDAR], [132] [LiDAR]
Voxel space detection
and delineation (VDD)
[121] [LiDAR]
Supervised
Machine
Learning
k-Nearest Neighborhood (k-NN)[136] [RGB], [65] [RGB+MSI], [69] [RGB+MSI]
Linear Discrimination[68] [RGB+MSI+Thermal]
Support Vector Machines (SVM)[136] [RGB]
Gradient Boosting[117] [RGB], [104] [MSI]
Table A4. Classification and semantic segmentation techniques.
MethodsPapers
Unsupervised
Machine Learning
Threshold
Condition
[62] [RGB+MSI]
Supervised
Machine
Learning
Non-NN
Methods
Bayesian Classifier[146] [RGB], [33] [RGB+HSI]
K-Nearest Neighborhood[49] [RGB], [145] [RGB], [138] [RGB], [130] [RGB], [137] [MSI], [32] [RGB+HSI], [33] [RGB+HSI]
Linear Discrimination[39] [RGB], [114] [RGB+MSI], [68] [RGB+MSI+Thermal]
AdaBoost[147] [RGB]
Spectral Angle Mapper
(SAM)
[144] [RGB+MSI+LiDAR]
Support Vector Machine
(SVM)
[49] [RGB], [58] [RGB], [136] [RGB], [147] [RGB], [141] [RGB], [149] [RGB], [130] [RGB], [146] [RGB], [123] [MSI], [137] [MSI]
[150] [MSI], [135] [HSI], [134] [HSI], [148] [HSI], [44] [RGB+NIR], [57] [RGB+MSI], [34] [RGB+HSI], [129] [RGB+HSI]
[81] [RGB+MSI+HSI+Thermal+LiDAR]
Maximum Likelihood[149] [RGB], [44] [RGB+NIR], [54] [RGB+NIR], [106] [RGB+NIR], [57] [RGB+MSI]
Decision Trees
and
Random Forest (RF)
[59] [RGB], [109] [RGB], [49] [RGB], [141] [RGB], [149] [RGB], [139] [RGB], [130] [RGB], [146] [RGB], [153] [GR+NIR]
[51] [MSI], [55] [MSI], [152] [MSI], [123] [MSI], [137] [MSI], [150] [MSI], [154] [MSI], [127] [MSI], [108] [HSI], [135] [HSI]
[151] [BG+NIR], [106] [RGB+NIR], [46] [RGB+MSI], [47] [RGB+MSI], [107] [RGB+MSI], [128] [RGB+MSI], [32] [RGB+HSI]
[33] [RGB+HSI], [100] [LiDAR], [96] [LiDAR], [97] [LiDAR], [126] [RGB+LiDAR], [103] [RGB+LiDAR], [113] [HSI+LiDAR]
[131] [HSI+LiDAR], [119] [HSI+LiDAR], [133] [RGB+HSI+LiDAR], [40] [MSI+HSI+LiDAR]
[81] [RGB+MSI+HSI+Thermal+LiDAR]
Recursive Partitioning[49] [RGB]
NN
Methods
Multilayer Perceptron (MLP)[33] [RGB+HSI]
Back Propagation
Neural Network (BP NN)
[145] [RGB], [147] [RGB]
Extreme Learning Machine
(ELM)
[155] [RGB]
Convolutional Neural Networks
(CNN)
[58] [RGB], [35] [RGB], [170] [RGB], [171] [RGB], [163] [RGB], [110] [RGB], [111] [RGB], [117] [RGB], [149] [RGB]
[165] [RGB], [166] [RGB], [136] [RGB], [145] [RGB], [147] [RGB], [168] [RGB], [156] [RGB], [161] [RGB], [173] [RGB]
[19] [RGB], [174] [RGB], [115] [RGB], [167] [RGB], [175] [RGB], [60] [MSI], [61] [MSI], [172] [MSI], [159] [MSI], [160] [MSI]
[104] [MSI], [36] [HSI], [162] [HSI], [94] [LiDAR], [176] [LiDAR], [158] [LiDAR], [169] [RGB+MSI], [56] [RGB+MSI]
[177] [RGB+MSI], [128] [RGB+MSI], [164] [RGB+LiDAR], [126] [RGB+LiDAR], [157] [MSI+LiDAR], [66] [RGB+MSI+LiDAR]

References

  1. Abad-Segura, E.; González-Zamar, M.D.; Vázquez-Cano, E.; López-Meneses, E. Remote Sensing Applied in Forest Management to Optimize Ecosystem Services: Advances in Research. Forests 2020, 11, 969. [Google Scholar] [CrossRef]
  2. Gao, Y.; Skutsch, M.; Paneque-Gálvez, J.; Ghilardi, A. Remote sensing of forest degradation: A review. Environ. Res. Lett. 2020, 15, 103001. [Google Scholar] [CrossRef]
  3. Camarretta, N.; Harrison, P.A.; Bailey, T.; Potts, B.; Lucieer, A.; Davidson, N.; Hunt, M. Monitoring forest structure to guide adaptive management of forest restoration: A review of remote sensing approaches. New For. 2020, 51, 573–596. [Google Scholar] [CrossRef]
  4. Barmpoutis, P.; Papaioannou, P.; Dimitropoulos, K.; Grammalidis, N. A Review on Early Forest Fire Detection Systems Using Optical Remote Sensing. Sensors 2020, 20, 6442. [Google Scholar] [CrossRef] [PubMed]
  5. Estoque, R. A Review of the Sustainability Concept and the State of SDG Monitoring Using Remote Sensing. Remote Sens. 2020, 12, 1770. [Google Scholar] [CrossRef]
  6. Torresan, C.; Berton, A.; Carotenuto, F.; Di Gennaro, S.F.; Gioli, B.; Matese, A.; Miglietta, F.; Vagnoli, C.; Zaldei, A.; Wallace, L. Forestry applications of UAVs in Europe: A review. Int. J. Remote Sens. 2017, 38, 2427–2447. [Google Scholar] [CrossRef]
  7. Toro, F.G.; Tsourdos, A. (Eds.) UAV Sensors for Environmental Monitoring; MDPI: Basel, Switzerland, 2018. [Google Scholar] [CrossRef]
  8. Diez, Y.; Kentsch, S.; Fukuda, M.; Caceres, M.L.L.; Moritake, K.; Cabezas, M. Deep Learning in Forestry Using UAV-Acquired RGB Data: A Practical Review. Remote Sens. 2021, 13, 2837. [Google Scholar] [CrossRef]
  9. Adão, T.; Hruška, J.; Pádua, L.; Bessa, J.; Peres, E.; Morais, R.; Sousa, J. Hyperspectral Imaging: A Review on UAV-Based Sensors, Data Processing and Applications for Agriculture and Forestry. Remote Sens. 2017, 9, 1110. [Google Scholar] [CrossRef]
  10. Grybas, H.; Congalton, R.G. Evaluating the Impacts of Flying Height and Forward Overlap on Tree Height Estimates Using Unmanned Aerial Systems. Forests 2022, 13, 1462. [Google Scholar] [CrossRef]
  11. Jiménez-Jiménez, S.I.; Ojeda-Bustamante, W.; Marcial-Pablo, M.; Enciso, J. Digital Terrain Models Generated with Low-Cost UAV Photogrammetry: Methodology and Accuracy. ISPRS Int. J. Geo-Inf. 2021, 10, 285. [Google Scholar] [CrossRef]
  12. Lewicki, T.; Liu, K. Multimodal Wildfire Surveillance with UAV. In Proceedings of the 2021 IEEE Global Communications Conference (GLOBECOM), Madrid, Spain, 7–11 December 2021; pp. 1–6. [Google Scholar] [CrossRef]
  13. Casagli, N.; Frodella, W.; Morelli, S.; Tofani, V.; Ciampalini, A.; Intrieri, E.; Raspini, F.; Rossi, G.; Tanteri, L.; Lu, P. Spaceborne, UAV and ground-based remote sensing techniques for landslide mapping, monitoring and early warning. Geoenviron. Disasters 2017, 4, 9. [Google Scholar] [CrossRef]
  14. Ecke, S.; Dempewolf, J.; Frey, J.; Schwaller, A.; Endres, E.; Klemmt, H.J.; Tiede, D.; Seifert, T. UAV-Based Forest Health Monitoring: A Systematic Review. Remote Sens. 2022, 14, 3205. [Google Scholar] [CrossRef]
  15. Berra, E.F.; Peppa, M.V. Advances and Challenges of Uav Sfm Mvs Photogrammetry and Remote Sensing: Short Review. Int. Arch. Photogramm. Remote Sens. Spat. Inf. Sci. 2020, XLII-3/W12-2020, 267–272. [Google Scholar] [CrossRef]
  16. Holzinger, A.; Saranti, A.; Angerschmid, A.; Retzlaff, C.O.; Gronauer, A.; Pejakovic, V.; Medel-Jimenez, F.; Krexner, T.; Gollob, C.; Stampfer, K. Digital Transformation in Smart Farm and Forest Operations Needs Human-Centered AI: Challenges and Future Directions. Sensors 2022, 22, 3043. [Google Scholar] [CrossRef] [PubMed]
  17. Pashaei, M.; Kamangir, H.; Starek, M.J.; Tissot, P. Review and evaluation of deep learning architectures for efficient land cover mapping with UAS hyper-spatial imagery: A case study over a wetland. Remote Sens. 2020, 12, 959. [Google Scholar] [CrossRef]
  18. Kattenborn, T.; Leitloff, J.; Schiefer, F.; Hinz, S. Review on Convolutional Neural Networks (CNN) in vegetation remote sensing. ISPRS J. Photogramm. Remote Sens. 2021, 173, 24–49. [Google Scholar] [CrossRef]
  19. Haq, M.A.; Rahaman, G.; Baral, P.; Ghosh, A. Deep Learning Based Supervised Image Classification Using UAV Images for Forest Areas Classification. J. Indian Soc. Remote Sens. 2021, 49, 601–606. [Google Scholar] [CrossRef]
  20. Eroshenkova, D.A.; Terekhov, V.I.; Khusnetdinov, D.R.; Chumachenko, S.I. Automated Determination of Forest-Vegetation Characteristics with the Use of a Neural Network of Deep Learning. In Automated Determination of Forest-Vegetation Characteristics with the Use of a Neural Network of Deep Learning; Springer: Berlin/Heidelberg, Germany, 2020; pp. 295–302. [Google Scholar] [CrossRef]
  21. Colomina, I.; Molina, P. Unmanned aerial systems for photogrammetry and remote sensing: A review. ISPRS J. Photogramm. Remote Sens. 2014, 92, 79–97. [Google Scholar] [CrossRef]
  22. Pádua, L.; Hruška, J.; Bessa, J.; Adão, T.; Martins, L.; Gonçalves, J.; Peres, E.; Sousa, A.; Castro, J.; Sousa, J. Multi-Temporal Analysis of Forestry and Coastal Environments Using UASs. Remote Sens. 2017, 10, 24. [Google Scholar] [CrossRef]
  23. Iglhaut, J.; Cabo, C.; Puliti, S.; Piermattei, L.; O’Connor, J.; Rosette, J. Structure from Motion Photogrammetry in Forestry: A Review. Curr. For. Rep. 2019, 5, 155–168. [Google Scholar] [CrossRef]
  24. Dainelli, R.; Toscano, P.; Di Gennaro, S.F.; Matese, A. Recent Advances in Unmanned Aerial Vehicle Forest Remote Sensing—A Systematic Review. Part I: A General Framework. Forests 2021, 12, 327. [Google Scholar] [CrossRef]
  25. Dainelli, R.; Toscano, P.; Di Gennaro, S.F.; Matese, A. Recent Advances in Unmanned Aerial Vehicles Forest Remote Sensing—A Systematic Review. Part II: Research Applications. Forests 2021, 12, 397. [Google Scholar] [CrossRef]
  26. Michałowska, M.; Rapiński, J. A review of tree species classification based on airborne lidar data and applied classifiers. Remote Sens. 2021, 13, 353. [Google Scholar] [CrossRef]
  27. van Eck, N.J.; Waltman, L. Software survey: VOSviewer, a computer program for bibliometric mapping. Scientometrics 2010, 84, 523–538. [Google Scholar] [CrossRef]
  28. Noack, A. Energy Models for Graph Clustering. J. Graph Algorithms Appl. 2007, 11, 453–480. [Google Scholar] [CrossRef]
  29. Ran, L.; Zhang, Y.; Wei, W.; Zhang, Q. A Hyperspectral Image Classification Framework with Spatial Pixel Pair Features. Sensors 2017, 17, 2421. [Google Scholar] [CrossRef] [PubMed]
  30. Mateen, M.; Wen, J.; Nasrullah; Azeem, M.A. The Role of Hyperspectral Imaging: A Literature Review. Int. J. Adv. Comput. Sci. Appl. 2018, 9. [Google Scholar] [CrossRef]
  31. Xue, J.; Su, B. Significant Remote Sensing Vegetation Indices: A Review of Developments and Applications. J. Sens. 2017, 2017, 1353691. [Google Scholar] [CrossRef]
  32. Tuominen, S.; Näsi, R.; Honkavaara, E.; Balazs, A.; Hakala, T.; Viljanen, N.; Pölönen, I.; Saari, H.; Ojanen, H. Assessment of Classifiers and Remote Sensing Features of Hyperspectral Imagery and Stereo-Photogrammetric Point Clouds for Recognition of Tree Species in a Forest Area of High Species Diversity. Remote Sens. 2018, 10, 714. [Google Scholar] [CrossRef]
  33. Nevalainen, O.; Honkavaara, E.; Tuominen, S.; Viljanen, N.; Hakala, T.; Yu, X.; Hyyppä, J.; Saari, H.; Pölönen, I.; Imai, N.; et al. Individual Tree Detection and Classification with UAV-Based Photogrammetric Point Clouds and Hyperspectral Imaging. Remote Sens. 2017, 9, 185. [Google Scholar] [CrossRef]
  34. Sothe, C.; Dalponte, M.; de Almeida, C.M.; Schimalski, M.B.; Lima, C.L.; Liesenberg, V.; Miyoshi, G.T.; Tommaselli, A.M.G. Tree Species Classification in a Highly Diverse Subtropical Forest Integrating UAV-Based Photogrammetric Point Cloud and Hyperspectral Data. Remote Sens. 2019, 11, 1338. [Google Scholar] [CrossRef]
  35. Schiefer, F.; Kattenborn, T.; Frick, A.; Frey, J.; Schall, P.; Koch, B.; Schmidtlein, S. Mapping forest tree species in high resolution UAV-based RGB-imagery by means of convolutional neural networks. ISPRS J. Photogramm. Remote Sens. 2020, 170, 205–215. [Google Scholar] [CrossRef]
  36. Miyoshi, G.T.; Arruda, M.d.S.; Osco, L.P.; Marcato Junior, J.; Gonçalves, D.N.; Imai, N.N.; Tommaselli, A.M.G.; Honkavaara, E.; Gonçalves, W.N. A Novel Deep Learning Method to Identify Single Tree Species in UAV-Based Hyperspectral Images. Remote Sens. 2020, 12, 1294. [Google Scholar] [CrossRef]
  37. Hird, J.; Montaghi, A.; McDermid, G.; Kariyeva, J.; Moorman, B.; Nielsen, S.; McIntosh, A. Use of Unmanned Aerial Vehicles for Monitoring Recovery of Forest Vegetation on Petroleum Well Sites. Remote Sens. 2017, 9, 413. [Google Scholar] [CrossRef]
  38. Wallace, L.; Lucieer, A.; Malenovský, Z.; Turner, D.; Vopěnka, P. Assessment of Forest Structure Using Two UAV Techniques: A Comparison of Airborne Laser Scanning and Structure from Motion (SfM) Point Clouds. Forests 2016, 7, 62. [Google Scholar] [CrossRef]
  39. Alonzo, M.; Andersen, H.E.; Morton, D.; Cook, B. Quantifying Boreal Forest Structure and Composition Using UAV Structure from Motion. Forests 2018, 9, 119. [Google Scholar] [CrossRef]
  40. Sankey, T.; Donager, J.; McVay, J.; Sankey, J.B. UAV lidar and hyperspectral fusion for forest monitoring in the southwestern USA. Remote Sens. Environ. 2017, 195, 30–43. [Google Scholar] [CrossRef]
  41. Dandois, J.P.; Ellis, E.C. High spatial resolution three-dimensional mapping of vegetation spectral dynamics using computer vision. Remote Sens. Environ. 2013, 136, 259–276. [Google Scholar] [CrossRef]
  42. Giannetti, F.; Chirici, G.; Gobakken, T.; Næsset, E.; Travaglini, D.; Puliti, S. A new approach with DTM-independent metrics for forest growing stock prediction using UAV photogrammetric data. Remote Sens. Environ. 2018, 213, 195–205. [Google Scholar] [CrossRef]
  43. Navarro, A.; Young, M.; Allan, B.; Carnell, P.; Macreadie, P.; Ierodiaconou, D. The application of Unmanned Aerial Vehicles (UAVs) to estimate above-ground biomass of mangrove ecosystems. Remote Sens. Environ. 2020, 242, 111747. [Google Scholar] [CrossRef]
  44. Müllerová, J.; Bartaloš, T.; Brůna, J.; Dvořák, P.; Vítková, M. Unmanned aircraft in nature conservation: An example from plant invasions. Int. J. Remote Sens. 2017, 38, 2177–2198. [Google Scholar] [CrossRef]
  45. Miraki, M.; Sohrabi, H.; Fatehi, P.; Kneubuehler, M. Individual tree crown delineation from high-resolution UAV images in broadleaf forest. Ecol. Inform. 2021, 61, 101207. [Google Scholar] [CrossRef]
  46. Xu, Z.; Shen, X.; Cao, L.; Coops, N.C.; Goodbody, T.R.; Zhong, T.; Zhao, W.; Sun, Q.; Ba, S.; Zhang, Z.; et al. Tree species classification using UAS-based digital aerial photogrammetry point clouds and multispectral imageries in subtropical natural forests. Int. J. Appl. Earth Obs. Geoinf. 2020, 92, 102173. [Google Scholar] [CrossRef]
  47. Liu, K.; Wang, A.; Zhang, S.; Zhu, Z.; Bi, Y.; Wang, Y.; Du, X. Tree species diversity mapping using UAS-based digital aerial photogrammetry point clouds and multispectral imageries in a subtropical forest invaded by moso bamboo (Phyllostachys edulis). Int. J. Appl. Earth Obs. Geoinf. 2021, 104, 102587. [Google Scholar] [CrossRef]
  48. Baena, S.; Moat, J.; Whaley, O.; Boyd, D.S. Identifying species from the air: UAVs and the very high resolution challenge for plant conservation. PLoS ONE 2017, 12, e0188714. [Google Scholar] [CrossRef]
  49. Tagle Casapia, X.; Falen, L.; Bartholomeus, H.; Cárdenas, R.; Flores, G.; Herold, M.; Honorio Coronado, E.N.; Baker, T.R. Identifying and Quantifying the Abundance of Economically Important Palms in Tropical Moist Forest Using UAV Imagery. Remote Sens. 2019, 12, 9. [Google Scholar] [CrossRef]
  50. Yrttimaa, T.; Saarinen, N.; Kankare, V.; Viljanen, N.; Hynynen, J.; Huuskonen, S.; Holopainen, M.; Hyyppä, J.; Honkavaara, E.; Vastaranta, M. Multisensorial Close-Range Sensing Generates Benefits for Characterization of Managed Scots Pine (Pinus sylvestris L.) Stands. ISPRS Int. J. Geo-Inf. 2020, 9, 309. [Google Scholar] [CrossRef]
  51. Kampen, M.; Vienna, L.S.; Immitzer, M.; Vienna, L.S.; Lederbauer, S.; Jan; Mund, P.; Immitzer, M. UAV-Based Multispectral Data for Tree Species Classification and Tree Vitality Analysis. Dreilandertagung der DGPF, der OVG und der SGPF in Wien, Osterreich Publikationen der DGPF, Band 28 2019, 10, 623–639. [Google Scholar]
  52. Minařík, R.; Langhammer, J. Use of a multispectral UAV photogrammetry for detection and tracking of forest disturbance dynamics. Int. Arch. Photogramm. Remote Sens. Spat. Inf. Sci. ISPRS Arch. 2016, 41, 711–718. [Google Scholar] [CrossRef]
  53. Mohan, M.; Silva, C.; Klauberg, C.; Jat, P.; Catts, G.; Cardil, A.; Hudak, A.; Dia, M. Individual Tree Detection from Unmanned Aerial Vehicle (UAV) Derived Canopy Height Model in an Open Canopy Mixed Conifer Forest. Forests 2017, 8, 340. [Google Scholar] [CrossRef]
  54. Gini, R.; Sona, G.; Ronchetti, G.; Passoni, D.; Pinto, L. Improving Tree Species Classification Using UAS Multispectral Images and Texture Measures. ISPRS Int. J. Geo-Inf. 2018, 7, 315. [Google Scholar] [CrossRef]
  55. Franklin, S.E.; Ahmed, O.S. Deciduous tree species classification using object-based analysis and machine learning with unmanned aerial vehicle multispectral data. Int. J. Remote Sens. 2018, 39, 5236–5245. [Google Scholar] [CrossRef]
  56. Yu, K.; Hao, Z.; Post, C.J.; Mikhailova, E.A.; Lin, L.; Zhao, G.; Tian, S.; Liu, J. Comparison of Classical Methods and Mask R-CNN for Automatic Tree Detection and Mapping Using UAV Imagery. Remote Sens. 2022, 14, 295. [Google Scholar] [CrossRef]
  57. Šiljeg, A.; Panđa, L.; Domazetović, F.; Marić, I.; Gašparović, M.; Borisov, M.; Milošević, R. Comparative Assessment of Pixel and Object-Based Approaches for Mapping of Olive Tree Crowns Based on UAV Multispectral Imagery. Remote Sens. 2022, 14, 757. [Google Scholar] [CrossRef]
  58. Onishi, M.; Ise, T. Explainable identification and mapping of trees using UAV RGB image and deep learning. Sci. Rep. 2021, 11, 903. [Google Scholar] [CrossRef] [PubMed]
  59. Wang, X.; Wang, Y.; Zhou, C.; Yin, L.; Feng, X. Urban forest monitoring based on multiple features at the single tree scale by UAV. Urban For. Urban Green. 2021, 58, 126958. [Google Scholar] [CrossRef]
  60. Hao, Z.; Lin, L.; Post, C.J.; Mikhailova, E.A.; Li, M.; Chen, Y.; Yu, K.; Liu, J. Automated tree-crown and height detection in a young forest plantation using mask region-based convolutional neural network (Mask R-CNN). ISPRS J. Photogramm. Remote Sens. 2021, 178, 112–123. [Google Scholar] [CrossRef]
  61. Kolanuvada, S.R.; Ilango, K.K. Automatic Extraction of Tree Crown for the Estimation of Biomass from UAV Imagery Using Neural Networks. J. Indian Soc. Remote Sens. 2021, 49, 651–658. [Google Scholar] [CrossRef]
  62. Belmonte, A.; Sankey, T.; Biederman, J.A.; Bradford, J.; Goetz, S.J.; Kolb, T.; Woolley, T. UAV-derived estimates of forest structure to informponderosa pine forest restoration. Remote Sens. Ecol. Conserv. 2020, 6, 181–197. [Google Scholar] [CrossRef]
  63. Dong, X.; Zhang, Z.; Yu, R.; Tian, Q.; Zhu, X. Extraction of Information about Individual Trees from High-Spatial-Resolution UAV-Acquired Images of an Orchard. Remote Sens. 2020, 12, 133. [Google Scholar] [CrossRef]
  64. Mesas-Carrascosa, F.J.; de Castro, A.I.; Torres-Sánchez, J.; Triviño-Tarradas, P.; Jiménez-Brenes, F.M.; García-Ferrer, A.; López-Granados, F. Classification of 3D Point Clouds Using Color Vegetation Indices for Precision Viticulture and Digitizing Applications. Remote Sens. 2020, 12, 317. [Google Scholar] [CrossRef]
  65. Jurado, J.M.; Ortega, L.; Cubillas, J.J.; Feito, F.R. Multispectral Mapping on 3D Models and Multi-Temporal Monitoring for Individual Characterization of Olive Trees. Remote Sens. 2020, 12, 1106. [Google Scholar] [CrossRef]
  66. Pleșoianu, A.I.; Stupariu, M.S.; Șandric, I.; Pătru-Stupariu, I.; Drăguț, L. Individual Tree-Crown Detection and Species Classification in Very High-Resolution Remote Sensing Imagery Using a Deep Learning Ensemble Model. Remote Sens. 2020, 12, 2426. [Google Scholar] [CrossRef]
  67. Gu, J.; Grybas, H.; Congalton, R.G. A Comparison of Forest Tree Crown Delineation from Unmanned Aerial Imagery Using Canopy Height Models vs. Spectral Lightness. Forests 2020, 11, 605. [Google Scholar] [CrossRef]
  68. Di Nisio, A.; Adamo, F.; Acciani, G.; Attivissimo, F. Fast Detection of Olive Trees Affected by Xylella Fastidiosa from UAVs Using Multispectral Imaging. Sensors 2020, 20, 4915. [Google Scholar] [CrossRef] [PubMed]
  69. Jurado, J.; Ramos, M.; Enríquez, C.; Feito, F. The Impact of Canopy Reflectance on the 3D Structure of Individual Trees in a Mediterranean Forest. Remote Sens. 2020, 12, 1430. [Google Scholar] [CrossRef]
  70. Gu, J.; Congalton, R.G. Individual Tree Crown Delineation From UAS Imagery Based on Region Growing by Over-Segments With a Competitive Mechanism. IEEE Trans. Geosci. Remote Sens. 2022, 60, 1–11. [Google Scholar] [CrossRef]
  71. Minařík, R.; Langhammer, J.; Lendzioch, T. Automatic Tree Crown Extraction from UAS Multispectral Imagery for the Detection of Bark Beetle Disturbance in Mixed Forests. Remote Sens. 2020, 12, 4081. [Google Scholar] [CrossRef]
  72. Belcore, E.; Wawrzaszek, A.; Wozniak, E.; Grasso, N.; Piras, M. Individual Tree Detection from UAV Imagery Using Hölder Exponent. Remote Sens. 2020, 12, 2407. [Google Scholar] [CrossRef]
  73. Yin, D.; Wang, L. Individual mangrove tree measurement using UAV-based LiDAR data: Possibilities and challenges. Remote Sens. Environ. 2019, 223, 34–49. [Google Scholar] [CrossRef]
  74. Guerra-Hernández, J.; González-Ferreiro, E.; Monleón, V.; Faias, S.; Tomé, M.; Díaz-Varela, R. Use of Multi-Temporal UAV-Derived Imagery for Estimating Individual Tree Growth in Pinus pinea Stands. Forests 2017, 8, 300. [Google Scholar] [CrossRef]
  75. Dempewolf, J.; Nagol, J.; Hein, S.; Thiel, C.; Zimmermann, R. Measurement of Within-Season Tree Height Growth in a Mixed Forest Stand Using UAV Imagery. Forests 2017, 8, 231. [Google Scholar] [CrossRef]
  76. Thiel, C.; Schmullius, C. Comparison of UAV photograph-based and airborne lidar-based point clouds over forest from a forestry application perspective. Int. J. Remote Sens. 2017, 38, 2411–2426. [Google Scholar] [CrossRef]
  77. Ahmadi, S.A.; Ghorbanian, A.; Golparvar, F.; Mohammadzadeh, A.; Jamali, S. Individual tree detection from unmanned aerial vehicle (UAV) derived point cloud data in a mixed broadleaf forest using hierarchical graph approach. Eur. J. Remote Sens. 2022, 55, 520–539. [Google Scholar] [CrossRef]
  78. Brede, B.; Calders, K.; Lau, A.; Raumonen, P.; Bartholomeus, H.M.; Herold, M.; Kooistra, L. Non-destructive tree volume estimation through quantitative structure modelling: Comparing UAV laser scanning with terrestrial LIDAR. Remote Sens. Environ. 2019, 233, 111355. [Google Scholar] [CrossRef]
  79. Terryn, L.; Calders, K.; Bartholomeus, H.; Bartolo, R.E.; Brede, B.; D’hont, B.; Disney, M.; Herold, M.; Lau, A.; Shenkin, A.; et al. Quantifying tropical forest structure through terrestrial and UAV laser scanning fusion in Australian rainforests. Remote Sens. Environ. 2022, 271, 112912. [Google Scholar] [CrossRef]
  80. De Almeida, D.R.A.; Broadbent, E.N.; Ferreira, M.P.; Meli, P.; Zambrano, A.M.A.; Gorgens, E.B.; Resende, A.F.; de Almeida, C.T.; do Amaral, C.H.; Corte, A.P.D.; et al. Monitoring restored tropical forest diversity and structure through UAV-borne hyperspectral and lidar fusion. Remote Sens. Environ. 2021, 264, 112582. [Google Scholar] [CrossRef]
  81. Hartling, S.; Sagan, V.; Maimaitijiang, M. Urban tree species classification using UAV-based multi-sensor data fusion and machine learning. GIScience Remote Sens. 2021, 58, 1250–1275. [Google Scholar] [CrossRef]
  82. Jaakkola, A.; Hyyppä, J.; Yu, X.; Kukko, A.; Kaartinen, H.; Liang, X.; Hyyppä, H.; Wang, Y. Autonomous Collection of Forest Field Reference—The Outlook and a First Step with UAV Laser Scanning. Remote Sens. 2017, 9, 785. [Google Scholar] [CrossRef]
  83. Dalla Corte, A.P.; Rex, F.E.; de Almeida, D.R.A.; Sanquetta, C.R.; Silva, C.A.; Moura, M.M.; Wilkinson, B.; Zambrano, A.M.A.; da Cunha Neto, E.M.; Veras, H.F.P.; et al. Measuring Individual Tree Diameter and Height Using GatorEye High-Density UAV-Lidar in an Integrated Crop-Livestock-Forest System. Remote Sens. 2020, 12, 863. [Google Scholar] [CrossRef]
  84. Neuville, R.; Bates, J.S.; Jonard, F. Estimating forest structure from UAV-mounted LiDAR point cloud using machine learning. Remote Sens. 2021, 13, 352. [Google Scholar] [CrossRef]
  85. Liang, X.; Wang, Y.; Pyörälä, J.; Lehtomäki, M.; Yu, X.; Kaartinen, H.; Kukko, A.; Honkavaara, E.; Issaoui, A.E.I.; Nevalainen, O.; et al. Forest in situ observations using unmanned aerial vehicle as an alternative of terrestrial measurements. For. Ecosyst. 2019, 6, 20. [Google Scholar] [CrossRef]
  86. Wieser, M.; Mandlburger, G.; Hollaus, M.; Otepka, J.; Glira, P.; Pfeifer, N. A Case Study of UAS Borne Laser Scanning for Measurement of Tree Stem Diameter. Remote Sens. 2017, 9, 1154. [Google Scholar] [CrossRef]
  87. Picos, J.; Bastos, G.; Míguez, D.; Alonso, L.; Armesto, J. Individual Tree Detection in a Eucalyptus Plantation Using Unmanned Aerial Vehicle (UAV)-LiDAR. Remote Sens. 2020, 12, 885. [Google Scholar] [CrossRef]
  88. Yan, W.; Guan, H.; Cao, L.; Yu, Y.; Li, C.; Lu, J. A Self-Adaptive Mean Shift Tree-Segmentation Method Using UAV LiDAR Data. Remote Sens. 2020, 12, 515. [Google Scholar] [CrossRef]
  89. Peng, X.; Zhao, A.; Chen, Y.; Chen, Q.; Liu, H.; Wang, J.; Li, H. Comparison of modeling algorithms for forest canopy structures based on UAV-LiDAR: A case study in tropical China. Forests 2020, 11, 1324. [Google Scholar] [CrossRef]
  90. Hu, T.; Sun, X.; Su, Y.; Guan, H.; Sun, Q.; Kelly, M.; Guo, Q. Development and Performance Evaluation of a Very Low-Cost UAV-Lidar System for Forestry Applications. Remote Sens. 2020, 13, 77. [Google Scholar] [CrossRef]
  91. Corte, A.P.D.; Souza, D.V.; Rex, F.E.; Sanquetta, C.R.; Mohan, M.; Silva, C.A.; Zambrano, A.M.A.; Prata, G.; Alves de Almeida, D.R.; Trautenmüller, J.W.; et al. Forest inventory with high-density UAV-Lidar: Machine learning approaches for predicting individual tree attributes. Comput. Electron. Agric. 2020, 179, 105815. [Google Scholar] [CrossRef]
  92. Brede, B.; Lau, A.; Bartholomeus, H.; Kooistra, L. Comparing RIEGL RiCOPTER UAV LiDAR Derived Canopy Height and DBH with Terrestrial LiDAR. Sensors 2017, 17, 2371. [Google Scholar] [CrossRef]
  93. Ma, K.; Chen, Z.; Fu, L.; Tian, W.; Jiang, F.; Yi, J.; Du, Z.; Sun, H. Performance and Sensitivity of Individual Tree Segmentation Methods for UAV-LiDAR in Multiple Forest Types. Remote Sens. 2022, 14, 298. [Google Scholar] [CrossRef]
  94. Chen, X.; Jiang, K.; Zhu, Y.; Wang, X.; Yun, T. Individual Tree Crown Segmentation Directly from UAV-Borne LiDAR Data Using the PointNet of Deep Learning. Forests 2021, 12, 131. [Google Scholar] [CrossRef]
  95. Hao, Y.; Widagdo, F.R.A.; Liu, X.; Quan, Y.; Dong, L.; Li, F. Individual Tree Diameter Estimation in Small-Scale Forest Inventory Using UAV Laser Scanning. Remote Sens. 2020, 13, 24. [Google Scholar] [CrossRef]
  96. Puliti, S.; Breidenbach, J.; Astrup, R. Estimation of Forest Growing Stock Volume with UAV Laser Scanning Data: Can It Be Done without Field Data? Remote Sens. 2020, 12, 1245. [Google Scholar] [CrossRef]
  97. Krůček, M.; Král, K.; Cushman, K.; Missarov, A.; Kellner, J.R. Supervised Segmentation of Ultra-High-Density Drone Lidar for Large-Area Mapping of Individual Trees. Remote Sens. 2020, 12, 3260. [Google Scholar] [CrossRef]
  98. Webster, C.; Westoby, M.; Rutter, N.; Jonas, T. Three-dimensional thermal characterization of forest canopies using UAV photogrammetry. Remote Sens. Environ. 2018, 209, 835–847. [Google Scholar] [CrossRef]
  99. Torresan, C.; Carotenuto, F.; Chiavetta, U.; Miglietta, F.; Zaldei, A.; Gioli, B. Individual Tree Crown Segmentation in Two-Layered Dense Mixed Forests from UAV LiDAR Data. Drones 2020, 4, 10. [Google Scholar] [CrossRef]
  100. Shi, Y.; Wang, T.; Skidmore, A.K.; Heurich, M. Important LiDAR metrics for discriminating forest tree species in Central Europe. ISPRS J. Photogramm. Remote Sens. 2018, 137, 163–174. [Google Scholar] [CrossRef]
  101. Kuželka, K.; Slavík, M.; Surový, P. Very high density point clouds from UAV laser scanning for automatic tree stem detection and direct diameter measurement. Remote Sens. 2020, 12, 1236. [Google Scholar] [CrossRef]
  102. Zhang, W.; Gao, F.; Jiang, N.; Zhang, C.; Zhang, Y. High-Temporal-Resolution Forest Growth Monitoring Based on Segmented 3D Canopy Surface from UAV Aerial Photogrammetry. Drones 2022, 6, 158. [Google Scholar] [CrossRef]
  103. Maesano, M.; Santopuoli, G.; Moresi, F.; Matteucci, G.; Lasserre, B.; Scarascia Mugnozza, G. Above ground biomass estimation from UAV high resolution RGB images and LiDAR data in a pine forest in Southern Italy. iForest Biogeosci. For. 2022, 15, 451–457. [Google Scholar] [CrossRef]
  104. Vijayakumar, V.; Ampatzidis, Y.; Costa, L. Tree-level citrus yield prediction utilizing ground and aerial machine vision and machine learning. Smart Agric. Technol. 2023, 3, 100077. [Google Scholar] [CrossRef]
  105. Clark, J.S. The Elements of Statistical Learning; Springer Series in Statistics; Springer: New York, NY, USA, 2009; pp. 143–160. [Google Scholar] [CrossRef]
  106. Franklin, S.E. Pixel-and object-based multispectral classification of forest tree species from small unmanned aerial vehicles. J. Unmanned Veh. Syst. 2018, 6, 195–211. [Google Scholar] [CrossRef]
  107. Ahmed, O.S.; Shemrock, A.; Chabot, D.; Dillon, C.; Williams, G.; Wasson, R.; Franklin, S.E. Hierarchical land cover and vegetation classification using multispectral data acquired from an unmanned aerial vehicle. Int. J. Remote Sens. 2017, 38, 2037–2052. [Google Scholar] [CrossRef]
  108. Kurihara, J.; Koo, V.C.; Guey, C.W.; Lee, Y.P.; Abidin, H. Early Detection of Basal Stem Rot Disease in Oil Palm Tree Using Unmanned Aerial Vehicle-Based Hyperspectral Imaging. Remote Sens. 2022, 14, 799. [Google Scholar] [CrossRef]
  109. Feng, Q.; Liu, J.; Gong, J. UAV Remote Sensing for Urban Vegetation Mapping Using Random Forest and Texture Analysis. Remote Sens. 2015, 7, 1074–1094. [Google Scholar] [CrossRef]
  110. Lobo Torres, D.; Queiroz Feitosa, R.; Nigri Happ, P.; Elena Cué La Rosa, L.; Marcato Junior, J.; Martins, J.; Olã Bressan, P.; Gonçalves, W.N.; Liesenberg, V. Applying Fully Convolutional Architectures for Semantic Segmentation of a Single Tree Species in Urban Environment on High Resolution UAV Optical Imagery. Sensors 2020, 20, 563. [Google Scholar] [CrossRef] [PubMed]
  111. Ferreira, M.P.; de Almeida, D.R.A.; Papa, D.d.A.; Minervino, J.B.S.; Veras, H.F.P.; Formighieri, A.; Santos, C.A.N.; Ferreira, M.A.D.; Figueiredo, E.O.; Ferreira, E.J.L. Individual tree detection and species classification of Amazonian palms using UAV images and deep learning. For. Ecol. Manag. 2020, 475, 118397. [Google Scholar] [CrossRef]
  112. Hastings, J.H.; Ollinger, S.V.; Ouimette, A.P.; Sanders-DeMott, R.; Palace, M.W.; Ducey, M.J.; Sullivan, F.B.; Basler, D.; Orwig, D.A. Tree Species Traits Determine the Success of LiDAR-Based Crown Mapping in a Mixed Temperate Forest. Remote Sens. 2020, 12, 309. [Google Scholar] [CrossRef]
  113. Takahashi Miyoshi, G.; Imai, N.N.; Garcia Tommaselli, A.M.; Antunes de Moraes, M.V.; Honkavaara, E. Evaluation of Hyperspectral Multitemporal Information to Improve Tree Species Identification in the Highly Diverse Atlantic Forest. Remote Sens. 2020, 12, 244. [Google Scholar] [CrossRef]
  114. Fernandes, M.R.; Aguiar, F.C.; Martins, M.J.; Rico, N.; Ferreira, M.T.; Correia, A.C. Carbon Stock Estimations in a Mediterranean Riparian Forest: A Case Study Combining Field Data and UAV Imagery. Forests 2020, 11, 376. [Google Scholar] [CrossRef]
  115. Veras, H.F.P.; Ferreira, M.P.; da Cunha Neto, E.M.; Figueiredo, E.O.; Corte, A.P.D.; Sanquetta, C.R. Fusing multi-season UAS images with convolutional neural networks to map tree species in Amazonian forests. Ecol. Inform. 2022, 71, 101815. [Google Scholar] [CrossRef]
  116. Xu, X.; Zhou, Z.; Tang, Y.; Qu, Y. Individual tree crown detection from high spatial resolution imagery using a revised local maximum filtering. Remote Sens. Environ. 2021, 258, 112397. [Google Scholar] [CrossRef]
  117. Cheng, Z.; Qi, L.; Cheng, Y.; Wu, Y.; Zhang, H. Interlacing Orchard Canopy Separation and Assessment using UAV Images. Remote Sens. 2020, 12, 767. [Google Scholar] [CrossRef]
  118. Gao, T.; Gao, Z.; Sun, B.; Qin, P.; Li, Y.; Yan, Z. An Integrated Method for Estimating Forest-Canopy Closure Based on UAV LiDAR Data. Remote Sens. 2022, 14, 4317. [Google Scholar] [CrossRef]
  119. Zhou, Q.; Yu, L.; Zhang, X.; Liu, Y.; Zhan, Z.; Ren, L.; Luo, Y. Fusion of UAV Hyperspectral Imaging and LiDAR for the Early Detection of EAB Stress in Ash and a New EAB Detection Index—NDVI(776,678). Remote Sens. 2022, 14, 2428. [Google Scholar] [CrossRef]
  120. Bindhu, M.L.H.; Potluri, T.; Korra, C.B.; Prasad, J.V.D. Detection and Counting of Trees in Aerial Images Using Image Processing Techniques. In Lecture Notes in Networks and Systems; Springer: Berlin/Heidelberg, Germany, 2023; pp. 181–189. [Google Scholar] [CrossRef]
  121. Wallace, L.; Lucieer, A.; Watson, C.S. Evaluating Tree Detection and Segmentation Routines on Very High Resolution UAV LiDAR Data. IEEE Trans. Geosci. Remote Sens. 2014, 52, 7619–7628. [Google Scholar] [CrossRef]
  122. Wallace, L.; Musk, R.; Lucieer, A. An Assessment of the Repeatability of Automatic Forest Inventory Metrics Derived From UAV-Borne Laser Scanning Data. IEEE Trans. Geosci. Remote Sens. 2014, 52, 7160–7169. [Google Scholar] [CrossRef]
  123. Natividade, J.; Prado, J.; Marques, L. Low-cost multi-spectral vegetation classification using an Unmanned Aerial Vehicle. In Proceedings of the 2017 IEEE International Conference on Autonomous Robot Systems and Competitions (ICARSC), Coimbra, Portugal, 26–28 April 2017; pp. 336–342. [Google Scholar] [CrossRef]
  124. Safonova, A.; Hamad, Y.; Dmitriev, E.; Georgiev, G.; Trenkin, V.; Georgieva, M.; Dimitrov, S.; Iliev, M. Individual Tree Crown Delineation for the Species Classification and Assessment of Vital Status of Forest Stands from UAV Images. Drones 2021, 5, 77. [Google Scholar] [CrossRef]
  125. Wan, J.; Wu, L.; Zhang, S.; Liu, S.; Xu, M.; Sheng, H.; Cui, J. Monitoring of Discolored Trees Caused by Pine Wilt Disease Based on Unsupervised Learning with Decision Fusion Using UAV Images. Forests 2022, 13, 1884. [Google Scholar] [CrossRef]
  126. Wang, R.; Bao, T.; Tian, S.; Song, L.; Zhong, S.; Liu, J.; Yu, K.; Wang, F. Quantifying Understory Vegetation Cover of Pinus massoniana Forest in Hilly Region of South China by Combined Near-Ground Active and Passive Remote Sensing. Drones 2022, 6, 240. [Google Scholar] [CrossRef]
  127. Vélez, S.; Ariza-Sentís, M.; Valente, J. Mapping the spatial variability of Botrytis bunch rot risk in vineyards using UAV multispectral imagery. Eur. J. Agron. 2023, 142, 126691. [Google Scholar] [CrossRef]
  128. Sivanandam, P.; Lucieer, A. Tree Detection and Species Classification in a Mixed Species Forest Using Unoccupied Aircraft System (UAS) RGB and Multispectral Imagery. Remote Sens. 2022, 14, 4963. [Google Scholar] [CrossRef]
  129. Zhang, N.; Wang, Y.; Zhang, X. Extraction of tree crowns damaged by Dendrolimus tabulaeformis Tsai et Liu via spectral-spatial classification using UAV-based hyperspectral images. Plant Methods 2020, 16, 135. [Google Scholar] [CrossRef]
  130. Xia, J.; Wang, Y.; Dong, P.; He, S.; Zhao, F.; Luan, G. Object-Oriented Canopy Gap Extraction from UAV Images Based on Edge Enhancement. Remote Sens. 2022, 14, 4762. [Google Scholar] [CrossRef]
  131. Yu, R.; Luo, Y.; Zhou, Q.; Zhang, X.; Wu, D.; Ren, L. A machine learning algorithm to detect pine wilt disease using UAV-based hyperspectral imagery and LiDAR data at the tree level. Int. J. Appl. Earth Obs. Geoinf. 2021, 101, 102363. [Google Scholar] [CrossRef]
  132. Chen, Q.; Gao, T.; Zhu, J.; Wu, F.; Li, X.; Lu, D.; Yu, F. Individual Tree Segmentation and Tree Height Estimation Using Leaf-Off and Leaf-On UAV-LiDAR Data in Dense Deciduous Forests. Remote Sens. 2022, 14, 2787. [Google Scholar] [CrossRef]
  133. Qin, H.; Zhou, W.; Yao, Y.; Wang, W. Individual tree segmentation and tree species classification in subtropical broadleaf forests using UAV-based LiDAR, hyperspectral, and ultrahigh-resolution RGB data. Remote Sens. Environ. 2022, 280, 113143. [Google Scholar] [CrossRef]
  134. Zhang, S.; Huang, H.; Huang, Y.; Cheng, D.; Huang, J. A GA and SVM Classification Model for Pine Wilt Disease Detection Using UAV-Based Hyperspectral Imagery. Appl. Sci. 2022, 12, 6676. [Google Scholar] [CrossRef]
  135. Liu, M.; Yu, T.; Gu, X.; Sun, Z.; Yang, J.; Zhang, Z.; Mi, X.; Cao, W.; Li, J. The Impact of Spatial Resolution on the Classification of Vegetation Types in Highly Fragmented Planting Areas Based on Unmanned Aerial Vehicle Hyperspectral Images. Remote Sens. 2020, 12, 146. [Google Scholar] [CrossRef]
  136. Kuikel, S.; Upadhyay, B.; Aryal, D.; Bista, S.; Awasthi, B.; Shrestha, S. Individual Banana Tree Crown Delineation Using Unmanned Aerial Vehicle (UAV) Images. Int. Arch. Photogramm. Remote Sens. Spat. Inf. Sci. 2021, XLIII-B3-2, 581–585. [Google Scholar] [CrossRef]
  137. Guo, Q.; Zhang, J.; Guo, S.; Ye, Z.; Deng, H.; Hou, X.; Zhang, H. Urban Tree Classification Based on Object-Oriented Approach and Random Forest Algorithm Using Unmanned Aerial Vehicle (UAV) Multispectral Imagery. Remote Sens. 2022, 14, 3885. [Google Scholar] [CrossRef]
  138. Shui, W.; Li, H.; Zhang, Y.; Jiang, C.; Zhu, S.; Wang, Q.; Liu, Y.; Zong, S.; Huang, Y.; Ma, M. Is an Unmanned Aerial Vehicle (UAV) Suitable for Extracting the Stand Parameters of Inaccessible Underground Forests of Karst Tiankeng? Remote Sens. 2022, 14, 4128. [Google Scholar] [CrossRef]
  139. Wang, B.; Sun, H.; Cracknell, A.P.; Deng, Y.; Li, Q.; Lin, L.; Xu, Q.; Ma, Y.; Wang, W.; Zhang, Z. Detection and Quantification of Forest-Agriculture Ecotones Caused by Returning Farmland to Forest Program Using Unmanned Aircraft Imagery. Diversity 2022, 14, 406. [Google Scholar] [CrossRef]
  140. Finn, A.; Kumar, P.; Peters, S.; O’Hehir, J. Unsupervised spectral-spatial processing of drone imagery for identification of pine seedlings. ISPRS J. Photogramm. Remote Sens. 2022, 183, 363–388. [Google Scholar] [CrossRef]
  141. Gonçalves, V.; Ribeiro, E.; Imai, N. Mapping Areas Invaded by Pinus sp. from Geographic Object-Based Image Analysis (GEOBIA) Applied on RPAS (Drone) Color Images. Remote Sens. 2022, 14, 2805. [Google Scholar] [CrossRef]
  142. Li, W.; Guo, Q.; Jakubowski, M.K.; Kelly, M. A New Method for Segmenting Individual Trees from the Lidar Point Cloud. Photogramm. Eng. Remote Sens. 2012, 78, 75–84. [Google Scholar] [CrossRef]
  143. Wang, L.; Gong, P.; Biging, G.S. Individual Tree-Crown Delineation and Treetop Detection in High-Spatial-Resolution Aerial Imagery. Photogramm. Eng. Remote Sens. 2004, 70, 351–357. [Google Scholar] [CrossRef]
  144. Lian, X.; Zhang, H.; Xiao, W.; Lei, Y.; Ge, L.; Qin, K.; He, Y.; Dong, Q.; Li, L.; Han, Y.; et al. Biomass Calculations of Individual Trees Based on Unmanned Aerial Vehicle Multispectral Imagery and Laser Scanning Combined with Terrestrial Laser Scanning in Complex Stands. Remote Sens. 2022, 14, 4715. [Google Scholar] [CrossRef]
  145. Zhang, C.; Xia, K.; Feng, H.; Yang, Y.; Du, X. Tree species classification using deep learning and RGB optical images obtained by an unmanned aerial vehicle. J. For. Res. 2021, 32, 1879–1888. [Google Scholar] [CrossRef]
  146. Yang, K.; Zhang, H.; Wang, F.; Lai, R. Extraction of Broad-Leaved Tree Crown Based on UAV Visible Images and OBIA-RF Model: A Case Study for Chinese Olive Trees. Remote Sens. 2022, 14, 2469. [Google Scholar] [CrossRef]
  147. Hu, G.; Yin, C.; Wan, M.; Zhang, Y.; Fang, Y. Recognition of diseased Pinus trees in UAV images using deep learning and AdaBoost classifier. Biosyst. Eng. 2020, 194, 138–151. [Google Scholar] [CrossRef]
  148. Ishida, T.; Kurihara, J.; Viray, F.A.; Namuco, S.B.; Paringit, E.C.; Perez, G.J.; Takahashi, Y.; Marciano, J.J. A novel approach for vegetation classification using UAV-based hyperspectral imaging. Comput. Electron. Agric. 2018, 144, 80–85. [Google Scholar] [CrossRef]
  149. Olariu, H.G.; Malambo, L.; Popescu, S.C.; Virgil, C.; Wilcox, B.P. Woody Plant Encroachment: Evaluating Methodologies for Semiarid Woody Species Classification from Drone Images. Remote Sens. 2022, 14, 1665. [Google Scholar] [CrossRef]
  150. Xiao, D.; Pan, Y.; Feng, J.; Yin, J.; Liu, Y.; He, L. Remote sensing detection algorithm for apple fire blight based on UAV multispectral image. Comput. Electron. Agric. 2022, 199, 107137. [Google Scholar] [CrossRef]
  151. Lu, B.; He, Y. Species classification using Unmanned Aerial Vehicle (UAV)-acquired high spatial resolution imagery in a heterogeneous grassland. ISPRS J. Photogramm. Remote Sens. 2017, 128, 73–85. [Google Scholar] [CrossRef]
  152. Dash, J.P.; Watt, M.S.; Pearse, G.D.; Heaphy, M.; Dungey, H.S. Assessing very high resolution UAV imagery for monitoring forest health during a simulated disease outbreak. ISPRS J. Photogramm. Remote Sens. 2017, 131, 1–14. [Google Scholar] [CrossRef]
  153. Kefauver, S.C.; Buchaillot, M.L.; Segarra, J.; Fernandez Gallego, J.A.; Araus, J.L.; Llosa, X.; Beltrán, M.; Piqué, M. Quantification of Pinus pinea L. Pinecone Productivity Using Machine Learning of UAV and Field Images. In Proceedings of the 2nd International Electronic Conference on Forests—Sustainable Forests: Ecology, Management, Products and Trade, Online, 1–15 September 2021; MDPI: Basel, Switzerland, 2022; p. 24. [Google Scholar] [CrossRef]
  154. Gomez Selvaraj, M.; Vergara, A.; Montenegro, F.; Alonso Ruiz, H.; Safari, N.; Raymaekers, D.; Ocimati, W.; Ntamwira, J.; Tits, L.; Omondi, A.B.; et al. Detection of banana plants and their major diseases through aerial images and machine learning methods: A case study in DR Congo and Republic of Benin. ISPRS J. Photogramm. Remote Sens. 2020, 169, 110–124. [Google Scholar] [CrossRef]
  155. Malek, S.; Bazi, Y.; Alajlan, N.; AlHichri, H.; Melgani, F. Efficient framework for palm tree detection in UAV images. IEEE J. Sel. Top. Appl. Earth Obs. Remote Sens. 2014, 7, 4692–4703. [Google Scholar] [CrossRef]
  156. Natesan, S.; Armenakis, C.; Vepakomma, U. Individual tree species identification using Dense Convolutional Network (DenseNet) on multitemporal RGB images from UAV. J. Unmanned Veh. Syst. 2020, 8, 310–333. [Google Scholar] [CrossRef]
  157. Briechle, S.; Krzystek, P.; Vosselman, G. Classification of tree species and standing dead trees by fusing UAV-based lidar data and multispectral imagery in the 3D deep neural network PointNet++. ISPRS Ann. Photogramm. Remote Sens. Spat. Inf. Sci. 2020, V-2-2020, 203–210. [Google Scholar] [CrossRef]
  158. Chen, J.; Chen, Y.; Liu, Z. Classification of typical tree species in laser point cloud based on deep learning. Remote Sens. 2021, 13, 4750. [Google Scholar] [CrossRef]
  159. Qin, J.; Wang, B.; Wu, Y.; Lu, Q.; Zhu, H. Identifying pine wood nematode disease using UAV images and deep learning algorithms. Remote Sens. 2021, 13, 162. [Google Scholar] [CrossRef]
  160. Osco, L.P.; Nogueira, K.; Marques Ramos, A.P.; Faita Pinheiro, M.M.; Furuya, D.E.G.; Gonçalves, W.N.; de Castro Jorge, L.A.; Marcato Junior, J.; dos Santos, J.A. Semantic segmentation of citrus-orchard using deep neural networks and multispectral UAV-based imagery. Precis. Agric. 2021, 22, 1171–1188. [Google Scholar] [CrossRef]
  161. Liu, X.; Ghazali, K.H.; Han, F.; Mohamed, I.I. Automatic Detection of Oil Palm Tree from UAV Images Based on the Deep Learning Method. Appl. Artif. Intell. 2021, 35, 13–24. [Google Scholar] [CrossRef]
  162. La Rosa, L.E.C.; Sothe, C.; Feitosa, R.Q.; de Almeida, C.M.; Schimalski, M.B.; Oliveira, D.A.B. Multi-task fully convolutional network for tree species mapping in dense forests using small training hyperspectral data. ISPRS J. Photogramm. Remote Sens. 2021, 179, 35–49. [Google Scholar] [CrossRef]
  163. Moura, M.M.; de Oliveira, L.E.S.; Sanquetta, C.R.; Bastos, A.; Mohan, M.; Corte, A.P.D. Towards Amazon Forest Restoration: Automatic Detection of Species from UAV Imagery. Remote Sens. 2021, 13, 2627. [Google Scholar] [CrossRef]
  164. Li, Y.; Chai, G.; Wang, Y.; Lei, L.; Zhang, X. ACE R-CNN: An Attention Complementary and Edge Detection-Based Instance Segmentation Algorithm for Individual Tree Species Identification Using UAV RGB Images and LiDAR Data. Remote Sens. 2022, 14, 3035. [Google Scholar] [CrossRef]
  165. Onishi, M.; Watanabe, S.; Nakashima, T.; Ise, T. Practicality and Robustness of Tree Species Identification Using UAV RGB Image and Deep Learning in Temperate Forest in Japan. Remote Sens. 2022, 14, 1710. [Google Scholar] [CrossRef]
  166. Zhang, C.; Zhou, J.; Wang, H.; Tan, T.; Cui, M.; Huang, Z.; Wang, P.; Zhang, L. Multi-Species Individual Tree Segmentation and Identification Based on Improved Mask R-CNN and UAV Imagery in Mixed Forests. Remote Sens. 2022, 14, 874. [Google Scholar] [CrossRef]
  167. Gupta, M.; Jain, S. Banana Leaf Diseases and Machine Learning Algorithms Applied to Detect Diseases: A Study. In Lecture Notes in Networks and Systems; Springer: Berlin/Heidelberg, Germany, 2023; pp. 121–130. [Google Scholar] [CrossRef]
  168. Kattenborn, T.; Eichel, J.; Fassnacht, F.E. Convolutional Neural Networks enable efficient, accurate and fine-grained segmentation of plant species and communities from high-resolution UAV imagery. Sci. Rep. 2019, 9, 17656. [Google Scholar] [CrossRef]
  169. Barros, T.; Conde, P.; Gonçalves, G.; Premebida, C.; Monteiro, M.; Ferreira, C.S.S.; Nunes, U.J. Multispectral Vineyard Segmentation: A Deep Learning approach. Comput. Electron. Agric. 2021, 195, 106782. [Google Scholar] [CrossRef]
  170. Zheng, J.; Fu, H.; Li, W.; Wu, W.; Yu, L.; Yuan, S.; Tao, W.Y.W.; Pang, T.K.; Kanniah, K.D. Growing status observation for oil palm trees using Unmanned Aerial Vehicle (UAV) images. ISPRS J. Photogramm. Remote Sens. 2021, 173, 95–121. [Google Scholar] [CrossRef]
  171. Egli, S.; Höpke, M. CNN-Based Tree Species Classification Using High Resolution RGB Image Data from Automated UAV Observations. Remote Sens. 2020, 12, 3892. [Google Scholar] [CrossRef]
  172. Osco, L.P.; de Arruda, M.d.S.; Marcato Junior, J.; da Silva, N.B.; Ramos, A.P.M.; Moryia, É.A.S.; Imai, N.N.; Pereira, D.R.; Creste, J.E.; Matsubara, E.T.; et al. A convolutional neural network approach for counting and geolocating citrus-trees in UAV multispectral imagery. ISPRS J. Photogramm. Remote Sens. 2020, 160, 97–106. [Google Scholar] [CrossRef]
  173. Ocer, N.E.; Kaplan, G.; Erdem, F.; Kucuk Matci, D.; Avdan, U. Tree extraction from multi-scale UAV images using Mask R-CNN with FPN. Remote Sens. Lett. 2020, 11, 847–856. [Google Scholar] [CrossRef]
  174. Albuquerque, R.W.; Vieira, D.L.M.; Ferreira, M.E.; Soares, L.P.; Olsen, S.I.; Araujo, L.S.; Vicente, L.E.; Tymus, J.R.C.; Balieiro, C.P.; Matsumoto, M.H.; et al. Mapping Key Indicators of Forest Restoration in the Amazon Using a Low-Cost Drone and Artificial Intelligence. Remote Sens. 2022, 14, 830. [Google Scholar] [CrossRef]
  175. Ye, Z.; Wei, J.; Lin, Y.; Guo, Q.; Zhang, J.; Zhang, H.; Deng, H.; Yang, K. Extraction of Olive Crown Based on UAV Visible Images and the U2-Net Deep Learning Model. Remote Sens. 2022, 14, 1523. [Google Scholar] [CrossRef]
  176. Li, B.; Lu, H.; Wang, H.; Qi, J.; Yang, G.; Pang, Y.; Dong, H.; Lian, Y. Terrain-Net: A Highly-Efficient, Parameter-Free, and Easy-to-Use Deep Neural Network for Ground Filtering of UAV LiDAR Data in Forested Environments. Remote Sens. 2022, 14, 5798. [Google Scholar] [CrossRef]
  177. Safonova, A.; Guirado, E.; Maglinets, Y.; Alcaraz-Segura, D.; Tabik, S. Olive Tree Biovolume from UAV Multi-Resolution Image Segmentation with Mask R-CNN. Sensors 2021, 21, 1617. [Google Scholar] [CrossRef]
Figure 1. Methodology followed to obtain the reviewed papers.
Remotesensing 15 02263 g001
Figure 2. Selected 144 papers, grouped by year of publication.
Remotesensing 15 02263 g002
Figure 3. Word-cloud info-graphic made from keywords of papers.
Remotesensing 15 02263 g003
Figure 4. Network analysis on terms contained in title and abstracts of the reviewed papers. The analysis was performed using VOSviewer.
Remotesensing 15 02263 g004
Figure 5. General procedure pipeline in the reviewed papers.
Remotesensing 15 02263 g005
Figure 6. Sensors and their combinationsused in the reviewed papers, where each slice of the pie is one paper.
Remotesensing 15 02263 g006
Figure 7. Electromagnetic spectrum, highlighting the typical bands used in UAV-born forest mapping applications, visible, and thermal infrared.
Remotesensing 15 02263 g007
Figure 8. Comparison of the number and the width of bands of different spectral cameras.
Remotesensing 15 02263 g008
Figure 9. 3D data generation techniques vs sensors used. MSI: Multispectral Imagery, HSI: Hyperspectral Imagery.
Remotesensing 15 02263 g009
Figure 10. Methods used for feature extraction and statistical analysis of data in the reviewed papers.
Remotesensing 15 02263 g010
Figure 11. Feature extraction and statistical analysis.
Remotesensing 15 02263 g011
Figure 12. Segmentation (or individual tree delineation) methods.
Remotesensing 15 02263 g012
Figure 13. Relative distribution of methods used in Segmentation (individual tree delineation) tasks.
Remotesensing 15 02263 g013
Figure 14. Relative distribution of methods used in Segmentation (individual tree delineation) tasks over time.
Remotesensing 15 02263 g014
Figure 15. Classification and Semantic Segmentation Techniques.
Remotesensing 15 02263 g015
Figure 16. Relative distribution of methods used in object-based classification tasks.
Remotesensing 15 02263 g016
Figure 17. Relative distribution of methods used in classification tasks over time.
Remotesensing 15 02263 g017
Disclaimer/Publisher’s Note: The statements, opinions and data contained in all publications are solely those of the individual author(s) and contributor(s) and not of MDPI and/or the editor(s). MDPI and/or the editor(s) disclaim responsibility for any injury to people or property resulting from any ideas, methods, instructions or products referred to in the content.

