Next Issue
Volume 15, May-2
Previous Issue
Volume 15, April-2
 
 
remotesensing-logo

Journal Browser

Journal Browser

Remote Sens., Volume 15, Issue 9 (May-1 2023) – 265 articles

Cover Story (view full-size image): 
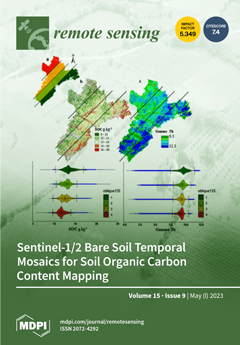
The overall objective of this study is to assess the capability of Sentinel-2 imagery to map top SOC content over croplands in the Beauce region of France. In this study, we explore (i) the dates and periods that are preferable in the construction of temporal mosaics of bare soils while accounting for soil moisture and soil management; (ii) which set of covariates is more relevant to explain SOC variability. Our results also indicated the important role of neighboring topographic distances and oblique geographic coordinates between remote sensing data and parent material. These data contributed not only to optimizing SOC mapping performance but also provided information related to long-range gradients of SOC spatial variability, which makes sense from a pedological point of view. View this paper
  • Issues are regarded as officially published after their release is announced to the table of contents alert mailing list.
  • You may sign up for e-mail alerts to receive table of contents of newly released issues.
  • PDF is the official format for papers published in both, html and pdf forms. To view the papers in pdf format, click on the "PDF Full-text" link, and use the free Adobe Reader to open them.
Order results
Result details
Section
Select all
Export citation of selected articles as:
32 pages, 26513 KiB  
Article
Six Years of IKFS-2 Global Ozone Total Column Measurements
by Alexander Polyakov, Yana Virolainen, Georgy Nerobelov, Dmitry Kozlov and Yury Timofeyev
Remote Sens. 2023, 15(9), 2481; https://doi.org/10.3390/rs15092481 - 08 May 2023
Cited by 1 | Viewed by 2337
Abstract
Atmospheric ozone plays an important role in the biosphere’s absorbing of dangerous solar UV radiation and its contributions to the Earth’s climate. Nowadays, ozone variations are widely monitored by different local and remote sensing methods. Satellite methods can provide data on the global [...] Read more.
Atmospheric ozone plays an important role in the biosphere’s absorbing of dangerous solar UV radiation and its contributions to the Earth’s climate. Nowadays, ozone variations are widely monitored by different local and remote sensing methods. Satellite methods can provide data on the global distribution of ozone and its anomalies. In contrast to measurement techniques based on solar radiation measurements, Fourier-transform infrared (FTIR) satellite measurements of thermal radiation provide information, regardless of solar illumination. The global distribution of total ozone columns (TOCs) measured by the IKFS-2 spectrometer aboard the “Meteor M N2” satellite for the period of 2015 to 2020 is presented. The retrieval algorithm uses the artificial neural network (ANN) based on measurements of TOCs by the Aura OMI instrument and the method of principal components for representing IKFS-2 spectral measurements. Latitudinal and seasonal dependencies on the ANN training errors are analyzed and considered as a first approximation of the TOC measurement errors. The TOCs derived by the IKFS-2 instrument are compared to independent ground-based and satellite data. The average differences between the IKFS-2 data and the independent TOC measurements are up to 2% (IKFS-2 usually slightly underestimates the other data), and the standard deviations of differences (SDDs) vary from 2 to 4%. At the same time, both the analysis of the ANN approximation errors of the OMI data and the comparison of the IKFS-2 results with independent data demonstrate an increase in discrepancies towards the poles. In the spring–winter period, SDDs reach 8% in the Southern and 6% in the Northern Hemisphere. The technique presented can be used to process the IKFS-2 spectral data, and as a result, it can provide global information on the TOCs in the period of 2015–2020, regardless of the solar illumination and the presence of clouds. Full article
Show Figures

Graphical abstract

18 pages, 6193 KiB  
Article
A Spatiotemporally Constrained Interpolation Method for Missing Pixel Values in the Suomi-NPP VIIRS Monthly Composite Images: Taking Shanghai as an Example
by Qingyun Liu, Junfu Fan, Jiwei Zuo, Ping Li, Yunpeng Shen, Zhoupeng Ren and Yi Zhang
Remote Sens. 2023, 15(9), 2480; https://doi.org/10.3390/rs15092480 - 08 May 2023
Cited by 1 | Viewed by 1586
Abstract
The Visible Infrared Imaging Radiometer Suite Day/Night Band (VIIRS/DNB) nighttime light data is a powerful remote sensing data source. However, due to stray light pollution, there is a lack of VIIRS data in mid-high latitudes during the summer, resulting in the absence of [...] Read more.
The Visible Infrared Imaging Radiometer Suite Day/Night Band (VIIRS/DNB) nighttime light data is a powerful remote sensing data source. However, due to stray light pollution, there is a lack of VIIRS data in mid-high latitudes during the summer, resulting in the absence of high-precision spatiotemporal continuous datasets. In this paper, we first select nine-time series interpolation methods to interpolate the missing images. Second, we construct image pixel-level temporal continuity constraints and spatial correlation constraints and remove the pixels that do not meet the constraints, and the eliminated pixels are filled with the focal statistics tool. Finally, the accuracy of the time series interpolation method and the spatiotemporally constrained interpolation method (STCIM) proposed in this paper are evaluated from three aspects: the number of abnormal pixels (NP), the total light brightness value (TDN), and the absolute value of the difference (ADN). The results show that the images simulated by the STCIM are more accurate than the nine selected time series interpolation methods, and the image interpolation accuracy is significantly improved. Relevant research results have improved the quality of the VIIRS dataset, promoted the application research based on the VIIRS DNB long-time series night light remote sensing image, and enriched the night light remote sensing theory and method system. Full article
Show Figures

Graphical abstract

19 pages, 57018 KiB  
Article
Feature Selection for Edge Detection in PolSAR Images
by Anderson A. De Borba, Arnab Muhuri, Mauricio Marengoni and Alejandro C. Frery
Remote Sens. 2023, 15(9), 2479; https://doi.org/10.3390/rs15092479 - 08 May 2023
Cited by 2 | Viewed by 1383
Abstract
Edge detection is one of the most critical operations for moving from data to information. Finding edges between objects is relevant for image understanding, classification, segmentation, and change detection, among other applications. The Gambini Algorithm is a good choice for finding evidence of [...] Read more.
Edge detection is one of the most critical operations for moving from data to information. Finding edges between objects is relevant for image understanding, classification, segmentation, and change detection, among other applications. The Gambini Algorithm is a good choice for finding evidence of edges. It finds the point at which a function of the difference of properties is maximized. This algorithm is very general and accepts many types of objective functions. We use an objective function built with likelihoods. Imaging with active microwave sensors has a revolutionary role in remote sensing. This technology has the potential to provide high-resolution images regardless of the Sun’s illumination and almost independently of the atmospheric conditions. Images from PolSAR sensors are sensitive to the target’s dielectric properties and structures in several polarization states of the electromagnetic waves. Edge detection in polarimetric synthetic-aperture radar (PolSAR) imagery is challenging because of the low signal-to-noise ratio and the data format (complex matrices). There are several known marginal models stemming from the complex Wishart model for the full complex format. Each of these models renders a different likelihood. This work generalizes previous studies by incorporating the ratio of intensities as evidence for edge detection. We discuss solutions for the often challenging problem of parameter estimation. We propose a technique which rejects edge estimates built with thin evidence. Using this idea of discarding potentially irrelevant evidence, we propose a technique for fusing edge pieces of evidence from different channels that only incorporate those likely to contribute positively. We use this approach for both edge and change detection in single- and multilook images from three different sensors. Full article
(This article belongs to the Special Issue Advances in Microwave Remote Sensing for Earth Observation (EO))
Show Figures

Figure 1

27 pages, 32647 KiB  
Article
Research on Photon-Integrated Interferometric Remote Sensing Image Reconstruction Based on Compressed Sensing
by Jiawei Yong, Kexin Li, Zhejun Feng, Zengyan Wu, Shubing Ye, Baoming Song, Runxi Wei and Changqing Cao
Remote Sens. 2023, 15(9), 2478; https://doi.org/10.3390/rs15092478 - 08 May 2023
Viewed by 1279
Abstract
Achieving high-resolution remote sensing images is an important goal in the field of space exploration. However, the quality of remote sensing images is low after the use of traditional compressed sensing with the orthogonal matching pursuit (OMP) algorithm. This involves the reconstruction of [...] Read more.
Achieving high-resolution remote sensing images is an important goal in the field of space exploration. However, the quality of remote sensing images is low after the use of traditional compressed sensing with the orthogonal matching pursuit (OMP) algorithm. This involves the reconstruction of the sparse signals collected by photon-integrated interferometric imaging detectors, which limits the development of detection and imaging technology for photon-integrated interferometric remote sensing. We improved the OMP algorithm and proposed a threshold limited-generalized orthogonal matching pursuit (TL-GOMP) algorithm. In the comparison simulation involving the TL-GOMP and OMP algorithms of the same series, the peak signal-to-noise ratio value (PSNR) of the reconstructed image increased by 18.02%, while the mean square error (MSE) decreased the most by 53.62%. The TL-GOMP algorithm can achieve high-quality image reconstruction and has great application potential in photonic integrated interferometric remote sensing detection and imaging. Full article
(This article belongs to the Section Remote Sensing Image Processing)
Show Figures

Figure 1

21 pages, 10082 KiB  
Article
Construction and Assessment of a Drought-Monitoring Index Based on Multi-Source Data Using a Bias-Corrected Random Forest (BCRF) Model
by Yihao Wang, Linghua Meng, Huanjun Liu, Chong Luo, Yilin Bao, Beisong Qi and Xinle Zhang
Remote Sens. 2023, 15(9), 2477; https://doi.org/10.3390/rs15092477 - 08 May 2023
Cited by 1 | Viewed by 1569
Abstract
Agricultural drought significantly impacts agricultural production, highlighting the need for accurate monitoring. Accurate agricultural-drought-monitoring models are critical for timely warning and prevention. The random forest (RF) is a popular artificial intelligence method but has not been extensively studied for agricultural drought monitoring. Here, [...] Read more.
Agricultural drought significantly impacts agricultural production, highlighting the need for accurate monitoring. Accurate agricultural-drought-monitoring models are critical for timely warning and prevention. The random forest (RF) is a popular artificial intelligence method but has not been extensively studied for agricultural drought monitoring. Here, multi-source remote sensing data, including surface temperature, vegetation index, and soil moisture data, were used as independent variables; the 3-month standardized precipitation evapotranspiration index (SPEI_3) was used as the dependent variable. Soil texture and terrain data were used as auxiliary variables. The bias-corrected RF model was used to construct a random forest synthesized drought index (RFSDI). The drought-degree determination coefficients (R2) of the training and test sets reached 0.86 and 0.89, respectively. The RFSDI and SPEI_3 fit closely, with a correlation coefficient (R) above 0.92. The RFSDI accurately reflected typical drought years and effectively monitored agricultural drought in Northeast China (NEC). In the past 18 years, agricultural drought in NEC has generally decelerated. The degree and scope of drought impacts from 2003 to 2010 were greater than those from 2010 to 2020. Agricultural drought occurrence in NEC was associated with dominant climatic variables such as precipitation (PRE), surface temperature (Ts), relative humidity (RHU), and sunshine duration (SSD), alongside elevation and soil texture differences. The agricultural drought occurrence percentage at 50–500 m elevations reached 94.91%, and the percentage of occurrence in loam and sandy soils reached 90.31%. Water and temperature changes were significantly correlated with the occurrence of agricultural drought. Additionally, NEC showed an alternating cycle of drought and waterlogging of about 10 years. These results have significant application potential for agricultural drought monitoring and drought prevention in NEC and demonstrate a new approach to comprehensively evaluating agricultural drought. Full article
Show Figures

Graphical abstract

18 pages, 11161 KiB  
Article
Dynamic Evolution and Scenario Simulation of Ecosystem Services under the Impact of Land-Use Change in an Arid Inland River Basin in Xinjiang, China
by Zulipiya Kulaixi, Yaning Chen, Yupeng Li and Chuan Wang
Remote Sens. 2023, 15(9), 2476; https://doi.org/10.3390/rs15092476 - 08 May 2023
Cited by 2 | Viewed by 1743
Abstract
Ecosystem services (ESs) are crucial for sustainable development, as they impact human well-being. However, changes in land use/land cover (LULC) caused by climate change and social development can negatively affect ESs, particularly in arid river basins. This study focuses on current and future [...] Read more.
Ecosystem services (ESs) are crucial for sustainable development, as they impact human well-being. However, changes in land use/land cover (LULC) caused by climate change and social development can negatively affect ESs, particularly in arid river basins. This study focuses on current and future changes in LULC in the Kaxghar River Basin (KRB) in Xinjiang, China, to determine how these changes will affect the region’s ESs. The integrated PLUS-InVEST model was used to investigate the spatiotemporal distribution and changing patterns of habitat quality (HQ) and carbon storage (CS) under the natural increase scenario (NIS), economic development scenario (EDS), and water protection scenario (WPS). Additionally, the Ecosystem Service Contribution Index (ESCI) was also calculated to evaluate the contribution of LULC changes to ESs. The results show the following: (1) from 2000 to 2020, the average value of HQ in the KRB gradually decreased from 0.54 to 0.49 and CS trended slightly upward, with a total increase of 0.07 × 10⁶ t. Furthermore, the changes in CS were highly consistent with changes in LULC. (2) From 2020 to 2030, the area of low-grade (0–0.2) HQ saw a continuous increase, with the fastest growth occurring in 2030 under the EDS. Meanwhile, under the WPS, HQ significantly improved, expanding by 1238 km2 in area. Total CS under the three test scenarios tended to decline, with the NIS showing the smallest decrease. (3) The expansion of cropland and unused land had a negative impact on ESs, particularly on CS, whereas the conversion to grassland and forestland had a significant positive impact. In conclusion, these insights will enrich our understanding of ESs in the study area and contribute to balancing the relationship between ecological conservation and socioeconomic development in the Kaxghar River Basin, as well as in other parts of China’s arid Northwest and similar regions around the world. Full article
Show Figures

Graphical abstract

21 pages, 39138 KiB  
Article
Annual and Seasonal Trends of Vegetation Responses and Feedback to Temperature on the Tibetan Plateau since the 1980s
by Fangfang Wang, Yaoming Ma, Roshanak Darvishzadeh and Cunbo Han
Remote Sens. 2023, 15(9), 2475; https://doi.org/10.3390/rs15092475 - 08 May 2023
Cited by 4 | Viewed by 1661
Abstract
The vegetation–temperature relationship is crucial in understanding land–atmosphere interactions on the Tibetan Plateau. Although many studies have investigated the connections between vegetation and climate variables in this region using remote sensing technology, there remain notable gaps in our understanding of vegetation–temperature interactions over [...] Read more.
The vegetation–temperature relationship is crucial in understanding land–atmosphere interactions on the Tibetan Plateau. Although many studies have investigated the connections between vegetation and climate variables in this region using remote sensing technology, there remain notable gaps in our understanding of vegetation–temperature interactions over different timescales. Here, we combined site-level air temperature observations, information from the global inventory modeling and mapping studies (GIMMS) dataset, and moderate-resolution imaging spectroradiometer (MODIS) products to analyze the spatial and temporal patterns of air temperature, vegetation, and land surface temperature (LST) on the Tibetan Plateau at annual and seasonal scales. We achieved these spatiotemporal patterns by using Sen’s slope, sequential Mann–Kendall tests, and partial correlation analysis. The timescale differences of vegetation-induced LST were subsequently discussed. Our results demonstrate that a breakpoint of air temperature change occurred on the Tibetan Plateau during 1994–1998, dividing the study period (1982–2013) into two phases. A more significant greening response of NDVI occurred in the spring and autumn with earlier breakpoints and a more sensitive NDVI response occurred in recent warming phase. Both MODIS and GIMMS data showed a common increase in the normalized difference vegetation index (NDVI) on the Tibetan Plateau for all timescales, while the former had a larger greening area since 2000. The most prominent trends in NDVI and LST were identified in spring and autumn, respectively, and the largest areas of significant variation in NDVI and LST mostly occurred in winter and autumn, respectively. The partial correlation analysis revealed a significant negative impact of NDVI on LST during the annual scale and autumn, and it had a significant positive impact during spring. Our findings improve the general understanding of vegetation–climate relationships at annual and seasonal scales. Full article
Show Figures

Figure 1

24 pages, 26060 KiB  
Article
Confidence-Guided Planar-Recovering Multiview Stereo for Weakly Textured Plane of High-Resolution Image Scenes
by Chuanyu Fu, Nan Huang, Zijie Huang, Yongjian Liao, Xiaoming Xiong, Xuexi Zhang and Shuting Cai
Remote Sens. 2023, 15(9), 2474; https://doi.org/10.3390/rs15092474 - 08 May 2023
Viewed by 1213
Abstract
Multiview stereo (MVS) achieves efficient 3D reconstruction on Lambertian surfaces and strongly textured regions. However, the reconstruction of weakly textured regions, especially planar surfaces in weakly textured regions, still faces significant challenges due to the fuzzy matching problem of photometric consistency. In this [...] Read more.
Multiview stereo (MVS) achieves efficient 3D reconstruction on Lambertian surfaces and strongly textured regions. However, the reconstruction of weakly textured regions, especially planar surfaces in weakly textured regions, still faces significant challenges due to the fuzzy matching problem of photometric consistency. In this paper, we propose a multiview stereo for recovering planar surfaces guided by confidence calculations, resulting in the construction of large-scale 3D models for high-resolution image scenes. Specifically, a confidence calculation method is proposed to express the reliability degree of plane hypothesis. It consists of multiview consistency and patch consistency, which characterize global contextual information and local spatial variation, respectively. Based on the confidence of plane hypothesis, the proposed plane supplementation generates new reliable plane hypotheses. The new planes are embedded in the confidence-driven depth estimation. In addition, an adaptive depth fusion approach is proposed to allow regions with insufficient visibility to be effectively fused into the dense point clouds. The experimental results illustrate that the proposed method can lead to a 3D model with competitive completeness and high accuracy compared with state-of-the-art methods. Full article
(This article belongs to the Special Issue New Tools or Trends for Large-Scale Mapping and 3D Modelling)
Show Figures

Figure 1

20 pages, 54462 KiB  
Technical Note
Study on the Source of Debris Flow in the Northern Scenic Spot of Changbai Mountain Based on Multi-Source Data
by Jiahao Yan, Yichen Zhang, Jiquan Zhang, Yanan Chen and Zhen Zhang
Remote Sens. 2023, 15(9), 2473; https://doi.org/10.3390/rs15092473 - 08 May 2023
Viewed by 1202
Abstract
The northern scenic area of Changbai Mountain is a high-incidence area of debris flow disasters, which seriously threaten the safety of tourist’s lives and property. Monitoring debris flow and providing early warning is critical for timely avoidance. Monitoring the change of debris flow [...] Read more.
The northern scenic area of Changbai Mountain is a high-incidence area of debris flow disasters, which seriously threaten the safety of tourist’s lives and property. Monitoring debris flow and providing early warning is critical for timely avoidance. Monitoring the change of debris flow source is an effective way to predict debris flow, and the change of source can be reflected in the settlement deformation of the study area. The offset tracking technique (OT) is insensitive to the coherence of SAR images and can resist the decoherence of D-InSAR and SBSA-InSAR to a certain extent. It is a technical means for monitoring large gradient deformation. It has been widely used in the field of seismic activity, glaciers and landslides in recent years, but few scholars have applied this technique in the field of debris flow. In this paper, we use OT techniques in combination with field surveys, Google imagery and Sentinel-1 data to monitor surface deformation in the northern scenic area of Changbai Mountain in 2017 and use D-InSAR techniques to compare and complement the OT monitoring results. The results of this study show that for monitoring surface deformation in the study area after a mudslide, it is better to use both methods to determine the surface deformation in the study area rather than one, and that both methods have their own advantages and disadvantages and yet can complement each other. Finally, we have predicted the development trend of mudflows in the study area by combining the calculated single mudflow solids washout, which will help to improve the long-term monitoring and warning capability of mudflows in the study area. The study also enriches the application of offset-tracking technology and D-InSAR in the field of geohazard monitoring and provides new ideas and methods for the study of mudflow material source changes. Full article
(This article belongs to the Topic Natural Hazards and Disaster Risks Reduction)
Show Figures

Figure 1

28 pages, 9281 KiB  
Article
Spectral Correlation and Spatial High–Low Frequency Information of Hyperspectral Image Super-Resolution Network
by Jing Zhang, Renjie Zheng, Xu Chen, Zhaolong Hong, Yunsong Li and Ruitao Lu
Remote Sens. 2023, 15(9), 2472; https://doi.org/10.3390/rs15092472 - 08 May 2023
Cited by 3 | Viewed by 1412
Abstract
Hyperspectral images (HSIs) generally contain tens or even hundreds of spectral segments within a specific frequency range. Due to the limitations and cost of imaging sensors, HSIs often trade spatial resolution for finer band resolution. To compensate for the loss of spatial resolution [...] Read more.
Hyperspectral images (HSIs) generally contain tens or even hundreds of spectral segments within a specific frequency range. Due to the limitations and cost of imaging sensors, HSIs often trade spatial resolution for finer band resolution. To compensate for the loss of spatial resolution and maintain a balance between space and spectrum, existing algorithms were used to obtain excellent results. However, these algorithms could not fully mine the coupling relationship between the spectral domain and spatial domain of HSIs. In this study, we presented a spectral correlation and spatial high–low frequency information of a hyperspectral image super-resolution network (SCSFINet) based on the spectrum-guided attention for analyzing the information already obtained from HSIs. The core of our algorithms was the spectral and spatial feature extraction module (SSFM), consisting of two key elements: (a) spectrum-guided attention fusion (SGAF) using SGSA/SGCA and CFJSF to extract spectral–spatial and spectral–channel joint feature attention, and (b) high- and low-frequency separated multi-level feature fusion (FSMFF) for fusing the multi-level information. In the final stage of upsampling, we proposed the channel grouping and fusion (CGF) module, which can group feature channels and extract and merge features within and between groups to further refine the features and provide finer feature details for sub-pixel convolution. The test on the three general hyperspectral datasets, compared to the existing hyperspectral super-resolution algorithms, suggested the advantage of our method. Full article
Show Figures

Graphical abstract

24 pages, 11993 KiB  
Article
Effects of Land Cover Change on Vegetation Carbon Source/Sink in Arid Terrestrial Ecosystems of Northwest China, 2001–2018
by Haiyang Tu, Guli Jiapaer, Tao Yu, Liancheng Zhang, Bojian Chen, Kaixiong Lin and Xu Li
Remote Sens. 2023, 15(9), 2471; https://doi.org/10.3390/rs15092471 - 08 May 2023
Cited by 3 | Viewed by 1726
Abstract
The arid terrestrial ecosystem carbon cycle is one of the most important parts of the global carbon cycle, but it is vulnerable to external disturbances. As the most direct factor affecting the carbon cycle, how land cover change affects vegetation carbon sources/sinks in [...] Read more.
The arid terrestrial ecosystem carbon cycle is one of the most important parts of the global carbon cycle, but it is vulnerable to external disturbances. As the most direct factor affecting the carbon cycle, how land cover change affects vegetation carbon sources/sinks in arid terrestrial ecosystems remains unclear. In this study, we chose the arid region of northwest China (ARNWC) as the study area and used net ecosystem productivity (NEP) as an indicator of vegetation carbon source/sink. Subsequently, we described the spatial distribution and temporal dynamics of vegetation carbon sources/sinks in the ARNWC from 2001–2018 by combining the Carnegie-Ames-Stanford Approach (CASA) and a soil microbial heterotrophic respiration (RH) model and assessed the effects of land cover change on them through modeling scenario design. We found that land cover change had an obvious positive impact on vegetation carbon sinks. Among them, the effect of land cover type conversion contributed to an increase in total NEP of approximately 1.77 Tg C (reaching 15.55% of the original value), and after simultaneously considering the effect of vegetation growth enhancement, it contributed to an increase in total NEP of approximately 14.75 Tg C (reaching 129.61% of the original value). For different land cover types, cropland consistently contributed the most to the increment of NEP, and the regeneration of young and middle-aged forests also led to a significant increase in forest carbon sinks. Thus, our findings provide a reference for assessing the effects of land cover change on vegetation carbon sinks, and they indicated that cropland expansion and anthropogenic management dominated the growth of vegetation carbon sequestration in the ARNWC, that afforestation also benefits the carbon sink capacity of terrestrial ecosystems, and that attention should be paid to restoring and protecting native vegetation in forestland and grassland regions in the future. Full article
(This article belongs to the Special Issue Remote Sensing of Interaction between Human and Natural Ecosystem)
Show Figures

Graphical abstract

32 pages, 5326 KiB  
Article
Multi-Temporal SamplePair Generation for Building Change Detection Promotion in Optical Remote Sensing Domain Based on Generative Adversarial Network
by Yute Li, He Chen, Shan Dong, Yin Zhuang and Lianlin Li
Remote Sens. 2023, 15(9), 2470; https://doi.org/10.3390/rs15092470 - 08 May 2023
Cited by 1 | Viewed by 1770
Abstract
Change detection is a critical task in remote sensing Earth observation for identifying changes in the Earth’s surface in multi-temporal image pairs. However, due to the time-consuming nature of image collection, labor-intensive pixel-level labeling with the rare occurrence of building changes, and the [...] Read more.
Change detection is a critical task in remote sensing Earth observation for identifying changes in the Earth’s surface in multi-temporal image pairs. However, due to the time-consuming nature of image collection, labor-intensive pixel-level labeling with the rare occurrence of building changes, and the limitation of the observation location, it is difficult to build a large, class-balanced, and diverse building change detection dataset, which can result in insufficient changed sample pairs for training change detection models, thus degrading their performance. Thus, in this article, given that data scarcity and the class-imbalance issue lead to the insufficient training of building change detection models, a novel multi-temporal sample pair generation method, namely, Image-level Sample Pair Generation (ISPG), is proposed to improve the change detection performance through dataset expansion, which can generate more valid multi-temporal sample pairs to overcome the limitation of the small amount of change information and class-imbalance issue in existing datasets. To achieve this, a Label Translation GAN (LT-GAN) was designed to generate complete remote sensing images with diverse building changes and background pseudo-changes without any of the complex blending steps used in previous works. To obtain more detailed features in image pair generation for building change detection, especially the surrounding context of the buildings, we designed multi-scale adversarial loss (MAL) and feature matching loss (FML) to supervise and improve the quality of the generated bitemporal remote sensing image pairs. On the other hand, we also consider that the distribution of generated buildings should follow the pattern of human-built structures. The proposed approach was evaluated on two building change detection datasets (LEVIR-CD and WHU-CD), and the results proved that the proposed method can achieve state-of-the-art (SOTA) performance, even if using plain models for change detection. In addition, the proposed approach to change detection image pair generation is a plug-and-play solution that can be used to improve the performance of any change detection model. Full article
Show Figures

Figure 1

21 pages, 6799 KiB  
Article
FEPVNet: A Network with Adaptive Strategies for Cross-Scale Mapping of Photovoltaic Panels from Multi-Source Images
by Buyu Su, Xiaoping Du, Haowei Mu, Chen Xu, Xuecao Li, Fang Chen and Xiaonan Luo
Remote Sens. 2023, 15(9), 2469; https://doi.org/10.3390/rs15092469 - 08 May 2023
Cited by 3 | Viewed by 1351
Abstract
The world is transitioning to renewable energy, with photovoltaic (PV) solar power being one of the most promising energy sources. Large-scale PV mapping provides the most up-to-date and accurate PV geospatial information, which is crucial for planning and constructing PV power plants, optimizing [...] Read more.
The world is transitioning to renewable energy, with photovoltaic (PV) solar power being one of the most promising energy sources. Large-scale PV mapping provides the most up-to-date and accurate PV geospatial information, which is crucial for planning and constructing PV power plants, optimizing energy structure, and assessing the ecological impact of PVs. However, previous methods of PV extraction relied on simple models and single data sources, which could not accurately obtain PV geospatial information. Therefore, we propose the Filter-Embedded Network (FEPVNet), which embeds high-pass and low-pass filters and Polarized Self-Attention (PSA) into a High-Resolution Network (HRNet) to improve its noise resistance and adaptive feature extraction capabilities, ultimately enhancing the accuracy of PV extraction. We also introduce three data migration strategies by combining Sentinel-2, Google-14, and Google-16 images in varying proportions and transferring the FEPVNet trained on Sentinel-2 images to Gaofen-2 images, which improves the generalization performance of models trained on a single data source for extracting PVs in images of different scales. Our model improvement experiments demonstrate that the Intersection over Union (IoU) of FEPVNet in segmenting China PVs in Sentinel-2 images reaches 88.68%, a 2.37% increase compared to the HRNet. Furthermore, we use FEPVNet and the optimal migration strategy to extract photovoltaics across scales, achieving a precision of 94.37%. In summary, this study proposes the FEPVNet model with adaptive strategies for extracting PVs from multiple image sources, with significant potential for application in large-scale PV mapping. Full article
Show Figures

Graphical abstract

18 pages, 4945 KiB  
Article
Predicting Dust-Storm Transport Pathways Using a Convolutional Neural Network and Geographic Context for Impact Adaptation and Mitigation in Urban Areas
by Mahdis Yarmohamadi, Ali Asghar Alesheikh, Mohammad Sharif and Hossein Vahidi
Remote Sens. 2023, 15(9), 2468; https://doi.org/10.3390/rs15092468 - 08 May 2023
Cited by 3 | Viewed by 1880
Abstract
Dust storms are natural disasters that have a serious impact on various aspects of human life and physical infrastructure, particularly in urban areas causing health risks, reducing visibility, impairing the transportation sector, and interfering with communication systems. The ability to predict the movement [...] Read more.
Dust storms are natural disasters that have a serious impact on various aspects of human life and physical infrastructure, particularly in urban areas causing health risks, reducing visibility, impairing the transportation sector, and interfering with communication systems. The ability to predict the movement patterns of dust storms is crucial for effective disaster prevention and management. By understanding how these phenomena travel, it is possible to identify the areas that are most at risk and take appropriate measures to mitigate their impact on urban environments. Deep learning methods have been demonstrated to be efficient tools for predicting moving processes while considering multiple geographic information sources. By developing a convolutional neural network (CNN) method, this study aimed to predict the pathway of dust storms that occur in arid regions in central and southern Asia. A total of 54 dust-storm events were extracted from the modern-era retrospective analysis for research and applications, version 2 (MERRA-2) product to train the CNN model and evaluate the prediction results. In addition to dust-storm data (aerosol optical depth (AOD) data), geographic context information including relative humidity, surface air temperature, surface wind direction, surface skin temperature, and surface wind speed was considered. These features were chosen using the random forest feature importance method and had feature importance values of 0.2, 0.1, 0.06, 0.03, and 0.02, respectively. The results show that the CNN model can promisingly predict the dust-transport pathway, such that for the 6, 12, 18, and 24-h time steps, the overall accuracy values were 0.9746, 0.975, 0.9751, and 0.9699, respectively; the F1 score values were 0.7497, 0.7525, 0.7476, and 0.6769, respectively; and the values of the kappa coefficient were 0.7369, 0.74, 0.7351, and 0.6625, respectively. Full article
(This article belongs to the Special Issue Remote Sensing Based Urban Development and Climate Change Research)
Show Figures

Figure 1

21 pages, 4187 KiB  
Article
A Priori Knowledge Based Ground Moving Target Indication Technique Applied to Distributed Spaceborne SAR System
by Bin Cai, Xiaolong Hao, Li Chen, Jia Liang, Tianhao Cheng and Ying Luo
Remote Sens. 2023, 15(9), 2467; https://doi.org/10.3390/rs15092467 - 08 May 2023
Viewed by 1081
Abstract
Through formation flying, the distributed spaceborne SAR(synthetic aperture radar) system can increase the number of spatial degree of freedoms (DOFs) and provide flexible multi-baselines for SAR-GMTI (ground moving target indication), which improves the system performance. This paper proposes an a priori knowledge-based adaptive [...] Read more.
Through formation flying, the distributed spaceborne SAR(synthetic aperture radar) system can increase the number of spatial degree of freedoms (DOFs) and provide flexible multi-baselines for SAR-GMTI (ground moving target indication), which improves the system performance. This paper proposes an a priori knowledge-based adaptive clutter cancellation and moving target detection technique applied to the distributed spaceborne SAR-GMTI systems. Firstly, the adaptive clutter cancellation technique is exploited to suppress the ground clutter. A priori knowledge, such as road network information, is integrated to the adaptive clutter cancellation processor to reduce any moving target steering vector mismatch. Secondly, adaptive matched filter (AMF) and adaptive beamformer orthogonal rejection test (ABORT) are exploited as adaptive detection techniques for moving target detection. Due to the dense road network, the moving target steering vector estimation may be ambiguous for the different position and orientation of the roads. The multiple hypothesis testing (MHT) technique is proposed to detect the moving targets and resolve the potential ambiguities. A scheme is exploited to detect, classify, and relocate the moving targets. Finally, simulation experiments and performance analysis have demonstrated the effectiveness and robustness of the proposed technique. Full article
(This article belongs to the Special Issue Advance in SAR Image Despeckling)
Show Figures

Figure 1

20 pages, 5926 KiB  
Article
A New Method for Crop Type Mapping at the Regional Scale Using Multi-Source and Multi-Temporal Sentinel Imagery
by Xiaohu Wang, Shifeng Fang, Yichen Yang, Jiaqiang Du and Hua Wu
Remote Sens. 2023, 15(9), 2466; https://doi.org/10.3390/rs15092466 - 08 May 2023
Cited by 2 | Viewed by 2357
Abstract
Crop type mapping at high resolution is crucial for various purposes related to agriculture and food security, including the monitoring of crop yields, evaluating the potential effects of natural disasters on agricultural production, analyzing the potential impacts of climate change on agriculture, etc. [...] Read more.
Crop type mapping at high resolution is crucial for various purposes related to agriculture and food security, including the monitoring of crop yields, evaluating the potential effects of natural disasters on agricultural production, analyzing the potential impacts of climate change on agriculture, etc. However, accurately mapping crop types and ranges on large spatial scales remains a challenge. For the accurate mapping of crop types at the regional scale, this paper proposed a crop type mapping method based on the combination of multiple single-temporal feature images and time-series feature images derived from Sentinel-1 (SAR) and Sentinel-2 (optical) satellite imagery on the Google Earth Engine (GEE) platform. Firstly, crop type classification was performed separately using multiple single-temporal feature images and the time-series feature image. Secondly, with the help of information entropy, this study proposed a pixel-scale crop type classification accuracy evaluation metric, i.e., the CA-score, which was used to conduct a vote on the classification results of multiple single-temporal images and the time-series feature image to obtain the final crop type map. A comparative analysis showed that the proposed classification method had excellent performance and that it can achieve accurate mapping of multiple crop types at a 10 m resolution for large spatial scales. The overall accuracy (OA) and the kappa coefficient (KC) were 84.15% and 0.80, respectively. Compared with the classification results that were based on the time-series feature image, the OA was improved by 3.37%, and the KC was improved by 0.03. In addition, the CA-score proposed in this study can effectively reflect the accuracy of crop identification and can serve as a pixel-scale classification accuracy evaluation metric, providing a more comprehensive visual interpretation of the classification accuracy. The proposed method and metrics have the potential to be applied to the mapping of larger study areas with more complex land cover types using remote sensing. Full article
(This article belongs to the Section Remote Sensing in Agriculture and Vegetation)
Show Figures

Figure 1

16 pages, 2940 KiB  
Technical Note
High-Resolution and Wide-Swath SAR Imaging with Space–Time Coding Array
by Kun Yu, Shengqi Zhu, Lan Lan and Biao Yang
Remote Sens. 2023, 15(9), 2465; https://doi.org/10.3390/rs15092465 - 08 May 2023
Cited by 1 | Viewed by 1434
Abstract
To achieve high-resolution and wide-swath (HRWS) synthetic aperture radar (SAR) images, this paper focuses on resolving the problem of separating range-ambiguous echoes with the space–time coding (STC) array. At the modeling stage, the transmit elements and pulses of the STC array are configured [...] Read more.
To achieve high-resolution and wide-swath (HRWS) synthetic aperture radar (SAR) images, this paper focuses on resolving the problem of separating range-ambiguous echoes with the space–time coding (STC) array. At the modeling stage, the transmit elements and pulses of the STC array are configured with time delay and phase coding modulation, which introduces extra degrees of freedom (DOFs) in the transmit domain. To separate the echoes corresponding to different range-ambiguity regions, the equivalent transmit beamforming is performed in the two-dimensional space–frequency domain. Moreover, in order to compensate for the loss of range resolution during the beamforming progress, the frequency splicing method is proposed. At the analysis stage, the distributed target simulation is provided to demonstrate the effectiveness of obtaining HRWS SAR images in the STC radar. Additionally, the performance of resolving range ambiguity is compared with the traditional radar in terms of the range-ambiguity-to-signal ratio (RASR). Full article
(This article belongs to the Special Issue Radar Techniques and Imaging Applications)
Show Figures

Figure 1

25 pages, 17056 KiB  
Article
SIGNet: A Siamese Graph Convolutional Network for Multi-Class Urban Change Detection
by Yanpeng Zhou, Jinjie Wang, Jianli Ding, Bohua Liu, Nan Weng and Hongzhi Xiao
Remote Sens. 2023, 15(9), 2464; https://doi.org/10.3390/rs15092464 - 08 May 2023
Cited by 4 | Viewed by 2334
Abstract
Detecting changes in urban areas presents many challenges, including complex features, fast-changing rates, and human-induced interference. At present, most of the research on change detection has focused on traditional binary change detection (BCD), which becomes increasingly unsuitable for the diverse urban change detection [...] Read more.
Detecting changes in urban areas presents many challenges, including complex features, fast-changing rates, and human-induced interference. At present, most of the research on change detection has focused on traditional binary change detection (BCD), which becomes increasingly unsuitable for the diverse urban change detection tasks as cities grow. Previous change detection networks often rely on convolutional operations, which struggle to capture global contextual information and underutilize category semantic information. In this paper, we propose SIGNet, a Siamese graph convolutional network, to solve the above problems and improve the accuracy of urban multi-class change detection (MCD) tasks. After maximizing the fusion of change differences at different scales using joint pyramidal upsampling (JPU), SIGNet uses a graph convolution-based graph reasoning (GR) method to construct static connections of urban features in space and a graph cross-attention method to couple the dynamic connections of different types of features during the change process. Experimental results show that SIGNet achieves state-of-the-art accuracy on different MCD datasets when capturing contextual relationships between different regions and semantic correlations between different categories. There are currently few pixel-level datasets in the MCD domain. We introduce a new well-labeled dataset, CNAM-CD, which is a large MCD dataset containing 2508 pairs of high-resolution images. Full article
Show Figures

Figure 1

17 pages, 8950 KiB  
Article
Improvement of Lunar Surface Dating Accuracy Utilizing Crater Degradation Model: A Case Study of the Chang’e-5 Sampling Area
by Feiyue Zhao, Wei Zuo and Chunlai Li
Remote Sens. 2023, 15(9), 2463; https://doi.org/10.3390/rs15092463 - 08 May 2023
Viewed by 1114
Abstract
Taking the Chang’e-5 (CE-5) sampling area as an example, this study carried out an investigation on improving the crater size-frequency distribution (CSFD) dating accuracy of lunar surface geologic units based on the crater degradation model. We constructed a three-parted crater degradation model, which [...] Read more.
Taking the Chang’e-5 (CE-5) sampling area as an example, this study carried out an investigation on improving the crater size-frequency distribution (CSFD) dating accuracy of lunar surface geologic units based on the crater degradation model. We constructed a three-parted crater degradation model, which consists of the diffusion equation describing crater degradation and equations describing the original crater profile for small craters (D < 1 km) and larger craters (D ≥ 1 km). A method that can improve the accuracy of CSFD dating was also proposed in this study, which utilizes the newly constructed degradation model to simulate the degradation process of the craters to help determine the crater degradation process and screen out the craters suitable for CSFD analysis. This method shows a good performance in regional dating. The age determined for the CE-5 sampling area is 2.0 ± 0.2 Ga, very close to the 2.03 ± 0.004 Ga of isotopic dating result of the returned sample. We found that the degradation state of the craters simulated by our constructed degradation model is highly consistent with the real existing state of the craters in terms of their topographic, geomorphological, and compositional (e.g., FeO) features. It fully demonstrates that the degradation model proposed in this study is effective and reliable for describing and distinguishing the degradation state of craters over time due to the cumulative effects of small craters. The proposed method can effectively distinguish between diffusively degraded (which conform to the degradation model) and non-diffusively degraded (which do not conform to the degradation model) craters and improve the CSFD accuracy through the selection of the craters. This not only provides an effective solution to the problem of obtaining a more “exact” frequency distribution of craters, which has long plagued the practical application of the CSFD method in dating the lunar surface but also advances our understanding of the evolutionary history of the geologic units of the study area. The results of this work are important for the in-depth study of the formation and evolution of the moon, especially for lunar chronology. Full article
(This article belongs to the Special Issue Future of Lunar Exploration)
Show Figures

Figure 1

22 pages, 6960 KiB  
Article
Ocean Eddies in the Drake Passage: Decoding Their Three-Dimensional Structure and Evolution
by Xiayan Lin, Hui Zhao, Yu Liu, Guoqing Han, Han Zhang and Xiaomei Liao
Remote Sens. 2023, 15(9), 2462; https://doi.org/10.3390/rs15092462 - 08 May 2023
Cited by 1 | Viewed by 2621
Abstract
The Drake Passage is known for its abundant mesoscale eddies, but little is known about their three-dimensional characteristics, which hinders our understanding of their impact on eddy-induced transport and deep-sea circulation. A 10-year study was conducted using GLORYS12 Mercator Ocean reanalysis data from [...] Read more.
The Drake Passage is known for its abundant mesoscale eddies, but little is known about their three-dimensional characteristics, which hinders our understanding of their impact on eddy-induced transport and deep-sea circulation. A 10-year study was conducted using GLORYS12 Mercator Ocean reanalysis data from 2009 to 2018. The study analyzed the statistical characteristics of eddies in the Drake Passage, spanning from the surface down to a depth of 2000 m in three dimensions. The findings indicate that the mean radius of the eddies is 35.5 km, with a mean lifespan of 12.3 weeks and mean vorticity of 2.2 × 10⁻⁵ s−1. The eddies are most active and energetic near the three main fronts and propagate north-eastward at an average distance of 97.8 km. The eddy parameters vary with water depth, with more anticyclones detected from the surface to 400 m, displaying a larger radius and longer propagation distance. Cyclones have longer lifespans and greater vorticity. However, beyond 400 m, there is not much difference between anticyclones and cyclones. Approximately 23.3% of the eddies reach a depth of 2000 m, with larger eddies tending to penetrate deeper. The eddies come in three different shapes, bowl-shaped (52.7%), lens-shaped (27.1%) and cone-shaped (20.2%). They exhibit annual and monthly distribution patterns. Due to its high latitude location, the Drake Passage has strong rotation and weak stratification, resulting in the generation of small and deep-reaching eddies. These eddies contribute to the formation of Antarctic intermediate water and lead to modulation of turbulent dissipation. Full article
Show Figures

Figure 1

17 pages, 9959 KiB  
Article
A Localization and Tracking System Using Single WiFi Link
by Li-Ping Tian, Liang-Qin Chen, Zhi-Meng Xu and Zhizhang (David) Chen
Remote Sens. 2023, 15(9), 2461; https://doi.org/10.3390/rs15092461 - 07 May 2023
Viewed by 1548
Abstract
Like its outdoor counterpart (e.g., GPS), an indoor tracking system can bring about disruptive changes in how we live and work. This paper proposes a location and tracking system using a single WiFi link based on channel state information. The system can realize [...] Read more.
Like its outdoor counterpart (e.g., GPS), an indoor tracking system can bring about disruptive changes in how we live and work. This paper proposes a location and tracking system using a single WiFi link based on channel state information. The system can realize real-time, decimeter-level localization and tracking. In this system, phase calibration and static path elimination are realized by multiplying the conjugate signals of different antennas. Then, a three-dimensional MUSIC algorithm is employed to estimate the angle of arrival (AOA), the time of flight (TOF), and the velocity of a target. A scheme is then developed to adjust the MUSIC search range and reduce the computation time from about ten hours to tens of seconds. The Widar2.0 data set from Tsinghua University are used for the experiments; the proposed system is found to have an average tracking error of 0.68 m in the three environments of classroom, office, and corridor, which is better than the existing single link localization and tracking system. Full article
(This article belongs to the Section Engineering Remote Sensing)
Show Figures

Figure 1

16 pages, 4163 KiB  
Technical Note
Comparative Analysis of Remote Sensing Storage Tank Detection Methods Based on Deep Learning
by Lu Fan, Xiaoying Chen, Yong Wan and Yongshou Dai
Remote Sens. 2023, 15(9), 2460; https://doi.org/10.3390/rs15092460 - 07 May 2023
Cited by 1 | Viewed by 1836
Abstract
Since the Industrial Revolution, methane has become the second most important greenhouse gas component after CO2 and the second most important culprit of global warming, leading to serious climate change problems such as droughts, fires, floods, and glacial melting. While most of [...] Read more.
Since the Industrial Revolution, methane has become the second most important greenhouse gas component after CO2 and the second most important culprit of global warming, leading to serious climate change problems such as droughts, fires, floods, and glacial melting. While most of the methane in the atmosphere comes from emissions from energy activities such as petroleum refining, storage tanks are an important source of methane emissions during the extraction and processing of crude oil and natural gas. Therefore, the use of high-resolution remote sensing image data for oil and gas production sites to achieve efficient and accurate statistics for storage tanks is important to promote the strategic goals of “carbon neutrality and carbon peaking”. Compared with traditional statistical methods for studying oil storage tanks, deep learning-based target detection algorithms are more powerful for multi-scale targets and complex background conditions. In this paper, five deep learning detection algorithms, Faster RCNN, YOLOv5, YOLOv7, RetinaNet and SSD, were selected to conduct experiments on 3568 remote sensing images from five different datasets. The results show that the average accuracy of the Faster RCNN, YOLOv5, YOLOv7 and SSD algorithms is above 0.84, and the F1 scores of YOLOv5, YOLOv7 and SSD algorithms are above 0.80, among which the highest detection accuracy is shown by the SSD algorithm at 0.897 with a high F1 score, while the lowest average accuracy is shown by RetinaNet at only 0.639. The training results of the five algorithms were validated on three images containing differently sized oil storage tanks in complex backgrounds, and the validation results obtained were better, providing more accurate references for practical detection applications in remote sensing of oil storage tank targets in the future. Full article
Show Figures

Graphical abstract

26 pages, 25669 KiB  
Article
P-Band UAV-SAR 4D Imaging: A Multi-Master Differential SAR Tomography Approach
by Zhen Wang, Yangkai Wei, Zegang Ding, Jian Zhao, Tao Sun, Yan Wang, Han Li and Tao Zeng
Remote Sens. 2023, 15(9), 2459; https://doi.org/10.3390/rs15092459 - 07 May 2023
Cited by 1 | Viewed by 1511
Abstract
Due to its rapid deployment, high-flexibility, and high-accuracy advantages, the unmanned-aerial-vehicle (UAV)-based differential synthetic aperture radar (SAR) tomography (D-TomoSAR) technique presents an attractive approach for urban risk monitoring. With its sufficiently long spatial and temporal baselines, it offers elevation and velocity resolution beyond [...] Read more.
Due to its rapid deployment, high-flexibility, and high-accuracy advantages, the unmanned-aerial-vehicle (UAV)-based differential synthetic aperture radar (SAR) tomography (D-TomoSAR) technique presents an attractive approach for urban risk monitoring. With its sufficiently long spatial and temporal baselines, it offers elevation and velocity resolution beyond the dimensions of range and azimuth, enabling four-dimensional (4D) SAR imaging. In the case of P-band UAV-SAR, a long spatial-temporal baseline is necessary to achieve high enough elevation-velocity dimensional resolution. Although P-band UAV-SAR maintains temporal coherence, it still faces two issues due to the extended spatial baseline, i.e., low spatial coherence and high sidelobes. To tackle these problems, we introduce a multi-master (MM) D-TomoSAR approach, contributing three main points. Firstly, the traditional D-TomoSAR signal model is extended to a MM one, which improves the average coherence coefficient and the number of baselines (NOB) as well as suppresses sidelobes. Secondly, a baseline distribution optimization processing is proposed to equalize the spatial–temporal baseline distribution, achieve more uniform spectrum samplings, and reduce sidelobes. Thirdly, a clustering-based outlier elimination method is employed to ensure 4D imaging quality. The proposed method is effectively validated through computer simulation and P-band UAV-SAR experiment. Full article
(This article belongs to the Special Issue Advances in SAR: Sensors, Methodologies, and Applications II)
Show Figures

Figure 1

16 pages, 40233 KiB  
Article
Holocene Activity of the Wudaoliang–Changshagongma Fault of the Eastern Tibetan Plateau
by Mingjian Liang, Yun Dong, Cheng Liao, Yulong Qin, Huiping Zhang, Weiwei Wu, Hong Zuo, Wenying Zhou, Changli Xiong, Li Yang, Yue Gong and Tian Li
Remote Sens. 2023, 15(9), 2458; https://doi.org/10.3390/rs15092458 - 07 May 2023
Cited by 1 | Viewed by 1090
Abstract
The Wudaoliang–Changshagongma fault is one of the NW-trending faults located within the southern Bayan Har Block of the Tibetan Plateau in China. In this paper, we used high-resolution imagery and digital elevation model data to study the geomorphological and geological characteristics of the [...] Read more.
The Wudaoliang–Changshagongma fault is one of the NW-trending faults located within the southern Bayan Har Block of the Tibetan Plateau in China. In this paper, we used high-resolution imagery and digital elevation model data to study the geomorphological and geological characteristics of the fault. Furthermore, the result also determined the fault trace and estimated the average horizontal slip rate of the fault since the late Quaternary to have been 2.6 ± 0.6 mm/a. This slip rate is approximately equivalent to that of the Awancang, Madoi–Garde, and Dari faults, which are also located within the block. Furthermore, the slip rates of these faults obtained by remote sensing and geological methods are consistent with GPS observations. It indicates that tectonic deformation within the block is continuous and diffuse. Using trenching study results and sedimentary radiocarbon dating, we identified four paleoearthquake events that occurred at 42,378–32,975, 33,935–20,663, 5052–4862, and after 673–628 cal BP, respectively. The recurrence intervals of large earthquakes on the faults within the block are much longer than those of the boundary faults, and the slip rates are also smaller, indicating that faults within the block play a regulatory role in the tectonic deformation of the Bayan Har Block. Full article
Show Figures

Figure 1

22 pages, 17367 KiB  
Article
Investigating the Feasibility of Using Satellite Rainfall for the Integrated Prediction of Flood and Landslide Hazards over Shaanxi Province in Northwest China
by Sheng Wang, Ke Zhang, Lijun Chao, Guoding Chen, Yi Xia and Chuntang Zhang
Remote Sens. 2023, 15(9), 2457; https://doi.org/10.3390/rs15092457 - 07 May 2023
Cited by 7 | Viewed by 1597
Abstract
Rainfall-triggered flood and landslide hazards pose significant threats to human lives and infrastructure worldwide. This study aims to evaluate the applicability of three satellite rainfall data sets—namely, CMORPH, GPM, and TRMM—for the prediction of flood and landslide hazards using a coupled hydrological-slope stability [...] Read more.
Rainfall-triggered flood and landslide hazards pose significant threats to human lives and infrastructure worldwide. This study aims to evaluate the applicability of three satellite rainfall data sets—namely, CMORPH, GPM, and TRMM—for the prediction of flood and landslide hazards using a coupled hydrological-slope stability model. The spatial distribution of annual rainfall from the three satellite data sets was similar to that of gauge rainfall, with an increasing trend from the north to the south of Shaanxi Province. The average annual rainfall of CMORPH was the lowest, while that of TRMM was the highest. The modeled discharges forcing by satellite rainfall generally matched the observed discharges at four hydrological stations for the period 2010–2012, with average correlation coefficients of 0.51, 0.61, and 0.57 for the CMORPH, GPM, and TRMM rainfall, respectively. The exceedance probabilities of modeled discharges for the three satellite rainfall data sets were close to those of the observations, particularly when the discharges were low. Moreover, the landslide prediction results demonstrated that the three satellite rainfall data sets could simulate the spatial distribution of landslide events well; these simulations were consistent with the information in the landslide inventory map. Furthermore, when compared to the classical Intensity-Duration (ID) rainfall threshold method, the physically based slope stability model presented higher global accuracy under all three satellite rainfall data sets. The global accuracy of GPM rainfall was the highest among the three data sets (0.973 for GPM vs. 0.951 for CMORPH and 0.965 for TRMM), indicating that GPM rainfall provides the highest quality compared to CMORPH and TRMM rainfall. These findings provide a crucial basis for the application of satellite rainfall data in the context of flood and landslide prediction. Full article
Show Figures

Figure 1

24 pages, 15975 KiB  
Article
Research on the Relationship between the Structure of Forest and Grass Ecological Spaces and Ecological Service Capacity: A Case Study of the Wuding River Basin
by Yufan Zeng, Qiang Yu, Xiaoci Wang, Jun Ma, Chenglong Xu, Shi Qiu, Wei Liu and Fei Wang
Remote Sens. 2023, 15(9), 2456; https://doi.org/10.3390/rs15092456 - 07 May 2023
Cited by 3 | Viewed by 1546
Abstract
In recent years, the accelerated pace of urbanization has increased patch fragmentation, which has had a certain impact on the structure and ecological environment of forest–grass ecological networks, and certain protection measures have been taken in various regions. Therefore, studying the spatiotemporal changes [...] Read more.
In recent years, the accelerated pace of urbanization has increased patch fragmentation, which has had a certain impact on the structure and ecological environment of forest–grass ecological networks, and certain protection measures have been taken in various regions. Therefore, studying the spatiotemporal changes and correlations of ecological service functions and forest–grass ecological networks can help to better grasp the changes in landscape ecological structure and function. This paper takes the Wuding River Basin as the research area and uses the windbreak and sand fixation service capacity index, soil conservation capacity, and net primary productivity (NPP) to evaluate the ecological service capacity of the research area from the three dimensions of windbreak and sand fixation, soil conservation, and carbon sequestration. The Regional Sustainability and Environment Index (RSEI) is used to extract ecological source areas, and GIS spatial analysis and the minimum cumulative resistance (MCR) model are used to extract potential ecological corridors. Referring to complex network theory, topology metrics such as degree distribution and clustering coefficient are calculated, and their correlation with ecological service capacity is explored. The results show that the overall ecological service capacity of sand fixation, soil fixation, and carbon sequestration in the research area in 2020 has increased compared to 2000, and the ecological flow at the northern and northwest boundaries of the river basin has been enhanced, but there are still shortcomings such as fragmented ecological nodes, a low degree of clustering, and poor connectivity. In terms of the correlation between topology indicators and ecological service functions, the windbreak and sand fixation service capacity index have the strongest correlation with clustering and the largest grasp, while the correlation between soil conservation capacity and eigencentrality is the strongest and has the largest grasp. The correlation between NPP and other indicators is not obvious, and its correlation with eccentricity and eigencentrality is relatively large. Full article
Show Figures

Figure 1

33 pages, 13162 KiB  
Article
Dim and Small Space-Target Detection and Centroid Positioning Based on Motion Feature Learning
by Shengping Su, Wenlong Niu, Yanzhao Li, Chunxu Ren, Xiaodong Peng, Wei Zheng and Zhen Yang
Remote Sens. 2023, 15(9), 2455; https://doi.org/10.3390/rs15092455 - 07 May 2023
Cited by 2 | Viewed by 1607
Abstract
The detection of dim and small space-targets is crucial in space situational awareness missions; however, low signal-to-noise ratio (SNR) targets and complex backgrounds pose significant challenges to such detection. This paper proposes a space-target detection framework comprising a space-target detection network and a [...] Read more.
The detection of dim and small space-targets is crucial in space situational awareness missions; however, low signal-to-noise ratio (SNR) targets and complex backgrounds pose significant challenges to such detection. This paper proposes a space-target detection framework comprising a space-target detection network and a k-means clustering target centroid positioning method. The space-target detection network performs a three-dimensional convolution of an input star image sequence to learn the motion features of the target, reduces the interference of noise using a soft thresholding module, and outputs the target detection result after positioning via the offsetting branch. The k-means centroid positioning method enables further high-precision subpixel-level centroid positioning of the detection network output. Experiments were conducted using simulated data containing various dim and small space-targets, multiple noises, and complex backgrounds; semi-real data with simulated space-targets added to the real star image; and fully real data. Experiments on the simulated data demonstrate the superior detection performance of the proposed method for multiple SNR conditions (particularly with very low false alarm rates), robustness regarding targets of varying numbers and speeds, and complex backgrounds (such as those containing stray light and slow motion). Experiments performed with semi-real and real data both demonstrate the excellent detection performance of the proposed method and its generalization capability. Full article
Show Figures

Graphical abstract

23 pages, 17535 KiB  
Article
Dual-Level Contextual Attention Generative Adversarial Network for Reconstructing SAR Wind Speeds in Tropical Cyclones
by Xinhai Han, Xiaohui Li, Jingsong Yang, Jiuke Wang, Gang Zheng, Lin Ren, Peng Chen, He Fang and Qingmei Xiao
Remote Sens. 2023, 15(9), 2454; https://doi.org/10.3390/rs15092454 - 06 May 2023
Cited by 1 | Viewed by 1741
Abstract
Synthetic Aperture Radar (SAR) imagery plays an important role in observing tropical cyclones (TCs). However, the C-band attenuation caused by rain bands and the problem of signal saturation at high wind speeds make it impossible to retrieve the fine structure of TCs effectively. [...] Read more.
Synthetic Aperture Radar (SAR) imagery plays an important role in observing tropical cyclones (TCs). However, the C-band attenuation caused by rain bands and the problem of signal saturation at high wind speeds make it impossible to retrieve the fine structure of TCs effectively. In this paper, a dual-level contextual attention generative adversarial network (DeCA-GAN) is tailored for reconstructing SAR wind speeds in TCs. The DeCA-GAN follows an encoder–neck–decoder architecture, which works well for high wind speeds and the reconstruction of a large range of low-quality data. A dual-level encoder comprising a convolutional neural network and a self-attention mechanism is designed to extract the local and global features of the TC structure. After feature fusion, the neck explores the contextual features to form a reconstructed outline and up-samples the features in the decoder to obtain the reconstructed results. The proposed deep learning model has been trained and validated using the European Centre for Medium-Range Weather Forecasts (ECMWF) atmospheric model product and can be directly used to improve the data quality of SAR wind speeds. Wind speeds are reconstructed well in regions of low-quality SAR data. The root mean square error of the model output and ECMWF in these regions is halved in comparison with the existing SAR wind speed product for the test set. The results indicate that deep learning methods are effective for reconstructing SAR wind speeds. Full article
(This article belongs to the Section Ocean Remote Sensing)
Show Figures

Graphical abstract

16 pages, 17072 KiB  
Article
A Multi-Pixel Split-Window Approach to Sea Surface Temperature Retrieval from Thermal Imagers with Relatively High Radiometric Noise: Preliminary Studies
by Gian Luigi Liberti, Mattia Sabatini, David S. Wethey and Daniele Ciani
Remote Sens. 2023, 15(9), 2453; https://doi.org/10.3390/rs15092453 - 06 May 2023
Viewed by 1824
Abstract
In the following decade(s), a set of satellite missions carrying thermal infrared (TIR) imagers with a relatively high noise equivalent differential temperature (NEdT) are expected, e.g., the high resolution TIR imagers flying on the future Thermal infraRed Imaging Satellite for High-resolution Natural resource [...] Read more.
In the following decade(s), a set of satellite missions carrying thermal infrared (TIR) imagers with a relatively high noise equivalent differential temperature (NEdT) are expected, e.g., the high resolution TIR imagers flying on the future Thermal infraRed Imaging Satellite for High-resolution Natural resource Assessment (TRISHNA), Land Surface Temperature Monitoring (LSTM) and NASA-JPL/ASI Surface Biology and Geology Thermal (SBG) missions or the secondary payload on board the ESA Earth Explorer 10 Harmony. The instruments on board these missions are expected to be characterized by an NEdT of ⪆0.1 K. In order to reduce the impact of radiometric noise on the retrieved sea surface temperature (SST), this study investigates the possibility of applying a multi-pixel atmospheric correction based on the hypotheses that (i) the spatial variability scales of radiatively active atmospheric variables are, on average, larger than those of the SST and (ii) the effect of atmosphere is accounted for via the split window (SW) difference. Based on 32 Sentinel 3 SLSTR case studies selected in oceanic regions where SST features are mainly driven by meso to sub-mesoscale turbulence (e.g., corresponding to major western boundary currents), this study documents that the local spatial variability of the SW difference term on the scale of ≃3 × 3 km2 is comparable with the noise associated with the SW difference. Similarly, the power spectra of the SW term are shown to have, for small scales, the behavior of white noise spectra. On this basis, we suggest to average the SW term and to use it for the atmospheric correction procedure to reduce the impact of radiometric noise. In principle, this methodology can be applied on proper scales that can be dynamically defined for each pixel. The applicability of our findings to high-resolution TIR missions is discussed and an example of an application to ECOSTRESS data is reported. Full article
(This article belongs to the Special Issue Atmospheric Correction of Remote Sensing Imagery)
Show Figures

Figure 1

10 pages, 2896 KiB  
Communication
Enhanced Doppler Resolution and Sidelobe Suppression Performance for Golay Complementary Waveforms
by Jiahua Zhu, Yongping Song, Nan Jiang, Zhuang Xie, Chongyi Fan and Xiaotao Huang
Remote Sens. 2023, 15(9), 2452; https://doi.org/10.3390/rs15092452 - 06 May 2023
Cited by 33 | Viewed by 1480
Abstract
An enhanced Doppler resolution and sidelobe suppression have long been practical issues for moving target detection using Golay complementary waveforms. In this paper, Golay complementary waveform radar returns are combined with a proposed processor, the pointwise thresholding processor (PTP). Compared to the pointwise [...] Read more.
An enhanced Doppler resolution and sidelobe suppression have long been practical issues for moving target detection using Golay complementary waveforms. In this paper, Golay complementary waveform radar returns are combined with a proposed processor, the pointwise thresholding processor (PTP). Compared to the pointwise minimization processor (PMP) illustrated in a previous work, which could only achieve a Doppler resolution comparable to existing methods, this approach essentially increases the Doppler resolution to a very high level in theory. This study also introduced a further filtering process for the delay-Doppler map of the PTP, and simulations verified that the method results in a delay-Doppler map virtually free of range sidelobes. Full article
(This article belongs to the Special Issue Advanced Array Signal Processing for Target Imaging and Detection)
Show Figures

Figure 1

Previous Issue
Next Issue
Back to TopTop