Article

Integrating GIS, Remote Sensing, and Citizen Science to Map Oak Decline Risk across the Daniel Boone National Forest

1
Department of Forestry and Natural Resources, University of Kentucky, 121 Thomas Poe Cooper Building, Lexington, KY 40546, USA
2
Forest Health Research and Education Center, Southern Research Station, USDA Forest Service, 208 Thomas Poe Cooper Building, Lexington, KY 40546, USA
3
USDA Forest Service, Daniel Boone National Forest, Winchester, KY 33729, USA
4
USDA Forest Service, Southern Research Station, Lexington, KY 40546, USA
*
Author to whom correspondence should be addressed.
Remote Sens. 2023, 15(9), 2250; https://doi.org/10.3390/rs15092250
Submission received: 6 February 2023 / Revised: 13 April 2023 / Accepted: 14 April 2023 / Published: 24 April 2023

Abstract

:
Oak decline is a general term used for the progressive dieback and eventual mortality of oak trees due to many compounding stressors, typically a combination of predisposing, inciting, and contributing factors. While pinpointing individual causes of decline in oak trees is a challenge, past studies have identified site and stand characteristics associated with oak decline. In this study, we developed a risk map of oak decline for the Daniel Boone National Forest (DBNF), combining GIS, remote sensing (RS), and public reporting (citizen science, CS). Starting with ground reports of decline (CS), we developed a site-scale model (GIS and RS) for oak decline based on four previously identified predisposing factors: elevation, slope, solar radiation, and topographic wetness. We found that areas identified in the model as having a high oak decline risk also reflected areas of observed oak decline (CS). We then optimized and expanded this risk model to the entire range of the DBNF, based on both site characteristics (as piloted for the case study site) and stand inventory data. The stand inventory data (including species composition and age) further improved the model, resulting in a risk map at the landscape level. This case study can serve as a planning tool and highlights the potential usefulness of integrating GIS, remote sensing, and citizen science.

1. Introduction

Oak-dominated forests are widespread in the United States (US), with three oak-dominant forest types (oak–hickory, oak–pine, and oak–gum–cypress) accounting for 46% of all forest and woodland areas in the eastern US [1]. Oak form and physiological characteristics have important impacts on population and community dynamics in these forests. Their biomass and chemical composition modulate ecosystem processes such as nutrient fluxes, carbon sequestration, decomposition rate, and energy flow [2]. Oak trees are considered a “keystone” species from the perspective of biological diversity, supporting a wide range of organisms and producing hard mast (acorns) that plays a vital role in the food webs of oak forests [3]. Acorns are an important food source for many species of birds, small mammals, and larger vertebrates [4]. Many oak species are also of high economic value. Oak timber is used for furniture, flooring, and also for special purposes, such as barrels for wine and distilling industries [5].
However, oak populations have been declining, and the abundance of oaks in the eastern US has shrunk. This is largely related to a shift away from active forest management, including silvicultural practices that promote oak regeneration and recruitment. In addition, aging oak forests are increasingly vulnerable to a variety of existing and emerging biotic threats [6,7,8]. Several invasive insects and pathogens can cause oak mortality, such as the oomycete pathogen Phytophthora ramorum, which is not yet present in the eastern US but causing oak mortality via sudden oak death on the west coast, and the spongy moth Lymantria dispar dispar, which is gradually moving south and west from its current distribution throughout the Northeast, Mid-Atlantic, and Midwest [9].
In addition to specific diseases and insects that cause oak mortality, there is an observed phenomenon called “oak decline” that is considered the most widespread problem plaguing oaks [10,11,12]. Oak decline describes the progressive dieback and eventual mortality of oak trees that has been observed across the central hardwood region of the US as well as in Europe, primarily impacting mature trees of the red oak species [13,14]. Oak decline is typically attributed to compounding tree stress due to a combination of predisposing factors (e.g., underlying condition of trees due to their species, genetics, age, and site), inciting factors (e.g., weather conditions such as drought or late spring freeze or defoliating pests), and contributing factors (e.g., a wide range of insects and pathogens that opportunistically affect trees) [10,15,16,17]. While many factors related to oak decline are hard to predict, Bendixsen et al. 2015 [17] found that the mortality of oaks could be connected to a complex of stress factors including site characteristics (e.g., distance to water, slope, elevation, and aspect), and stand characteristics (e.g., abiotic and biotic threats).
Patterns of oak decline vary from a few trees in stands with diverse species composition and age structure to areas covering several thousand hectares in landscapes with a more uniform composition of susceptible, physiologically mature oak species. It has been reported that tree death can occur within a few months, but usually develops in the span of several years or decades and can range from a few trees to hundreds of hectares [12,18]. In the US, oak decline is a recurring threat to the oaks in many regions, and during the past several decades, oak decline has become increasingly common. For example, a study of the Ozark Highlands showed an increase in red oak mortality from around 8 percent in 1999 to 16 to 18 percent in 2006 [19]. This increase in oak mortality has also been observed in Kentucky and many surrounding states [20], and recent severe droughts in the region are likely to exacerbate this issue in the coming decade [21]. In Kentucky, informal reporting of oak decline has seemed to increase, from landowners who report their observations via citizen science through apps such as TreeSnap or via reports to foresters and Cooperative Extension agents. While recent solid data supporting these reports are missing, oak decline is clearly an issue in Kentucky’s forests.
In light of this emerging forest health issue in Kentucky and surrounding states, there is a great need to develop a formal oak decline risk assessment at landscape scales to facilitate active forest management. However, due to the lack of spatially explicit report data on the oak decline sites and associated environmental characteristics, risk assessment and mapping at landscape and regional scales are challenging, as researchers in other systems have also noted [22,23]. Other studies have successfully combined remote sensing and ground truthing to strengthen resulting models in a variety of systems and for different purposes, from mapping land cover [24] to testing models of habitat suitability [25]. Risk maps for tree health issues that use GIS and satellite information have been developed in a number of contexts, such as forest fire and disease spread [26,27]. In addition, there are many examples of how GIS and citizen science data collection have been used in monitoring and managing invasive species, both reporting new species and as a way to validate models of spread [28,29]. However, to our knowledge, this has not been applied to oak decline or related problems in the region.
Here, we piloted a framework using publicly reported data (citizen science), remote sensing, and GIS to develop a risk map of oak decline for the Daniel Boone National Forest of Kentucky. Specifically, we (1) used public reports and aerial imagery to identify pockets of high oak decline in the Daniel Boone National Forest, (2) developed a site-scale oak decline risk model for these areas based on key environmental characteristics identified in the literature, (3) verified the risk model (in objective 2) based on field observations and aerial imagery, (4) optimized this model to better reflect field observations and (5) developed an oak decline risk map for the entire Daniel Boone National Forest based on these findings and stand inventory data.

2. Materials and Methods

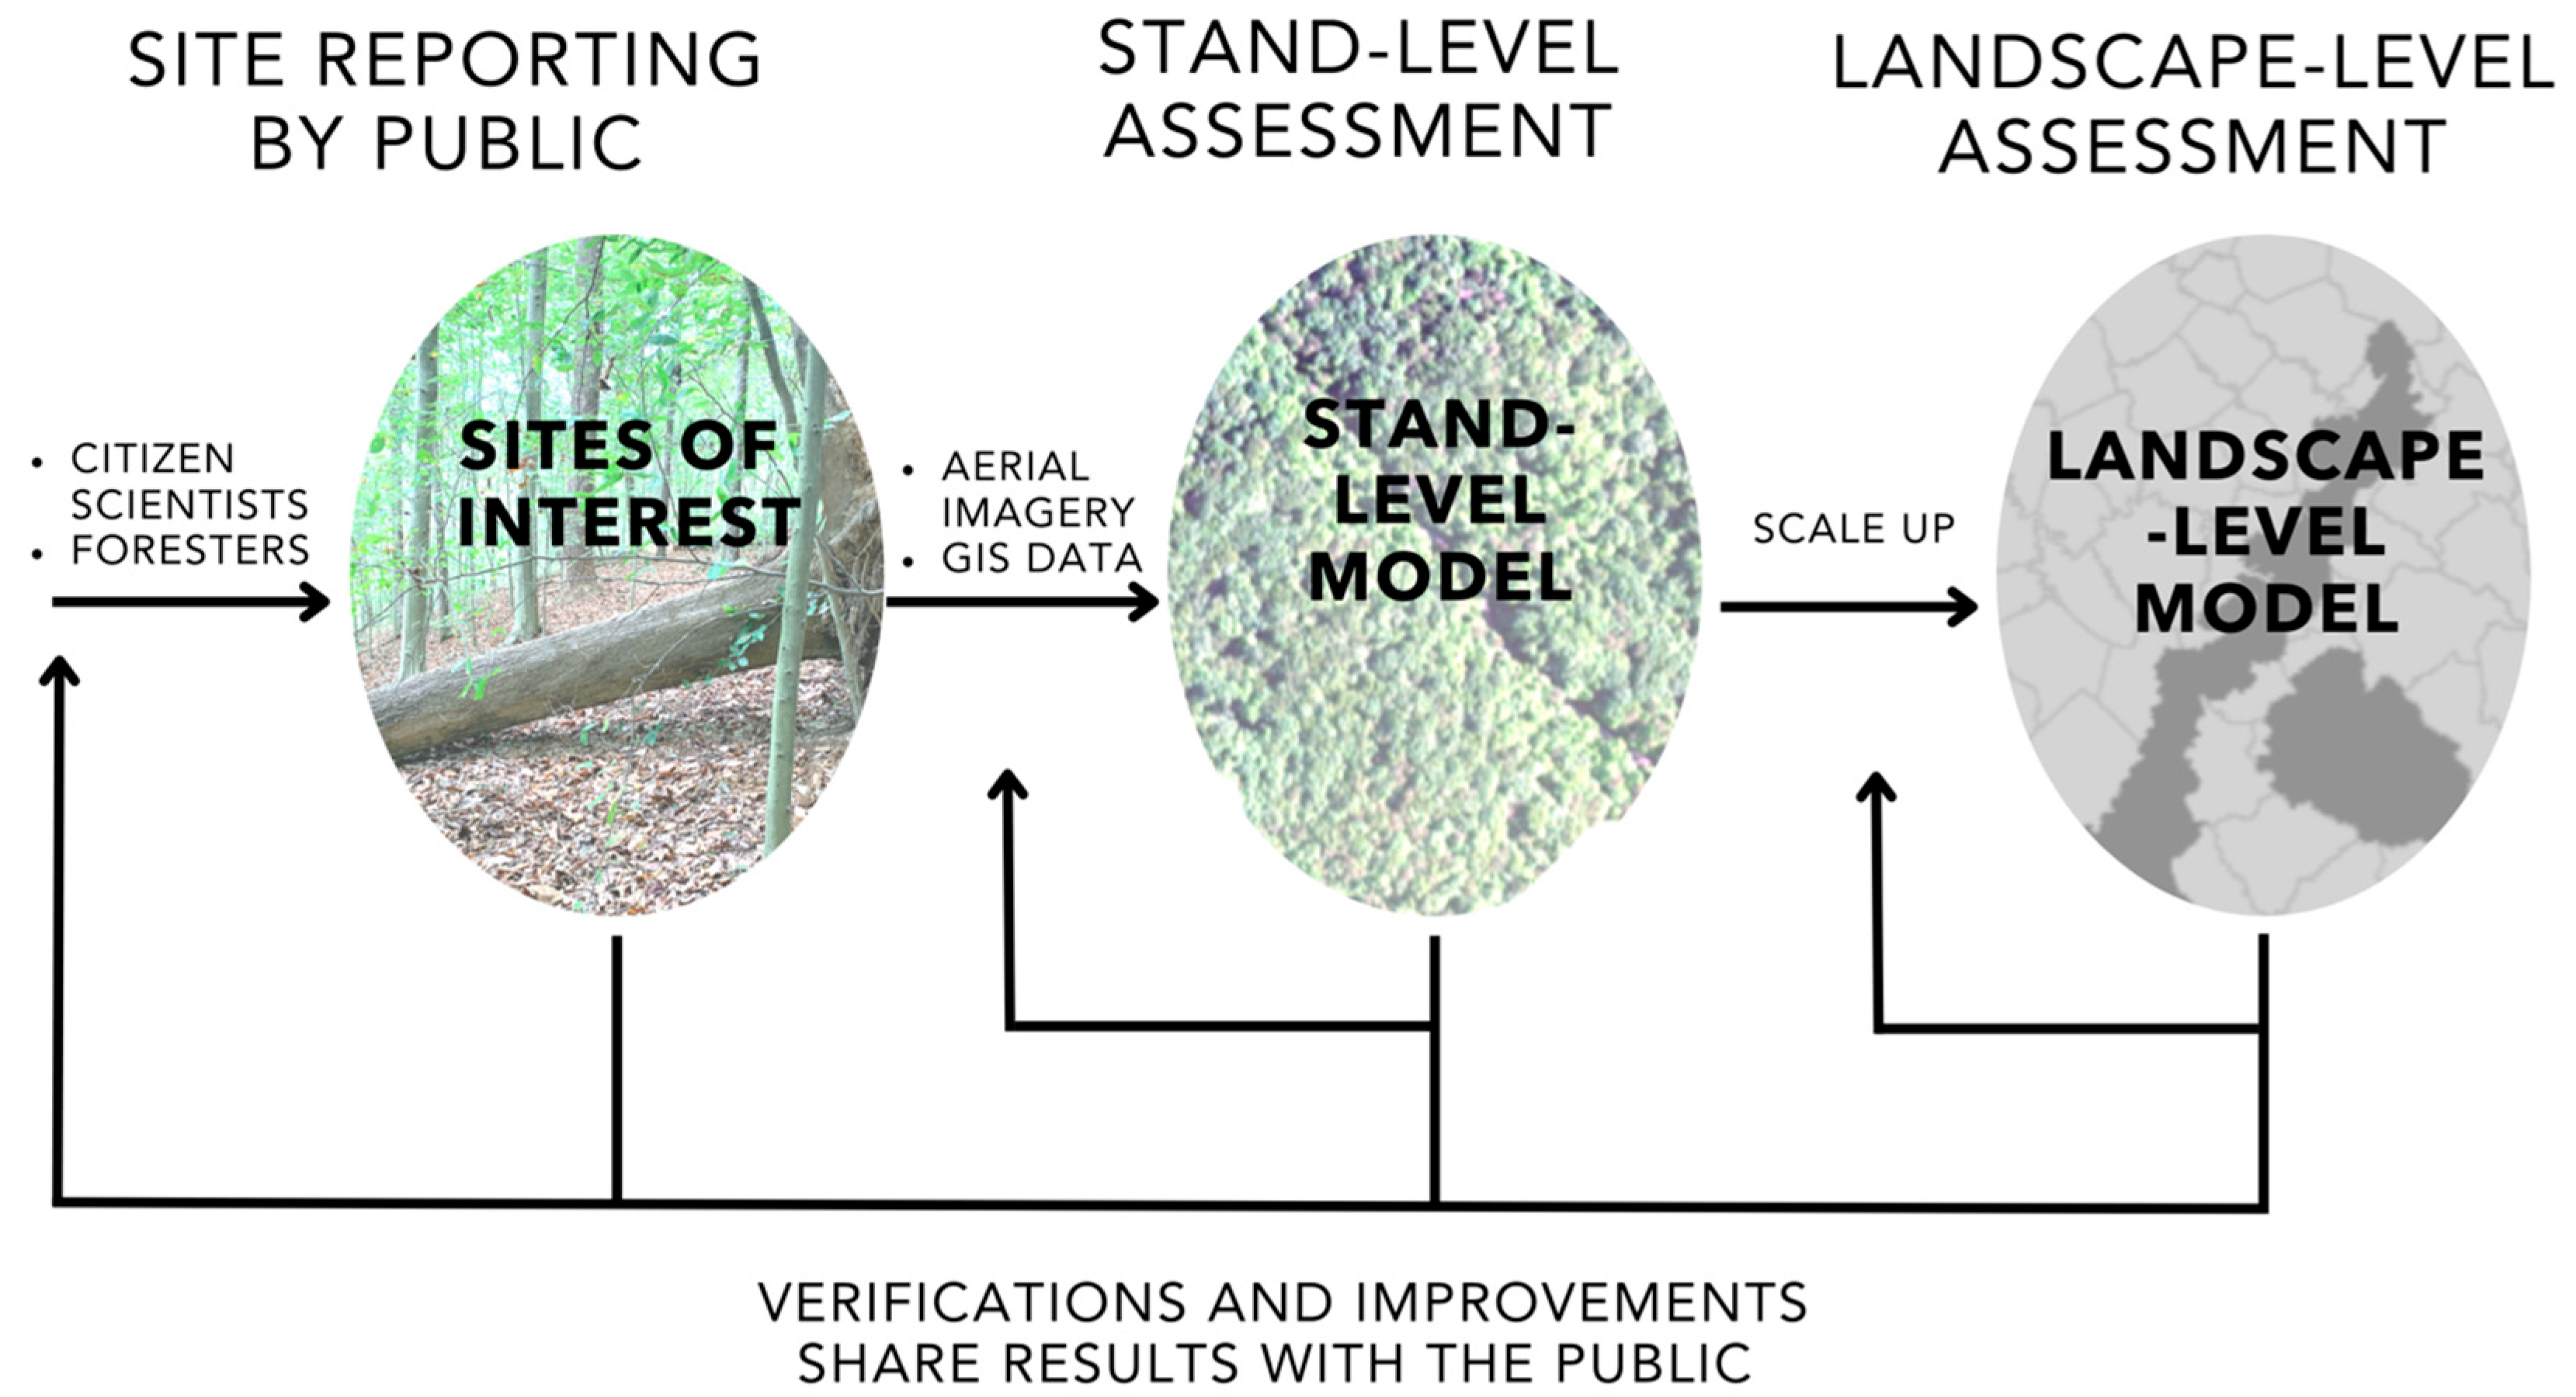
2.1. Overall Framework
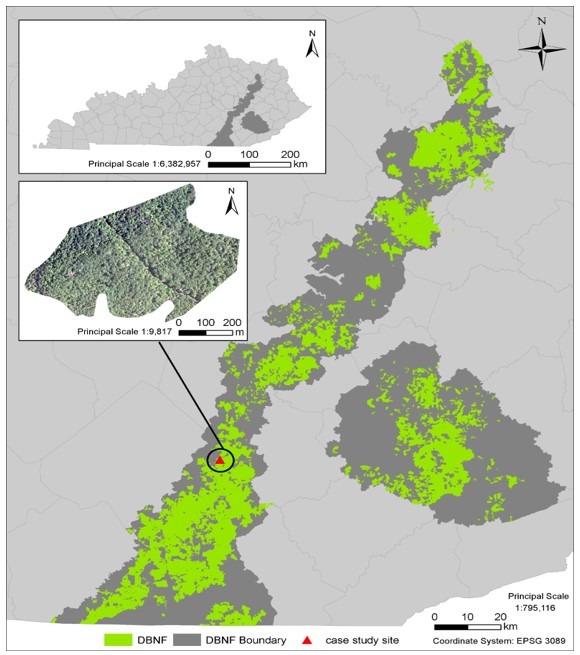
This study piloted a general framework for integrating GIS, remote sensing, and citizen science as a proof of concept to build on in the future (Figure 1).

2.2. Study Area

The Daniel Boone National Forest (DBNF) is spread across 21 counties of southern and eastern Kentucky containing more than 708,000 acres (287,000 ha) of national forest system lands (https://www.fs.usda.gov/dbnf/, accessed on 5 February 2023) within about 2.1 million acres (850,000 ha) of the DBNF boundary in which private inholdings are scattered throughout. The landform is characterized by steep forested slopes, sandstone cliffs, and narrow ravines and lies within the Northern Cumberland Plateau Section of the Eastern Broadleaf Forest (Oceanic) Province [30].
We received several reports of oak decline from the public via the TreeSnap app (www.TreeSnap.org, accessed on 31 December 2019) and also from foresters at the DBNF [31]. For the purpose of this study, and in consultation with foresters at the DBNF, we visited several areas of oak decline reported within forest stands, delineated oak decline polygons covering the decline points, and developed this as a case study site within the DBNF (Figure 2). Field examinations of these decline points in 2019 identified several contributing factors to oak decline, including evidence of Ganoderma root and heart rot, Biscogniauxia atropunctatum (also known as Hypoxylon canker), and Armillaria root rot. Signs of these pathogens along with subsequent stem failure and/or root failure due to tree bole fractures and/or uprooting, which also caused mortality of adjacent trees as diseased trees fell into adjacent trees causing uprooting and/or stem fractures, were frequently observed. Mortality resulting from oak decline was primarily observed within red oaks; however, some white oaks were also affected in areas along higher slope positions. Red oak mortality was located along higher slope positions along ridges and shoulders as well as lower slope positions along backslopes. There were no significant defoliation events on record for these areas that may have incited oak decline, but a severe drought occurred in 2016.

2.3. Model Development

An extensive literature review was conducted to study the environmental characteristics that are associated with oak decline with a focus in the southeastern US (Table 1). Based on past studies conducted in the region looking at site and stand characteristics associated with oak decline, and what data were readily available, four predisposing environmental factors were selected for our oak decline model: elevation, slope, solar radiation (a quantifiable metric related to the previously studied factor of aspect), topographic wetness index (a quantifiable metric related to previously studied factors of soil moisture and proximity to water). These were derived for the case study site from which we received oak decline reports.

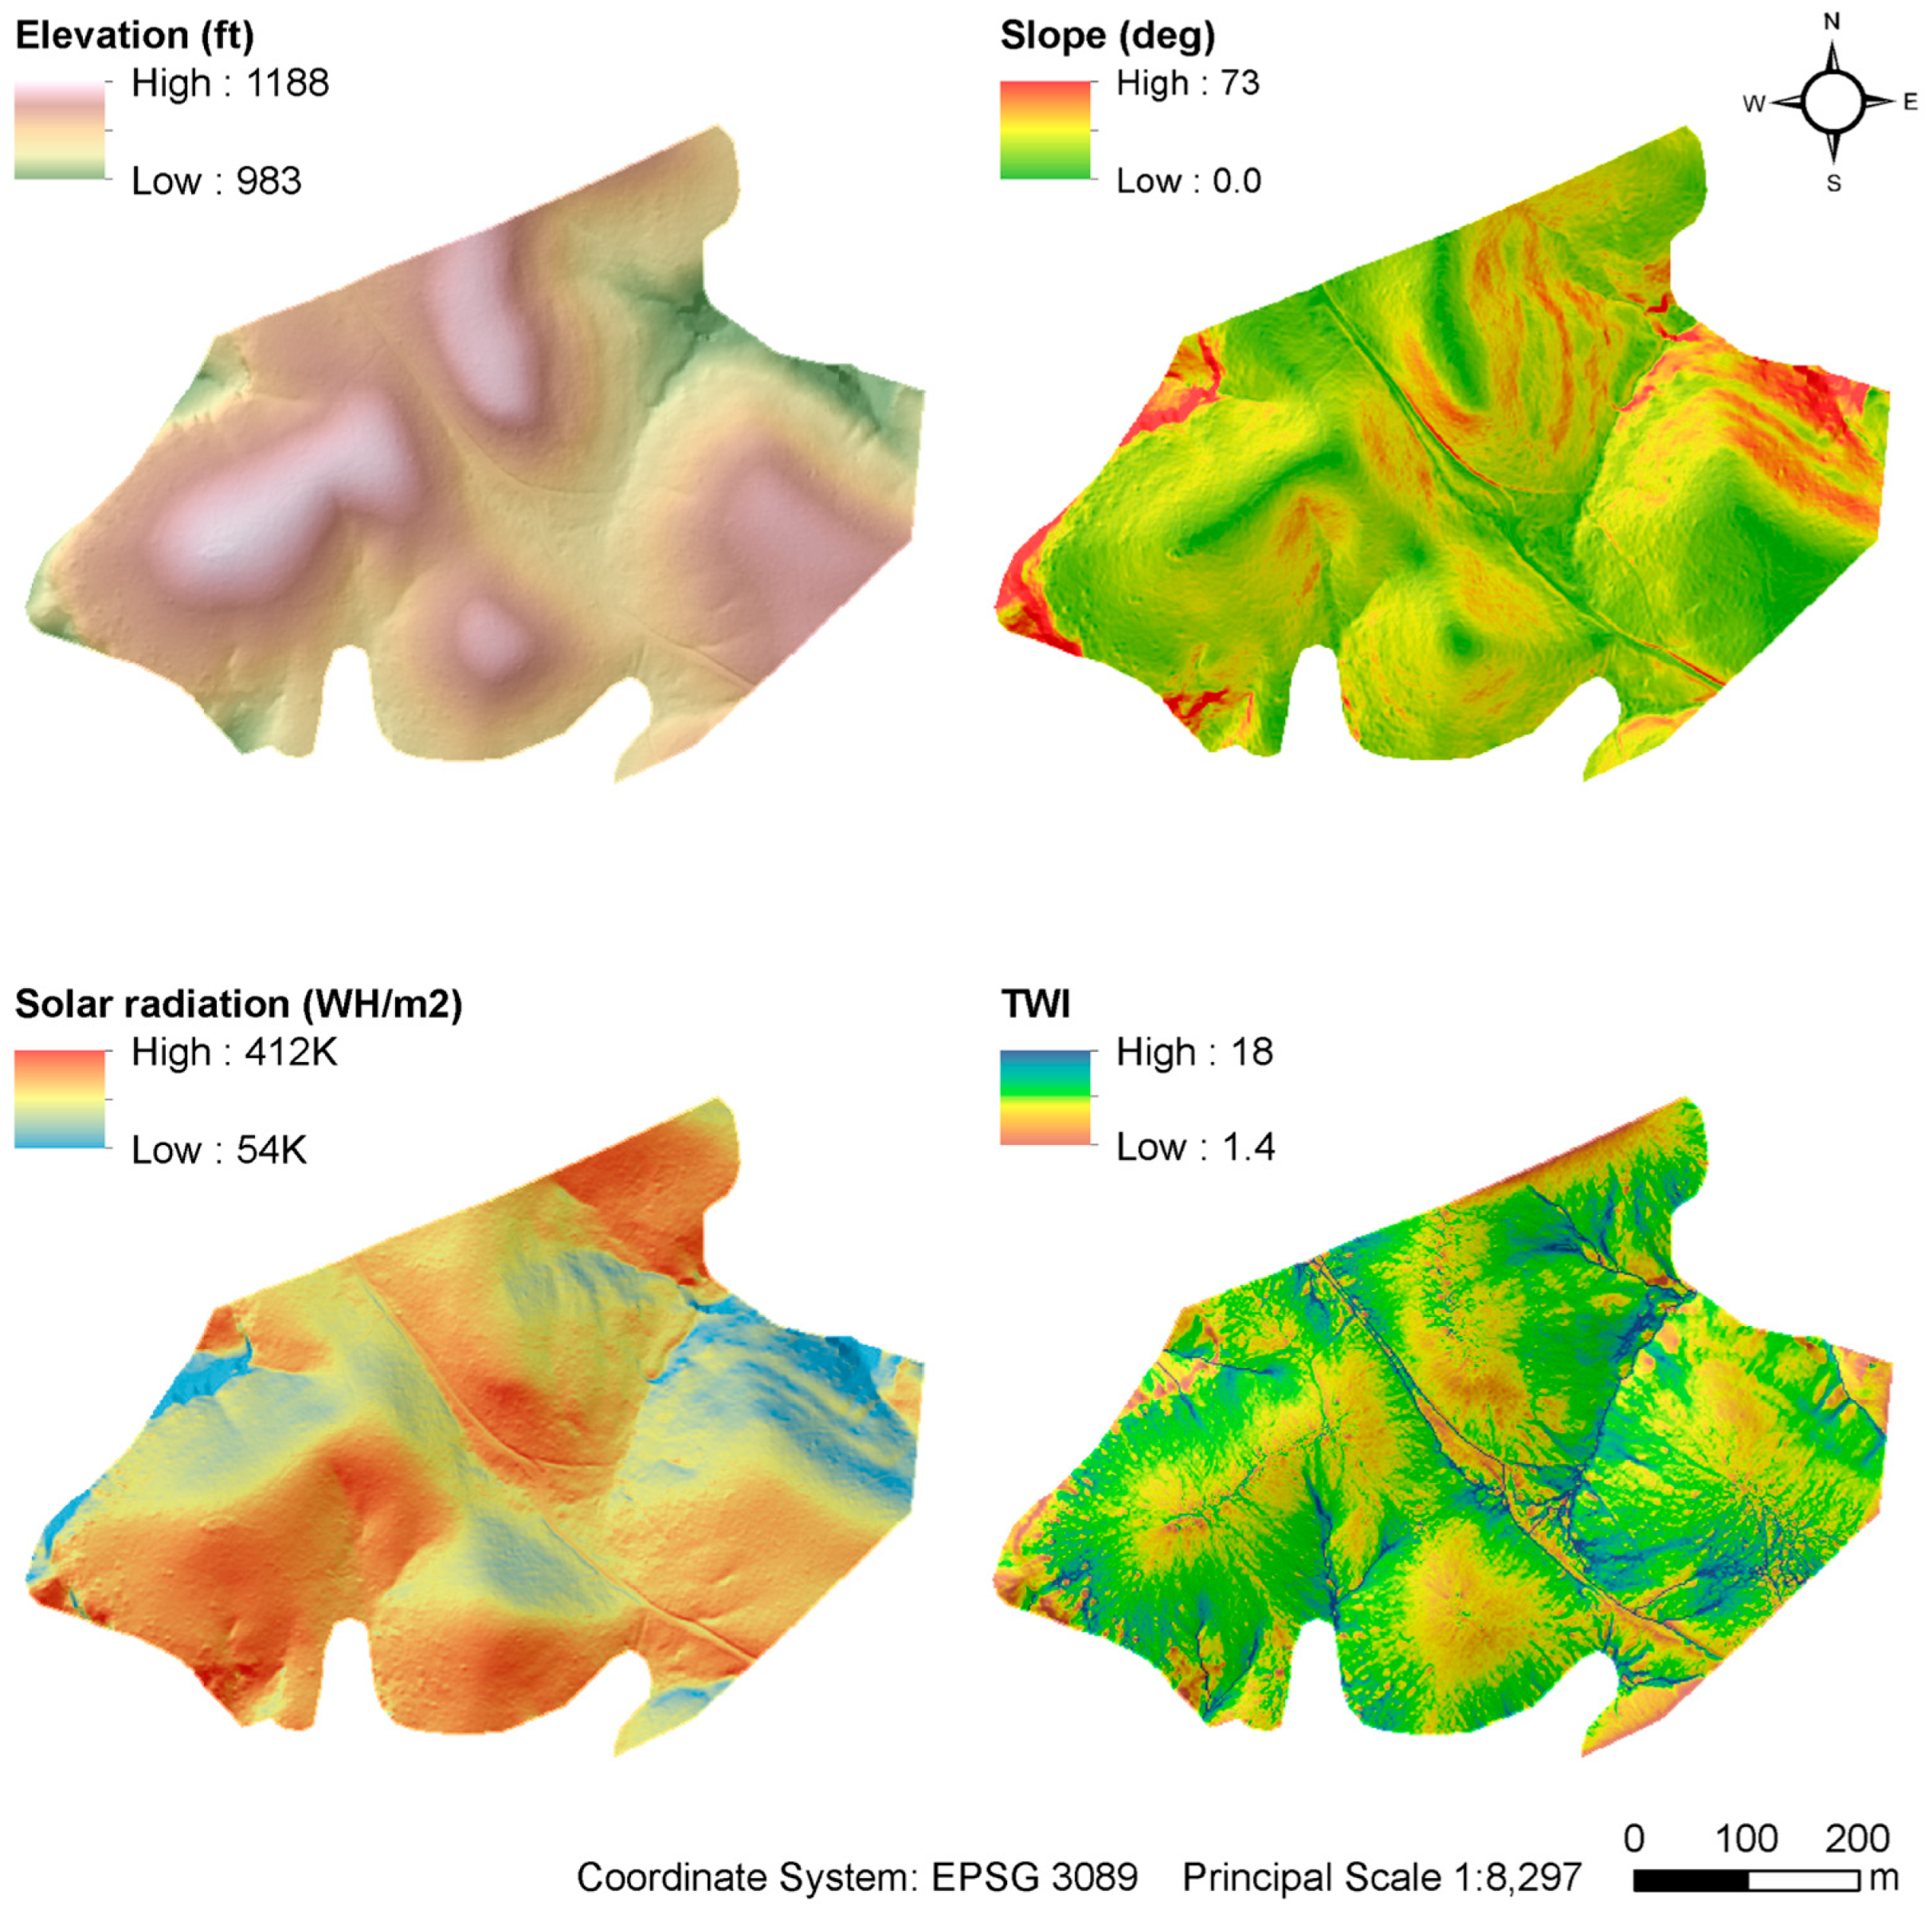
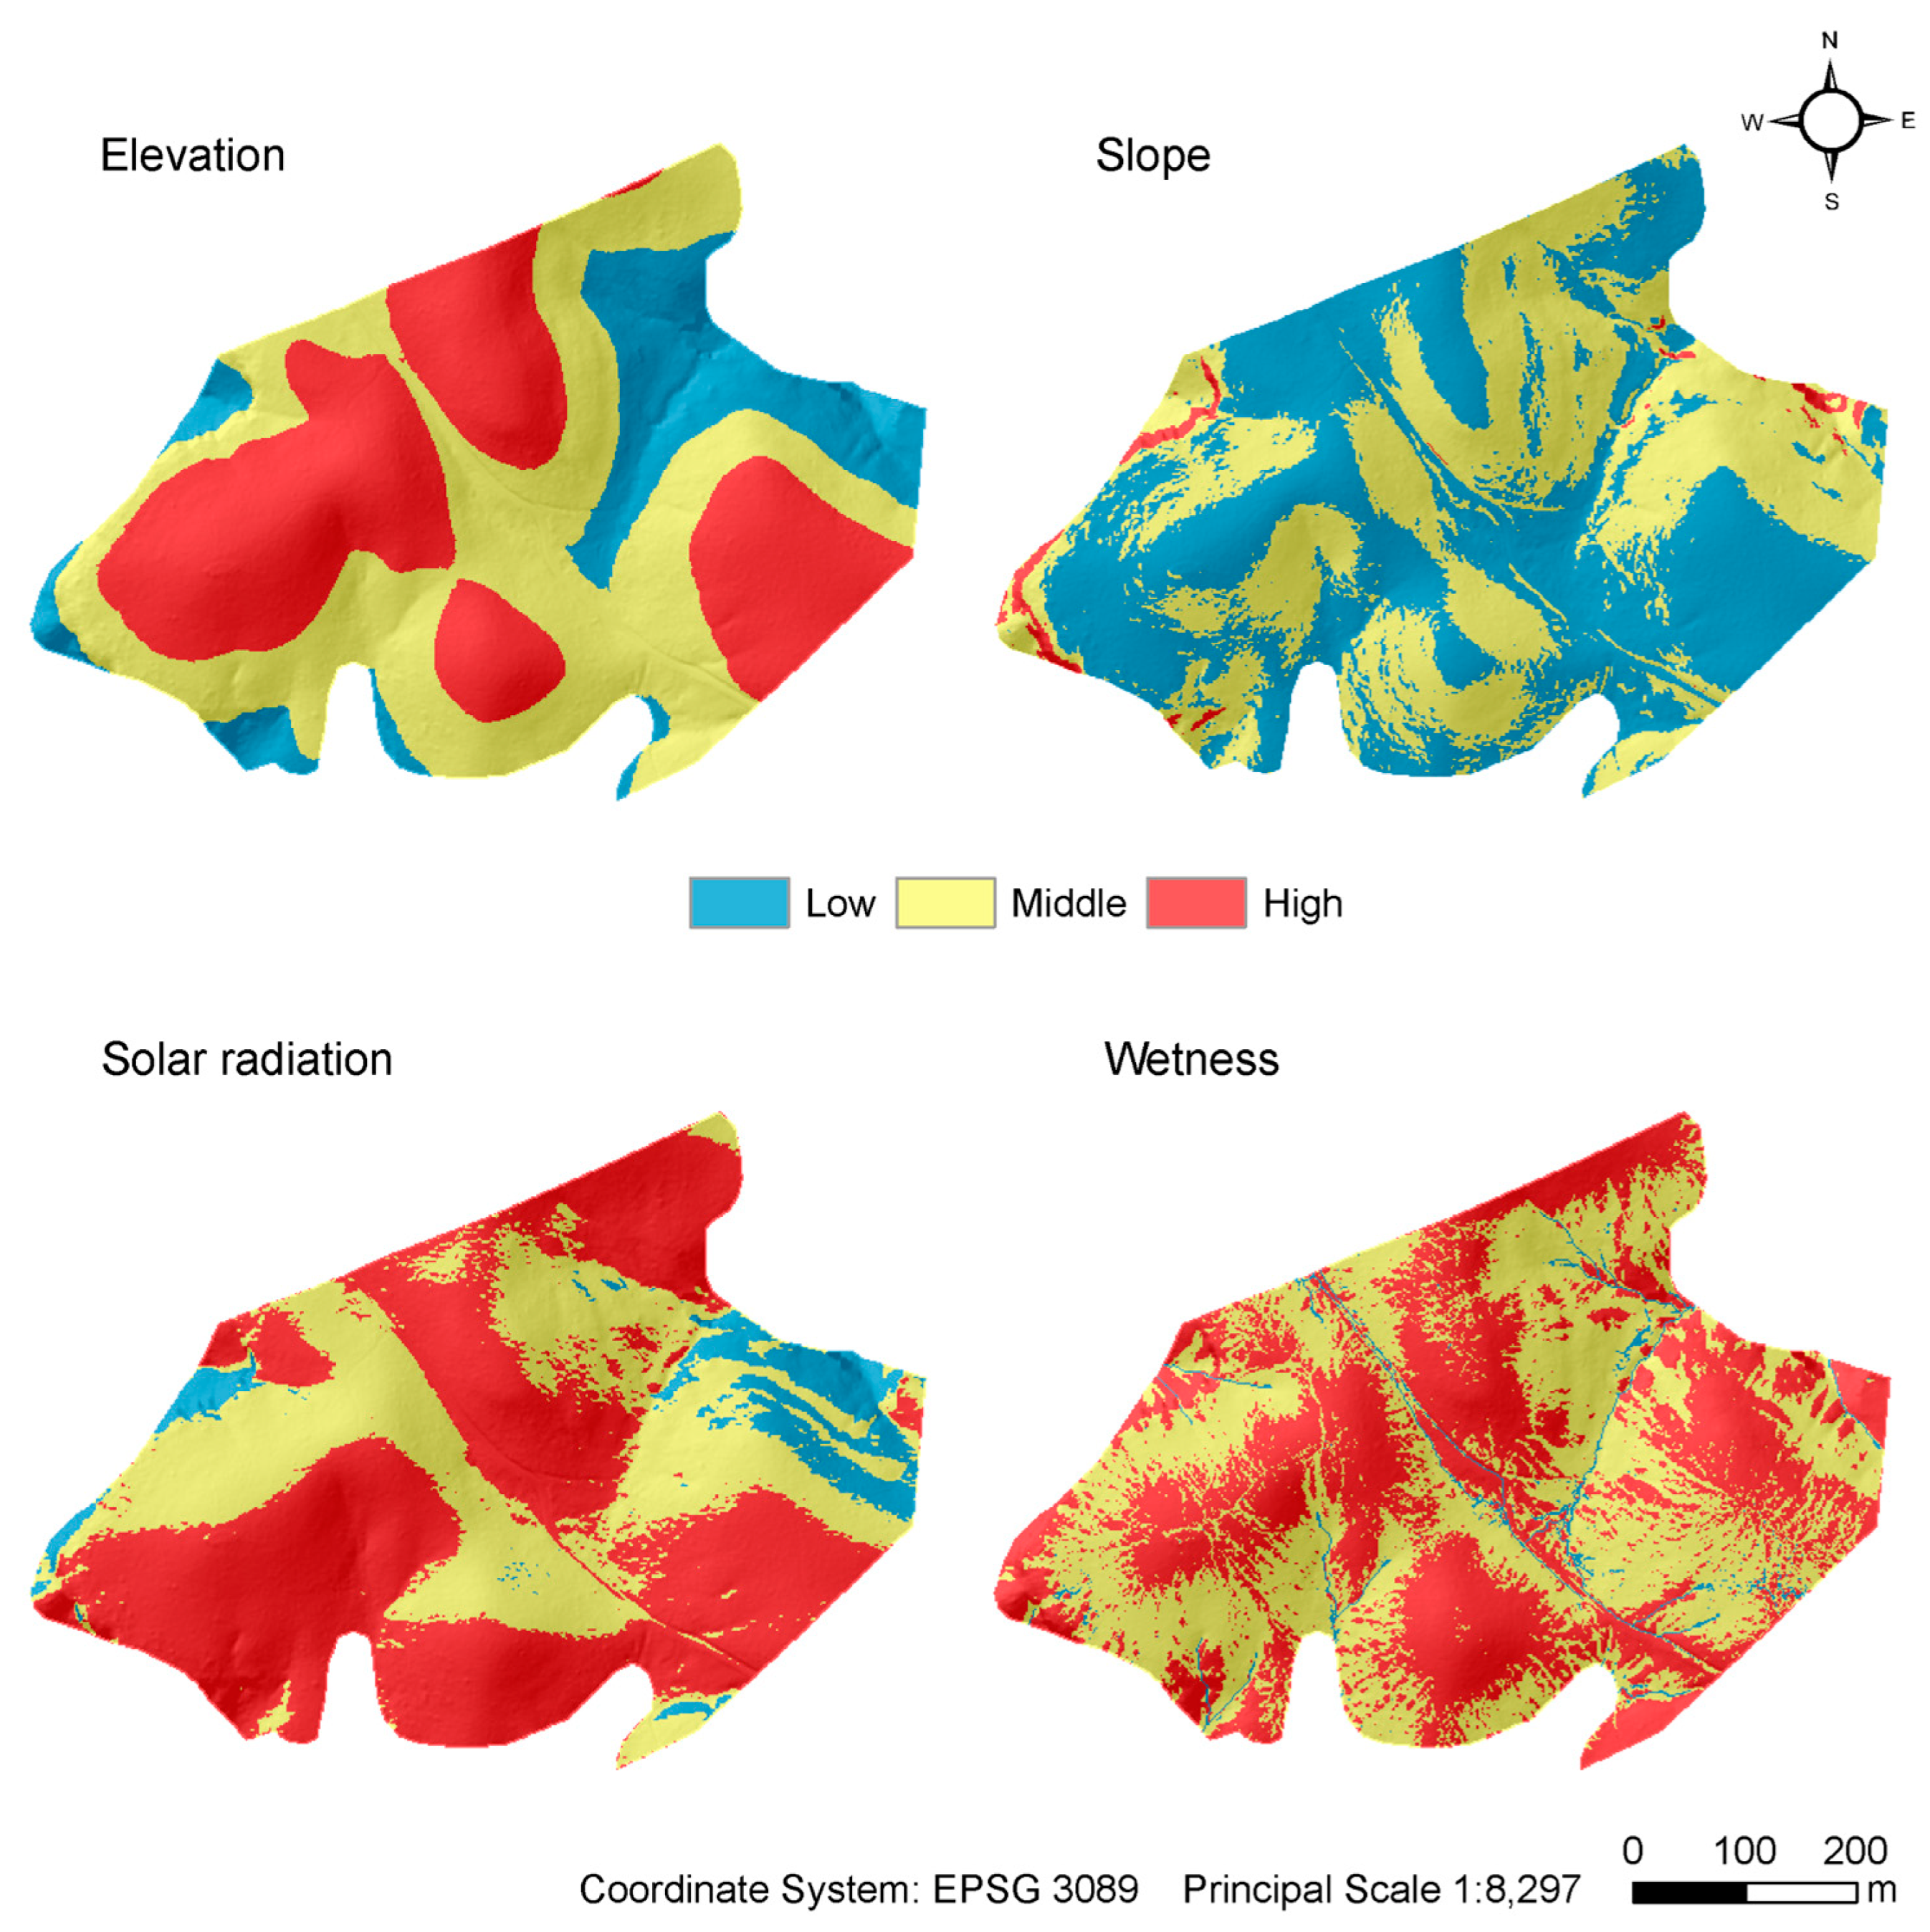
2.4. Predisposing Environmental Factors

A 5-foot horizontal/grid resolution digital elevation model (DEM) was obtained from the data clearinghouse Kentucky Geoportal Network (https://kygeoportal.ky.gov/geoportal/catalog/main/home.page, accessed on 5 February 2023). It was then clipped using the tool Clip in ArcGIS to derive elevation specifically for the case study area (Figure 3). From this DEM, the other predisposing environmental factors were derived in ArcGIS. Slope steepness and solar radiation were obtained using the tools Slope and Area Solar Radiation, respectively. The topographic wetness index (TWI) was calculated in SAGA GIS (System for Automated Geoscientific Analyses) to represent the soil moisture regime regulated by topography. A one-step TWI tool was used to calculate the TWI for our study area where the only input required is the DEM.
All predisposing environmental factors were then reclassified using the tool Reclassify in ArcGIS (Figure 4). The natural breaks (i.e., Jenks) classification was used to divide the range of each environmental variable into three classes and reclassify these continuous GIS-derived variables into categorical variables with three risk-ranking orders (1, 2, 3) corresponding to the order of three low-to-high-value classes except in the case of the TWI. For example, high elevation is mostly associated with oak decline in Kentucky, so among the three classes, ranking index 3 (high risk) was given to the highest elevation value class. In contrast for the TWI, the ranking was reversed because of its inverse relationship with oak decline. Therefore, ranking index 3 (high risk) was given to the lowest TWI value class.

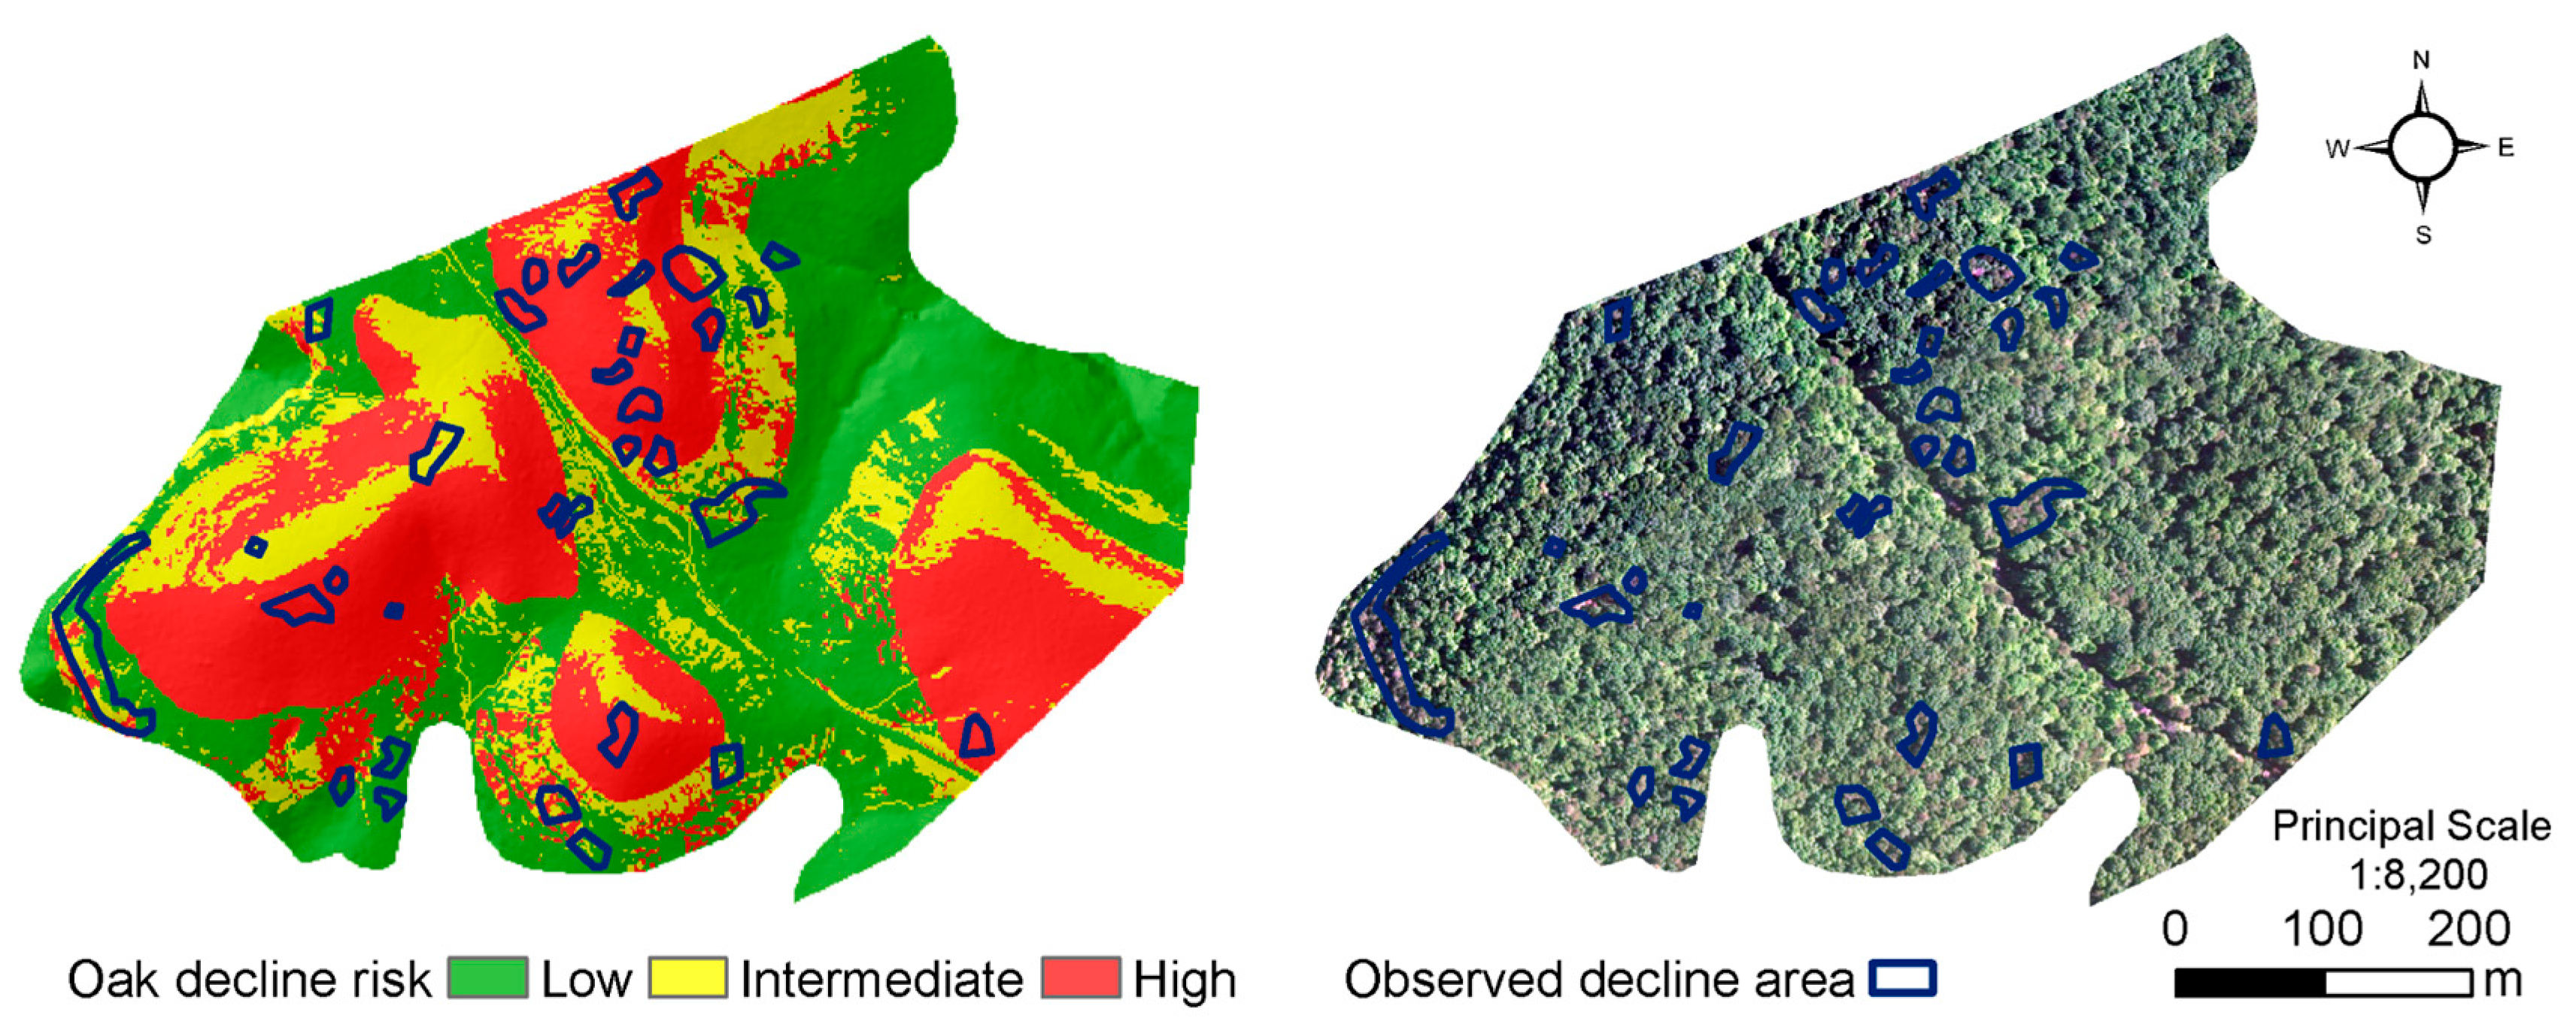
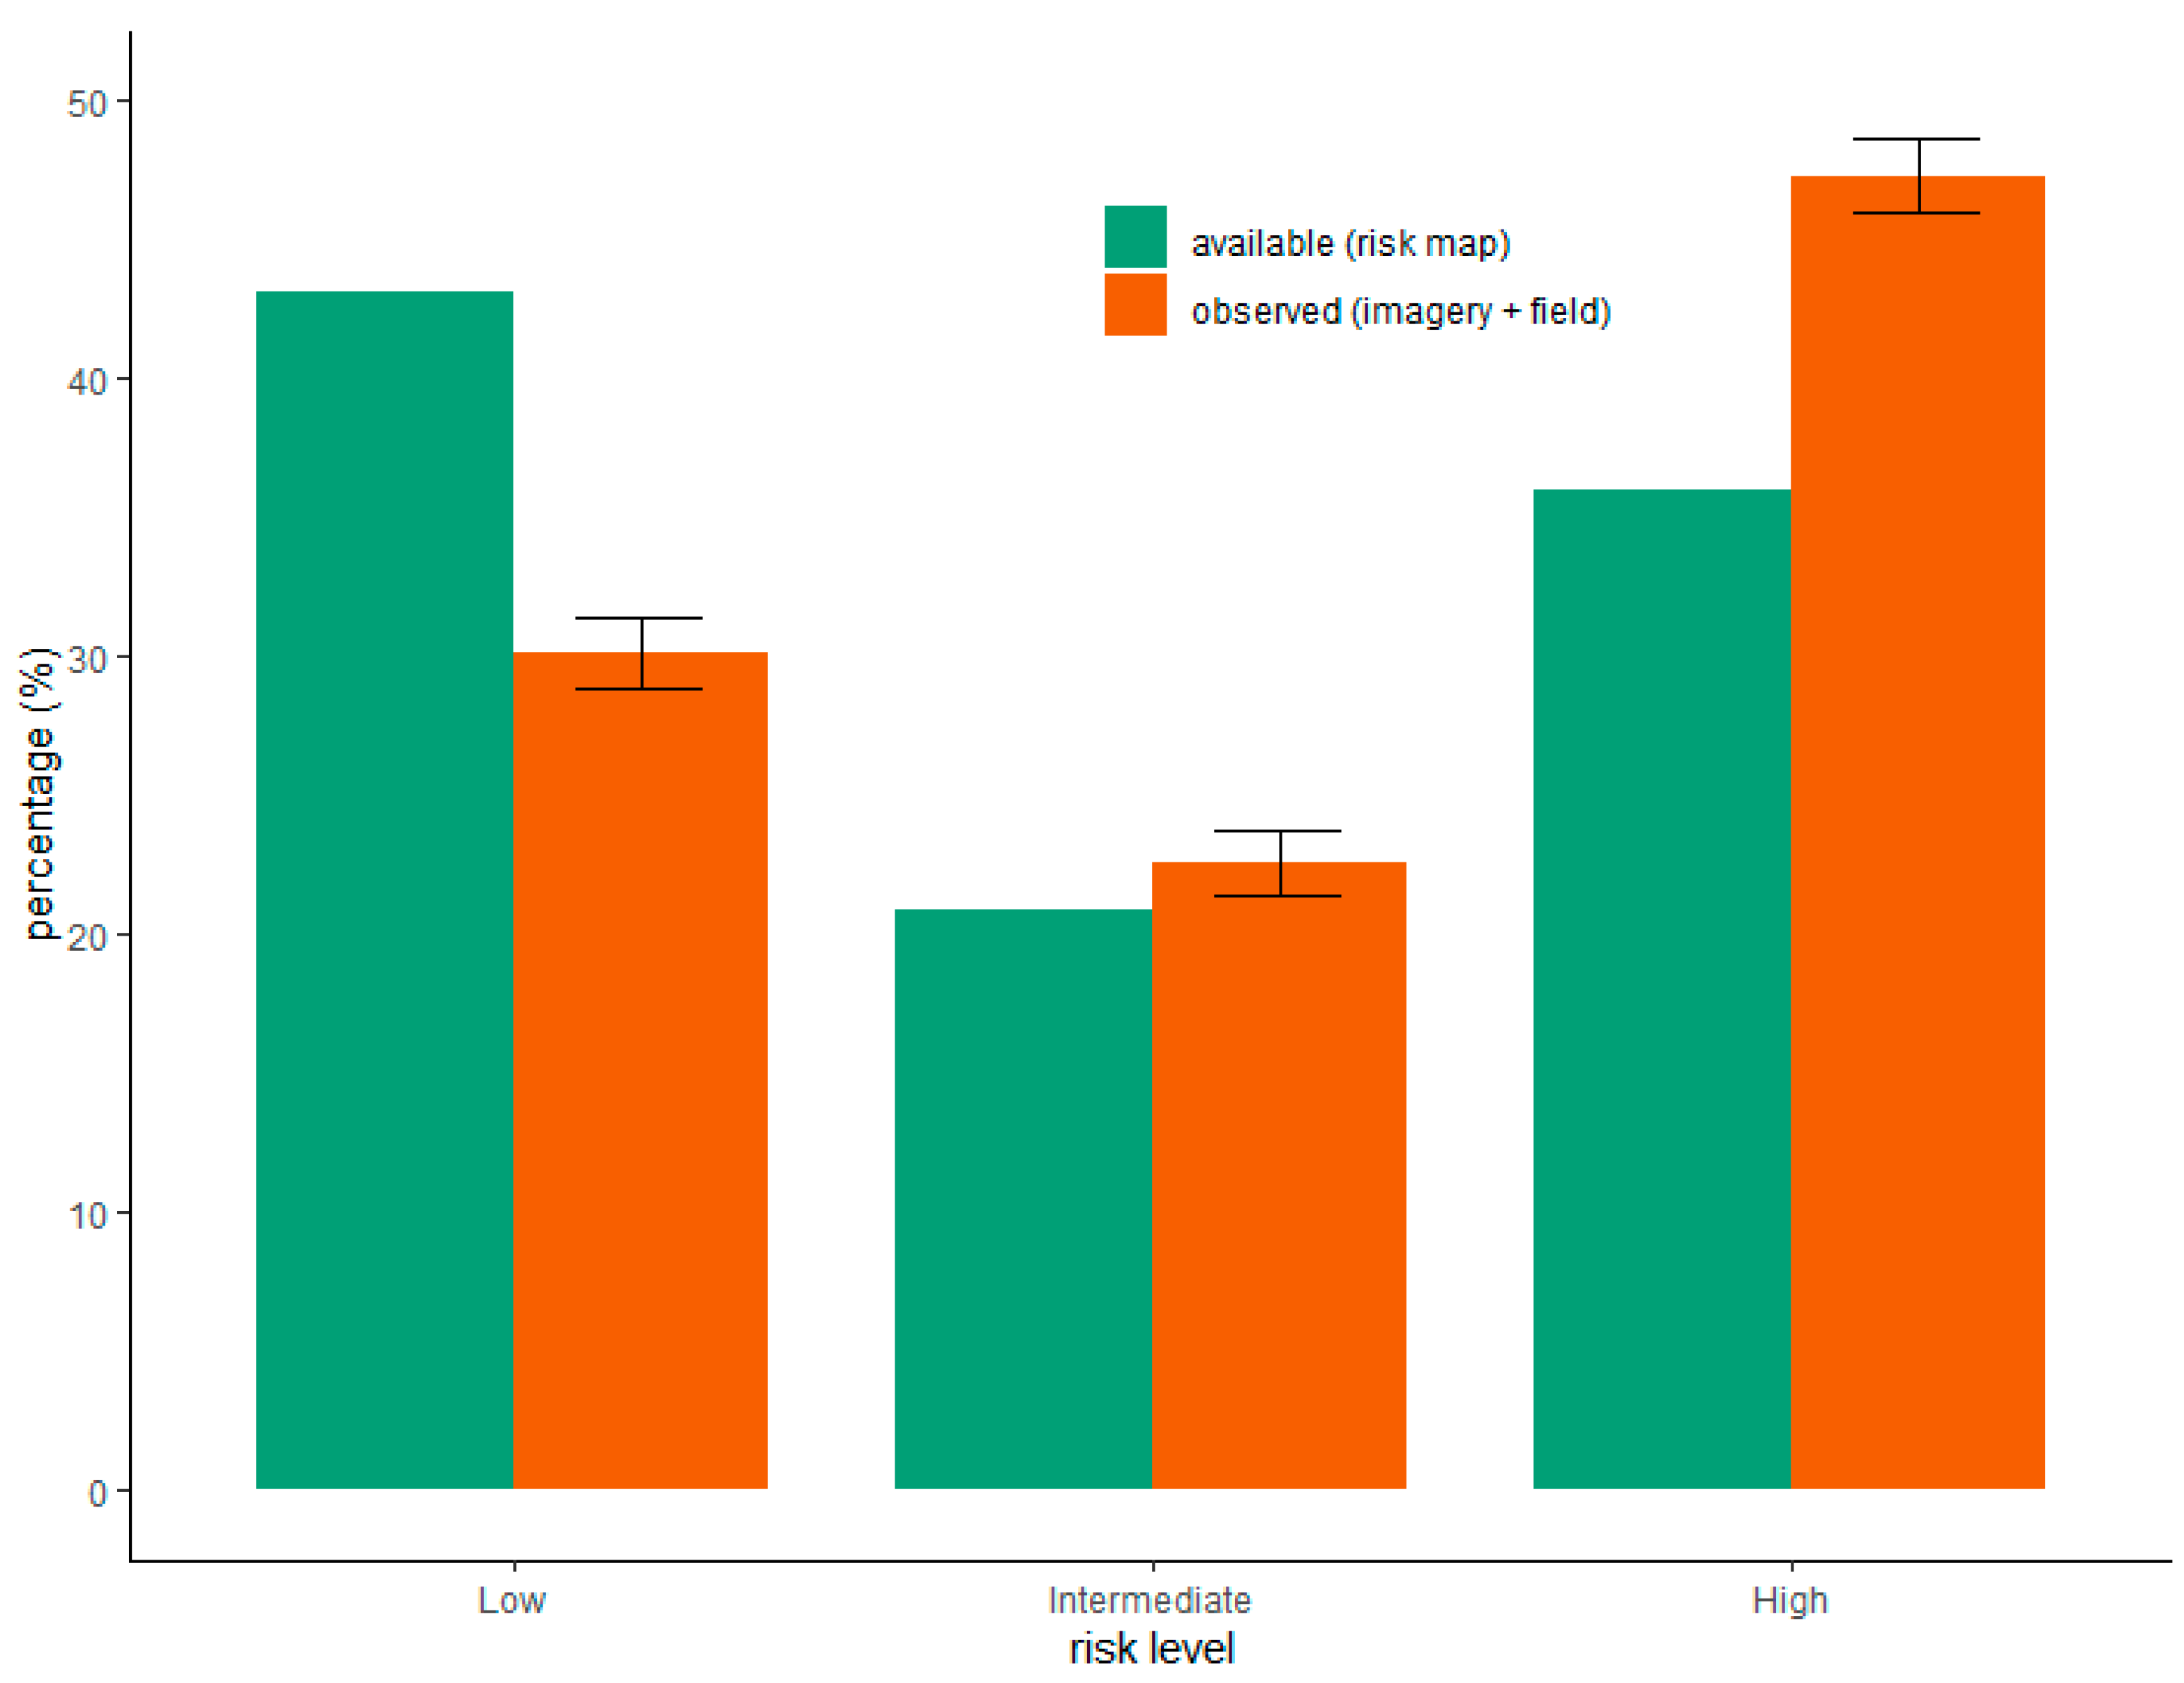
2.5. Risk Assessment at the Study Site Scale

The Weighted Sum tool was applied to assess the oak decline risk within the case study site based on the four predisposing environmental factors. In this tool, elevation, slope, solar radiation, and TWI-based wetness were given respective weights of 0.4, 0.3, 0.2, and 0.1. This weighting scheme was based on a literature review (Table 1). The output was a continuous GIS map, which was further reclassified into a categorical map with three risk levels (low, intermediate, high) using the natural breaks (Jenks) classification scheme (Figure 5).

2.6. Field Verification at Study Site

A field visit was conducted 1 May 2019, and the locations of all observed recent oak mortalities, including standing dead trees and recently uprooted trees, were recorded. The one-meter resolution NAIP (National Agriculture Imagery Program) 2016 imagery was used to digitize the potential oak decline polygons before the field visits. These potential decline polygons were then visited in the field to distinguish oak decline from other causes of gaps in the canopy.
The finalized oak decline polygons were then overlapped with the oak decline risk map to compute the number of low-, intermediate-, and high-risk-level pixels within the observed oak decline areas. These numbers were then compared with the available proportion of each corresponding risk level over the entire case study site using a chi-squared test of the goodness of fit. The null hypothesis was that the proportion of each risk level within the observed oak decline areas would be the same as the expected proportion (i.e., the available proportion over the entire case study site). The risk assessment map may be considered to sufficiently represent realistic oak decline risk distributions if the null hypothesis is rejected, and the observed oak decline mostly occurs in the areas designated as intermediate- and high-risk levels.

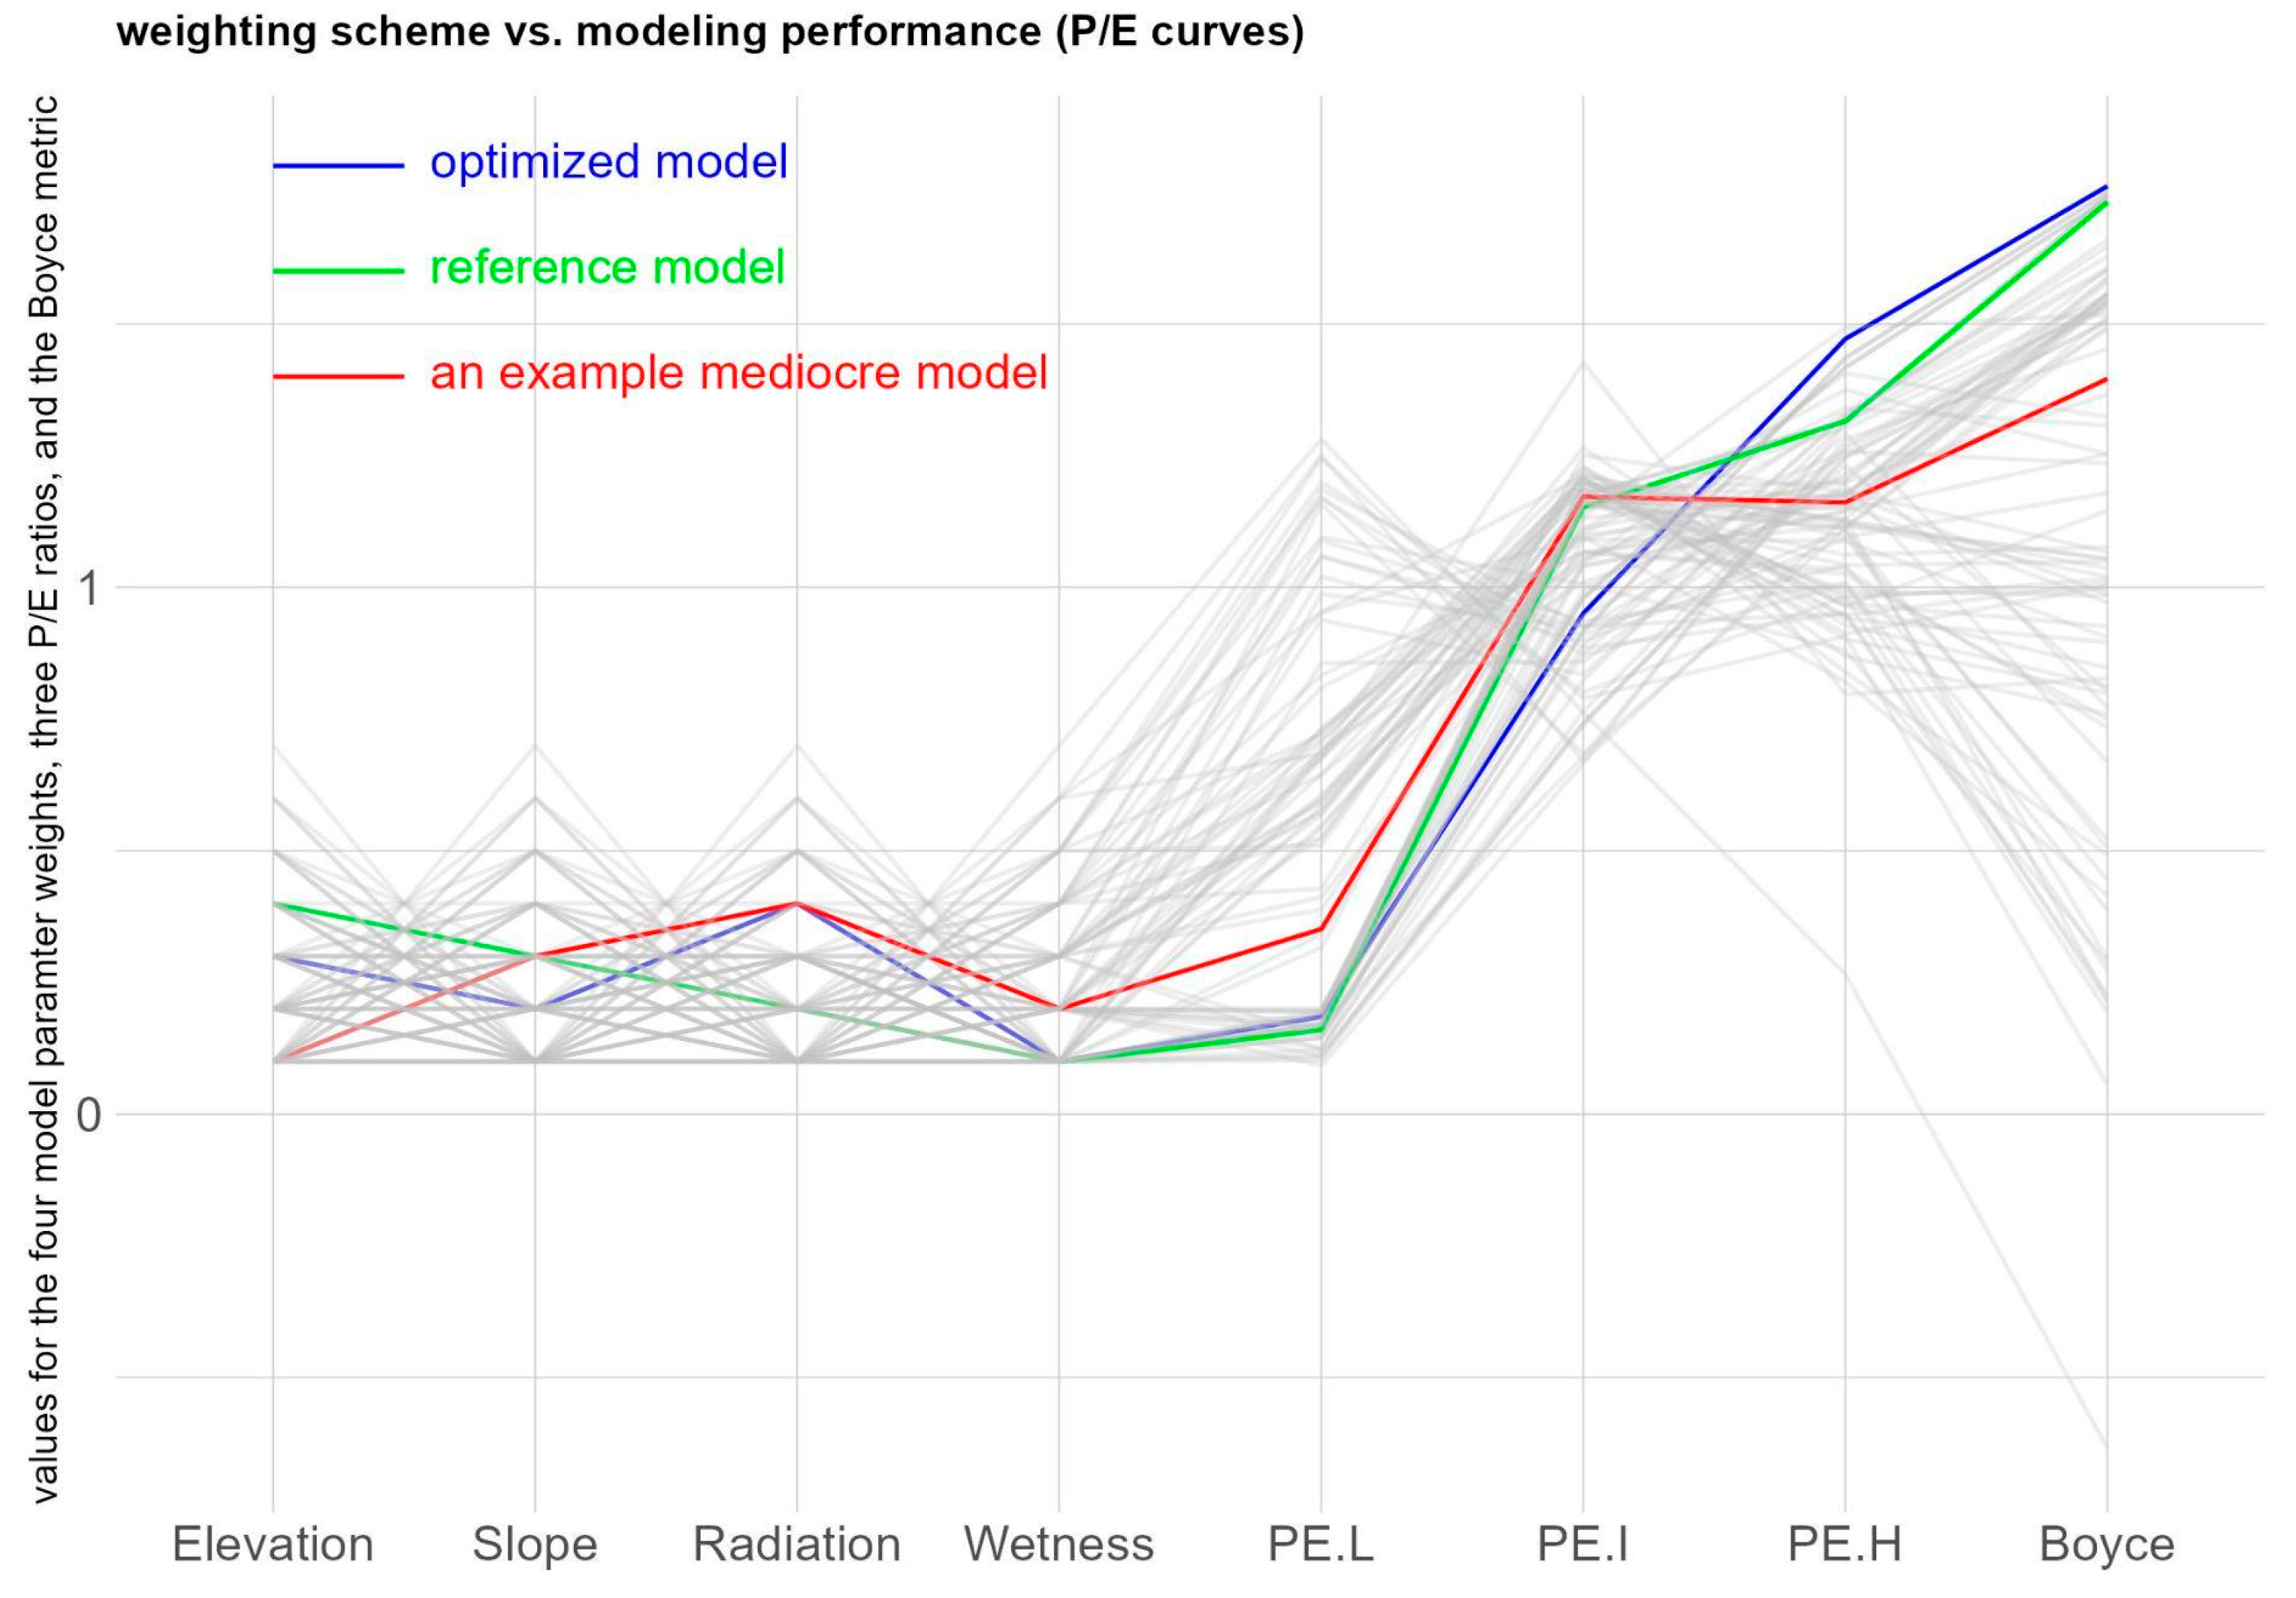
2.7. Optimized Risk Assessment Model Based on Field Observations

Based on the observations from the in-field assessment of oak decline at this site, we reassessed the relative weights of the parameters used in the risk assessment model. To achieve this, we tested a wide range of potential relative weight combinations for the parameters of elevation, slope, solar radiation, and TWI (instead of retaining the weights suggested by our review of the literature). Each parameter’s weight varied from 0.1 to 0.7 with an increasing step of 0.1, and the four parameters’ weights were constrained to have a sum of 1. There were a total of 84 (i.e., nine choose three) such combinations.
The weighted sum output under each relative weight combination was a continuous GIS map, which was further reclassified into a categorical map with three risk levels (low, intermediate, high) using the natural breaks (Jenks) classification scheme. The categorical risk maps were assessed with the field observation polygons, which were considered as presence data under the habitat suitability modeling framework.
We then employed the P/E (predicted to expected ratio) curves proposed by Boyce et al. [39] to evaluate the ability of each model to predict the oak decline presence. For each of the three risk levels, P was computed as the fraction of oak decline within the risk level to the total observed oak decline area, E as the relative area covered by the corresponding risk level, and P/E as the ratio of P to E. For an appropriate weighting scheme, the P/E ratio should be less than 1 for the low-risk level and greater than 1 for the high-risk level. In addition, the P/E curve (plot of P/E ratio against the risk-ranking order) should exhibit a monotonic increasing pattern for models properly delineating the risk. The P/E curve and various metrics derived from this curve are considered powerful tools to assess presence-only habitat models [40]. We used a variation of the Boyce Index [39,40] to summarize the three P/E ratios, in which the P/E ratio of the high-risk level was subtracted from the P/E ratio of the low-risk level and added with half of the P/E ratio of the intermediate-risk level. We considered the model with the highest Boyce metric the superior model for oak decline risk delineation as it balanced modeling sensitivity and specificity.

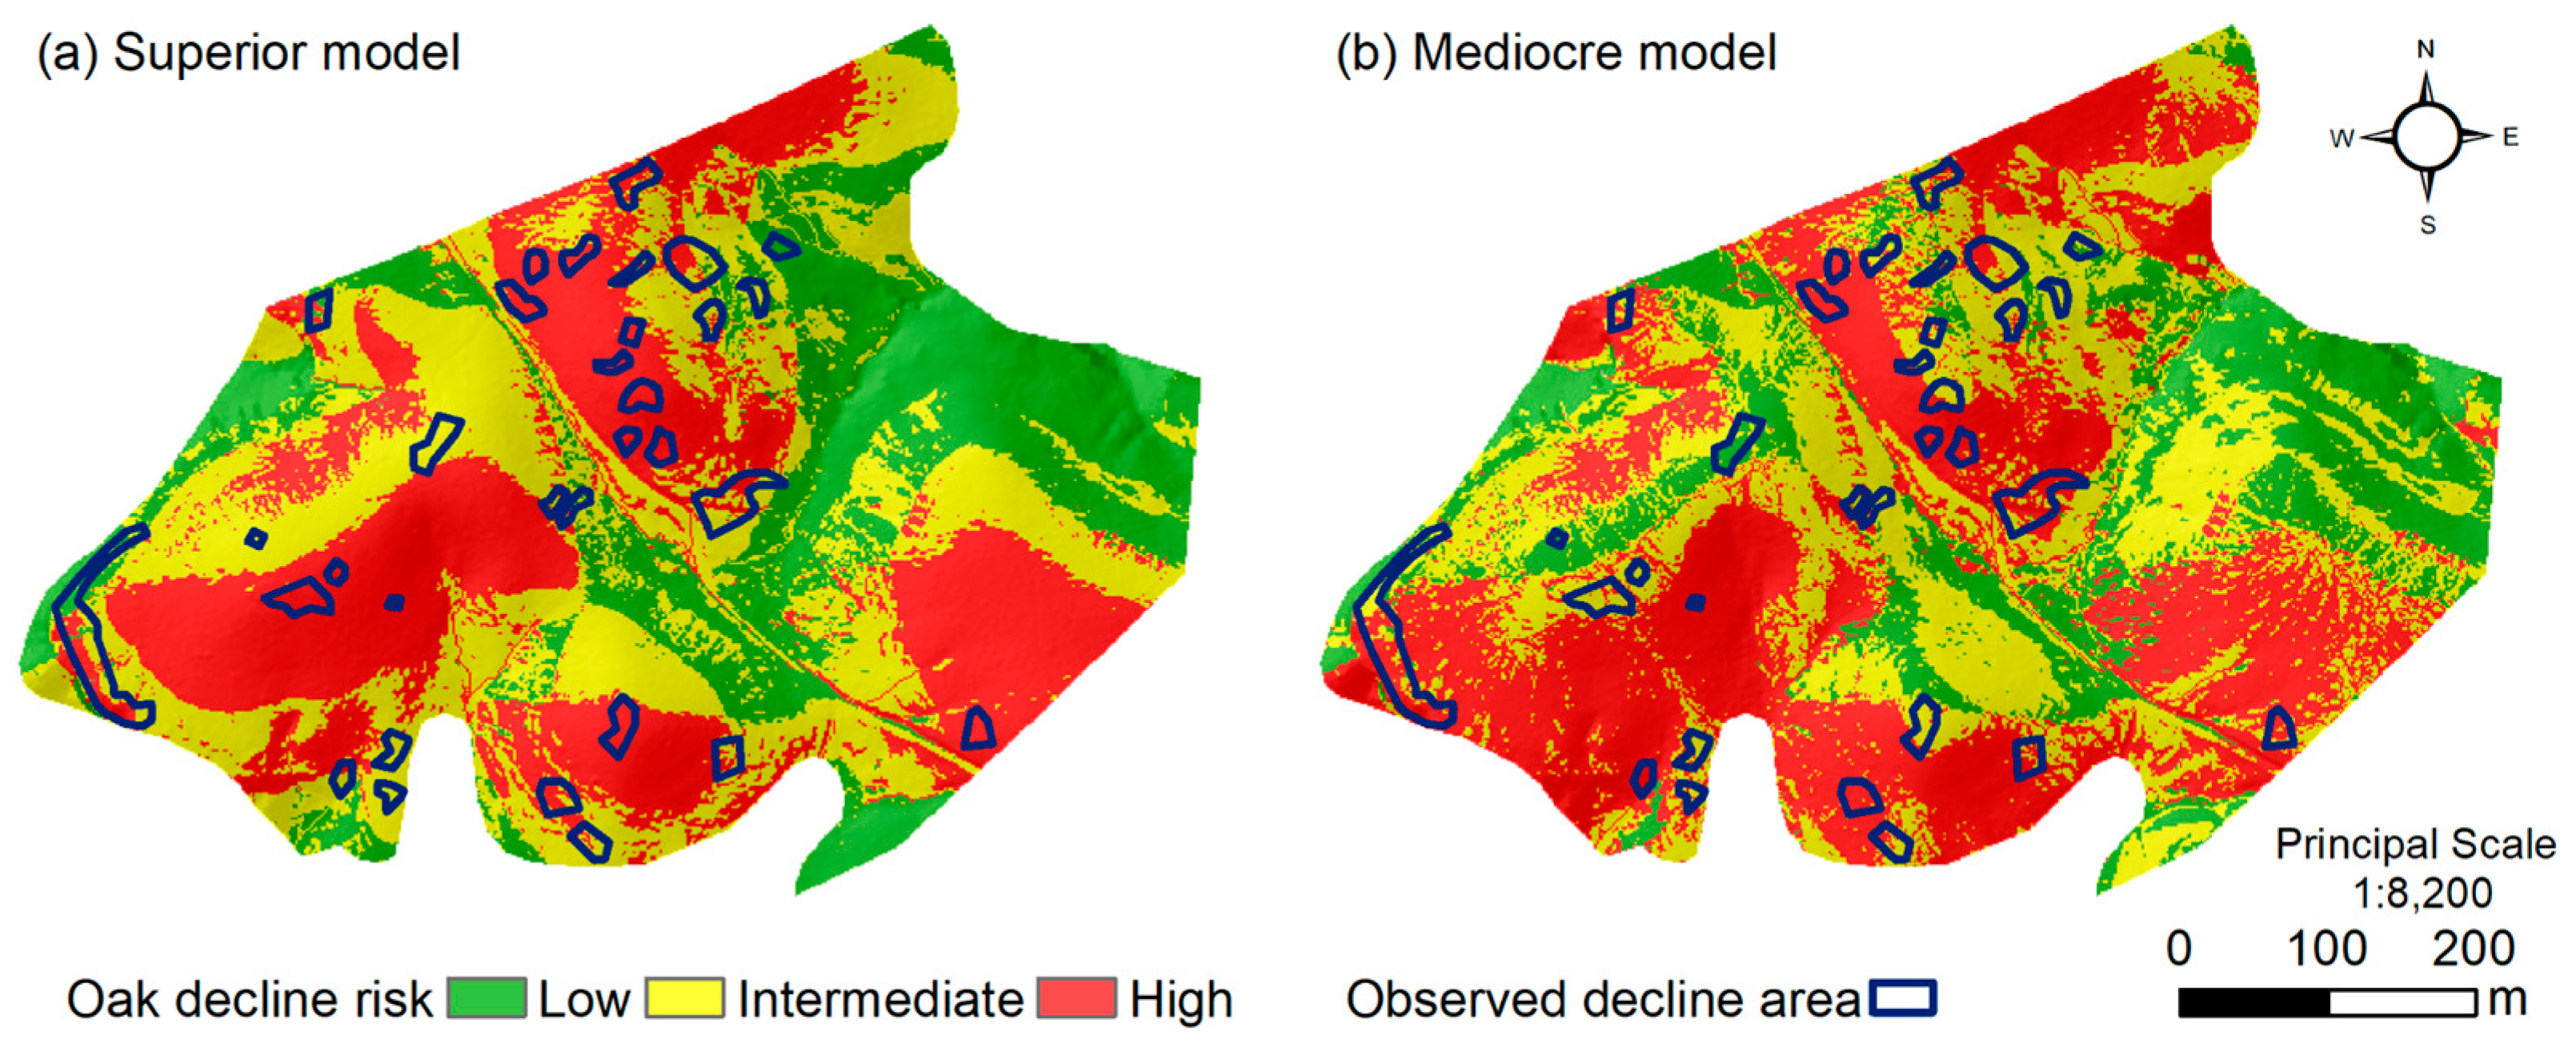
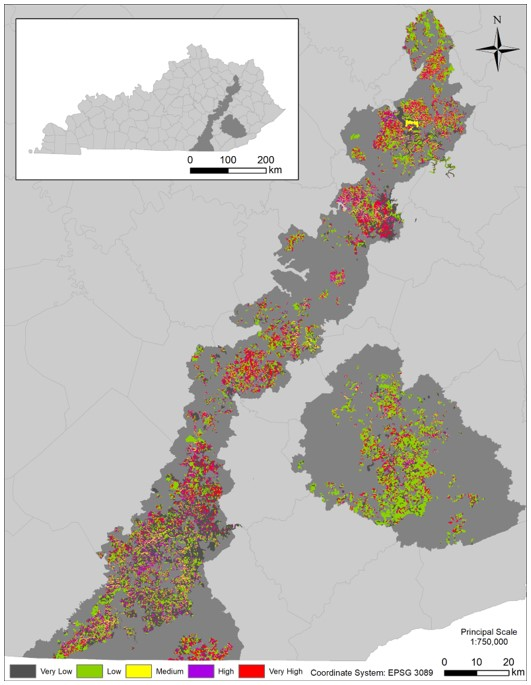
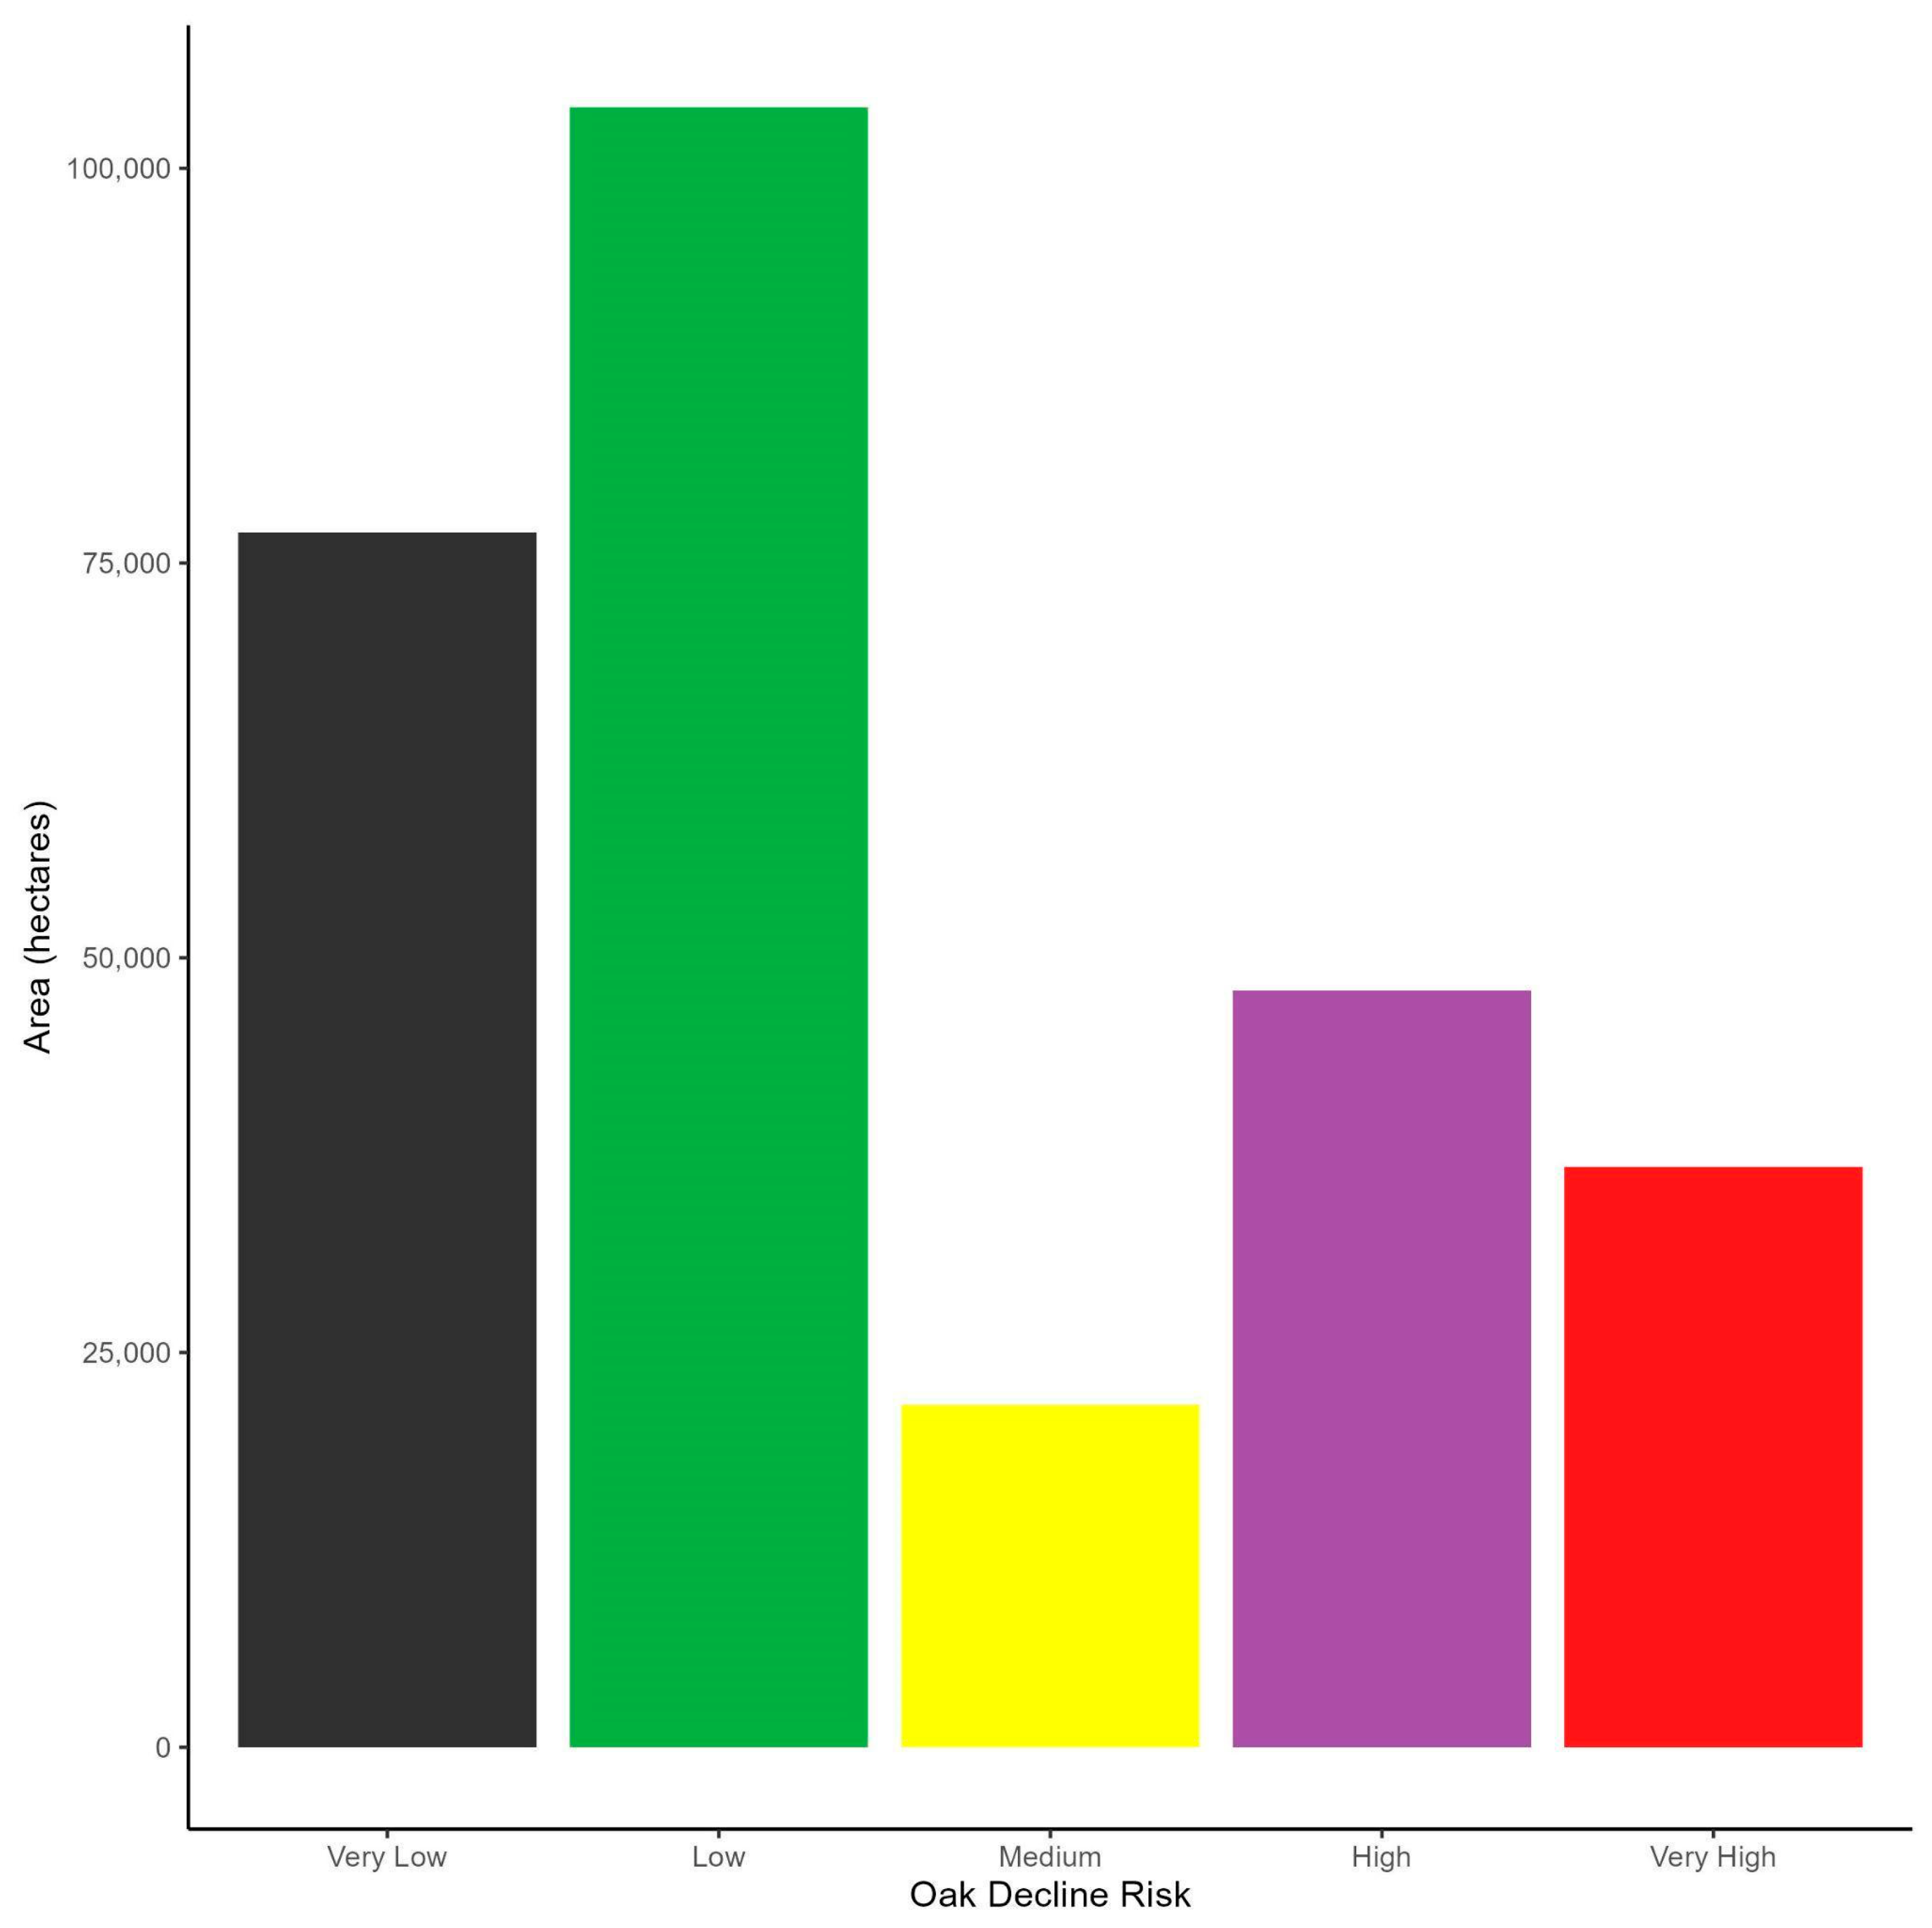
2.8. Risk Mapping at the Landscape Scale

Once the model derived from the case study site was optimized based on our field observation according to the calculated Boyce metric, we developed a risk map for the entire DBNF. First, we used the USDA US Forest Service Field Sampled Vegetation Database (FSVeg) for the DBNF, which contains species composition and age information at the stand level, to identify forest stands predisposed to oak decline based on stand characteristics (Table 1). Stands that were more than 90 years old and dominated or co-dominated by oaks (from both red and white groups) were selected. These stands were further divided by counties (political areas averaging approximately 920 km2 each). GIS variables representing environmental characteristics (e.g., elevation, slope, solar radiation, and TWI) for these stands were derived at the county scale since the computation of certain GIS variables (e.g., solar radiation) and reclassification of continuous variables to categorical variables may be less accurate if conducted at the regional scale. There were 18 counties that intersected with these stands. A risk map was produced for each of these counties following the same modeling procedure developed for the case study site. Specifically, we used the natural breaks method to convert the four continuous GIS variables into categorical variables at the county level (hence, each county has its own breaking values to reflect the local conditions) and applied the same optimized weighting scheme to summarize all four environmental factors. We then used the reclassification tool to classify stands that did not contain a primary oak-dominant forest type as very low risk, the stands with oaks but a stand age of less than 90 years as low-risk, the pixels belonging to the oak-containing stands older than 90 years but with less conducive environmental characteristics as medium-risk, the pixels belonging to the old oak stands (>90 years) with intermediate conducive environmental characteristics as high-risk, and the pixels belonging to the old oak stands and with highly conducive environmental characteristics as very high risk. These 18 county-scale risk maps were merged into one regional-scale map to show the oak decline risk of the entire Daniel Boone National Forest.

3. Results

The oak decline risk map derived from the literature-based weighting scheme (Figure 5) for the case study site identified areas distributed in mid and upper slopes, areas with south-facing aspects with high solar radiation, and areas with steep convex slope segments with a dry soil moisture regime as very high risk (Figure 5 vs. Figure 3). Based on the site-scale oak decline model, low-risk areas covered 43% of the entire study area, while medium- and higher-risk levels covered 21% and 36%, respectively (Figure 6). In contrast, the observed oak decline occurred mostly in the designated high-risk areas (47%), followed by low-risk (30%) and medium-risk areas (23%). The chi-square test showed that the observed oak decline proportion distribution was significantly different from the mapped risk distribution (X-squared = 396.61, d.f. = 2, p-value < 0.001), suggesting that a significant portion of the actual oak decline areas fall within the category of high- and medium-risk groups of the risk map.
The prediction performance of the model using the literature-based weighting scheme (0.4, 0.3, 0.2, and 0.1 for elevation, slope, solar radiation, and TWI-based wetness) was ranked fifth according to the Boyce metric among all the 84 relative weight combinations (Figure 7). The model optimized with the highest Boyce metric value had the weighting scheme of 0.3, 0.2, 0.4, and 0.1. These two models had a similar P/E ratio for the low-risk category, but the optimized model had a higher P/E ratio for the high-risk category and a more steadily increasing pattern of the P/E curve than the literature-review-based model. The mean relative weights of the top five models were 0.32, 0.26, 0.32, and 0.1 for elevation, slope, solar radiation, and wetness, respectively. The mediocre models tended to be the ones with a high relative weight for wetness at the expense of radiation or elevation (Figure 7). For example, Figure 8 shows the high-risk category predicted by a mediocre model extended its coverage to low-elevation areas compared to the one predicted by the optimized model, suggesting a possible decrease in modeling specificity (Figure 8).
The risk map for the entire DBNF shows that high-risk sites are scattered throughout the forest (Figure 9). Areas with higher elevation, higher slope steepness, and higher solar radiation are also the areas that are likely to have experienced oak decline or to experience oak decline in the future. Approximately 12.8% or 36,800 ha of the stands within the Daniel Boone National Forest that are dominated by an oak component were identified as having a very high risk for oak decline, while 16.7% (47,900 ha) were identified as having a high risk, 7.6% (21,700 ha) had a medium risk, and 36.2% (103,900 ha) a low risk. An additional 76,900 ha (26.8%) were identified as very low risk due to the lack of a significant oak component (Figure 10). Within the stands older than 90 years and with an oak component (106,000 ha), approximately 34.6% were identified as very high risk, 45.0% as high, and 20.4% as medium risk.

4. Discussion

Oak decline is a multi-scale issue with predisposing, inciting, and contributing factors interacting across a variety of spatial scales [21]. While stressors that contribute to oak decline have been well studied, the process of translating this information to spatially explicit data useful for management is less clear given the many compounding issues at play. Here, we used a combination of approaches (e.g., GIS, remote sensing) to develop a model for assessing oak decline risk across a broad and heterogeneous area, the Daniel Boone National Forest. Using available stand- and site-level GIS data, this work suggests that oak decline risk is high or very high for almost 30% of the forest and, based on this, we expect to see oak mortality increase in those stands over time as trees age. While the long-term implications of this increasing risk for forest stand composition are unclear [41], these findings highlight priority areas to consider in light of anticipated future changes, particularly if any new issues, such as the arrival of spongy moth, were to arise.
This case study provides a valuable addition to other existing analyses of risk to forests and a model for future work. For example, the Terrestrial Condition Assessment (TCA) for USDA Forest Service lands lists the entirety of the DBNF as being in very good condition from both a vegetation departure metric and uncharacteristic tree mortality metric [42]. However, while the TCA, which is based on FIA data, is a useful tool, it does not reflect the on-the-ground conditions observed by managers in the area or the more nuanced but significant tree risks. The approach employed in our study, scaling up from local reports to individual sites and then expanding to a landscape level in an iterative manner, offers greater specificity and, in this case, can provide foresters with more locally specific tools for management.
This study used a set of four different predisposing site factors to determine risk (elevation, slope, solar radiation, and topographic wetness index) as well as two predisposing stand factors (species composition and age). Aspect was also used initially but later discarded from the modeling due to its overlap with solar radiation, which was used in this study instead since it directly represents aspect influences on solar energy distribution at the site scale. Similarly, although proximity to water has been used as a moisture index in studies of oak decline [17], the topographic wetness index is used since it is easier to derive in the GIS and is quantitative in nature. Based on the literature review, high elevation, steep slopes, and high solar radiation were given relatively larger weights for ranking in this study initially, meaning that areas with these characteristics are more likely to experience oak decline. The topographic wetness index was given the lowest weight because it was least important in our overall risk assessment compared to other factors. Upon comparison with in-field observations of oak decline at the small study site, we found that the top five risk models determined elevation and solar radiation are most important factors, with the highest mean relative weight (0.32), followed by slope (0.26), while topographic wetness remained at the lowest weight (0.1).
Several past studies have also used soil depth as a predisposing factor for assessing oak decline, but we were unable to include this factor due to data limitations in our study area. For example, data from the Soil Survey Geographic Database (SSURGO), the most widely used digital soil maps in the US, were very coarse in our study area within the DBNF. Therefore, although this risk map is informative, a model that contains additional environmental factors, including adding information about potential contributing and inciting factors, should be developed in future studies.
It is worth noting that the site-scale risk models derived from slightly different weighting schemes could vary greatly in terms of prediction performance (Figure 7). However, the model we initially developed for oak decline risk, based on our assessment of the importance of various site conditions described in the past literature, was relatively similar to the one we later developed (and that we considered “optimized”) by matching all potential combinations of parameter weights. Only slight differences in the weights of elevation (lowered from 0.4 to 0.3), slope (lowered from 0.3 to 0.2), and solar radiation (raised from 0.2 to 0.4) resulted. Another interesting feature of this optimized model selection technique was that simply selecting for maximum match of oak decline in the field to a “high” rating (i.e., high predicted frequency) on the model was undesirable. While other factor weighting schemes could maximize this, it generally resulted in far more area being ranked “high” (i.e., high expected frequency), and thus the result was less meaningful from a management perspective; if all of the area is ranked “high”, then this designation loses its meaning. Because of this, we instead opted to rank models in a way that valued a balance between model sensitivity and specificity (i.e., P/E ratio) instead of simply using the closest match to field observations.
Remote sensing (specifically aerial photography) was used in this project through the digitization of decline polygons using NAIP imagery from 2016 to find areas inside the DBNF that appeared to contain some canopy gaps, indicating tree mortality. In addition, LIDAR remote sensing was used in developing the input variables for the risk modeling. When a sample of these sites were visited, some contained patches of oak decline, where oak trees had died, while other sites contained non-oak trees that had died (both resulted in canopy gaps). However, some of the digitized polygons were found to be just canopy gaps, with no recent tree mortality. While aerial imagery can provide helpful suggestions for field visit sites, decline digitization needs to be field-verified before coming to a conclusion, especially in highly diverse stands, to confirm species composition.
Past studies of oak decline in the eastern US largely relied on detailed stand information for particular areas [18,19,20,34] or compiling large numbers of observations from Forest Inventory and Analysis (FIA) datasets [11]. While this dataset is very valuable and provides a snapshot of forest conditions across the country, it is limited for informing understanding of recent changes in a specific area given the spatial resolution (limited number of plots) and the sampling interval (each plot measured at regularly, but infrequently). While FIA data are very useful for detecting trends over time, issues at a finer spatial scale are more likely to be observed by the individuals who own or manage those areas. Reports of oak mortality from landowners are major indicators of oak decline in Kentucky since most forested land is privately owned. While these anecdotal reports are not solid data, they provide an idea of the pervasiveness of oak decline and another avenue to use in future investigations.
Our pilot study points to a future strategy for combining these public observations with remote sensing and GIS to assess forest health issues across a broad spatial area. Based on this work, we propose an integrated approach for future forest health risk assessment including the following:
  • Reporting by the public: public providing alerts about forest health problems (e.g., citizen science, working forest professionals).
  • Stand-level assessment: foresters and scientists working together to predict area impacted using GIS (based on known predisposing site factors), stand inventories, and remote sensing.
  • Landscape-level assessment: expanding models beyond study areas across a broader scale.
  • Verification and improvements: validating model results and changing models to better fit in-field observations.
  • Public dissemination: sharing results with partners and the public and encouraging continued public reporting of issues that can provide insight into future models.
Expanding this collaborative approach in the future may be a beneficial strategy for leveraging the expertise of engaged members of the public, forest professionals, and scientists. Citizen scientists (landowners and other non-professional scientists) can scout for and report issues, increasing access to information on both public and private lands. Foresters and land managers can provide detailed site information and scientists can provide GIS and remote sensing (RS) analysis, drawing these different observations together to better inform future management. Continuous incorporation of reports from on-the-ground observations (CS) with other methods (GIS and RS) would also allow for a scalable, iterative approach.
This study makes a case for incorporating citizen science observations into oak decline and other tree health risk models. On the one hand, our optimized model, based on in-field observations, was remarkably similar to the model developed exclusively based on reviewing the literature on oak decline. However, these changes, while relatively minor on a landscape level, may have important implications on a stand level, although further testing is needed to determine whether they hold across a broader spatial scale. We feel that these findings point to both the value of literature in developing core model parameters and the potential for citizen science observations and other on-the-ground information to fine-tune these.
Already, citizen science has proved a valuable tool in the detection and management of new invasive species with the potential to impact forest health [43,44,45]. However, there are limitations to this approach as well as important implications that should be considered, ranging from issues with consistency of data quality to structural challenges in experimental design. For example, some species or approaches may lend themselves well to citizen science study, resulting in high-quality data comparable to expert collections, while in other scenarios this potential is more limited or at least nuanced [46,47,48].
Another concern that is particularly relevant for the type of approach proposed here is the difference between opportunistic reporting (largely of presence data) versus a more systematic protocol that reflects information on both presence and absence. Depending on the questions being asked and downstream analysis planned, it may be more or less important to compensate for these shortcomings of citizen science data collection [49]. In a modeling context, this issue is also present in the difference between using non-probability (e.g., purposive) and probability (e.g., random) samples to build models [50]. Nonetheless, we believe that this combined approach holds great potential to inform management related to oak decline (as well as other threats) in the future.

5. Conclusions

Oaks (Quercus spp.) are important tree species in the eastern United States, being central to many forest types and highly valuable ecologically and economically. However, there are many threats to oaks, ranging from poor management practices to invasive species. Among the most important of these threats is oak decline. An enhanced understanding of site and stand issues underlying oak decline risk will enable land managers to better plan stand treatments to improve forest health and resilience in the face of current and future threats. By combining public reporting (e.g., citizen science), GIS, and remote sensing, here we present a model of oak decline in the Daniel Boone National Forest that identifies high-risk sites scattered throughout the forest. In addition, this work provides a framework for collaboration between scientists, forest professionals, and the public that is scalable and iterative. Working together, these groups can develop informative models that allow for better forest management, especially under conditions of increasing disturbances and emerging threats.

Author Contributions

Conceptualization, E.C., C.D.N. and J.Y.; Formal analysis, K.G. and J.Y.; Investigation, K.G. and J.Y.; Methodology, K.G. and J.Y.; Validation, K.G., J.C. and J.Y.; Writing—original draft, E.C., K.G. and J.Y.; Writing—review and editing, E.C., J.C., C.D.N. and J.Y. All authors have read and agreed to the published version of the manuscript.

Funding

This research was funded by grant 19-JV-11330126-084 from the USDA Forest Service Southern Research Station.

Data Availability Statement

The data presented in this study are available on request from author Jian Yang.

Acknowledgments

We would like to thank Jacob Royse at the Daniel Boone National Forest for his assistance in initial oak decline reports and field work as well as the Forest Health Research and Education Center for encouraging and supporting this work.

Conflicts of Interest

The authors declare no conflict of interest.

References

  1. Oswalt, S.N.; Smith, W.B.; Miles, P.D.; Pugh, S.A. Forest Resources of the United States, 2017: A Technical Document Supporting the Forest Service 2020 RPA Assessment; General Technical Report (GTR) WO-97; U.S. Department of Agriculture, Forest Service, Washington Office: Washington, DC, USA, 2019.
  2. Ellison, A.M.; Bank, M.S.; Clinton, B.D.; Colburn, E.A.; Elliott, K.; Ford, C.R.; Foster, D.R.; Kloeppel, B.D.; Knoepp, J.D.; Lovett, G.M.; et al. Loss of foundation species: Consequences for the structure and dynamics of forested ecosystems. Front. Ecol. Environ. 2005, 3, 479–486. [Google Scholar] [CrossRef]
  3. Fralish, J.S. The Keystone Role of Oak and Hickory in the Central Hardwood Forest; General Technical Report (GTR) SRS-73; U.S. Department of Agriculture, Forest Service, Southern Research Station: Asheville, NC, USA, 2004; pp. 78–87.
  4. McShea, W.J.; Healy, W.M.; Devers, P.; Fearer, T.; Koch, F.H.; Stauffer, D.; Waldon, J. Forestry Matters: Decline of Oaks Will Impact Wildlife in Hardwood Forests. J. Wildl. Manag. 2007, 71, 1717–1728. [Google Scholar] [CrossRef]
  5. Stringer, J.W.; Thomas, W.T.; Ammerman, B.; Niman, C.; Agyeman, D.; Nevels, S.; Ochuodho, T. Kentucky Forest Sector Economic Contribution Report 2019–2020; FORFS-20-02; University of Kentucky: Lexington, KY, USA, 2020. [Google Scholar]
  6. Fei, S.; Kong, N.; Steiner, K.C.; Moser, W.K.; Steiner, E.B. Change in oak abundance in the eastern United States from 1980 to 2008. For. Ecol. Manag. 2011, 262, 1270–1377. [Google Scholar] [CrossRef]
  7. Conrad, A.O.; Crocker, E.V.; Li, X.; Thomas, W.R.; Ochuodho, T.O.; Holmes, T.P.; Nelson, C.D. Threats to Oaks in the Eastern United States: Perceptions and Expectations of Experts. J. For. 2020, 118, 14–27. [Google Scholar] [CrossRef]
  8. Haavik, L.J.; Billings, S.A.; Guldin, J.M.; Stephen, F.M. Emergent insects, pathogens and drought shape changing patterns in oak decline in North America and Europe. For. Ecol. Manag. 2015, 354, 190–205. [Google Scholar] [CrossRef]
  9. Davidson, C.B.; Gottschalk, K.W.; Johnson, J.E. Tree mortality following defoliation by the European gypsy moth (Lymantria dispar L.) in the United States: A review. For. Sci. 1999, 45, 74–78. [Google Scholar]
  10. Starkey, D.A.; Oak, S.W. Site factors and stand conditions associated with oak decline in southern upland hardwood forests. In Proceedings of the Seventh Central Hardwoods Forest Conference, Carbondale, IL, USA, 5–8 March 1989; pp. 95–102. [Google Scholar]
  11. Oak, S.W.; Steinman, J.R.; Starkey, D.A.; Yockey, E.K. Assessing Oak Decline Incidence and Distribution in the Southern U.S. Using Forest Inventory and Analysis Data; General Technical Report (GTR) SRS–73; U.S. Department of Agriculture, Forest Service, Southern Research Station: Asheville, NC, USA, 2004; pp. 236–242.
  12. Oak, S.W.; Spetich, M.; Morin, R.S. Oak decline in central hardwood forests: Frequency, spatial extent, and scale. In Natural Disturbances and Historic Range of Variation: Type, Frequency, Severity, and Post-Disturbance Structure in Central Hardwood Forests USA. Managing Forest Ecosystems; Greenberg, C.H., Collins, B.S., Eds.; Springer International Publishing: Geneva, Switzerland, 2015. [Google Scholar]
  13. Gottschalk, K.W.; Wargo, P.M. Oak decline around the world. In Proceedings of the U.S. Department of Agriculture Interagency Gypsy Moth Research Forum, 1996 General Technical Report (GTR) NE-230, Annapolis, MD, USA, 16–19 April 1996; U.S. Department of Agriculture, Forest Service, Northeastern Forest Experiment Station: Upper Darby, PA, USA, 1996; pp. 3–13. [Google Scholar]
  14. Oak, S.; Tainter, F.; Williams, J.; Starkey, D. Oak decline risk rating for the southeastern United States. Ann. For. Sci. 1996, 53, 721–730. [Google Scholar] [CrossRef]
  15. Manion, P. Tree Disease Concepts, 2nd ed.; Prentice-Hall: Englewood Cliffs, NJ, USA, 1991. [Google Scholar]
  16. Clatterbuck, W.; Kauffman, B. Managing oak decline. In University of Kentucky’s Cooperative Extension Publication FOR-099; University of Kentucky: Lexington, KY, USA, 2006. [Google Scholar]
  17. Bendixsen, D.P.; Hallgren, S.W.; Frazier, A.E. Stress factors associated with forest decline in xeric oak forests of south-central United States. For. Ecol. Manag. 2015, 347, 40–48. [Google Scholar] [CrossRef]
  18. Greenberg, C.; Keyser, T.L.; Speer, J. Temporal Patterns of Oak Mortality in a Southern Appalachian Forest (1991–2006). Nat. Areas J. 2011, 31, 131–137. [Google Scholar] [CrossRef]
  19. Spetich, M.A.; Fan, Z.; Fan, X.; He, H.; Shifley, S.R.; Moser, W.K. Risk Factors of Oak Decline and Regional Mortality Patterns in the Ozark Highlands of Arkansas and Missouri. In Forest Health Monitoring: 2009 National Technical Report; General Technical Report (GTR) SRS-GTR-167; Potter, K.M., Conkling, B.L., Eds.; Southern Research Station: Asheville, NC, USA, 2011; pp. 199–202. [Google Scholar]
  20. Stringer, J.W.; Kimmerer, T.W.; Overstreet, J.C.; Dunn, J.P. Oak Mortality in Eastern Kentucky. South. J. Appl. For. 1989, 13, 86–91. [Google Scholar] [CrossRef]
  21. Fan, Z.; Fan, X.; Crosby, M.K.; Moser, W.K.; He, H.; Spetich, M.A.; Shifley, S.R. Spatio-Temporal Trends of Oak Decline and Mortality under Periodic Regional Drought in the Ozark Highlands of Arkansas and Missouri. Forests 2012, 3, 614–631. [Google Scholar] [CrossRef]
  22. Orusa, T.; Orusa, R.; Viani, A.; Carella, E.; Mondino, E.B. Data to Support Wildlife Diseases Assessment at Landscape Level: A Pilot Experience to Map Infectious Keratoconjunctivitis in Chamois and Phenological Trends in Aosta Valley (NW Italy). Remote Sens. 2020, 12, 3542. [Google Scholar] [CrossRef]
  23. Potapov, P.; Yaroshenko, A.; Turubanova, S.; Dubinin, M.; Laestadius, L.; Thies, C.; Aksenov, D.; Egorov, A.; Yesipova, Y.; Glushkov, I.; et al. Mapping the World’s Intact Forest Landscapes by Remote Sensing. Ecol. Soc. 2008, 13, 51. Available online: http://www.ecologyandsociety.org/vol13/iss2/art51/ (accessed on 5 February 2023). [CrossRef] [Green Version]
  24. Orusa, T.; Cammareri, D.; Mondino, E.B. A Possible Land Cover EAGLE Approach to Overcome Remote Sensing Limitations in the Alps Based on Sentinel-1 and Sentinel-2: The Case of Aosta Valley (NW Italy). Remote Sens. 2022, 15, 178. [Google Scholar] [CrossRef]
  25. Loman, Z.G.; Deluca, W.V.; Harrison, D.J.; Loftin, C.S.; Rolek, B.W.; Wood, P.B. Landscape capability models as a tool to predict fine-scale forest bird occupancy and abundance. Landsc. Ecol. 2018, 33, 77–91. [Google Scholar] [CrossRef]
  26. Jaiswal, R.K.; Mukherjee, S.; Raju, K.D.; Saxena, R. Forest fire risk zone mapping from satellite imagery and GIS. Int. J. Appl. Earth Obs. Geoinf. 2002, 4, 1–10. [Google Scholar] [CrossRef]
  27. Meentemeyer, R.; Rizzo, D.; Mark, W.; Lotz, E. Mapping the risk of establishment and spread of sudden oak death in California. For. Ecol. Manag. 2004, 200, 195–214. [Google Scholar] [CrossRef]
  28. Serniak, L.T.; Chan, S.S.; Lajtha, K. Predicting habitat suitability for Amynthas spp. in the United States: A retrospective analysis using citizen science data from iNaturalist. Biol. Invasions 2023, 25, 817–825. [Google Scholar] [CrossRef]
  29. Pawson, S.M.; Sullivan, J.J.; Grant, A. Expanding general surveillance of invasive species by integrating citizens as both observers and identifiers. J. Pest Sci. 2020, 93, 1155–1166. [Google Scholar] [CrossRef]
  30. United States, Forest Service, Southern Region. Land and Resource Management Plan for the Daniel Boone National Forest; USDA Forest Service: Winchester, KY, USA, 2004.
  31. Crocker, E.; Condon, B.; Almsaeed, A.; Jarret, B.; Nelson, C.D.; Abbott, A.G.; Main, D.; Staton, M. TreeSnap: A citizen science app connecting tree enthusiasts and forest scientists. Plants People Planet 2019, 2, 47–52. [Google Scholar] [CrossRef]
  32. Staley, J.M. Decline and Mortality of Red and Scarlet Oaks. For. Sci. 1965, 11, 2–17. [Google Scholar]
  33. Demchik, M.C.; Sharpe, W.E. The effect of soil nutrition, soil acidity and drought on northern red oak (Quercus rubra L.) growth and nutrition on Pennsylvania sites with high and low red oak mortality. For. Ecol. Manag. 2000, 136, 199–207. [Google Scholar] [CrossRef]
  34. Kabrick, J.M.; Dey, D.C.; Jensen, R.G.; Wallendorf, M. The role of environmental factors in oak decline and mortality in the Ozark Highlands. For. Ecol. Manag. 2008, 255, 1409–1417. [Google Scholar] [CrossRef] [Green Version]
  35. Law, J.R.; Melick, R.; Studyvin, C.; Steinman, J.R. Oak Decline in Missouri: History Revisited; General Technical Report (GTR) SRS-73; Department of Agriculture, Forest Service, Southern Research Station: Asheville, NC, USA, 2004; pp. 257–258.
  36. Shifley, S.R.; Fan, Z.; Kabrick, J.M.; Jensen, R.G. Oak mortality risk factors and mortality estimation. For. Ecol. Manag. 2006, 299, 16–26. [Google Scholar] [CrossRef] [Green Version]
  37. Fan, Z.; Kabrick, J.M.; Spetich, M.A.; Shifley, S.R.; Jensen, R.G. Oak mortality associated with crown dieback and oak borer attack in the Ozark Highlands. For. Ecol. Manag. 2008, 255, 2297–2305. [Google Scholar] [CrossRef]
  38. Heitzman, E.; Grell, A.; Spetich, M.; Starkey, D. Changes in forest structure associated with oak decline in severely impacted areas of northern Arkansas. South. J. Appl. For. 2007, 31, 17–22. [Google Scholar] [CrossRef] [Green Version]
  39. Boyce, M.S.; Vernier, P.R.; E Nielsen, S.; Schmiegelow, F.K. Evaluating resource selection functions. Ecol. Model. 2002, 157, 281–300. [Google Scholar] [CrossRef] [Green Version]
  40. Hirzel, A.H.; Le Lay, G.; Helfer, V.; Randin, C.; Guisan, A. Evaluating the ability of habitat suitability models to predict species presences. Ecol. Model. 2006, 199, 142–152. [Google Scholar] [CrossRef]
  41. Kromroy, K.W.; Juzwik, J.; Castillo, P.; Hansen, M.H. Using Forest Service Forest Inventory and Analysis Data to Estimate Regional Oak Decline and Oak Mortality. North. J. Appl. For. 2008, 25, 17–24. [Google Scholar] [CrossRef] [Green Version]
  42. Cleland, D.; Reynolds, K.; Vaughan, R.; Schrader, B.; Li, H.; Laing, L. Terrestrial Condition Assessment for National Forests of the USDA Forest Service in the Continental US. Sustainability 2017, 9, 2144. [Google Scholar] [CrossRef] [Green Version]
  43. De Groot, M.; Pocock, M.J.O.; Bonte, J.; Fernandez-Conradi, P.; Valdés-Correcher, E. Citizen Science and Monitoring Forest Pests: A Beneficial Alliance? Curr. For. Rep. 2022, 9, 15–32. [Google Scholar] [CrossRef]
  44. Larson, E.R.; Graham, B.M.; Achury, R.; Coon, J.J.; Daniels, M.K.; Gambrell, D.K.; Jonasen, K.L.; King, G.D.; Laracuente, N.; Perrin-Stowe, T.; et al. From eDNA to citizen science: Emerging tools for the early detection of invasive species. Front. Ecol. Environ. 2020, 18, 194–202. [Google Scholar] [CrossRef]
  45. Falk, B.G.; Snow, R.W.; Reed, R.N. Prospects and Limitations of Citizen Science in Invasive Species Management: A Case Study with Burmese Pythons in Everglades National Park. Southeast. Nat. 2016, 15, 89–102. [Google Scholar] [CrossRef]
  46. Jäckel, D.; Mortega, K.G.; Sturm, U.; Brockmeyer, U.; Khorramshahi, O.; Voigt-Heucke, S.L. Opportunities and limitations: A comparative analysis of citizen science and expert recordings for bioacoustic research. PLoS ONE 2021, 16, e0253763. [Google Scholar] [CrossRef]
  47. Cox, T.E.; Philippoff, J.; Baumgartner, E.; Smith, C.M. Expert variability provides perspective on the strengths and weaknesses of citizen-driven intertidal monitoring program. Ecol. Appl. 2012, 22, 1201–1212. [Google Scholar] [CrossRef] [Green Version]
  48. Bauder, J.M.; Cervantes, A.M.; Avrin, A.C.; Whipple, L.S.; Farmer, M.J.; Miller, C.A.; Benson, T.J.; Stodola, K.W.; Allen, M.L. Mismatched spatial scales can limit the utility of citizen science data for estimating wildlife-habitat relationships. Ecol. Res. 2020, 36, 87–96. [Google Scholar] [CrossRef]
  49. Bradter, U.; Ozgul, A.; Griesser, M.; Layton-Matthews, K.; Eggers, J.; Singer, A.; Sandercock, B.K.; Haverkamp, P.J.; Snäll, T. Habitat suitability models based on opportunistic citizen science data: Evaluating forecasts from alternative methods versus an individual-based model. Divers. Distrib. 2021, 27, 2397–2411. [Google Scholar] [CrossRef]
  50. Weiser, E.L.; Diffendorfer, J.E.; Lopez-Hoffman, L.; Semmens, D.; Thogmartin, W.E. Challenges for leveraging citizen science to support statistically robust monitoring programs. Biol. Conserv. 2020, 242, 108411. [Google Scholar] [CrossRef]
Figure 1. Conceptual framework of research approach.
Remotesensing 15 02250 g001
Figure 2. Daniel Boone National Forest (DBNF) and its boundary, which includes private inholdings (gray color), and a case study site of a forest stand in DBNF.
Remotesensing 15 02250 g002
Figure 3. GIS representation of the four predisposing environmental factors (elevation, slope steepness, solar radiation, topographic wetness) in the case study site in the Daniel Boone National Forest.
Remotesensing 15 02250 g003
Figure 4. Reclassified oak decline risk ranking (low, middle, high) of each predisposing environmental factor (elevation, slope steepness, solar radiation, and topographic wetness) in the case study site in the Daniel Boone National Forest.
Remotesensing 15 02250 g004
Figure 5. Overall oak decline risk map of the case study site in the Daniel Boone National Forest based on predisposing environmental factors with the relative weight determined from the literature review and the observed decline polygons. The polygons were delineated based on the 2016 1 m resolution aerial image and validated through a field visit in 2019.
Remotesensing 15 02250 g005
Figure 6. Percentage of low-, intermediate-, and high-risk areas available in the oak decline map of the case study site on the Daniel Boone National Forest derived from the literature-review-based weighting scheme and observed in the delineated oak decline polygons derived from aerial imagery and field observation. Error bar indicates 95% confidence interval of the observed percentage under the null hypothesis that the observed percentage is the same as the available percentage.
Remotesensing 15 02250 g006
Figure 7. The 84 weighing schemes varied with the relative weights for elevation, slope, solar radiation, and TWI-based wetness and the corresponding model’s prediction performance measured by P/E (prediction-to-expected ratios at low-, intermediate-, and high-risk levels: PE.L, PE.I, PE.H) curve and the Boyce metric. Blue line shows the optimized (i.e., highest Boyce metric) model with the weighting scheme of 0.3, 0.2, 0.4, and 0.1 for elevation, slope, radiation, and wetness. Green line shows the reference model with the weighting scheme determined from the literature review (0.4, 0.3, 0.2, and 0.1 for elevation, slope, radiation, and wetness). Red line shows an example of a mediocre model with the weighting scheme of 0.1, 0.3, 0.4, and 0.2 for the four model parameters.
Remotesensing 15 02250 g007
Figure 8. Overall oak decline risk map of the case study site predicted by (a) a superior model with a weighting scheme optimized based on field data observations and (b) a mediocre model with a relatively low P/E ratio for the high-risk class and high P/R ratio for the low-risk class (see Figure 7 for details).
Remotesensing 15 02250 g008
Figure 9. Oak decline risk map of the Daniel Boone National Forest.
Remotesensing 15 02250 g009
Figure 10. Area (hectares) of Daniel Boone National Forest identified as very low, low, medium, high, and very high oak decline risk.
Remotesensing 15 02250 g010
Table 1. Summary of oak decline literature review (site and stand characteristics associated with decline).
CategoryQualitative FactorsReferences
Site-scale environmental characteristicsPoor soils (gravely, shallow, clay content, xeric, low nutrients)[10,13,14,17,20,32,33,34]
High elevation[10,17,20,34]
Low pH[17,33,34]
Steep slopes[14,17,34]
Exposed aspect[10,17]
Low site index[10,14]
Soil moisture[28]
Proximity to water[17]
Stand-scale biological characteristicsSpecies composition (e.g., red oak more decline)[10,11,14,19,20,32,35,36,37]
Stand age (e.g., older more decline)[10,14,34,38]
Disclaimer/Publisher’s Note: The statements, opinions and data contained in all publications are solely those of the individual author(s) and contributor(s) and not of MDPI and/or the editor(s). MDPI and/or the editor(s) disclaim responsibility for any injury to people or property resulting from any ideas, methods, instructions or products referred to in the content.

