
Open Source Data-Based Solutions for Identifying Patterns of Urban Earthquake Systemic Vulnerability in High-Seismicity Areas

Abstract
:1. Introduction
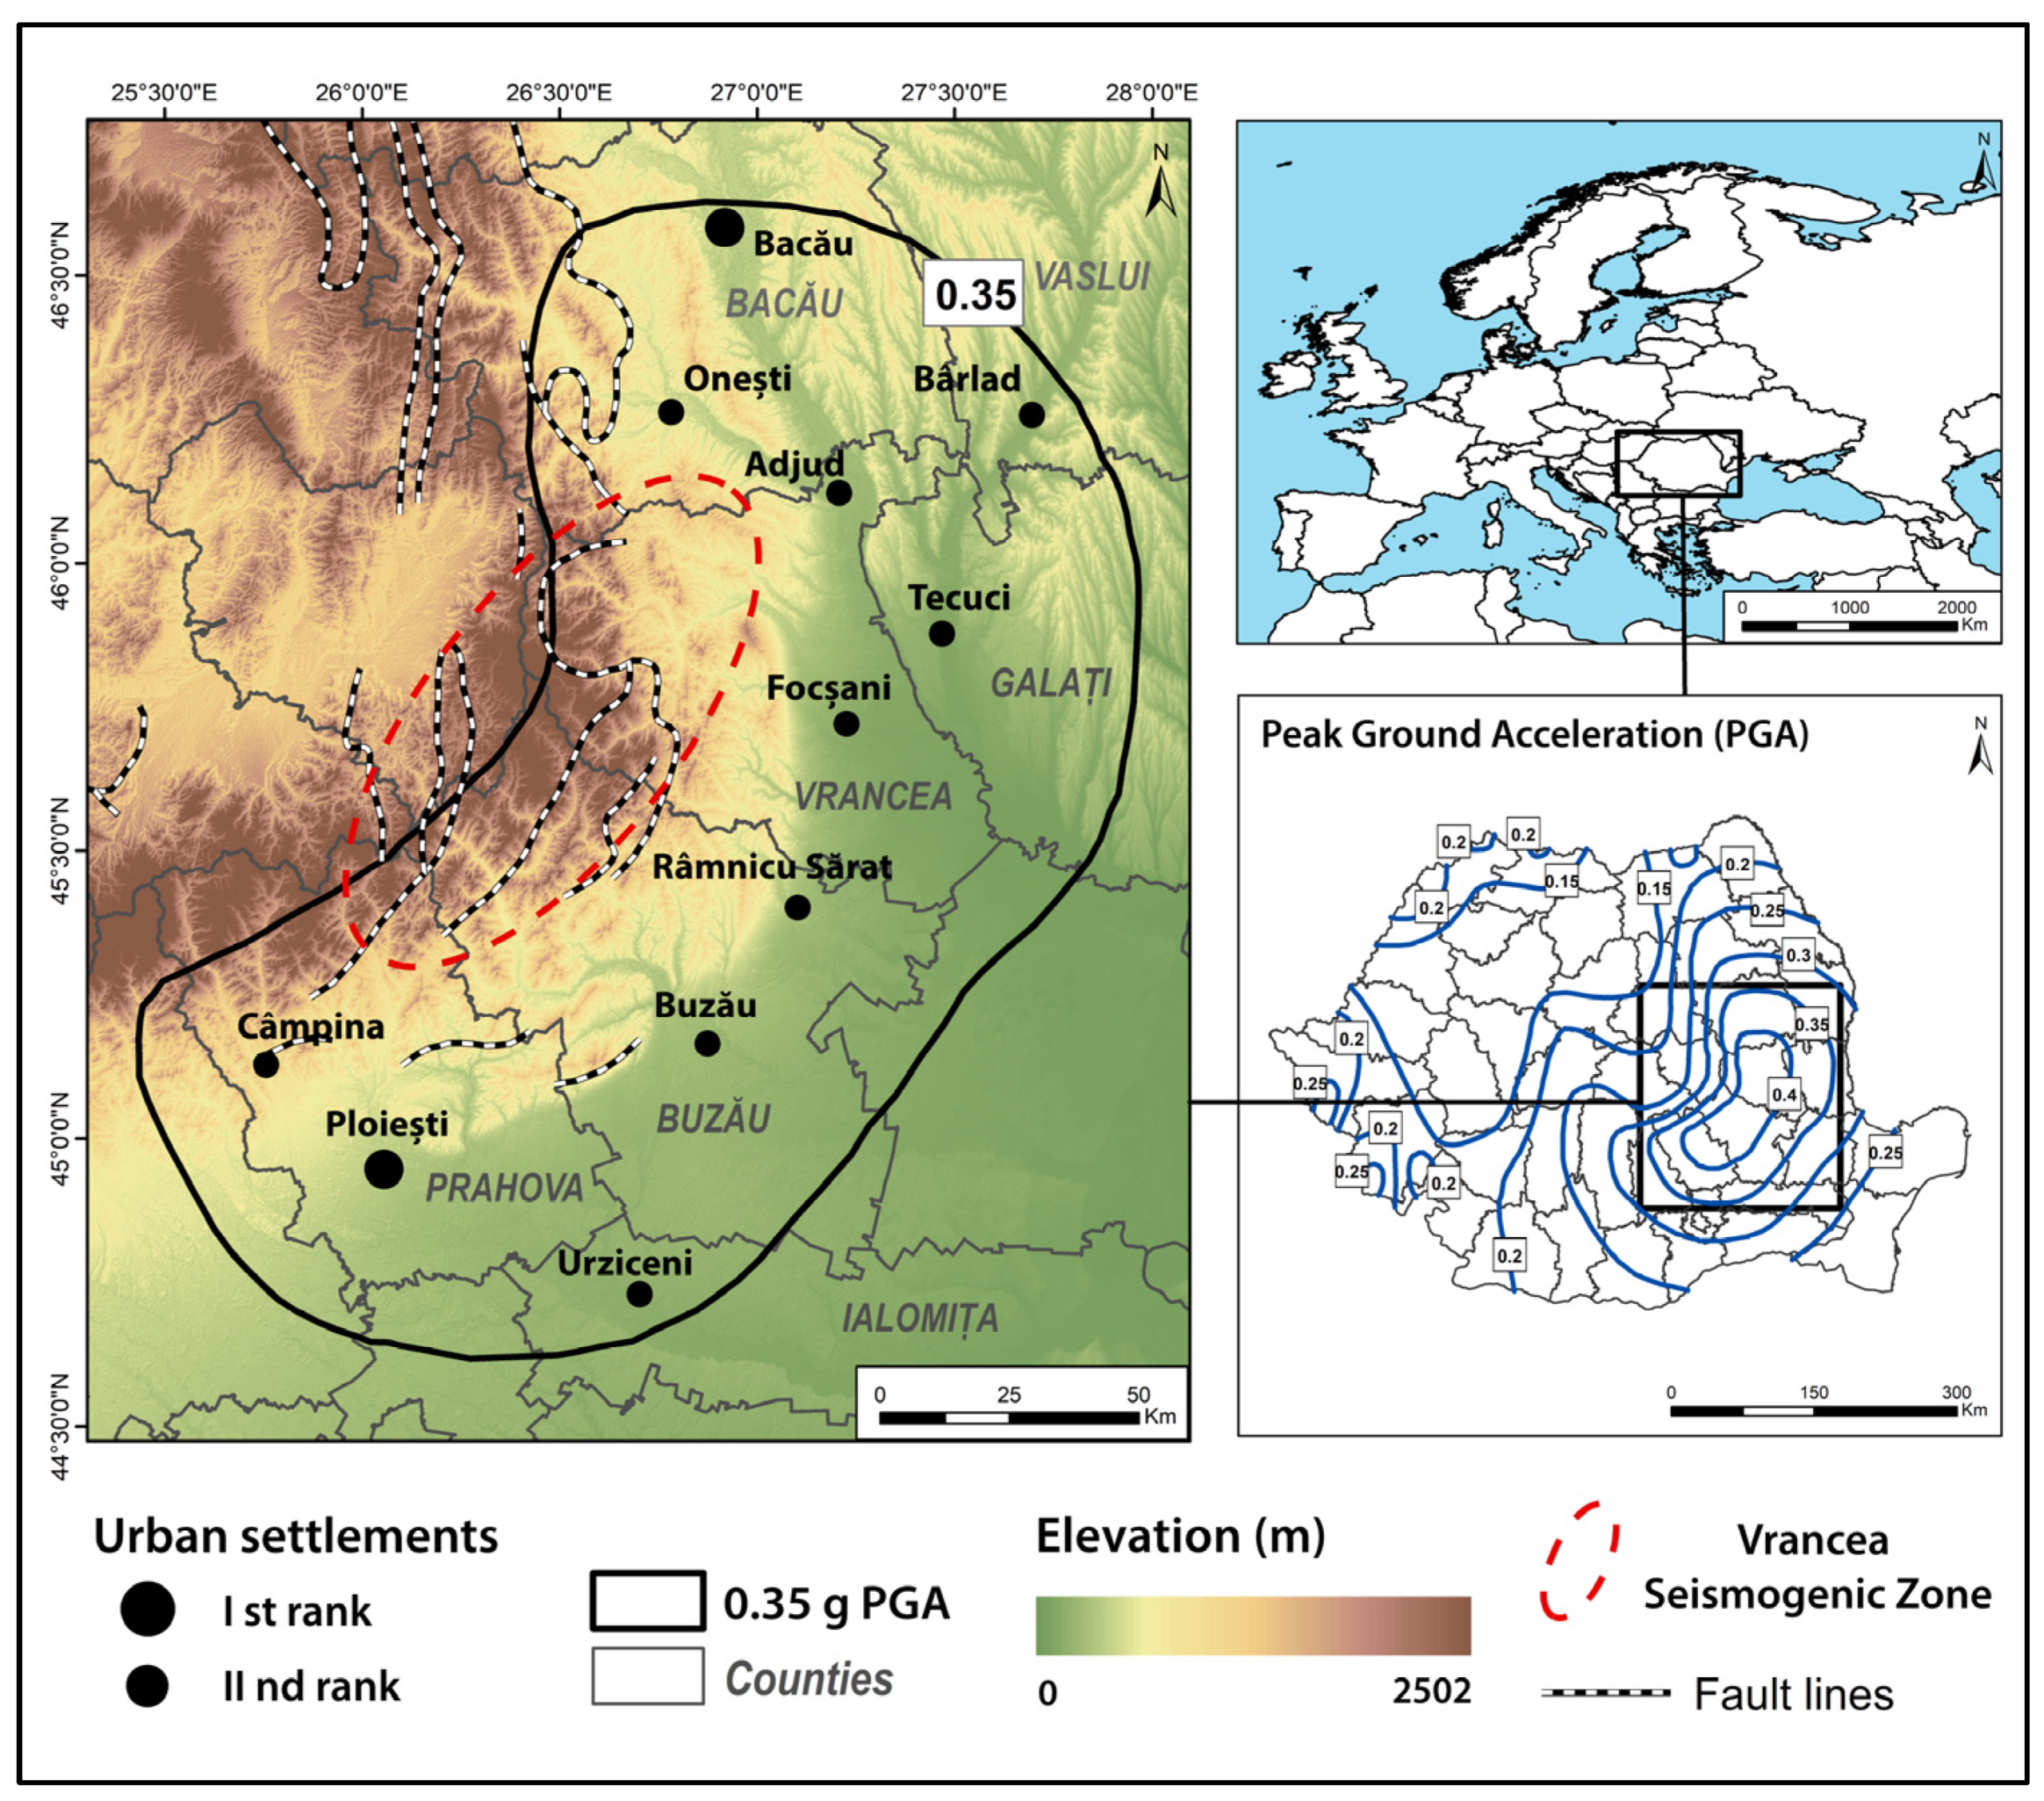
2. Study Area
- Ist rank cities (i.e., Ploiești and Bacău): over 150 thousand inhabitants that have access to the pan-European transport network, benefit from a complex economic profile and high-end medical and education services, and with regional influence areas [59].
- IInd rank towns: 10–150 thousand inhabitants, which are less connected to the pan-European transport network, display more basic economic profiles, have fewer healthcare and education facilities, and have county- or local-scale influence areas [59]).
3. Methodology
3.1. Vulnerability Operationalisation Approach
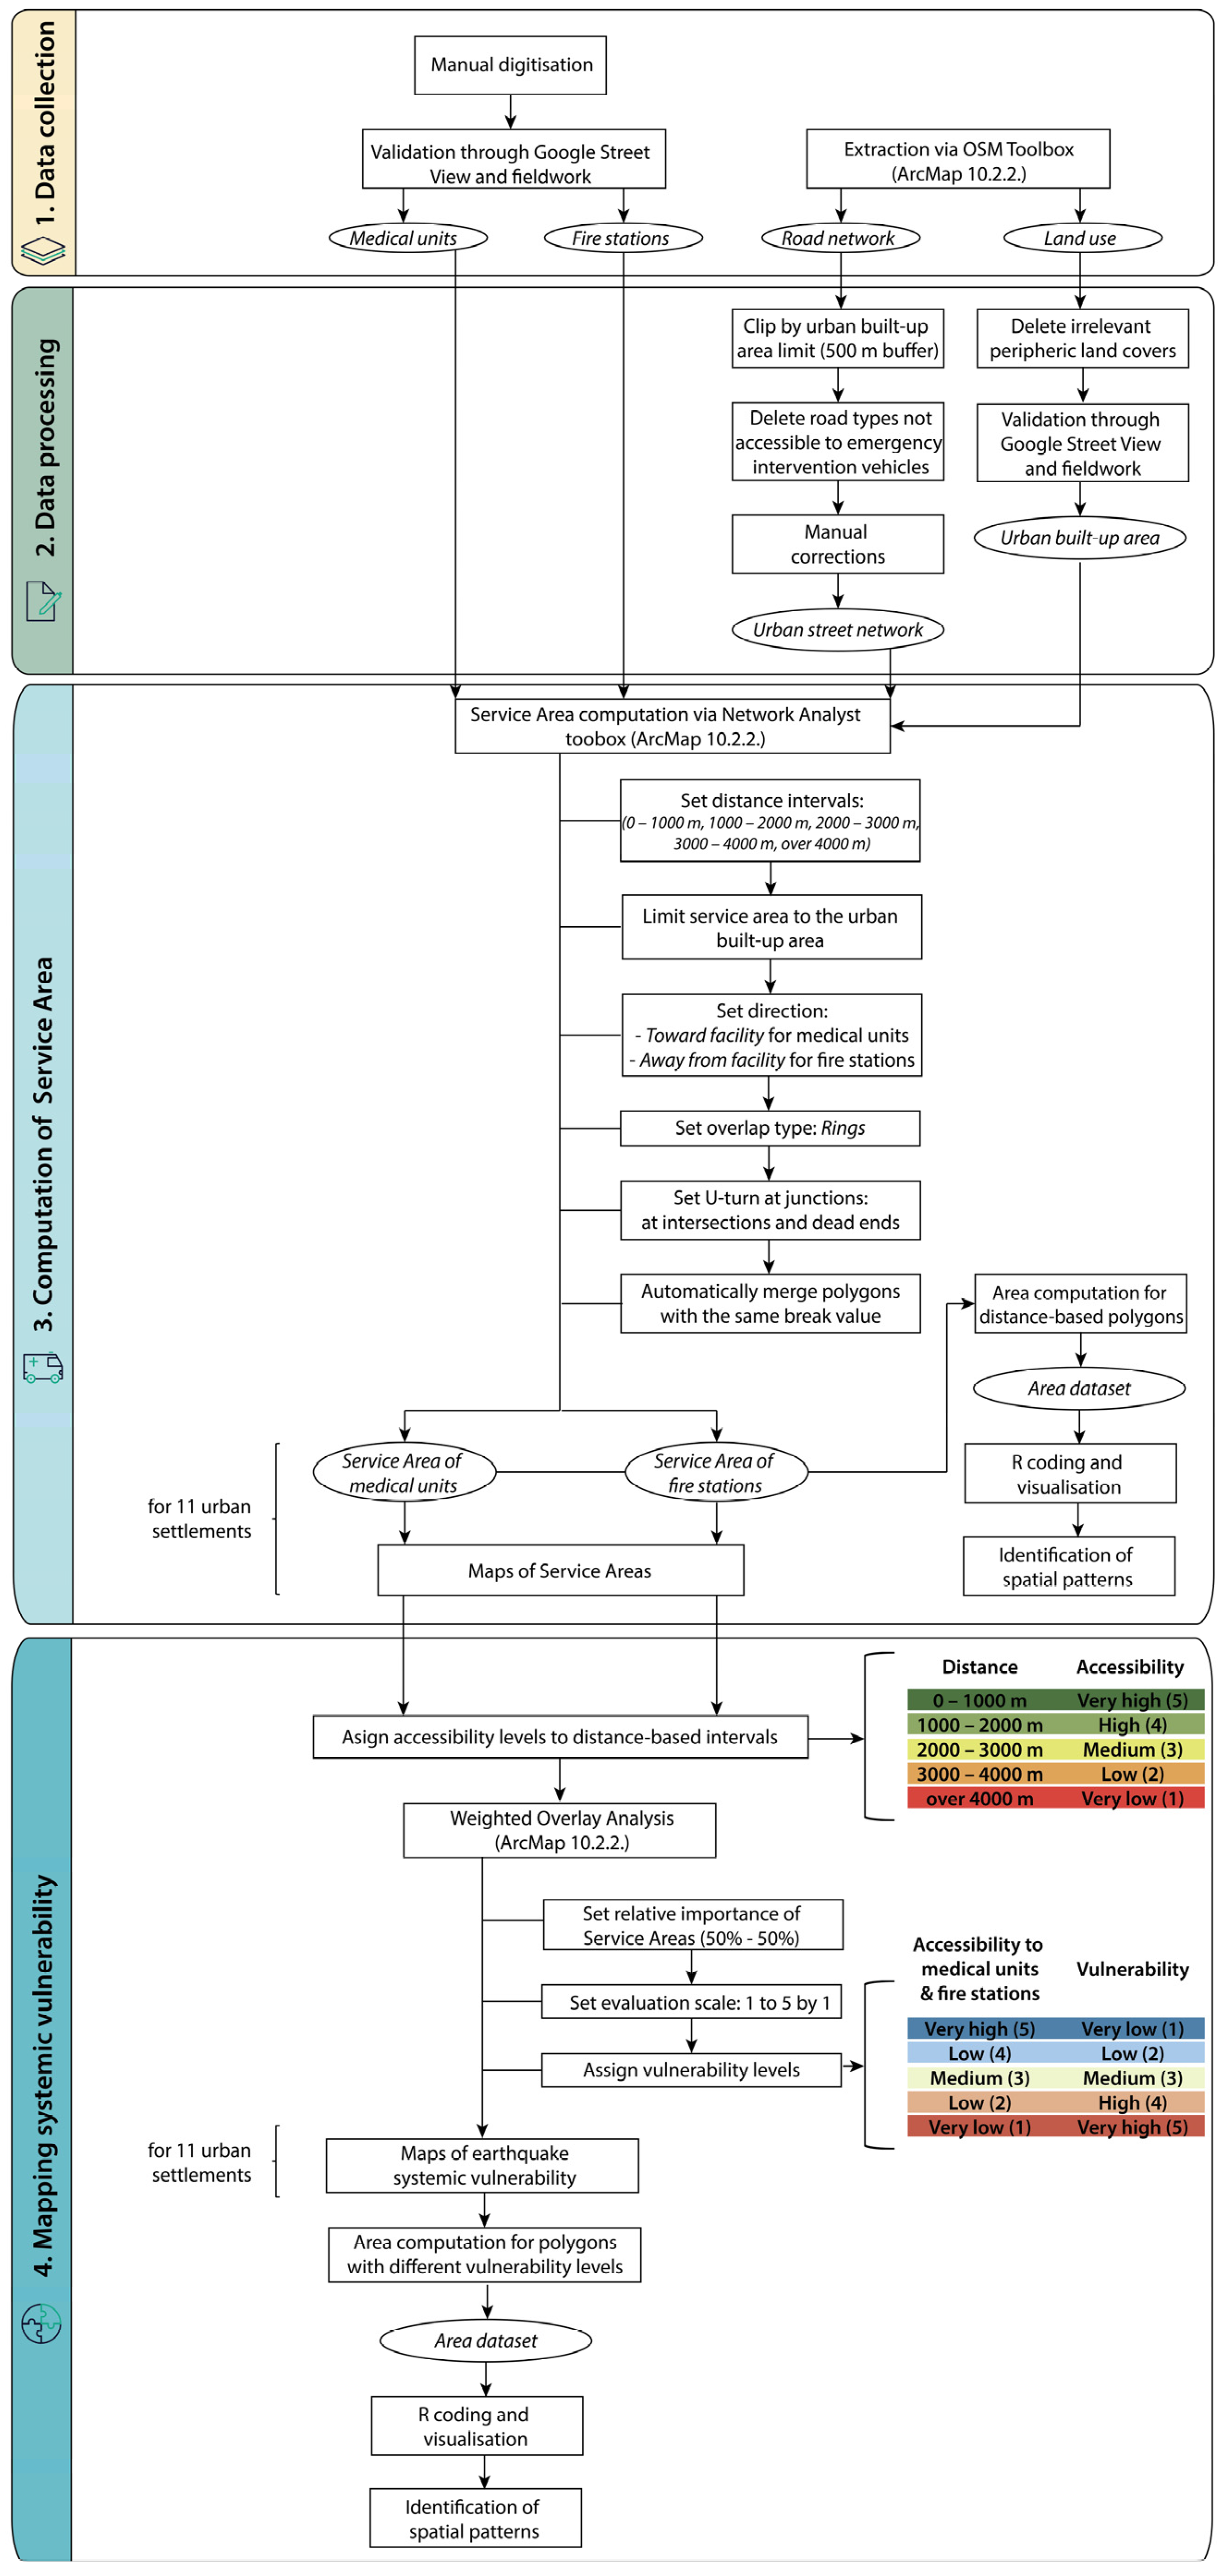
3.2. Data Collection and Processing
3.3. Computation of Service Areas
3.4. Mapping Systemic Vulnerability
4. Results
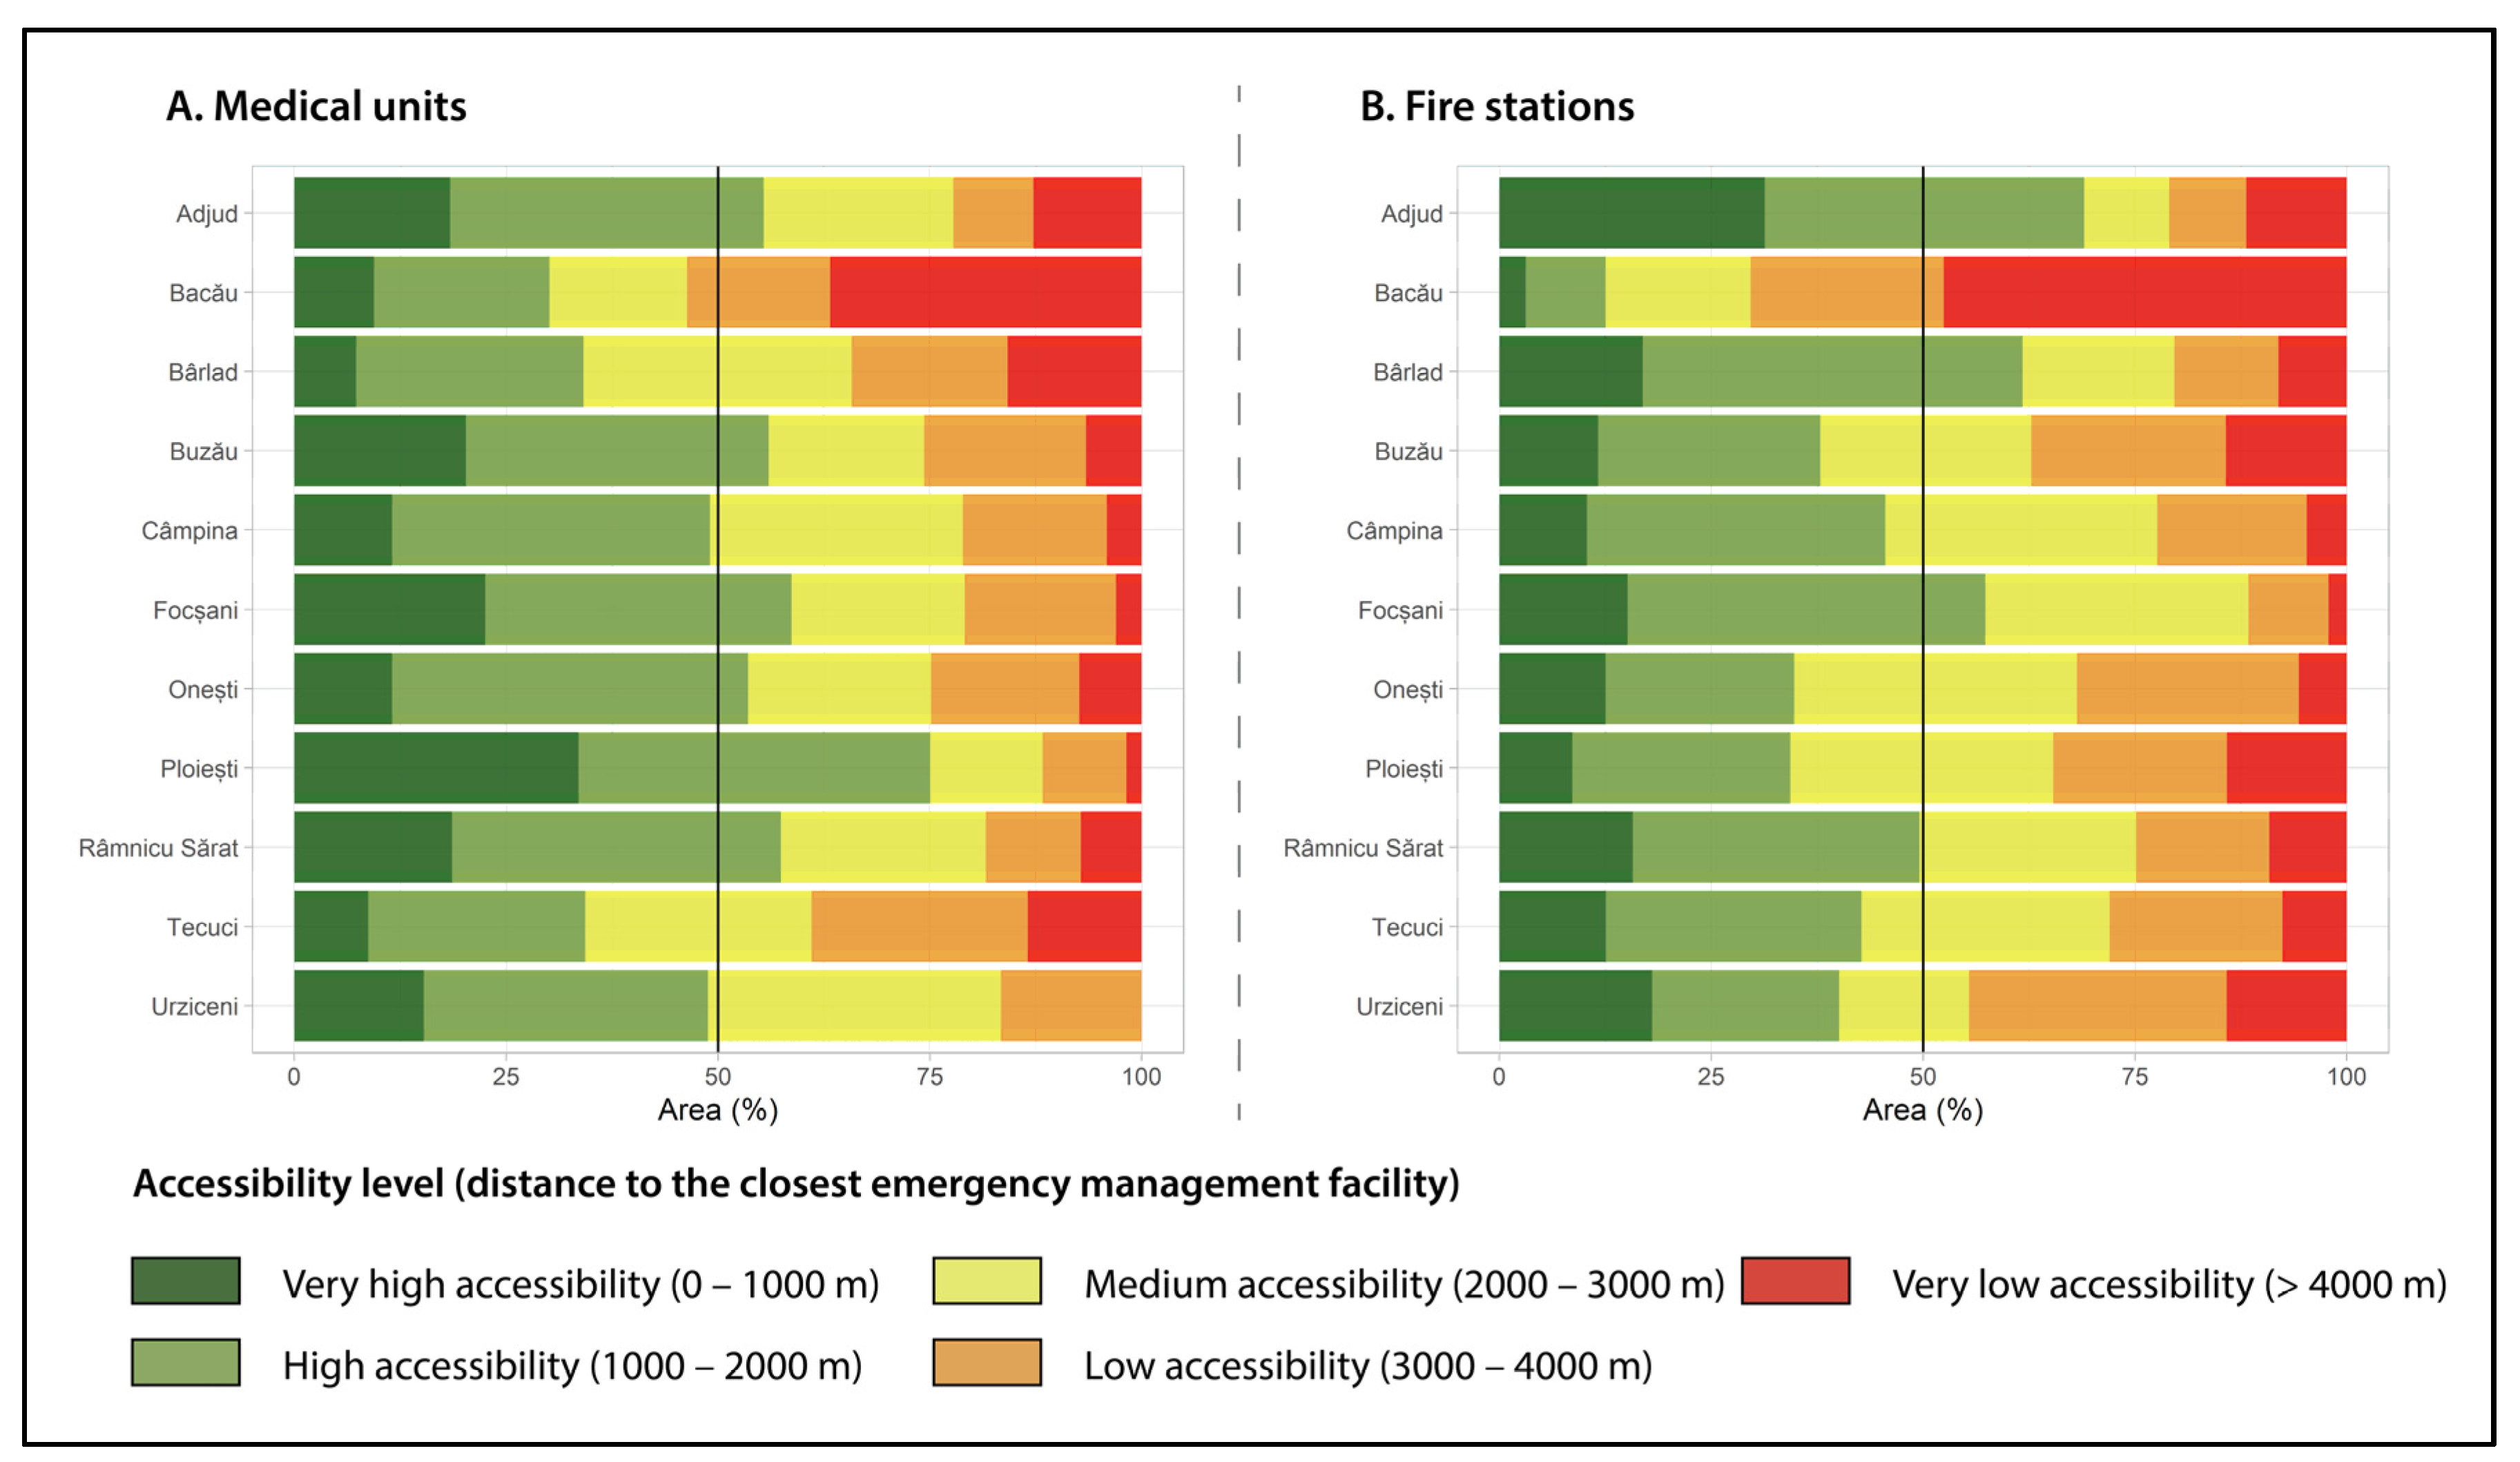
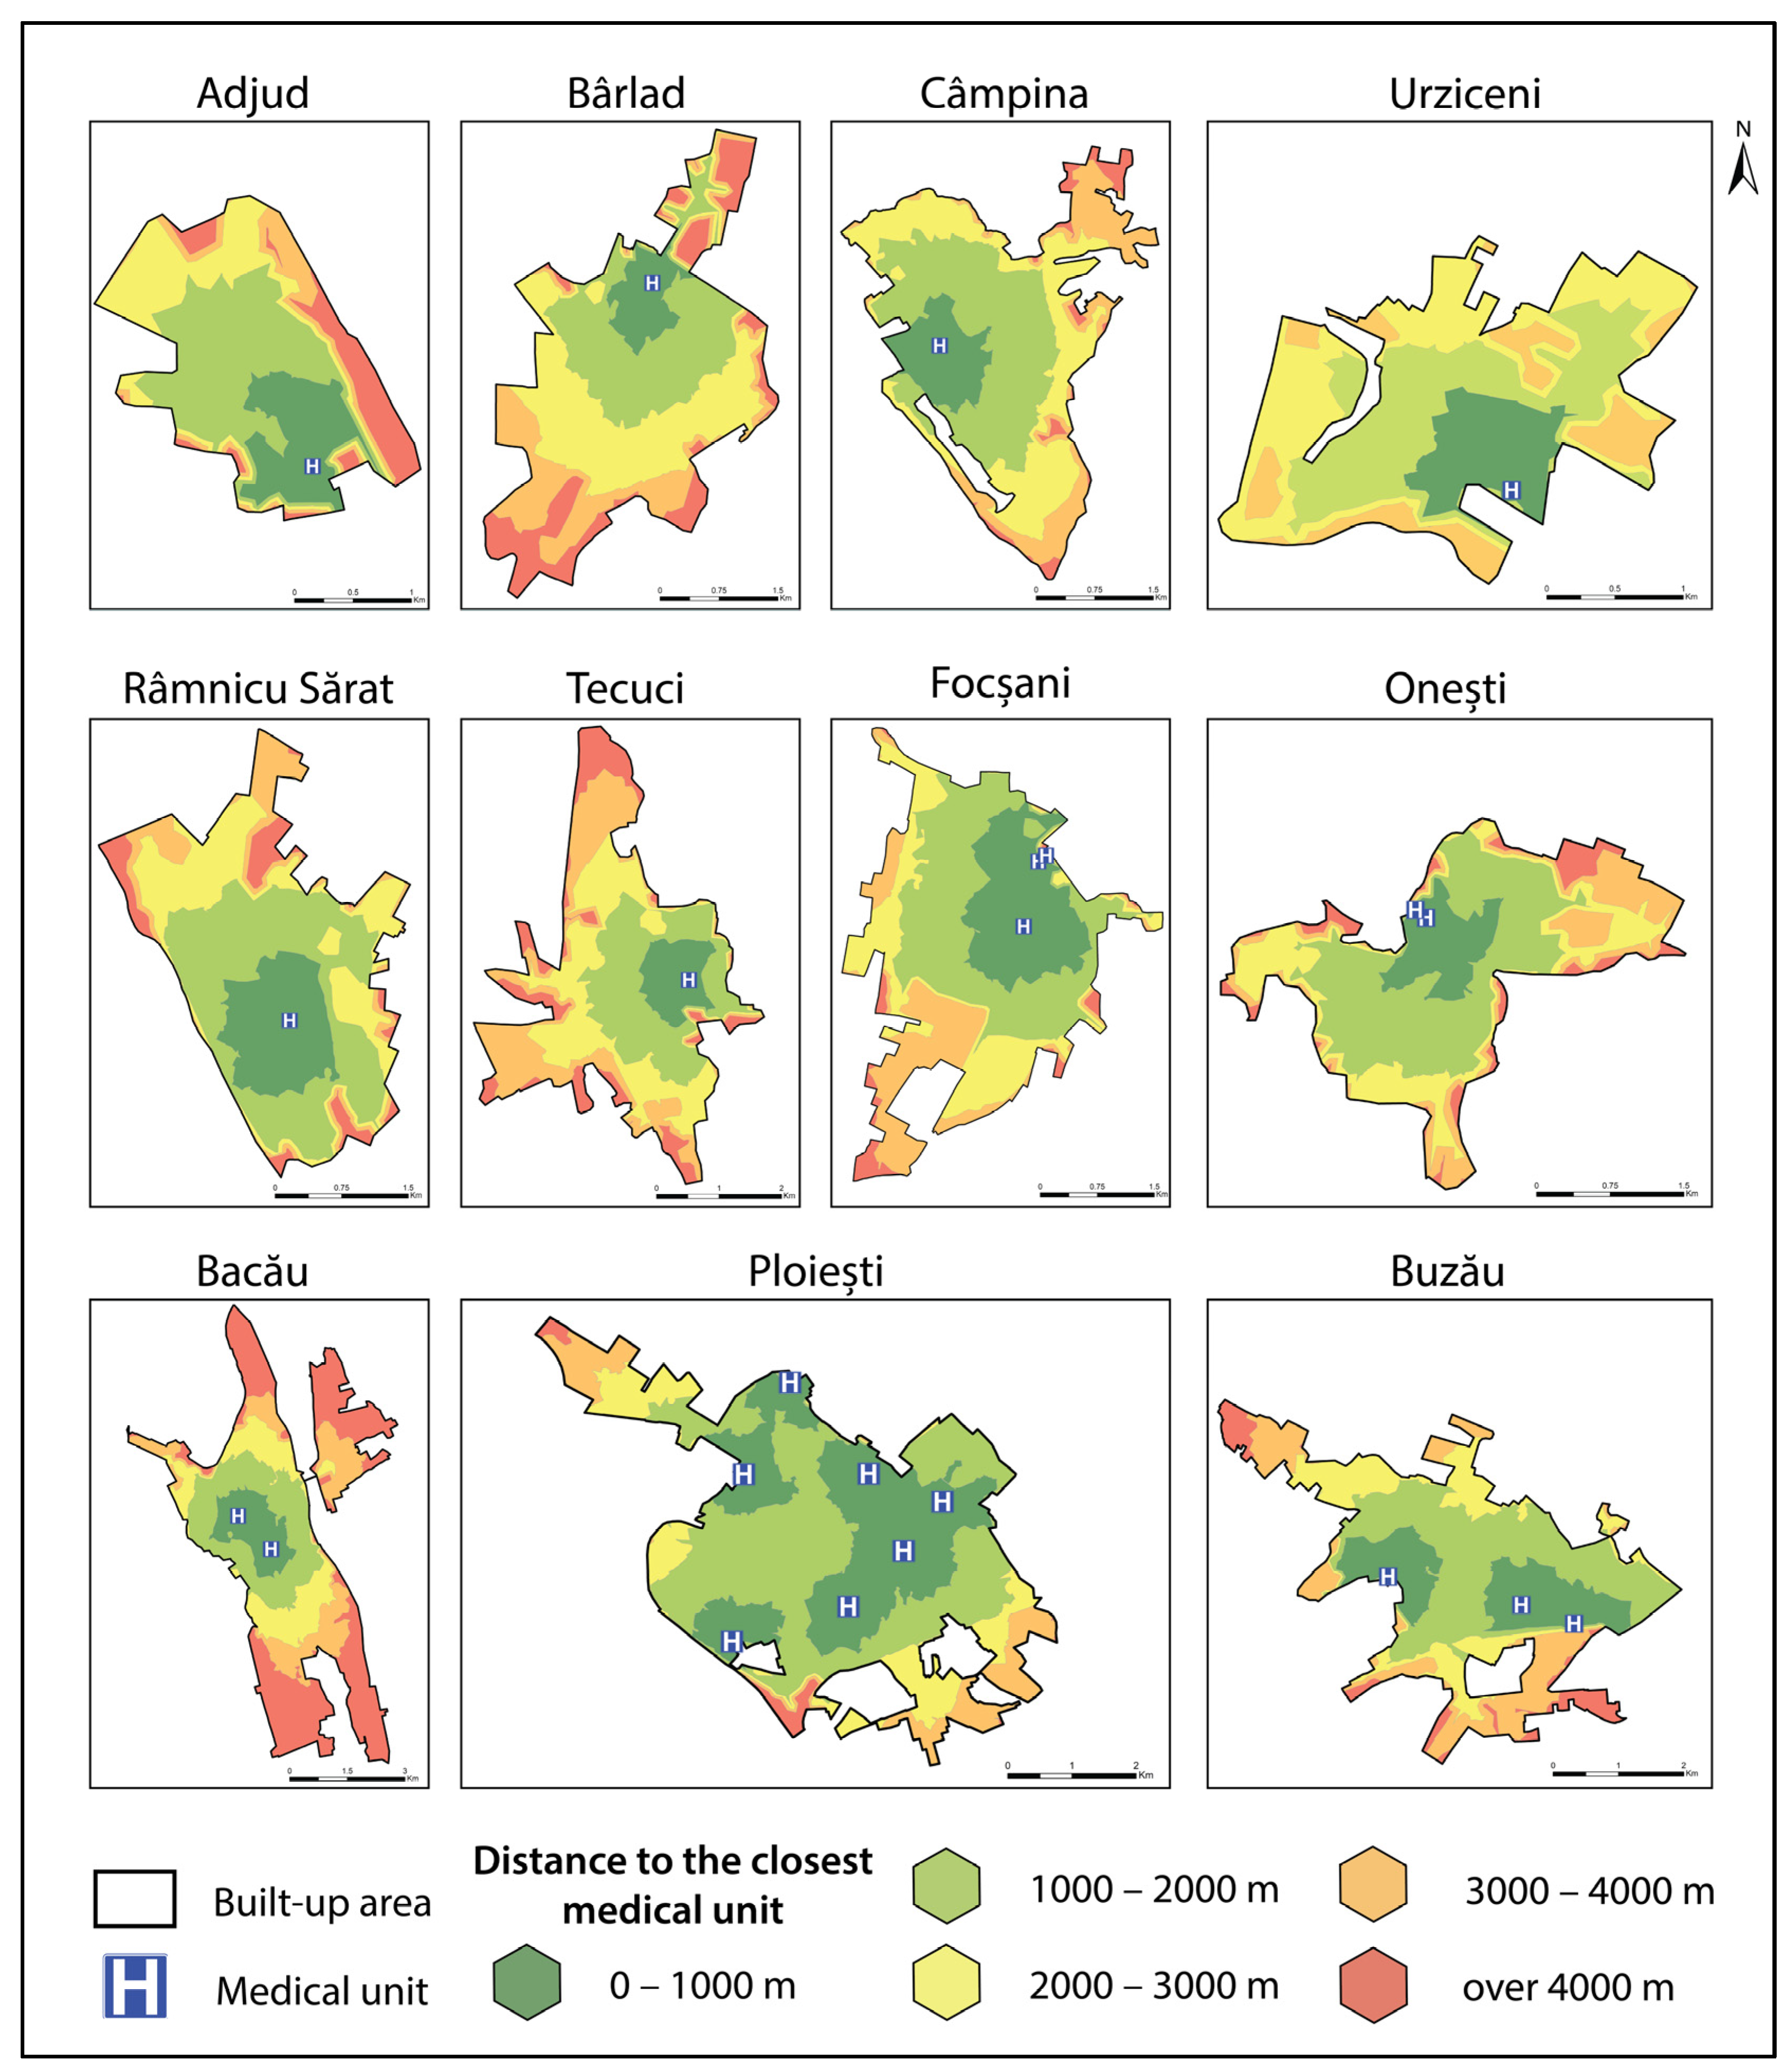
4.1. Accessibility to Medical Units
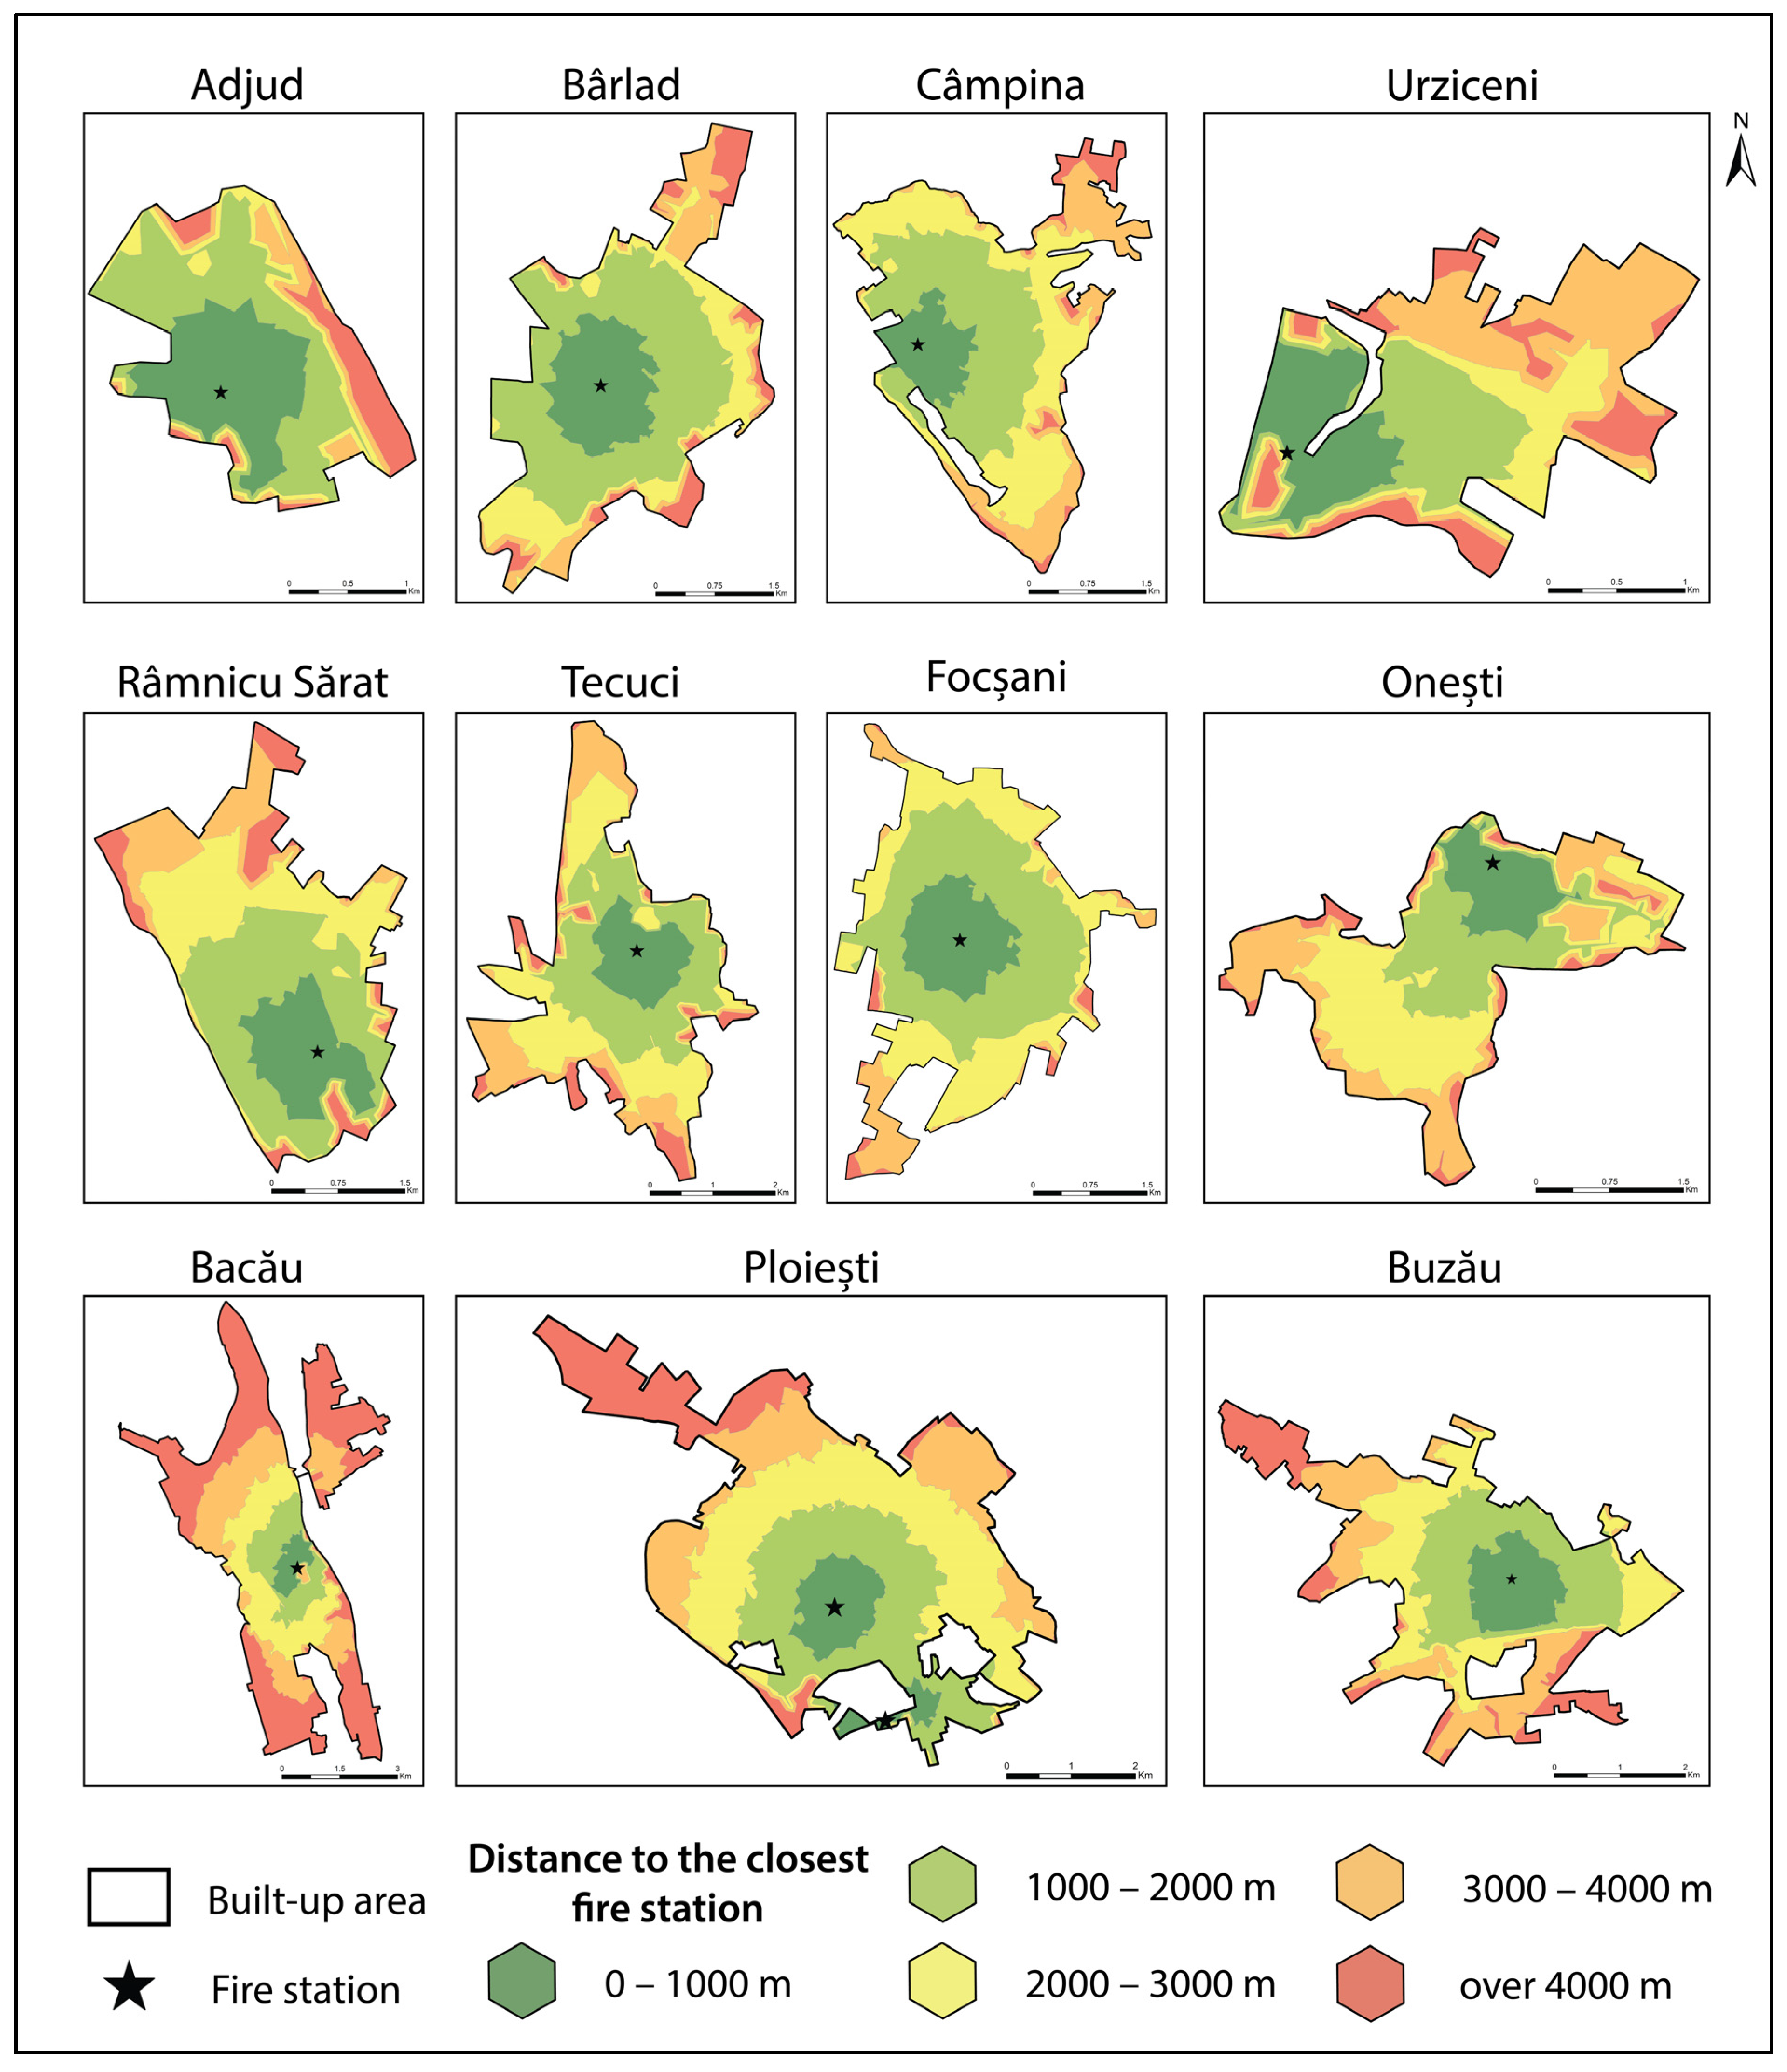
4.2. Accessibility to Fire Stations
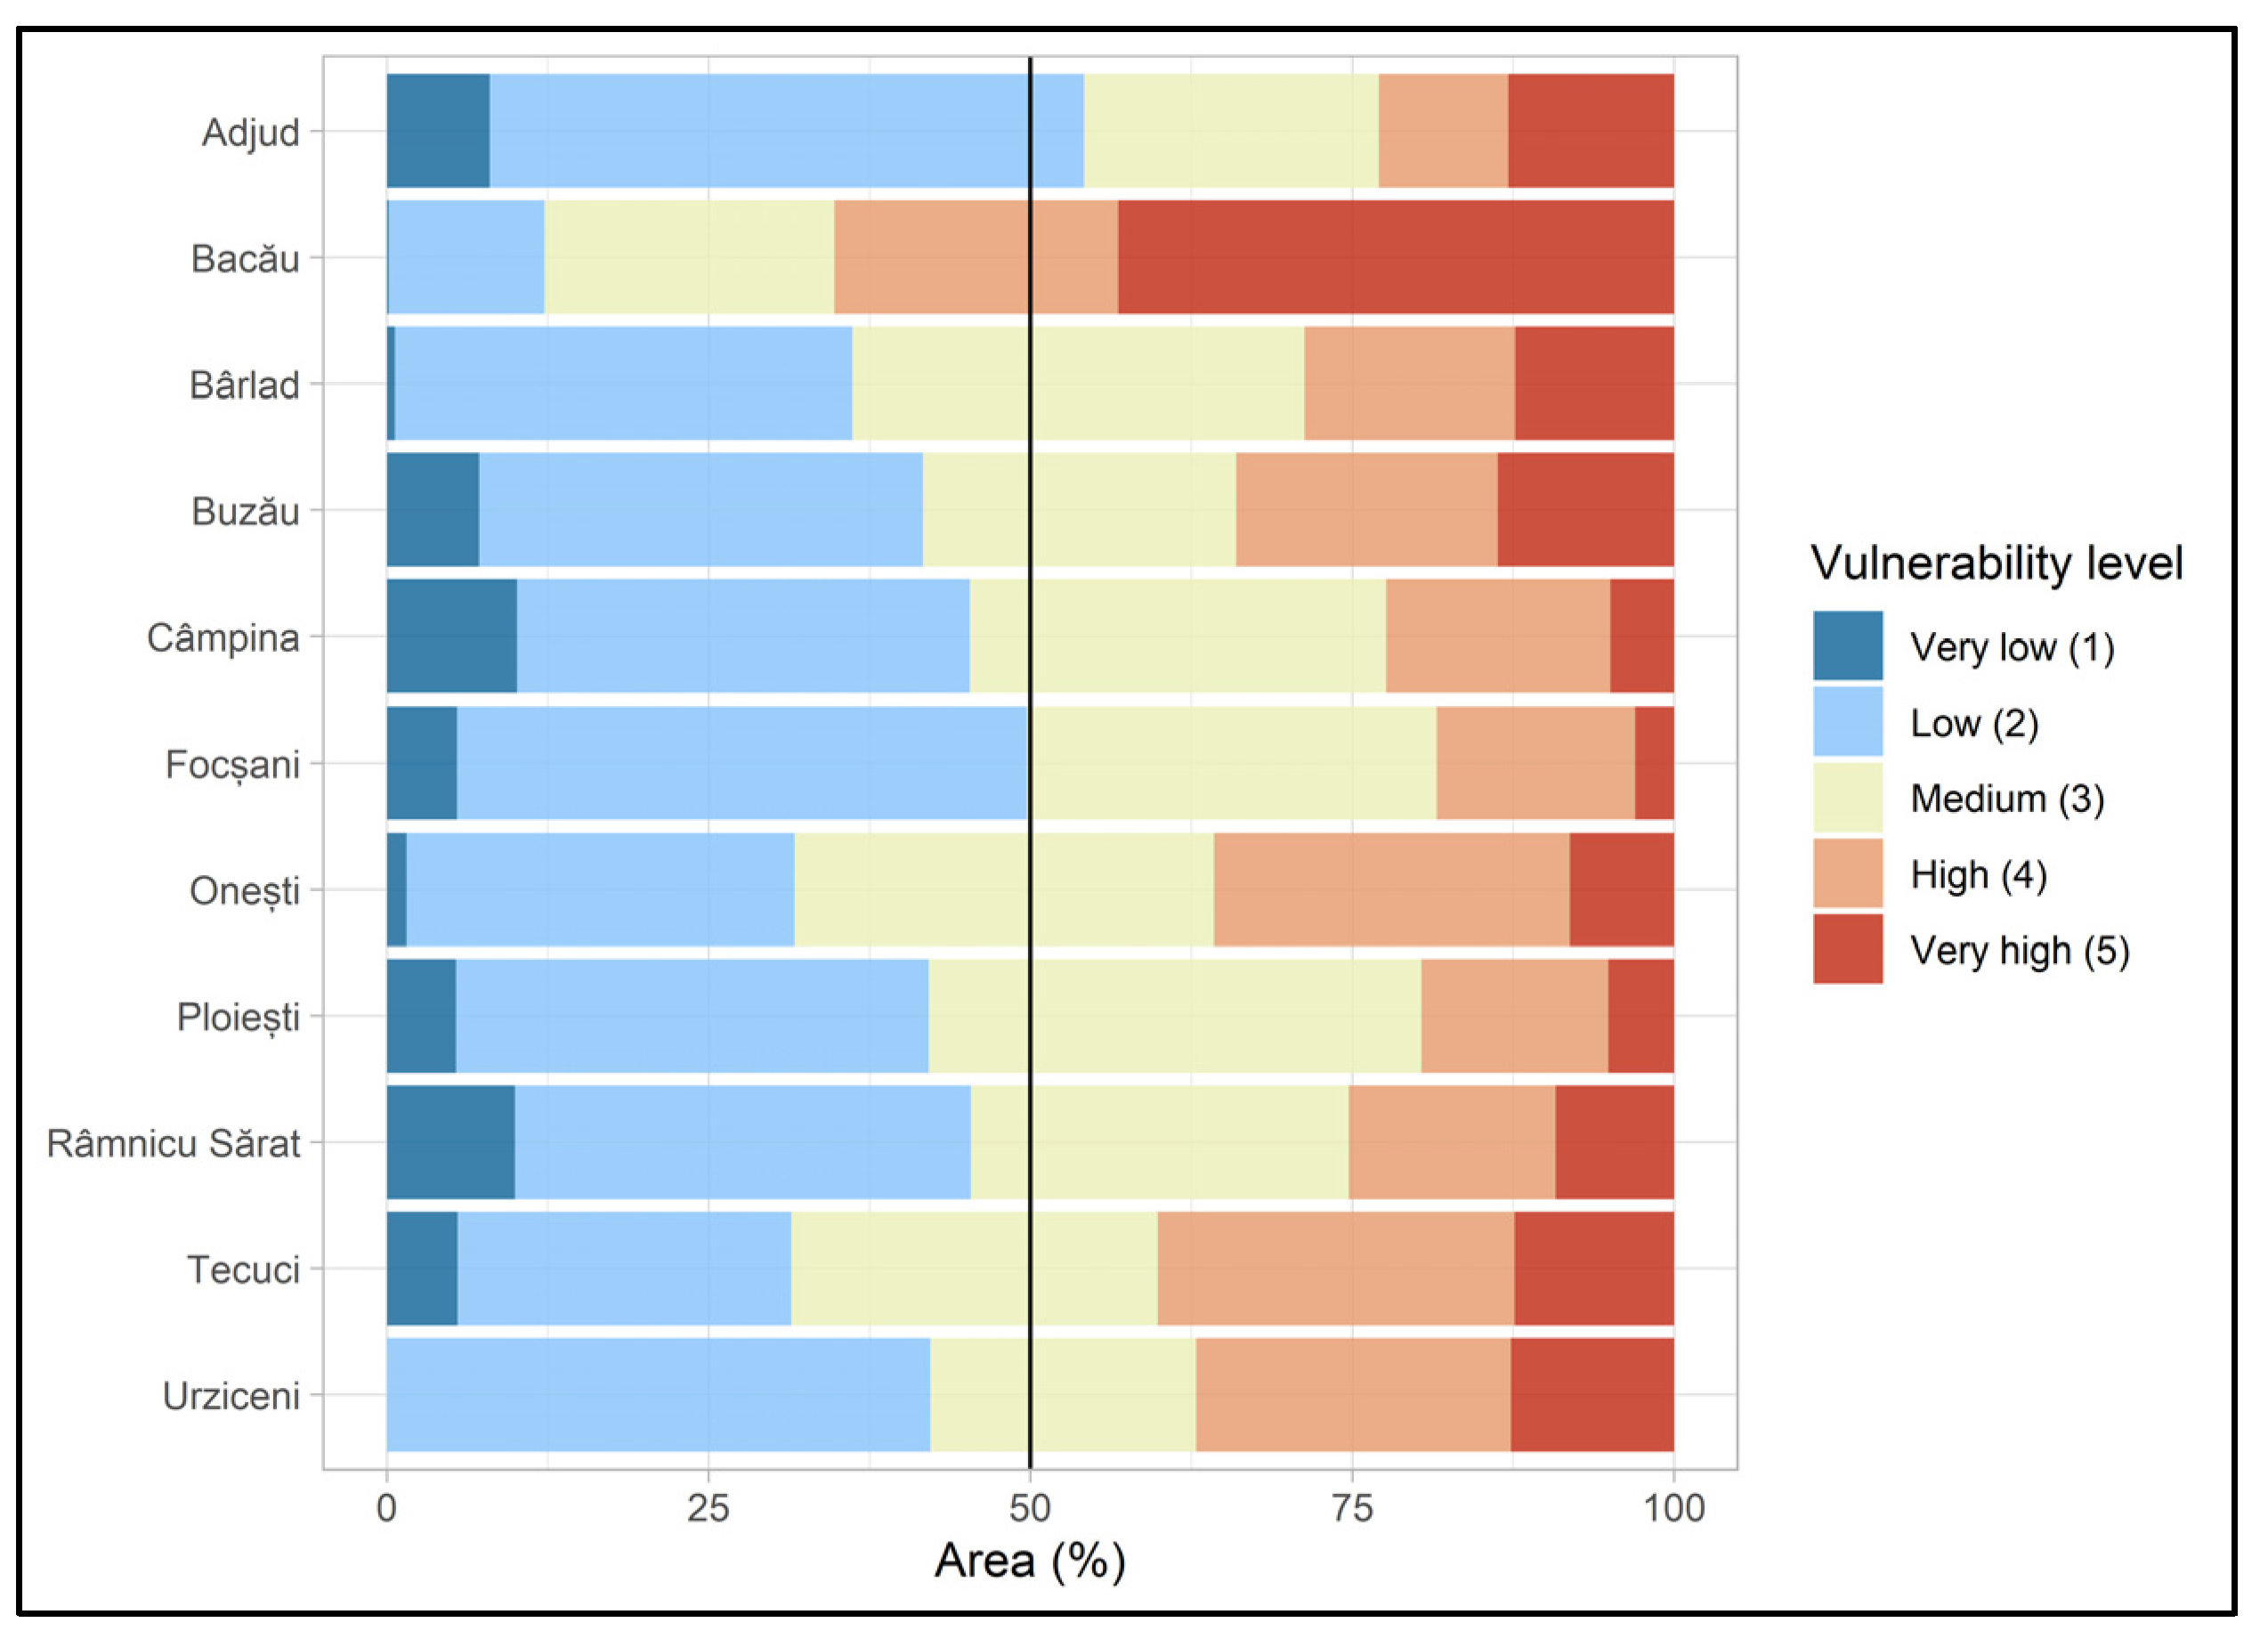
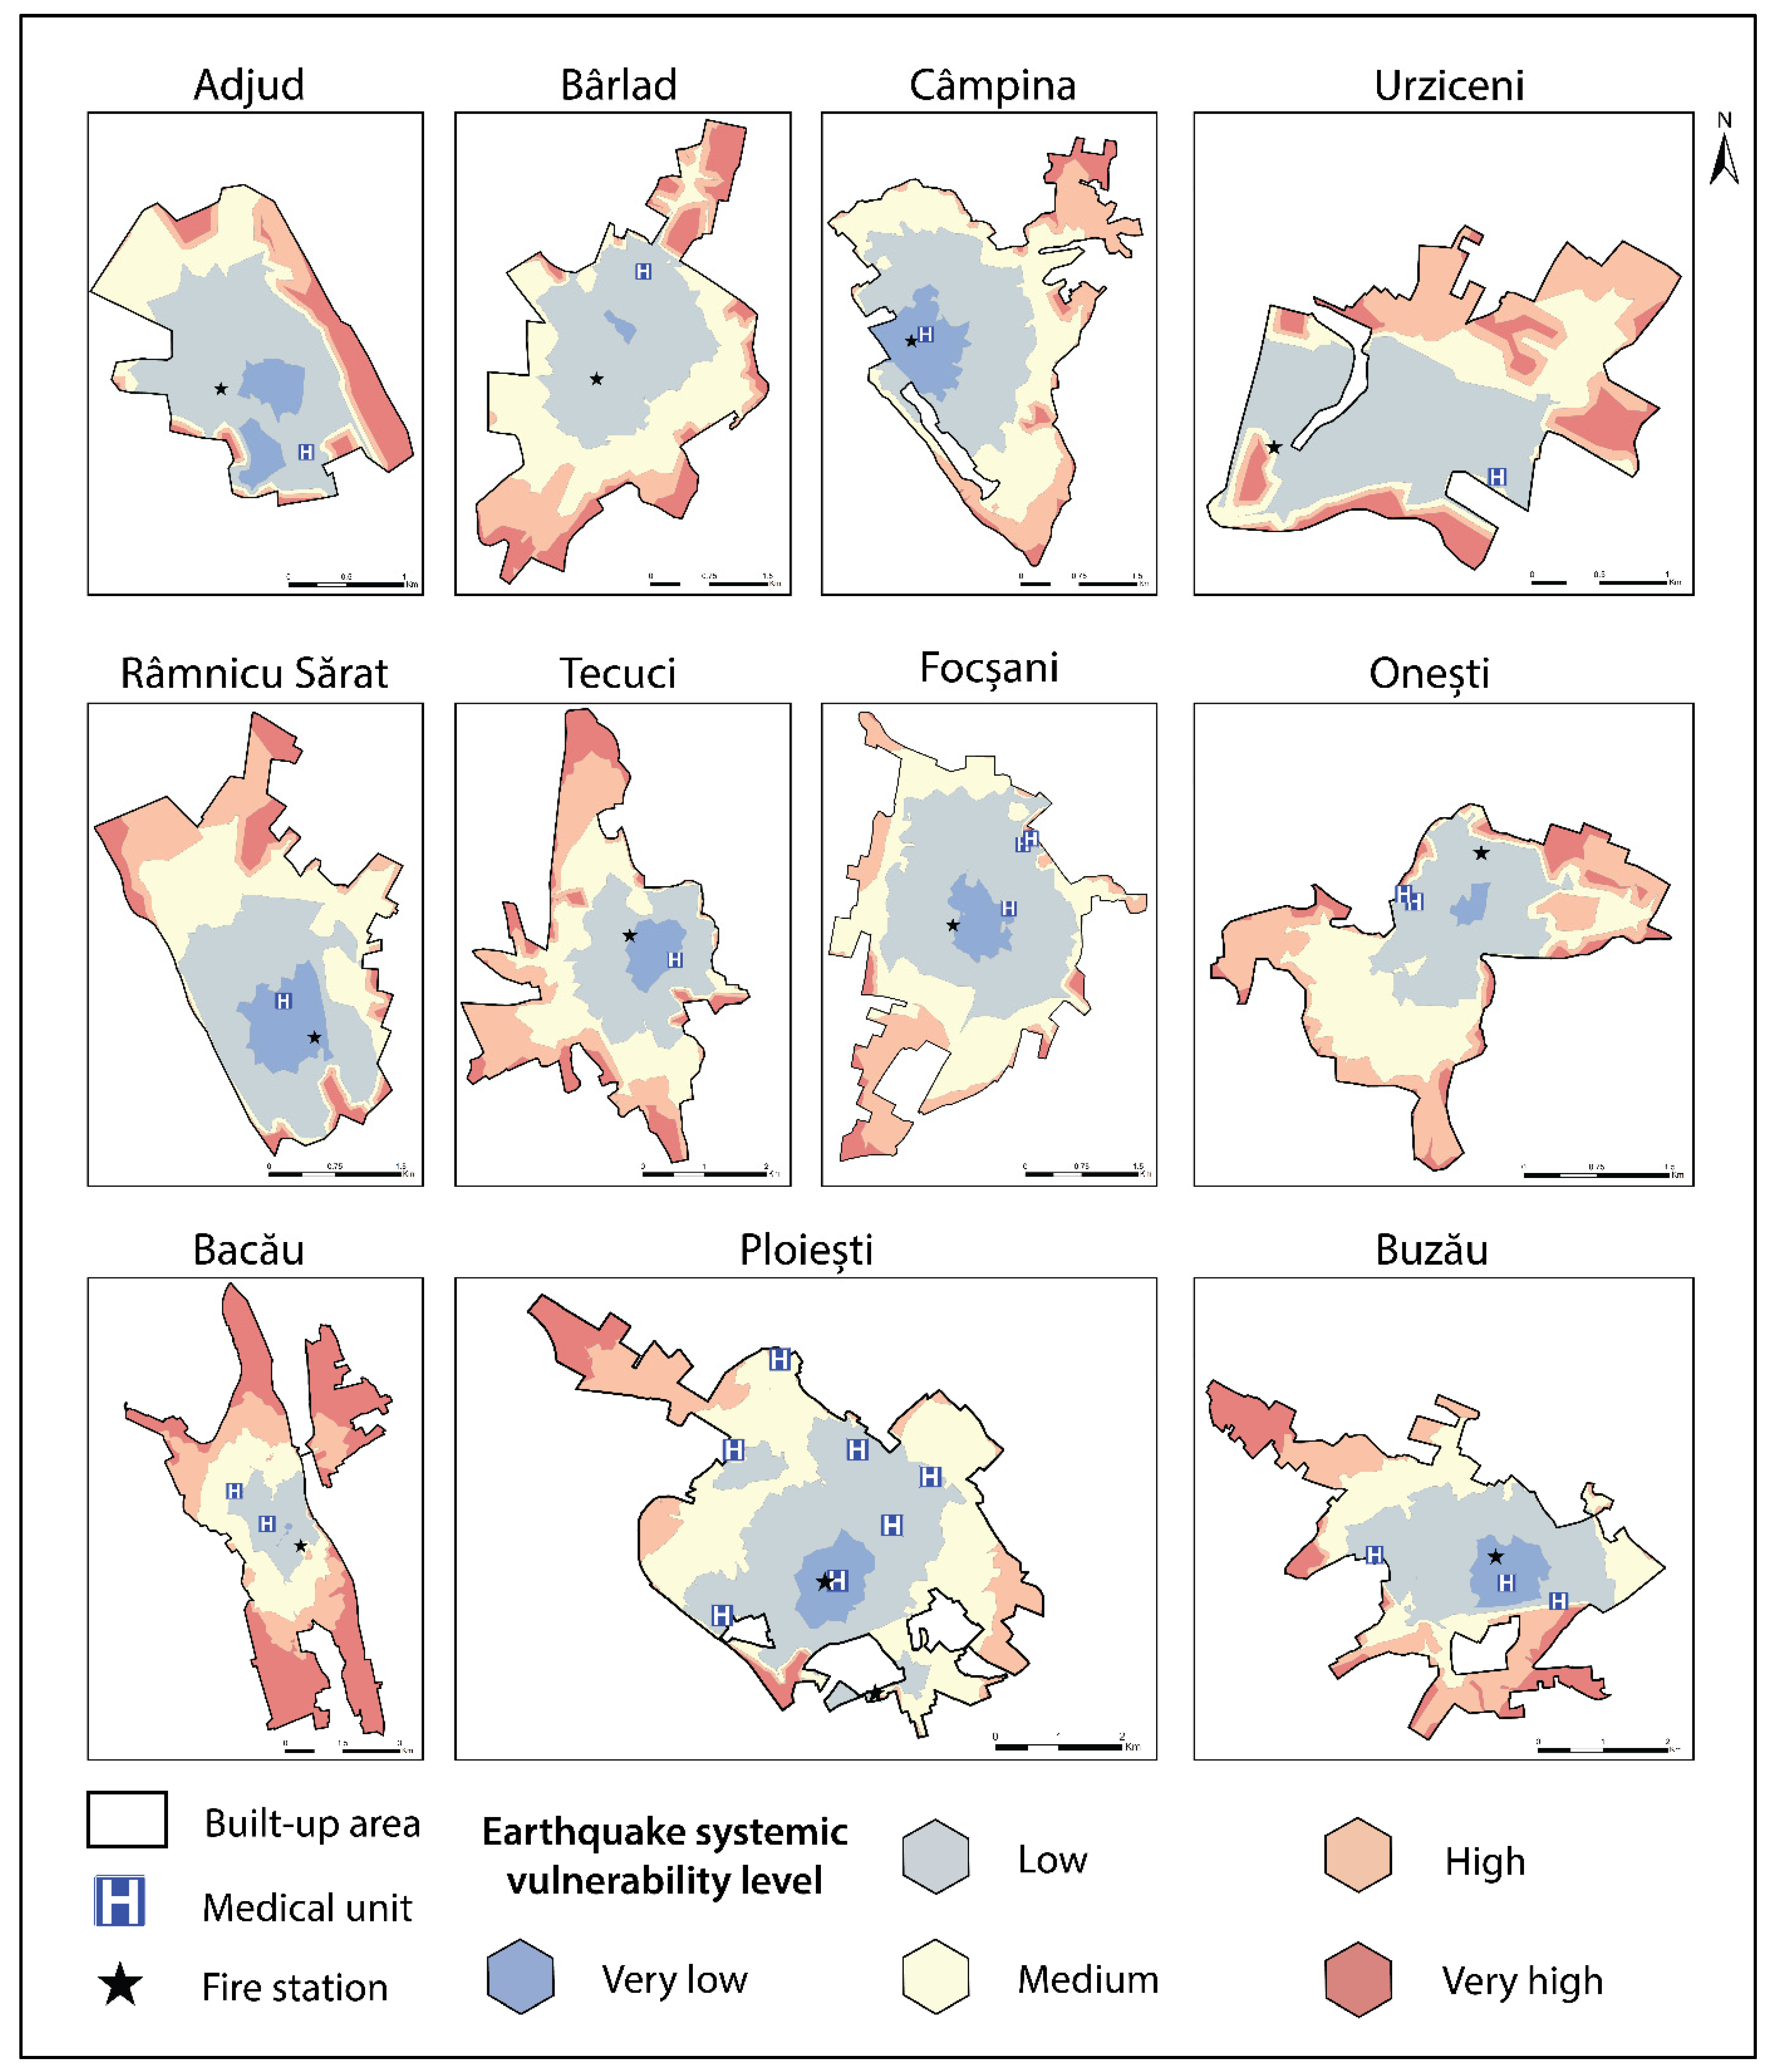
4.3. Patterns of Earthquake Systemic Vulnerability
5. Discussion
- The identification of the most vulnerable neighbourhoods (from a systemic point of view), which is crucial for planning optimal paths for emergency interventions prior to the manifestation of seismic events;
- The identification of urban areas that would benefit from the placement of secondary fire stations and/or new/temporary medical facilities, or even earthquake shelters;
- The identification of urban areas where educational programmes concerning earthquake adjustments, evacuation, and protection should be implemented with priority.
- Caution is advised when interpreting the results since the analysis operates only with one component (i.e., systemic vulnerability) of the multifaceted vulnerability concept. For example, cities with high levels of systemic vulnerability may prove to be less vulnerable to earthquakes overall if their building stock is robust enough to limit damage, hence the injuries and the number of fatalities—“Earthquakes don’t kill, built environment does” [72]—and the need for emergency interventions. Additionally, the study does not account for socio-economic vulnerability, which heavily influences the number of people that may actually need emergency interventions.
- Another limitation relates to the operationalisation of systemic vulnerability relying solely on accessibility and not integrating the capacity and/or functionality of emergency management facilities in a post-seismic context. A major earthquake may cause structural damage to hospital buildings [73] or firefighters’ quarters [74], also threatening the lives of key personnel (i.e., doctors, medical assistants, firefighters, intervention drivers, etc.). Capacity and functionality can still be impaired (even if emergency centres are not directly affected by earthquakes) when the workload prior to the manifestation of the seismic event is too much to manage to begin with, as in the case of increased pressure caused by the COVID-19 pandemic [75,76].
- The methodological framework deliberately leaves out time-dependent variables such as traffic or population exposure, which would require specific datasets that are not available in many developing countries, including Romania. This may be considered a research design-related limitation, which was tackled by tailoring the methodological framework to provide a diversified set of results that can serve as primary information that can be used to improve vulnerability reduction plans at the local and regional scales.
- Finding validation procedures for the results of the presented spatial analysis proves to be a tall order, for which the outcomes of future earthquake events may be used as a comparison. Nevertheless, the results of this research work are not based on scenarios but only aim to provide an overview of the seismic systemic vulnerability patterns specific to the urban settlements in a high-seismicity European area.
- Future research directions should consider the integration of road impairments that may be caused by building collapse with accessibility to emergency management centres. Such approaches have the benefit of increasing the robustness of the results by reducing the uncertainties inherent in vulnerability analyses, but they require datasets that are difficult to acquire, especially in Romania. For instance, cadastral data concerning the position and the horizontal and vertical extent of buildings should be integrated with road taxonomy in order to estimate building collapse, implicitly road functionality impairment. Unfortunately, such data are not readily available, and their collection has to rely on workarounds in the form of building stock datasets obtained via building objects delineation on high-resolution imagery through edge detection algorithms [77].
6. Conclusions
Funding
Data Availability Statement
Acknowledgments
Conflicts of Interest
References
- Rom, A.; Kelman, I. Search without rescue? Evaluating the international search and rescue response to earthquake disasters. BMJ Glob. Health 2020, 5, e002398. [Google Scholar] [CrossRef]
- Tang, P.; Xia, Q.; Wang, Y. Addressing cascading effects of earthquakes in urban areas from network perspective to improve disaster mitigation. Int. J. Disaster Risk Reduct. 2019, 35, 101065. [Google Scholar] [CrossRef]
- Brunner, M.I.; Slater, L.; Tallaksen, L.M.; Clark, M. Challenges in modeling and predicting floods and droughts: A review. WIREs Water 2021, 8, e1520. [Google Scholar] [CrossRef]
- Huang, D.; Wang, S.; Liu, Z. A systematic review of prediction methods for emergency management. Int. J. Disaster Risk Reduct. 2021, 62, 102412. [Google Scholar] [CrossRef]
- Pan, S.-T.; Cheng, Y.-Y.; Wu, C.-L.; Chang, R.H.; Chiu, C.; Foo, N.-P.; Chen, P.-T.; Wang, T.-Y.; Chen, L.-H.; Chen, C.-J.; et al. Association of injury pattern and entrapment location inside damaged buildings in the 2016 Taiwan earthquake. J. Formos. Med. Assoc. 2019, 118, 311–323. [Google Scholar] [CrossRef]
- Rahman, S.; Bayu, M.; Hutagalung, Z. Medical Emergency and Public Health Response in Disaster Settings: A Case Series of Pidie Jaya, Lombok and Palu Earthquakes. Bp. Int. Res. Exact Sci. BirEx J. 2020, 2, 264–267. [Google Scholar] [CrossRef]
- Wei, B.; Nie, G.; Su, G.; Guo, X. Risk assessment of people trapped in earthquake disasters based on a single building: A case study in Xichang city, Sichuan Province, China. Geomat. Nat. Hazards Risk 2022, 13, 167–192. [Google Scholar] [CrossRef]
- Alexander, D.E. Panic during Earthquakes and Its Urban and Cultural Contexts. Built Environ. 1995, 21, 171–182. [Google Scholar]
- Ergen, E.; Kaya, O.; Yılmaz, Ö.; Özdeş, H.U.; Batur, Ö.C.; Karaman, S.; Güzel, İ.; Aslantürk, O.; Karakaplan, M. Which is more dangerous, earthquake, or the panic? Evaluation of the 24 January 2020 Elazig/Türkiye earthquake related musculoskeletal injuries. Ulus Travma Acil Cerrahi Derg 2022, 28, 1335–1339. [Google Scholar] [CrossRef] [PubMed]
- Yonson, R.; Noy, I.; Ivory, V.C.; Bowie, C. Earthquake-induced transportation disruption and economic performance: The experience of Christchurch, New Zealand. J. Transp. Geogr. 2020, 88, 102823. [Google Scholar] [CrossRef]
- Butler, D. Focusing Events in the Early Twentieth Century: A Hurricane, Two Earthquakes, and a Pandemic. In Emergency Management; Routledge: London, UK, 2019; pp. 11–48. [Google Scholar] [CrossRef]
- Himoto, K. Comparative Analysis of Post-Earthquake Fires in Japan from 1995 to 2017. Fire Technol. 2019, 55, 935–961. [Google Scholar] [CrossRef]
- Kawamura, S.; Kawajiri, S.; Hirose, W.; Watanabe, T. Slope failures/landslides over a wide area in the 2018 Hokkaido Eastern Iburi earthquake. Soils Found. 2019, 59, 2376–2395. [Google Scholar] [CrossRef]
- Dahlquist, M.P.; West, A.J. Initiation and Runout of Post-Seismic Debris Flows: Insights From the 2015 Gorkha Earthquake. Geophys. Res. Lett. 2019, 46, 9658–9668. [Google Scholar] [CrossRef]
- Wang, F.; Fan, X.; Yunus, A.P.; Subramanian, S.S.; Alonso-Rodriguez, A.; Dai, L.; Xu, Q.; Huang, R. Coseismic landslides triggered by the 2018 Hokkaido, Japan (Mw 6.6), earthquake: Spatial distribution, controlling factors, and possible failure mechanism. Landslides 2019, 16, 1551–1566. [Google Scholar] [CrossRef]
- Ghobarah, A.; Saatcioglu, M.; Nistor, I. The impact of the 26 December 2004 earthquake and tsunami on structures and infrastructure. Eng. Struct. 2006, 28, 312–326. [Google Scholar] [CrossRef]
- Mori, N.; Takahashi, T.; Yasuda, T.; Yanagisawa, H. Survey of 2011 Tohoku earthquake tsunami inundation and run-up. Geophys. Res. Lett. 2011, 38, 1–6. [Google Scholar] [CrossRef]
- Widiyanto, W.; Santoso, P.B.; Hsiao, S.-C.; Imananta, R.T. Post-event field survey of 28 September 2018 Sulawesi earthquake and tsunami. Nat. Hazards Earth Syst. Sci. 2019, 19, 2781–2794. [Google Scholar] [CrossRef] [Green Version]
- Hou, L.; Shi, P. Haiti 2010 earthquake—How to explain such huge losses? Int. J. Disaster Risk Sci. 2011, 2, 25–33. [Google Scholar] [CrossRef] [Green Version]
- UNDP. COVID-19: Looming Crisis in Developing Countries Threatens to Devastate Economies and Ramp Up Inequality. 2020. Available online: https://bit.ly/2EuoEqx. (accessed on 14 January 2023).
- Silva, V.; Paul, N. Potential impact of earthquakes during the 2020 COVID-19 pandemic. Earthq. Spectra 2020, 37, 73–94. [Google Scholar] [CrossRef]
- Rashed, T.; Weeks, J. Assessing vulnerability to earthquake hazards through spatial multicriteria analysis of urban areas. Int. J. Geogr. Inf. Sci. 2003, 17, 547–576. [Google Scholar] [CrossRef]
- Pitilakis, K.; Argyroudis, S.; Kakderi, K.; Argyroui, A. Systemic Seismic Vulnerability and Risk Analysis for Buildings, Lifeline Networks and Infrastructures Safety Gain; Publications Office of the European Union: Luxembourg, 2013. [Google Scholar] [CrossRef]
- Armaş, I. Multi-criteria vulnerability analysis to earthquake hazard of Bucharest, Romania. Nat. Hazards 2012, 63, 1129–1156. [Google Scholar] [CrossRef]
- Rezaie, F.; Panahi, M. GIS modeling of seismic vulnerability of residential fabrics considering geotechnical, structural, social and physical distance indicators in Tehran using multi-criteria decision-making techniques. Nat. Hazards Earth Syst. Sci. 2015, 15, 461–474. [Google Scholar] [CrossRef] [Green Version]
- Banica, A.; Rosu, L.; Muntele, I.; Grozavu, A. Towards Urban Resilience: A Multi-Criteria Analysis of Seismic Vulnerability in Iasi City (Romania). Sustainability 2017, 9, 270. [Google Scholar] [CrossRef] [Green Version]
- Han, J.; Kim, J.; Park, S.; Son, S.; Ryu, M. Seismic Vulnerability Assessment and Mapping of Gyeongju, South Korea using Frequency Ratio, Decision Tree, and Random Forest. Sustainability 2020, 12, 7787. [Google Scholar] [CrossRef]
- Albulescu, A.-C.; Grozavu, A.; Larion, D.; Burghiu, G. Assessing the earthquake systemic vulnerability of the urban centres in the South-East region of Romania. The tale of Galați and Brăila Cities, Romania. Geomat. Nat. Hazards Risk 2022, 13, 1106–1133. [Google Scholar] [CrossRef]
- Shafapourtehrany, M.; Yariyan, P.; Özener, H.; Pradhan, B.; Shabani, F. Evaluating the application of K-mean clustering in Earthquake vulnerability mapping of Istanbul, Turkey. Int. J. Disaster Risk Reduct. 2022, 79, 103154. [Google Scholar] [CrossRef]
- Anastassiadis, A.J.; Argyroudis, S.A. Seismic vulnerability analysis in urban systems and road networks. Application to the city of Thessaloniki, Greece. Int. J. Sustain. Dev. Plan. 2007, 2, 287–301. [Google Scholar] [CrossRef] [Green Version]
- Argyroudis, S.; Selva, J.; Gehl, P.; Pitilakis, K. Systemic Seismic Risk Assessment of Road Networks Considering Interactions with the Built Environment. Comput.-Aided Civ. Infrastruct. Eng. 2015, 30, 524–540. [Google Scholar] [CrossRef]
- Tamima, U.; Chouinard, L. Systemic Seismic Vulnerability of Transportation Networks and Emergency Facilities. J. Infrastruct. Syst. 2017, 23, 04017032. [Google Scholar] [CrossRef]
- Santarelli, S.; Bernardini, G.; Quagliarini, E.; D’Orazio, M. New Indices for the Existing City-Centers Streets Network Reliability and Availability Assessment in Earthquake Emergency. Int. J. Arch. Herit. 2017, 12, 153–168. [Google Scholar] [CrossRef]
- Toma-Danila, D.; Armas, I.; Tiganescu, A. Network-risk: An open GIS toolbox for estimating the implications of transportation network damage due to natural hazards, tested for Bucharest, Romania. Nat. Hazards Earth Syst. Sci. 2020, 20, 1421–1439. [Google Scholar] [CrossRef]
- Toma-Danila, D.; Tiganescu, A.; D’Ayala, D.; Armas, I.; Sun, L. Time-Dependent Framework for Analyzing Emergency In-tervention Travel Times and Risk Implications due to Earthquakes. Bucharest Case Study. Front. Earth Sci. 2022, 10, 834052. [Google Scholar] [CrossRef]
- UNDRR. Terminology. Online Glossary—Vulnerability. Available online: https://www.undrr.org/terminology/vulnerability (accessed on 16 January 2022).
- Huang, Q.; Meng, S.; He, C.; Dou, Y.; Zhang, Q. Rapid Urban Land Expansion in Earthquake-Prone Areas of China. Int. J. Disaster Risk Sci. 2019, 10, 43–56. [Google Scholar] [CrossRef] [Green Version]
- Elliott, J.R. Earth Observation for the Assessment of Earthquake Hazard, Risk and Disaster Management. Surv. Geophys. 2020, 41, 1323–1354. [Google Scholar] [CrossRef]
- Iglesias, V.; Braswell, A.E.; Rossi, M.W.; Joseph, M.B.; McShane, C.; Cattau, M.; Koontz, M.J.; McGlinchy, J.; Nagy, R.C.; Balch, J.; et al. Risky Development: Increasing Exposure to Natural Hazards in the United States. Earth’s Futur. 2021, 9, e2020EF001795. [Google Scholar] [CrossRef] [PubMed]
- Landes, M.; Fielitz, W.; Hauser, F.; Popa, M.; CALIXTO Group. 3-D upper crustal tomographic structure across the Vrancea seismic zone, Romania. Tectonophysics 2004, 382, 85–102. [Google Scholar] [CrossRef]
- ANDRA-COSMINA ALBULESCU. Overview of the seismic vulnerability problem of the urban settlements in Romania. Geopatterns 2021, VI, 17–26. [Google Scholar] [CrossRef]
- Draghiceanu, M.M. Les Tremblement de Terre de la Roumanie et des Pays Environants; Geologie appliquee; L’Institut d’Arts Graphiques Carol Gobl: Bucharest, Romania, 1896. [Google Scholar]
- Albulescu, A.C. Multi-Criteria Assessment of Seismic Vulnerability: Case Studies: Iași, Vaslui, Galați and Focșani Cities. Ph.D. Thesis, Alexandru Ioan Cuza University of Iasi, Iași, Romania, 2021. [Google Scholar]
- Vacareanu, R.; Radoi, R.; Negulescu, C.; Aldea, A. Seismic vulnerability of RC buildings in Bucharest, Romania. In Proceedings of the 13th World Conference on Earthquake Engineering, Vancouver, Canada, 1–6 August 2004; Paper No. 1796. Available online: https://www.iitk.ac.in/nicee/wcee/article/13_1798.pdf (accessed on 23 November 2022).
- Armaș, I.; Gavriș, A. Social vulnerability assessment using spatial multi-criteria analysis (SEVI model) and the Social Vulnerability Index (SoVI model)—A case study for Bucharest, Romania. Nat. Hazards Earth Syst. Sci. 2013, 13, 1481–1499. [Google Scholar] [CrossRef] [Green Version]
- Armaş, I.; Ionescu, R.; Gavriş, A.; Toma-Danila, D. Identifying seismic vulnerability hotspots in Bucharest. Appl. Geogr. 2016, 77, 49–63. [Google Scholar] [CrossRef]
- Toma-Danila, D. A GIS framework for evaluating the implications of urban road network failure due to earthquakes: Bucharest (Romania) case study. Nat. Hazards 2018, 93, 97–111. [Google Scholar] [CrossRef]
- UTCB (Universitatea Tehnica de Construcții București). Part 1: Provisions for the design of buildings. In dicative P-100/1. In Seismic Design Code; Elaborated by UTCB, endorsed by MDRAP Official Journal of Romania, Code O100-1/2013; UTCB: Bucharest, Romania, 2013. (In Romanian) [Google Scholar]
- Radulian, M. Mechanisms of Earthquakes in Vrancea. In Encyclopedia of Earthquake Engineering; Springer: Berlin/Heidelberg, Germany, 2014; pp. 1473–1481. [Google Scholar] [CrossRef]
- Ardeleanu, L. Statistical Models of the Seismicity of the Vrancea Region, Romania. Nat. Hazards 1999, 19, 151–164. [Google Scholar] [CrossRef]
- Ismail-Zadeh, A.; Matenco, L.; Radulian, M.; Cloetingh, S.; Panza, G. Geodynamics and intermediate-depth seismicity in Vrancea (the south-eastern Carpathians): Current state-of-the art. Tectonophysics 2012, 530, 50–79. [Google Scholar] [CrossRef]
- Vacareanu, R.; Lungu, D.; Marmureanu, G.; Cioflan, C.; Aldea, A.; Arion, C.; Demetriu, S.; Pavel, F. Statistics of seismicity for Vrancea subcrustal source. In Proceedings of the International Conference on Earthquake Engineering SE-50 EEE, Skopje, Macedonia, 29–31 May 2013; Paper No. 138. Available online: https://infp.infp.ro/bigsees/Docs/Statistics%20of%20seismicity%20for%20Vrancea%20subcrustal%20seismic%20source.pdf (accessed on 17 January 2022).
- Oncescu, M.C.; Marza, V.I.; Rizescu, M.; Popa, M. Vrancea Earthquakes: Tectonics, Hazard and Risk Mitigation; Kluwer Academic Publishers: Dodrecht, The Netherlands, 2000. [Google Scholar]
- Georgescu, E.S.; Pomonis, A. Building damage vs. territorial casualty patterns during the Vrancea (Romania) earthquakes of 1940 and 1977. In Proceedings of the 15th World Conference on Earthquake Engineering, Lisboa, Portugal, 24–28 September 2012. [Google Scholar]
- Pantea, A.; Constantin, A.P. Reevaluated macroseismic map of Vrancea (Romania) earthquake occurred on November 10, 1940. Rom. J. Phys. 2011, 56, 578–589. [Google Scholar]
- Pantea, A.; Constantin, A.P. Re-evaluation of the macroseismic effects produced by the March 4, 1977, strong Vrancea earthquake in Romanian territory. Ann. Geophys. 2013, 56, 104–116. [Google Scholar] [CrossRef]
- Geo-spatial.org. Romania—Vector Datasets. Available online: https://geo-spatial.org/vechi/download/romania-seturi-vectoriale (accessed on 10 November 2022).
- Giardini, D.; Woessner, J.; Danciu, L.; Crowley, H.; Cotton, F.; Grunthal, G.; Pinho, R.; Valensise, G.; Akkar, S.; Arvidsson, R.; et al. Seismic Hazard Harmonization in Europe (SHARE): Online Data Resource. 2012. Available online: http://hazard.efehr.org/en/Documentation/specific-hazard-models/europe/overview/ (accessed on 17 January 2022).
- Law 351/2001. MONITORUL OFICIAL 408/24.07. Available online: https://legislatie.just.ro/Public/DetaliiDocument/29780 (accessed on 14 December 2022).
- NIS (National Institute of Statistics). Population by Address, Function of Age, Gender, County and Settlement, at 1 July 2022. Available online: http://statistici.insse.ro:8077/tempo-online/#/pages/tables/insse-table (accessed on 14 December 2022).
- Georgescu, E.S.; Pomonis, A. The Romanian earthquake of March 4, 1977 revisited: New insights into its territorial, economic and social impacts and their bearing on the preparedness for the future. In Proceedings of the 14th World Conference on Earthquake Engineering, Beijing, China, 12–17 October 2008. [Google Scholar]
- Walker, B.B.; Taylor-Noonan, C.; Tabbernor, A.; McKinnon, T.; Bal, H.; Bradley, D.; Schuurman, N.; Clague, J.J. A multi-criteria evaluation model of earthquake vulnerability in Victoria, British Columbia. Nat. Hazards 2014, 74, 1209–1222. [Google Scholar] [CrossRef]
- Alizadeh, M.; Ngah, I.; Hashim, M.; Pradhan, B.; Pour, A.B. A Hybrid Analytic Network Process and Artificial Neural Network (ANP-ANN) Model for Urban Earthquake Vulnerability Assessment. Remote Sens. 2018, 10, 975. [Google Scholar] [CrossRef] [Green Version]
- Merciu, C.; Ianos, I.; Merciu, G.-L.; Jones, R.; Pomeroy, G. Mapping accessibility for earthquake hazard response in the historic urban centre of Bucharest. Nat. Hazards Earth Syst. Sci. 2018, 18, 2011–2026. [Google Scholar] [CrossRef] [Green Version]
- El-Maissi, A.M.; Argyroudis, S.A.; Kassem, M.M.; Leong, L.V.; Nazri, F.M. An Integrated Framework for the Quantification of Road Network Seismic Vulnerability and Accessibility to Critical Services. Sustainability 2022, 14, 12474. [Google Scholar] [CrossRef]
- Goodall, B. The Penguin Dictionary of Human Geography; Puffin Books: London, UK, 1987. [Google Scholar]
- OSM. OpenStreetMap. 2022. Available online: https://www.openstreetmap.org/ (accessed on 10 November 2022).
- OSM. OpenStreetMap Nomenclature Key: Highway. 2022. Available online: https://wiki.openstreetmap.org/wiki/Key:highway (accessed on 19 December 2022).
- Wickham, H.; Averick, M.; Bryan, J.; Chang, W.; McGowan, L.D.A.; François, R.; Grolemund, G.; Hayes, A.; Henry, L.; Hester, J.; et al. Welcome to the Tidyverse. J. Open Source Softw. 2019, 4, 1686. [Google Scholar] [CrossRef] [Green Version]
- Alam, S.; Haque, S.M. Multi-dimensional earthquake vulnerability assessment of residential neighborhoods of Mymensingh City, Bangladesh: A spatial multi-criteria analysis based approach. J. Urban Manag. 2022, 11, 37–58. [Google Scholar] [CrossRef]
- Ertugay, K.; Argyroudis, S.; Düzgün, H.Ş. Accessibility modeling in earthquake case considering road closure probabilities: A case study of health and shelter service accessibility in Thessaloniki, Greece. Int. J. Disaster Risk Reduct. 2016, 17, 49–66. [Google Scholar] [CrossRef]
- Rahman, M.H. Earthquakes don’t kill, built environment does: Evidence from cross-country data. Econ. Model. 2018, 70, 458–468. [Google Scholar] [CrossRef]
- Shang, Q.; Guo, X.; Li, J.; Wang, T. Post-earthquake health care service accessibility assessment framework and its application in a medium-sized city. Reliab. Eng. Syst. Saf. 2022, 228, 108782. [Google Scholar] [CrossRef]
- Maidiawati, M. Seismic Analysis of Damaged Buildings Based on Post-Earthquake Investigation of the 2018 Palu Earthquake. Int. J. GEOMATE 2020, 18, 116–122. [Google Scholar] [CrossRef]
- Soria, A.; Galimberti, S.; Lapadula, G.; Visco, F.; Ardini, A.; Valsecchi, M.G.; Bonfanti, P. The high volume of patients admitted during the SARS-CoV-2 pandemic has an independent harmful impact on in-hospital mortality from COVID-19. PLoS ONE 2021, 16, e0246170. [Google Scholar] [CrossRef] [PubMed]
- Mahase, E. COVID-19: High prevalence and lack of hospital beds putting “intense pressure” on ambulances. BMJ 2022, 378, o1763. [Google Scholar] [CrossRef] [PubMed]
- Albulescu, A.C.; Necula, N.; Niculiță, M.; Grozavu, A.; Larion, D. Compensating the absent or incomplete data required in vulnerability analyses via GIS. A case study on the surface geology and building stock of Iași City, Romania. In Proceedings of the EGU General Assembly Conference 2022, Vienna, Austria & Online, 23–27 May 2022. EGU22-5724. [Google Scholar] [CrossRef]


| Urban Settlement | County | PGA (g) | Population | Economic Profile | Importance Rank |
|---|---|---|---|---|---|
| Bacău | Bacău County | 0.35 | 194,004 | Complex economic profile, administrative function | I |
| Onești | 0.35 | 48,732 | Industry-based economic profile | II | |
| Ploiești | Prahova County | 0.35 | 216,134 | Complex economic profile, administrative function | I |
| Câmpina | 0.35 | 34,954 | Industry-based economic profile | II | |
| Focșani | Vrancea County | 0.40 | 88,933 | Complex economic profile, administrative function | |
| Adjud | 0.40 | 19,553 | Industry and service-based economic profile | ||
| Buzău | Buzău County | 0.35 | 126,144 | Complex economic profile, administrative function | |
| Râmnicu Sărat | 0.35 | 38,109 | Industry and service-based economic profile | ||
| Bârlad | Vaslui County | 0.35 | 67,112 | Industry and service-based economic profile | |
| Tecuci | Galați County | 0.35 | 48,109 | Industry and service-based economic profile | |
| Urziceni | Ialomița County | 0.35 | 15,998 | Industry-based economic profile |
| Dataset | Source | Data Collection/Processing Observations |
|---|---|---|
| Medical units | Manual digitisation over theOSM basemap [67] | The dataset included only the medical units suited to offer health assistance in the aftermath of a major earthquake. Therefore, small medical facilities and private hospitals were excluded from the spatial analysis. Additionally, medical facilities with special profiles, where the usual needs of the patients are demanding enough even in non-seismic contexts (i.e., psychiatric, pediatric, tuberculosis hospitals, and maternities), were excluded. Data validation was performed using Google Street View and through field observations. |
| Fire stations | Manual digitisation over the OSM basemap [67] | The dataset included all the fire stations with firefighter teams that may be called to action in the aftermath of a powerful earthquake. The tasks of these teams include both fire limitation actions and search and rescue procedures. Data validation was performed using Google Street View and through field observations. |
| Urban street network | OSM [67] | The dataset was extracted using the OpenStreetMap Toolbox in ArcMap 10.2.2 software. Certain highway features were deleted from the initial dataset due to the fact that they were not suitable for intervention vehicles. Manual corrections were performed in the final processing stage. |
| Urban built-up area limit | OSM [67] | The dataset was computed using land use data extracted via OpenStreetMap Toolbox in ArcMap 10.2.2 software. Peripheral areas with land covers that may generate low population densities or inconsistent habitation patterns were removed from the dataset. Data validation was performed using Google Street View and through field observations. |
Disclaimer/Publisher’s Note: The statements, opinions and data contained in all publications are solely those of the individual author(s) and contributor(s) and not of MDPI and/or the editor(s). MDPI and/or the editor(s) disclaim responsibility for any injury to people or property resulting from any ideas, methods, instructions or products referred to in the content. |
© 2023 by the author. Licensee MDPI, Basel, Switzerland. This article is an open access article distributed under the terms and conditions of the Creative Commons Attribution (CC BY) license (https://creativecommons.org/licenses/by/4.0/).
Share and Cite
Albulescu, A.-C. Open Source Data-Based Solutions for Identifying Patterns of Urban Earthquake Systemic Vulnerability in High-Seismicity Areas. Remote Sens. 2023, 15, 1453. https://doi.org/10.3390/rs15051453
Albulescu A-C. Open Source Data-Based Solutions for Identifying Patterns of Urban Earthquake Systemic Vulnerability in High-Seismicity Areas. Remote Sensing. 2023; 15(5):1453. https://doi.org/10.3390/rs15051453
Chicago/Turabian StyleAlbulescu, Andra-Cosmina. 2023. "Open Source Data-Based Solutions for Identifying Patterns of Urban Earthquake Systemic Vulnerability in High-Seismicity Areas" Remote Sensing 15, no. 5: 1453. https://doi.org/10.3390/rs15051453