Technical Note

Revealing the Kinematic Characteristics and Tectonic Implications of a Buried Fault through the Joint Inversion of GPS and Strong-Motion Data: The Case of the 2022 Mw7.0 Taiwan Earthquake

1
School of Earth Sciences, Yunnan University, Kunming 650500, China
2
State Key Laboratory of Earthquake Dynamics, Institute of Geology, China Earthquake Administration, Beijing 100029, China
3
School of Geosciences and Info-Physics, Central South University, Changsha 410083, China
4
Seismological Center, Center Weather Bureau, Taipei 10048, Taiwan
5
Department of Geosciences, National Taiwan University, Taipei 10048, Taiwan
*
Author to whom correspondence should be addressed.
Remote Sens. 2023, 15(19), 4868; https://doi.org/10.3390/rs15194868
Submission received: 3 August 2023 / Revised: 20 September 2023 / Accepted: 6 October 2023 / Published: 8 October 2023
(This article belongs to the Special Issue Monitoring Subtle Ground Deformation of Geohazards from Space)

Abstract

:
Understanding the kinematic characteristics of the Longitudinal Valley Fault Zone (LVFZ) can help us to better understand the evolution of orogens. The 2022 Mw7.0 Taitung earthquake that occurred in Taiwan provides us with a good opportunity to understand the motion characteristics of the Central Range Fault (CRF) and the strain partitioning pattern within the Longitudinal Valley Fault (LVF). We obtained the coseismic displacement and slip distribution of the 2022 Taiwan earthquake based on the strong-motion and GPS data available. The causative fault of this earthquake is the west-dipping Central Range Fault, which is buried beneath the western boundary of the LVF. The coseismic displacement field exhibits a quadrant distribution pattern, indicating a left-lateral strike-slip mechanism with a maximum displacement exceeding 1.25 m. The joint inversion results show that the size of the main asperity is 40 km × 20 km, and the maximum slip amount of 2.6 m is located at a depth of 10 km, equivalent to an earthquake of Mw7.04. The LVFZ is composed of LVF and CRF, which accommodates nearly half of the oblique convergence rate between the Philippine Sea Plate and the Eurasian Plate. There is a phenomenon of strain partitioning in the southern segment of the Longitudinal Valley Fault Zone. The Central Mountain Range Fault is primarily responsible for accommodating strike-slip motion, while the Longitudinal Valley Fault is mainly responsible for accommodating thrust motion.

1. Introduction

Between 17 September and 18 September 2022, an earthquake sequence starting with an Mw6.6 earthquake occurred in the southeastern portion of the island of Taiwan. This earthquake sequence included nine earthquakes with magnitudes greater than ML5, with the largest main shock being the Mw7.0 earthquake that occurred on 18 September 2022. This earthquake caused severe damage to local buildings and resulted in enormous economic losses [1]. As a stress release process, this earthquake sequence indicates that there is high stress accumulation in the southeastern region of Taiwan. The Taiwan orogen is a critical tectonic position where the Philippine Sea Plate interacts with the Eurasian Plate, that acts as a transition zone for the convergence mechanism of the Philippine Sea Plate relative to the Eurasian Plate [2,3]. The Philippine Sea Plate subducts northward beneath the Eurasian Plate in northeastern Taiwan, while it becomes the Eurasian Plate subducting eastward under the Philippine Sea Plate in southeastern Taiwan [4]. The contact between the two plates in Taiwan and its adjacent sea area has undergone a transformation from subduction–collision–subduction from north to south [5,6]. The collision and compression of the two plates resulted in intense “mountain-building movement”, forming six major geological units from east to west, with “boundary faults” dividing each geological unit. Most of these “boundary faults” are active faults trending north–northeast, which are prone to triggering strong earthquakes. The main active faults include the Lishan-Chaochou fault located in central Taiwan, and the Longitudinal Valley Fault Zone (LVFZ), located in eastern Taiwan [7].
Based on the mainshock epicenter location during this earthquake sequence (121.1958E, 23.137N) that was provided by the Central Weather Bureau (CWB), we preliminarily inferred that the 18 September 2022 earthquake occurred along the LVFZ. As shown in Figure 1, the distance between the Mw6.5 earthquake on 17 September and the Mw7.0 earthquake on 18 September is no more than 10 km. Considering the short time interval between the two earthquakes, we believe that the 17 September Mw6.5 earthquake was a foreshock of the 18 September 2022 Mw7.0 earthquake. The LVFZ, where the 2022 Taitung earthquakes occurred, is a tectonic suture zone located between the Philippine Sea Plate and the Eurasian Plate (Figure 1). It is one of the most active faults on Earth [3]. The Longitudinal Valley Fault is located between the Central Mountain Range and the Eastern Coastal Range of Taiwan. It mainly refers to the high-angle east-dipping faults located along the western boundary edge of the Coastal Range, which are dominated by left-lateral strike-slip and reverse components. The total slip rate, including a strike-slip component and thrust component, can reach 20 mm/yr [5,6,8]. According to geological and geomorphological studies, many scholars speculate that in addition to the Longitudinal Valley Fault on the western boundary of the Coastal Range, there is a hidden west-dipping fault on the eastern boundary of the Central Range and the western boundary of the Longitudinal Valley. Biq (1965) named it the Central Range Fault [3,5,9,10]. In contrast, some believe that there is a normal fault present at this location, carrying the downward movement of the Longitudinal Valley relative to the Central Range [9,11,12]. Some scholars believe that there is no fault located here at all [13]. The aftershock relocation results of the Chengkung earthquake in 2003 found that in addition to the aftershock cluster along the Longitudinal Valley Fault, there were also small aftershock clusters along the western side of the Longitudinal Valley Fault, that is, along the Central Range Fault, whose presence was previously speculated on by others. It was not until the occurrence of the 2006 Peinan earthquake occurred that the distribution of the fault slip and aftershocks confirmed that the mainshock occurred along the west-dipping Central Range Fault along the eastern boundary of the Central Mountain Range and the western boundary of the Longitudinal Valley [14,15]. Based on the solution of the source mechanism (strike: 203°, dip: 69°, rake: 25°) provided by the USGS, as well as the epicenter location provided by the CWB, we can speculate that the fault that caused the 2022 earthquake mainshock event is the Central Range Fault. Some existing studies also suggest that the main rupture fault of the Mw7.0 earthquake is the Central Range Fault [1,16,17].
The Central Range and Longitudinal Valley Faults make up the LVFZ, which accommodates the oblique convergence of the Philippine Block and the Eurasion Plate. The convergence rate between the two plates is as high as 8 cm/yr, and the LVFZ absorbs nearly half of this convergence rate, approximately 4 cm/yr [3,4,7,19]. Most of the southern segment of the Longitudinal Valley Fault exhibits obvious creeping movement on the surface, with a yearly slip rate of 2.2 cm/yr on the Chihshang Fault, measured between 1990 and 1997 by a creepmeter. This slip rate is composed of a reverse component of 1.7 cm/yr and a left-lateral component of 1.4 cm/yr [5]. The southern segment of the Longitudinal Valley Fault exhibits creeping movement and also has the potential to generate moderate to strong magnitude earthquakes. In 1951, an M7.8 earthquake occurred along the Longitudinal Valley Fault, resulting in significant property damage and casualties [20]. In 2003, the Mw6.8 Chengkung earthquake occurred 15 km east of the epicenter of the 2022 Mw6.9 earthquake along the Longitudinal Valley Fault, which was a thrust earthquake. In 2006, the Mw6.1 Peinan earthquake occurred 30 km southwest of the epicenter of the 2022 Mw7.0 earthquake, along the Central Range Fault, which has a similar mechanism to the 2022 Mw7.0 earthquake and is a left-lateral earthquake. The occurrence of three closely spaced earthquakes with significant differences in the mechanism indicates that the Central Range Fault and the Longitudinal Valley Fault exhibit distinct motion characteristics. For the Longitudinal Valley Fault, due to its clear creeping movement behavior in the southern segment, and the long-term observations that have been made, scholars have a relatively comprehensive understanding of the fault motion characteristics. However, the Central Range Fault has limited available understanding of its motion characteristics due to limited well-studied historical earthquakes and little identified surface rupture. However, the Central Range Fault plays a crucial role in controlling the tectonic uplift of the Central Range, as well as the tectonic suturing of the Philippine Plate and the Southern China Plate. Due to the occurrence of the Taitung earthquake sequence, Lee et al. (2023) made a notable discovery using joint inversion techniques: the dynamic rupture on the Central Range Fault has the potential to trigger the Longitudinal Valley Fault, revealing intricate interactions between these opposing conjugate thrust faults [17]. Yuji Yagi et al. (2023), using the Potency Density Tensor Inversion method, found an irregular rupture process caused by the heterogeneity of stress [16]. However, there are still some unknowns, such as: (1) How do the motion characteristics of the Central Range Fault compare with those of the adjacent Longitudinal Valley Fault? (2) For the tectonic suturing zone of the Philippine Plate and the Southern China Plate, what is the strain partitioning pattern between the two faults? Answering these questions will not only help to analyze the seismic hazard in southeastern Taiwan and the understanding of Taiwan’s tectonic evolution behavior, but will also improve our understanding of the mechanisms in the suturing process. The 2022 Mw7.0 Taitung earthquake provides a great opportunity to explore the motion characteristics of the Central Range Fault and the tectonic implications it raises.
Inverting the surface deformation field to analyze the slip distribution of fault planes is one of the most effective methods for studying the kinematic properties of faults [21,22,23]. Surface displacement fields can be obtained from strong-motion data, Global Positioning System (GPS) data, and Interferometric Synthetic Aperture Radar (InSAR) data. In the narrow and elongated valley area between the Central Range and the Coastal Range, dense forests in the mountains can cause severe decorrelation of InSAR signals when using Sentinel data in C-band, which seriously affects the accuracy of the surface deformation fields. Moreover, the low temporal resolution of the InSAR data may include contributions from multiple earthquake events, making it difficult to obtain the coseismic deformation field caused by the slip of the Central Range fault and to analyze the motion characteristics of the Central Range Fault. However, Taiwan has a wide distribution of strong-motion networks and GPS networks that can provide us with rich earthquake and GPS data. Since the long-distance propagation of earthquake signals can lead to a decrease in the signal-to-noise ratio due to the effects of geometric diffusion and noise pollution, we selected 32 strong-motion stations that are located within 100 km of the epicenter, as well as 24 GPS stations that are located within 50 km of the epicenter, to perform the joint inversion of the slip distribution of fault planes and facilitate the conduction of further analysis of the motion characteristics of the Central Range Fault.
In this paper, we initially processed the strong-motion data and GPS data generated from the 2022 Mw7.0 Taitung earthquake in order to obtain the coseismic displacement field of the earthquake mainshock sequence, and then analyzed the surface deformation characteristics caused by the mainshock. After that, we jointly inverted the surface deformation field obtained from the strong-motion data and GPS data in order to obtain the fault plane slip distribution. We also inverted the coseismic slip distribution of the 2003 Chengkung earthquake, based on the static displacements of 89 GPS stations that were calculated by Chen et al. (2006) in order to compare and analyze the similarities and differences in the motion characteristics of the two faults [24]. Finally, by combining existing geodetic observations and historical earthquake information, we attempt to (1) determine the kinematic characteristics of the fault plane slip that occurred during the 2022 Taitung earthquake and (2) analyze the strain partitioning pattern of the Central Range Fault and the Longitudinal Valley Fault, which are the suture zones that are located between the Philippine Plate and the Southern China Plate.

2. Data and Methods

2.1. Processing of the Strong-Motion Data

The Taiwan Strong-Motion Instrumentation Program (TSMIP), operated by the CWB, has approximately 700 strong-motion stations located in Taiwan, providing real-time regional earthquake information. After considering the signal-to-noise ratio of each station, we collected strong-motion data from 32 stations located within 100 km of the epicenter of the 2022 Mw7.0 earthquake. To obtain the coseismic deformation field of the earthquake, we needed to perform baseline correction on the acceleration records, as direct integration of the acceleration data can result in creating serious baseline drift, possibly caused by the rotation and shaking of the station during the earthquake event. We used the SMBLOC software (V1.0) that was developed by Professor Rong-Jiang Wang, in order to perform automatic empirical baseline correction on the acceleration records. Figure 2 shows the baseline correction results for the station G020, which was located 2 km from the epicenter of the earthquake. The total static displacement was found to be 76.7 cm, and the results showed that the station primarily moved to the southwest in the horizontal direction and was uplifted in the vertical direction.

2.2. GPS Data Processing

There are approximately 250 GPS stations distributed in Taiwan’s GPS network operated by the CWB that monitor surface deformation caused by earthquakes and volcanic activities. We collected data from 24 GPS stations that were located within 50 km of the epicenter of the 2022 Mw7.0 earthquake, in order to obtain the coseismic deformation field. All stations were sampled at a rate of 30 s. We used the precise point positioning with ambiguity resolution (PPP-AR) technique based on ambiguity resolution developed by Professor Ge Maorong and his team to process GPS data from 18 September 2022. The static single-day mode was employed, and the Center for Orbit Determination in Europe (CODE) final orbits, Wuhan University (WHU) re-estimated phase clocks, and phase bias products were used for data processing. The cutoff elevation angle was set to 10°, and the PPP-AR software (V2.2) produced a single-day coordinate time series for 24 stations within the ITRF2014, which is a reference frame considering non-tidal atmospheric loads model [25]. Similar to previous studies, we calculated the coseismic displacement by subtracting the pre-earthquake average position from the post-earthquake position. To validate the accuracy of the static displacement results obtained from the GPS and strong-motion data, we selected four pairs of GPS stations and strong-motion stations located within 1 km of each other and compared their three-component displacements. Figure 3 shows that the three-component displacements obtained from the GPS and acceleration data are highly consistent.

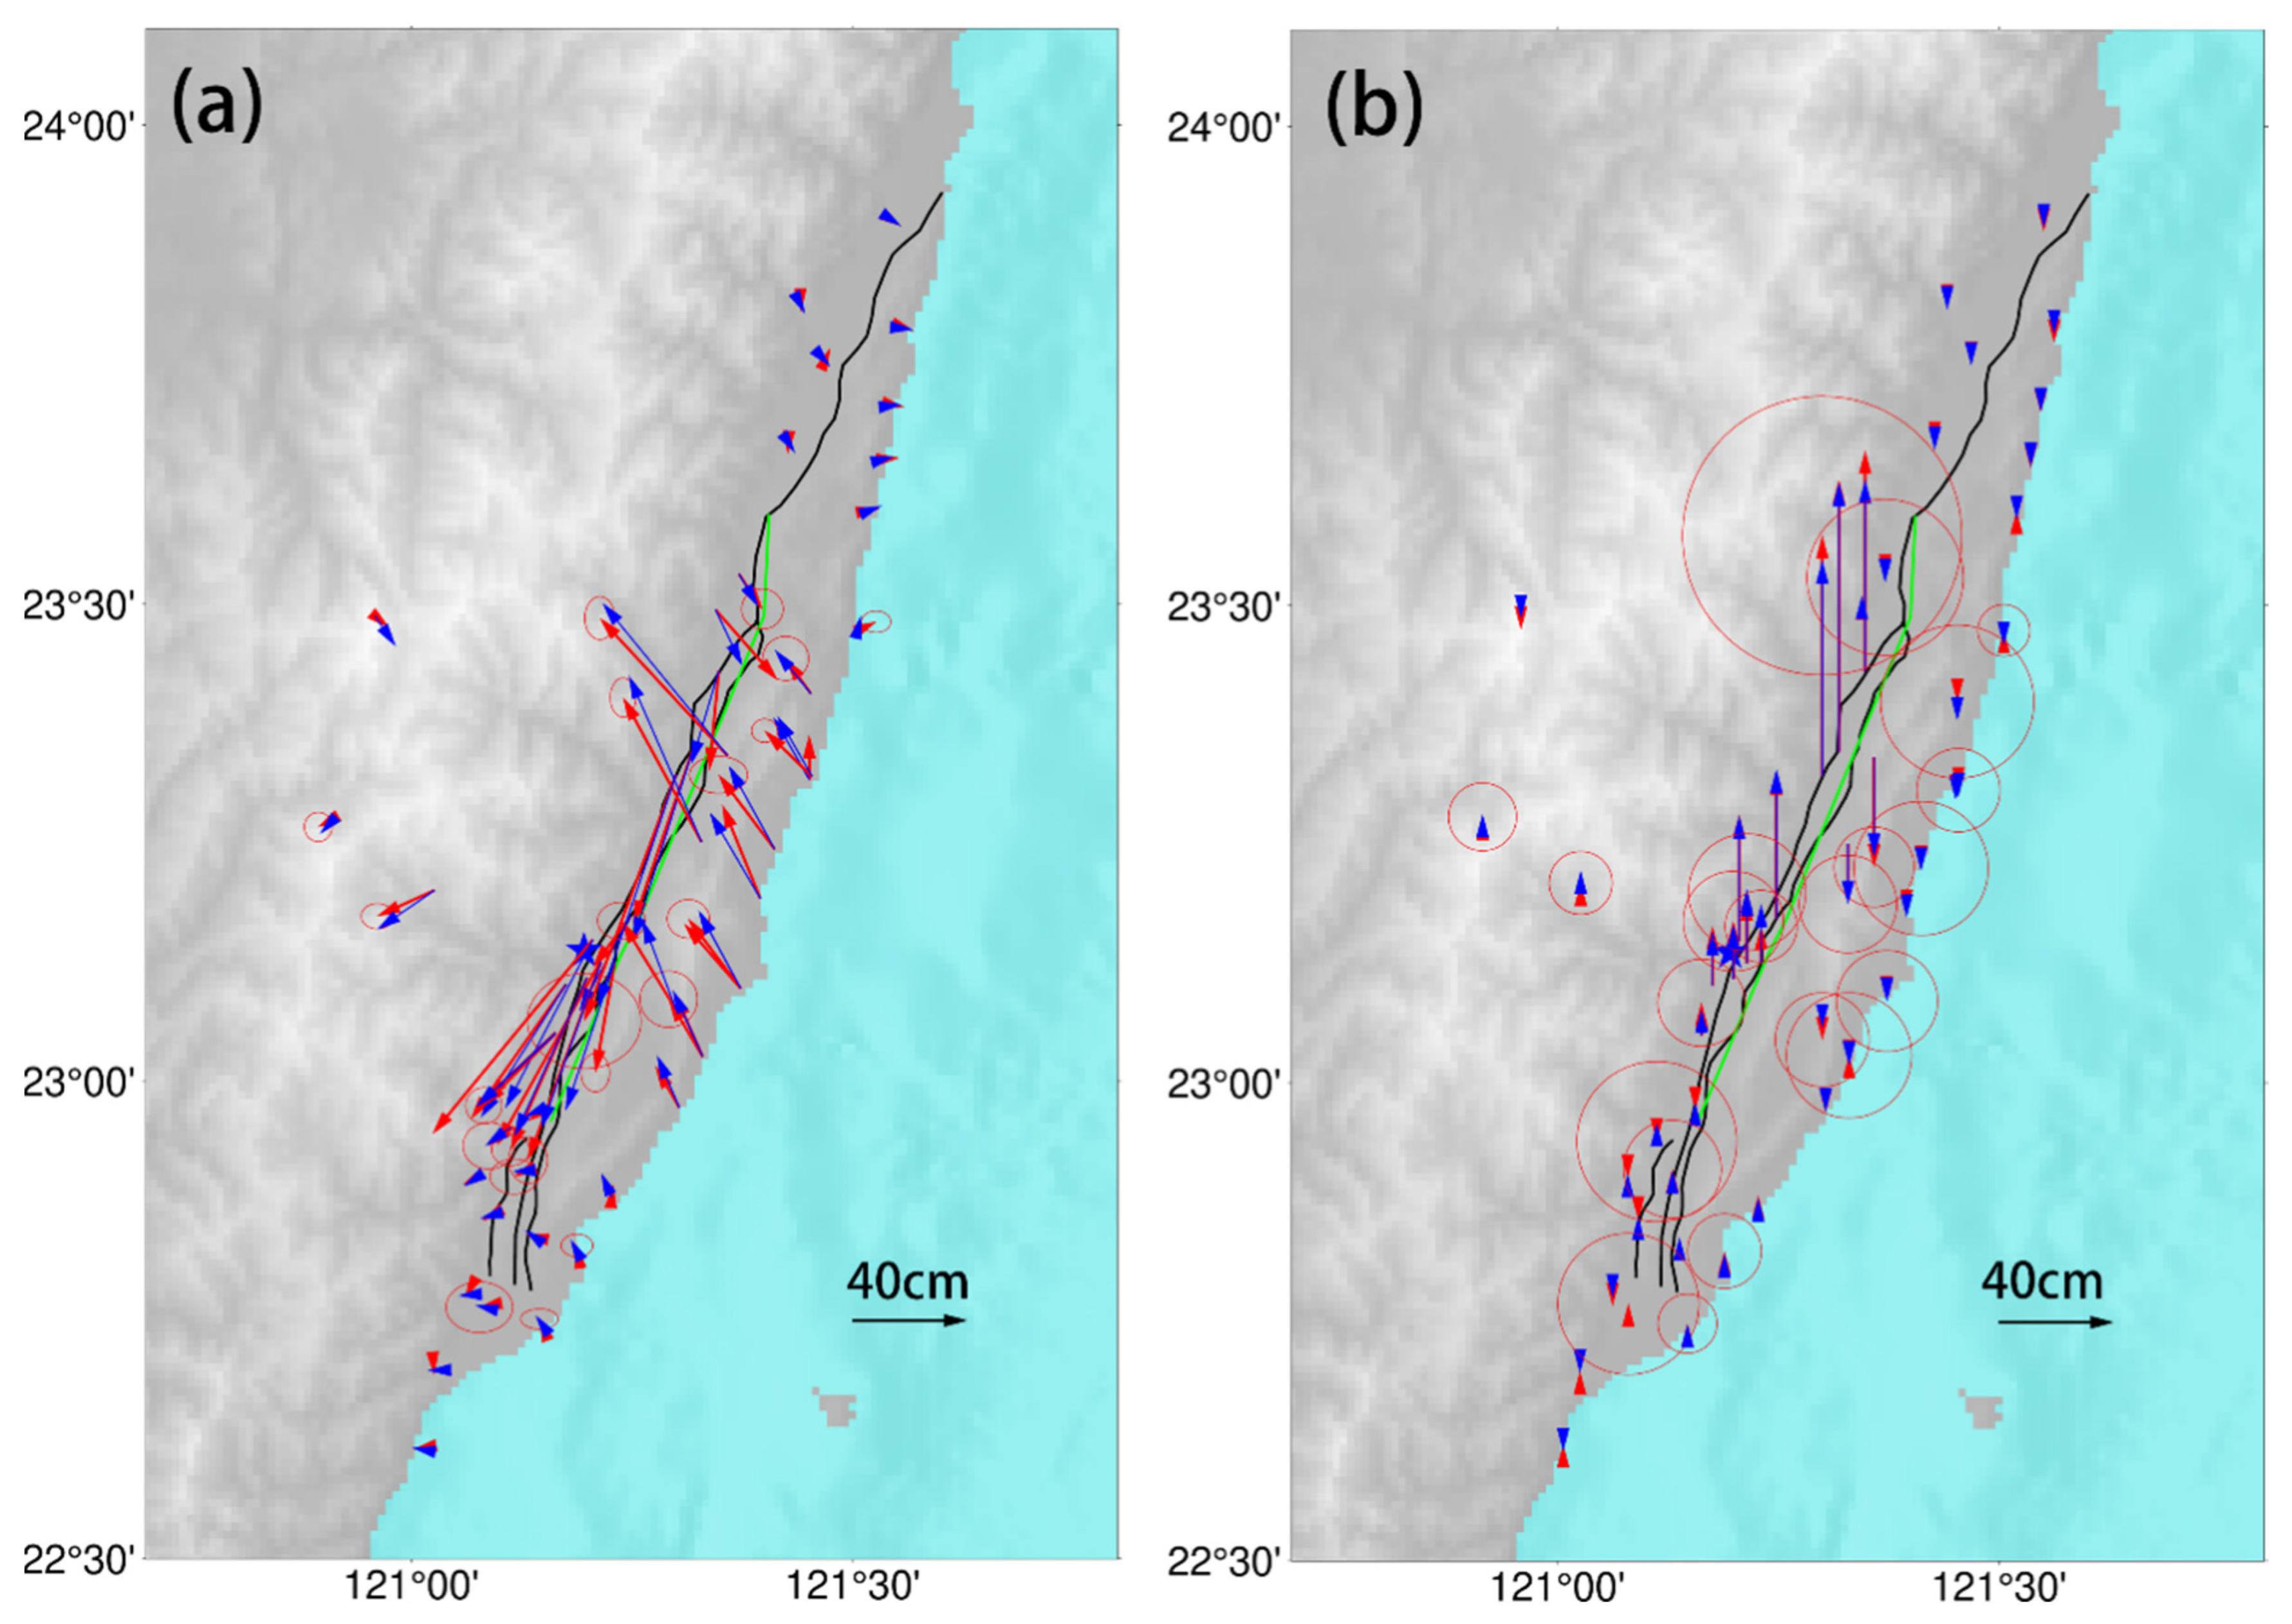
2.3. Coseismic Deformation Field

As shown in Figure 4, we obtained the coseismic deformation field caused by the 2022 Mw7.0 Taiwan earthquake based on the strong-motion and GPS data. The results show that (1) the influence of the coseismic deformation of this earthquake exceeded 100 km (with a coseismic deformation value greater than 1 cm), and the value of the coseismic deformation rapidly decayed as it propagated to both sides of the fault. (2) The strong-motion and GPS stations that were located northwest of the epicenter have displacements oriented toward the southeast, while those located southwest of the epicenter have displacements oriented toward the southwest of the epicenter. Stations located northeast of the epicenter have displacements oriented toward the northeast of the epicenter, and those located southeast of the epicenter have displacements oriented toward the northwest. The displacement is divided by the Longitudinal Valley Fault, presenting a four-quadrant distribution, indicating the left-lateral strike-slip deformation feature of this earthquake, which is a distribution consistent with the mechanism obtained by seismology. (3) The vertical displacement field is divided by the Longitudinal Valley Fault. Uplift is dominant on the west side, while subsidence is dominant on the east side of the fault. From the limited station displacement data, the uplift amount on the west side is greater than the subsidence amount that occurred on the east side of the fault, indicating a close relationship between the fault associated with this earthquake, the uplift of the Central Range, and the subsidence of the Coastal Range. (4) From the limited number of stations, the largest displacement is not located near the epicenter. Station G061, which is only 1.7 km away from the epicenter, has a horizontal displacement of 87.8 cm and a vertical displacement of 44 cm. The largest displacement is located at the YULL station, which is 23 km northeast of the epicenter, with a horizontal displacement of 91.8 cm and a vertical displacement of 84 cm, indicating that the main asperity of the earthquake was located northeast of the epicenter. (5) From the horizontal displacement field and the vertical displacement field, the larger displacements are mainly distributed within 40 km to the northeast of the epicenter, and the displacement rapidly decays in the southwest direction, indicating that this earthquake is mainly a rupture event in the northeast direction.

3. Result

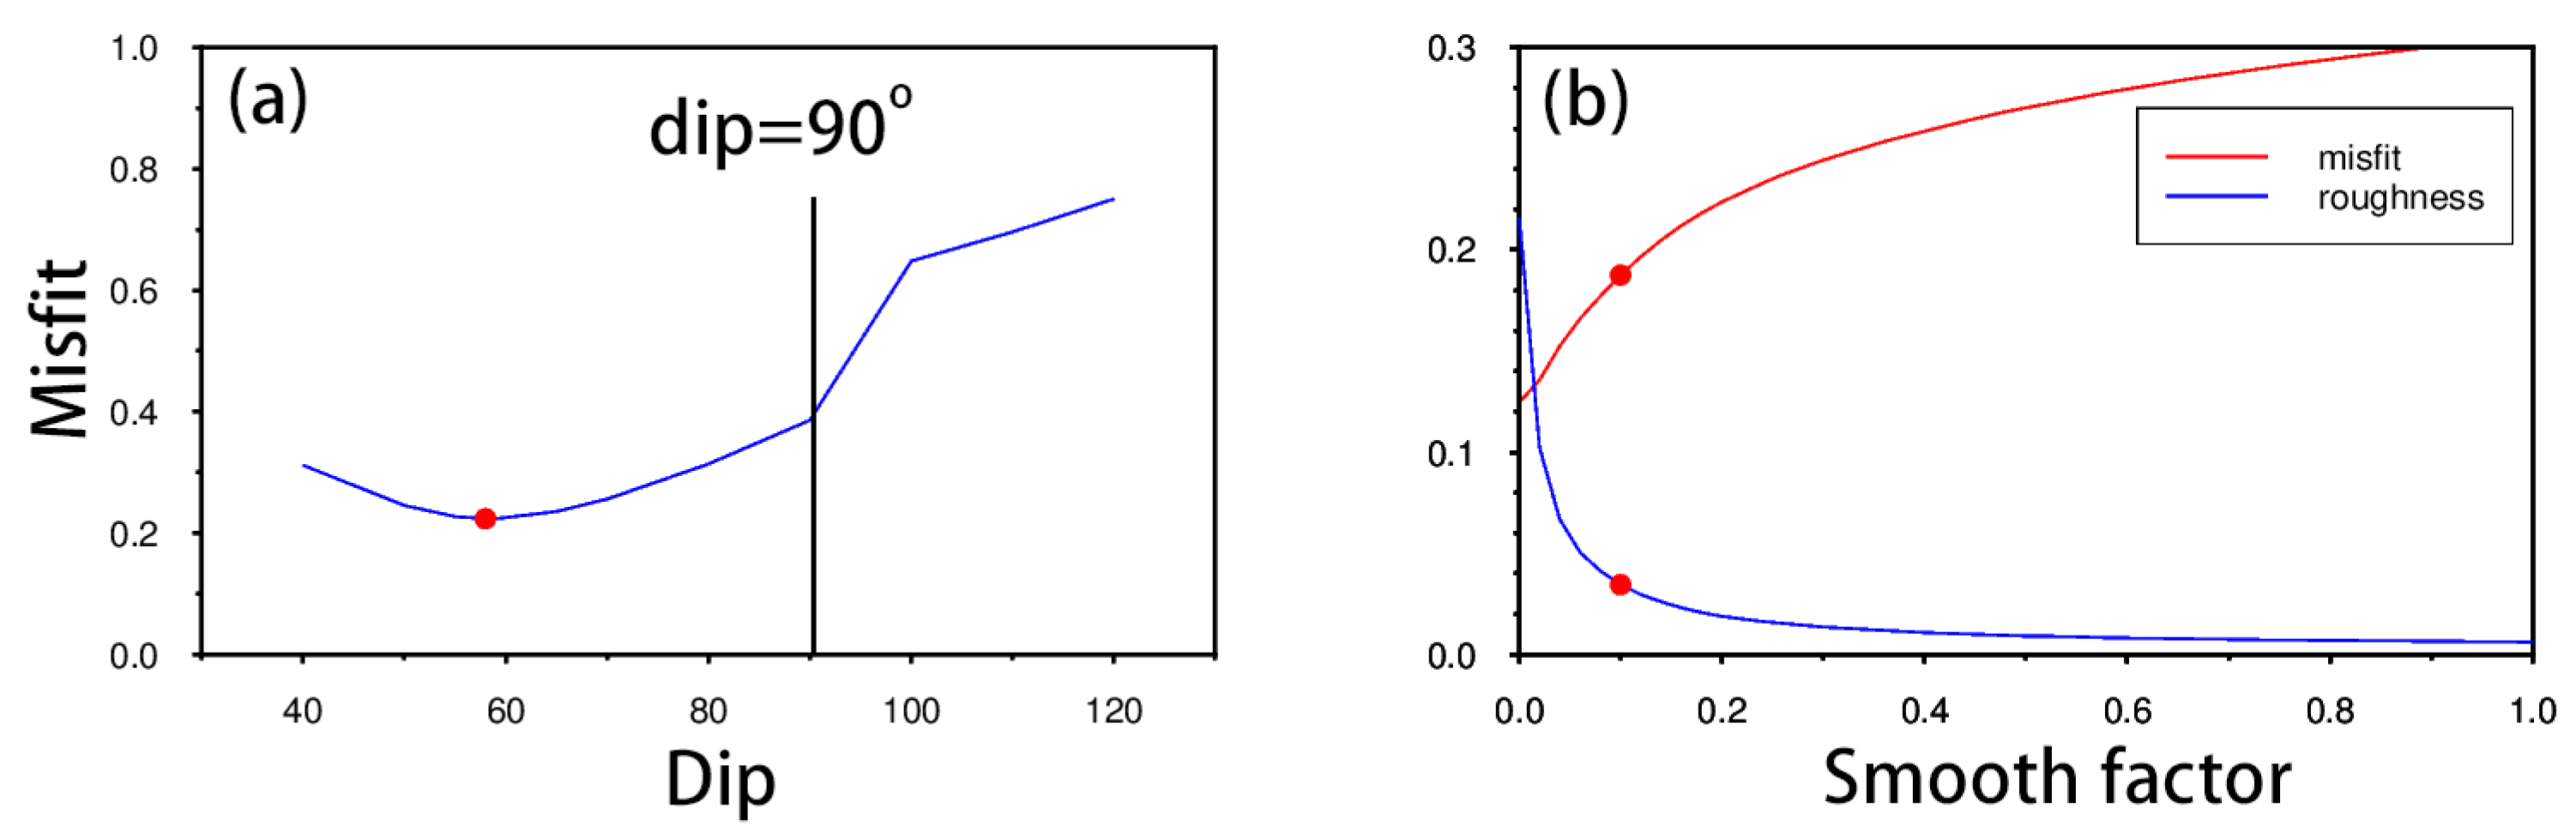
3.1. Inversion Method

Based on the elastic half-space dislocation model, we use the steepest descent method to solve for the distribution of coseismic slip [26,27]. We applied a single-fault model for inversion. Due to the large difference between the earthquake source location provided by the USGS (121.344, 23.138, 10) and that which was provided by the CWB (121.1958, 23.137, 7.81), we considered that the CWB used more near-field seismic stations and had smaller positioning errors, with horizontal and vertical errors of 0.2 km. Therefore, we used the earthquake source location provided by the CWB to determine the position of the fault model. According to the earthquake mechanism solution provided by the Global Centroid Moment Tensors (GCMT) project and the surface displacement field from strong-motion measurement and GPS data, we set the initial dip angle to 61 degrees. As it was uncertain whether the earthquake ruptured to the surface, we extended the fault model to the surface and expanded it by 75 km along the strike and 30 km along the dip and discretized the fault model into a series of subfaults of 4 km by 4 km each. Then, we jointly inverted the coseismic slip using strong-motion and GPS data. Considering that the vertical component of the GPS data has a large error, we set the weight of the three components of the strong-motion data and the horizontal component of the GPS data to two and the weight of the vertical component of GPS data to one. Finally, to further verify whether the earthquake occurred on the east-dipping Longitudinal Valley Fault or the west-dipping Central Range Fault, we used the grid search method to estimate the dip angle of the fault. The search range was from 40 degrees west-dipping to 60 degrees east-dipping. As shown in Figure 5a, the optimal model with the minimum amount of error indicated that the optimal dip angle of the fault was 58 degrees west-dipping, which was consistent with the west-dipping 61-degree mechanism solution provided by the GCMT project. We obtained the best smoothing factor by balancing the trade-off curve between the roughness and residual error. The range was set from 0 to 1, and a step size of 0.02 was used for the search. As shown in Figure 5b, the optimal smoothing factor was set to 0.1. We performed the inversions using only the strong-motion data, only the GPS data, and then combined both types of data separately along the optimal fault model, in order to select the best slip distribution result.
For the 2003 Chengkung earthquake, we collected coseismic surface displacements that were obtained from 89 GPS stations located within 60 km of the epicenter. Chen et al. (2006) described the GPS data processing method [24]. Based on the seismic source parameters provided by the CWB website (121.34°E, 23.10°N, 10 km) and the focal mechanism solution provided by the GCMT project (10/51/69), we determined the initial position of the fault model and then performed the inversion using a single-fault model. We obtained the optimal dip angle and the smoothing factor by using the method described above, and finally obtained the coseismic slip distribution for the 2003 Chengkung earthquake.

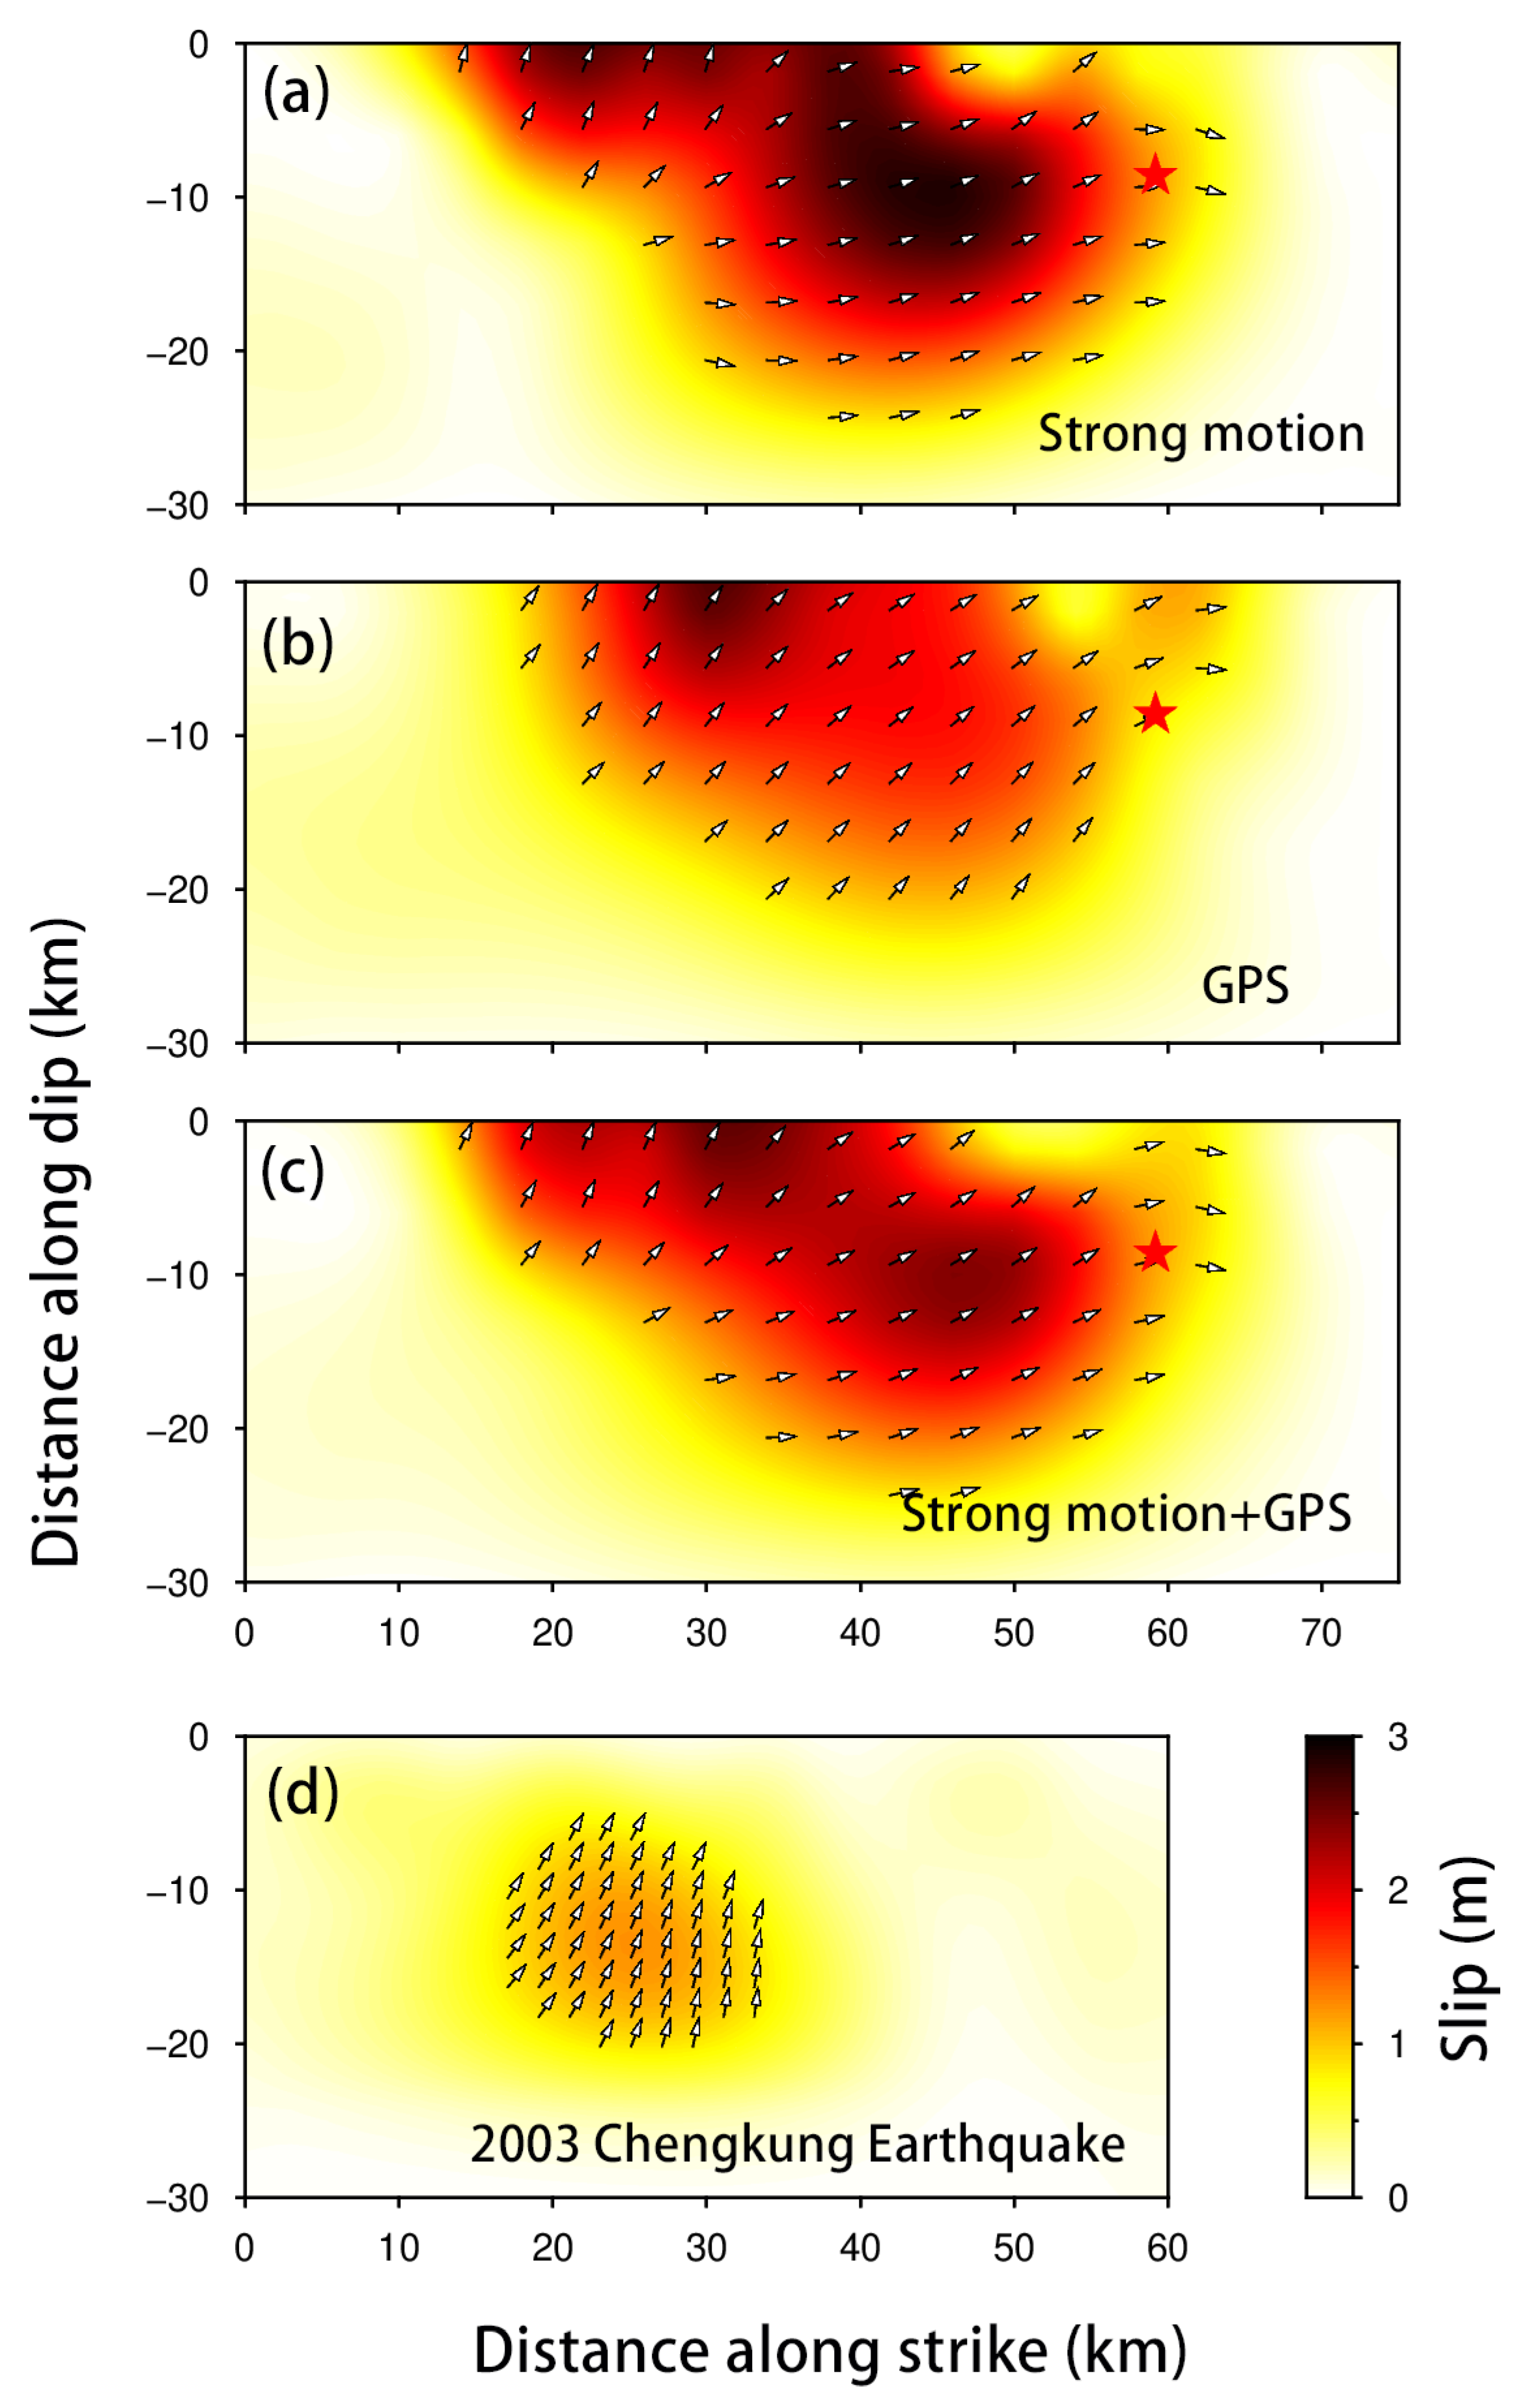
3.2. Slip Distribution

In Figure 6a–c, we present the coseismic slip distributions obtained by inverting the strong-motion data alone, the GPS data alone, and then by the combined use of both data sets, for the 2022 Mw7.0 Taiwan earthquake. All three slip distributions indicate that the earthquake was dominated by a left-lateral strike-slip motion with a local thrust motion and indicate a unilateral rupture propagating along the fault toward the northeast. Based on the optimized model from the completion of the joint inversion, the earthquake released the energy equivalent to that which would be released by an Mw7.04 earthquake, which is a similar to the result of Mw7.0 provided by the GCMT project. The three inversion results show good consistency in terms of location and magnitude. The slip is mainly concentrated at depths within 20 km, with a maximum slip value of approximately 2.6 m. The strong-motion-based result shows a transition from thrust motion behavior to strike-slip motion behavior from the northeast to southwest directions, while the GPS-based result shows a relatively consistent oblique slip, with an average rake of approximately 30 degrees. The jointly inverted slip distribution shows a transition from an oblique slip a to strike-slip motion, extending from the northeast to the southwest direction. The maximum slip value falls between the results obtained from using only one type of data, indicating that combining different types of data can enhance the detection capability. The coseismic slip distribution obtained in this study demonstrates a good consistency, in terms of both location and magnitude, with the results published in existing studies [16,17]. Figure 6d shows the coseismic slip distribution for the 2003 Chengkung earthquake, which was mainly concentrated at depths between 5 and 20 km, without rupturing the surface. It was dominated by a thrust motion, with a small amount of left-lateral strike-slip motion, and the maximum slip was 1.5 m.
Figure 6c shows the best-fit model for the 2022 Mw7.0 Taiwan earthquake, which overall exhibits left-lateral strike-slip motion with local reverse motion. We note three key features of the model: (1) slip is concentrated at depths greater than 20 km and extends along the strike for a length of approximately 40 km, with a maximum slip of 2.5 m, at a depth of approximately 10 km. (2) The optimal results of the joint inversion indicate that the Mw7.0 earthquake primarily consists of two asperities. The larger main asperity is located in the northeast direction of the hypocenter at a depth of approximately 10 km, while a relatively smaller asperity is positioned in the northeast direction of the larger asperity, close to the surface. The maximum slip values for both asperities are around 2.5 m. This suggests that the earthquake is likely to have caused a surface rupture, and further on-site investigations are required for model validation. (3) Reverse motion dominates on the northeast side of the fault model, gradually transitioning to strike-slip motion along the southwest direction, indicating that the stress conditions along the fault are quite complex.
Figure 7 shows the fitting of the displacement data. Overall, the predicted data from the model can match the observed data well. The root-mean-square errors of the horizontal and vertical directions for the strong-motion data are 8.18 cm and 2.43 cm, respectively, while those obtained from the GPS data are 5.97 cm and 3.68 cm in the horizontal and vertical directions, respectively. Therefore, our single-fault model can match the coseismic displacement field obtained from both the strong-motion and GPS data, and the fitting effect of the GPS data is better than that obtained from the strong-motion data.

4. Discussion

4.1. Slip Distribution Resolution of the 2022 Mw7.0 Earthquake

There were significant differences in the slip distributions obtained from the strong-motion and GPS data. This was due to the different spatial densities of the station networks, with regions with denser station distributions providing better constraints on the inversion results. Therefore, the resolution of the slip distribution along the fault plane varied depending on the depth and the type of data that were used. To better evaluate the accuracy of the slip distribution obtained from the two types of data, we conducted a checkerboard test, as shown in Figure 8. The results indicated that both types of data had a good resolution within 10 km depth. The strong-motion network appeared to have a better resolution between 10 and 20 km of depth, while the GPS network had a better resolution when located near the epicenter. The inversion results from the joint analysis of strong-motion and GPS data complement each other, providing better constraints on the co-seismic slip distribution. As shown in Figure 8c, there is a good resolution within a depth of 20 km. Fortunately, the main slip distribution of this earthquake sequence primarily falls within this depth range. Therefore, we believe that our joint inversion results have a higher accuracy.

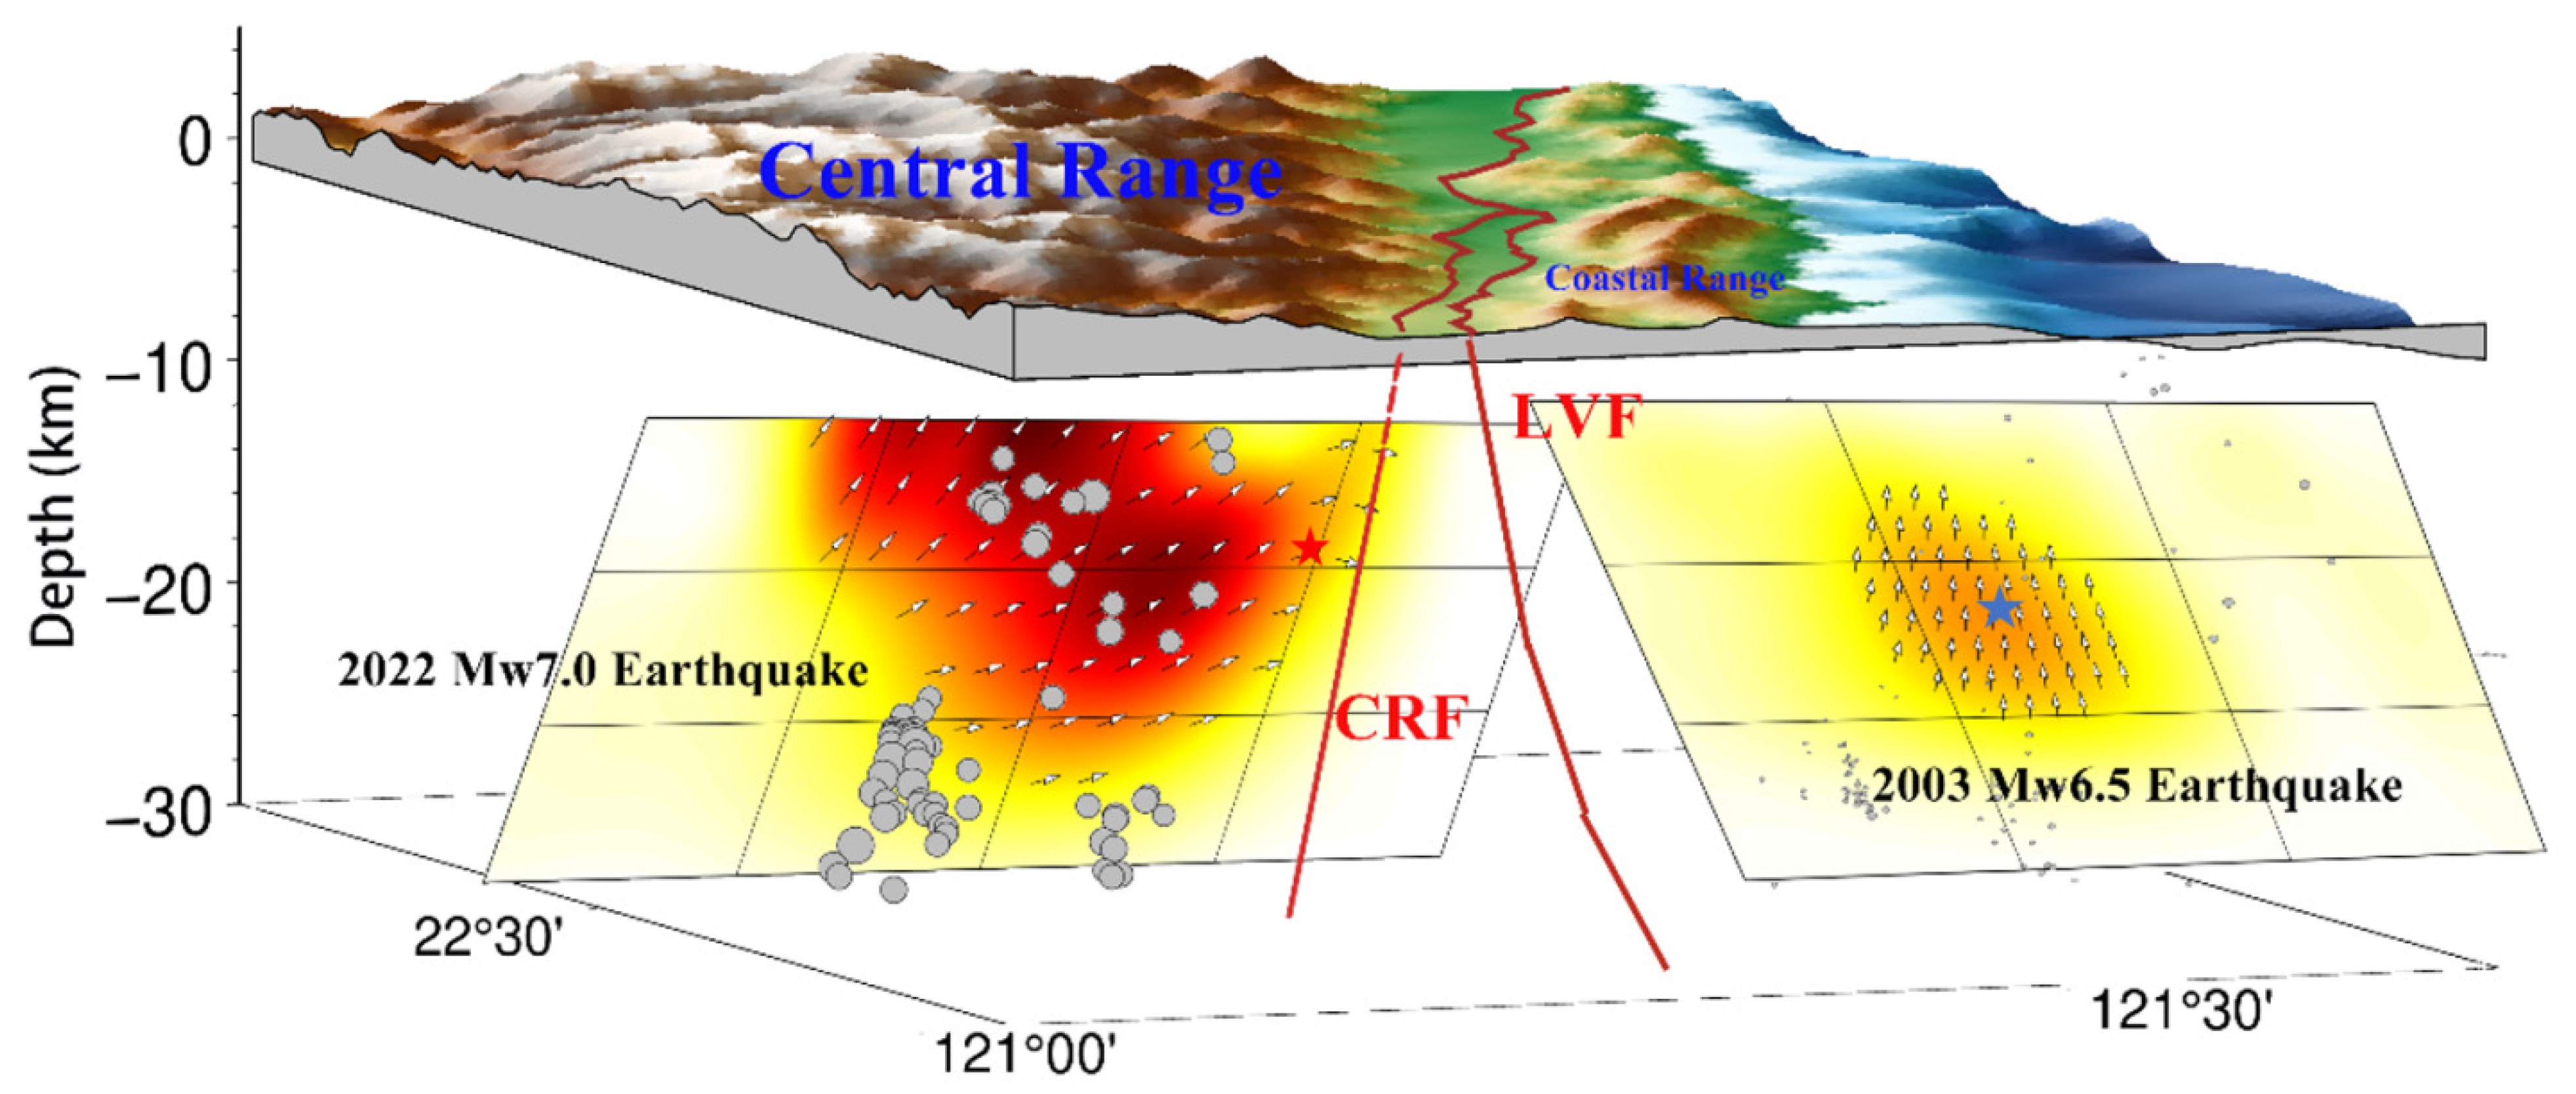
4.2. Seismogenic Structure Analysis

The deformation characteristics of GPS and strong-motion data indicate that the 2022 Mw7.0 earthquake occurred on the LVFZ in Taiwan, with a dominant left-lateral strike-slip mechanism accompanied by a reverse motion. The LVFZ consists of the Longitudinal Valley Fault and the Central Range Fault. The former is an east-dipping fault at the western boundary of the Coastal Range and the eastern boundary of the Longitudinal Valley, while the latter is a west-dipping fault located at the eastern boundary of the Central Range and the western boundary of the Longitudinal Valley, as shown in Figure 9. We obtained the optimal dip angle of 58 degrees to the west using the grid search method, and the fault plane solution provided by the GCMT project also indicated a dip angle of 61 degrees to the west. The earthquake hypocenter provided by the CWB is located west of the Central Range Fault, indicating that the seismogenic fault of this earthquake is the Central Range Fault located at the western boundary of the Longitudinal Valley. Under the background of the oblique convergence between the Philippine Sea Plate and Eurasion Plate, the LVFZ is mainly affected by compression and collision forces. Figure 5b shows that this earthquake caused uplift of the Central Range on the western side of the LVFZ, and a subsidence of the Coastal Range on the eastern side, which cannot be explained by the east-dipping Longitudinal Valley Fault when under compression. From the perspective of regional plate tectonics and the optimal model that was obtained from the inversion of the surface displacement field, the instability and rupture of the Central Range Fault was a result of the northwestward movement of the Philippine Sea Plate and the subsequent compression and collision forces with the Eurasion Plate. Based on the distribution of the aftershocks shown in Figure 1, there were also a few aftershocks on the Longitudinal Valley Fault at the eastern boundary of the Longitudinal Valley, indicating that the Longitudinal Valley Fault also involved rupture and the seismogenic fault of this earthquake was more complex. The determination of the precise location of the seismogenic fault requires further analysis using higher-resolution aftershocks and long-wavelength SAR (Synthetic Aperture Radar) data.

4.3. Characteristics of the Central Range Fault Movement and Strain Partitioning Pattern in the LVFZ

Taiwan has complex tectonics. The Eurasian Plate subducts beneath the Philippine Sea Plate in southeastern Taiwan, while in northeastern Taiwan, it transforms into the Philippine Sea Plate subducting beneath the Eurasian Plate. The LVFZ is one of the main faults that bears nearly half of the convergence rate between the two plates. Therefore, the LVFZ, composed of the Central Range Fault and the Longitudinal Valley Fault, plays a crucial role in regulating the crustal deformation and evolutionary processes of Taiwan. However, the slip partitioning patterns remain unknown, leading to the questions of: (1) What are the similarities and differences in the movement characteristics of the two fault zones that are located so close to each other? and (2) how is the oblique convergence rate between the two plates distributed along these two faults?
The Longitudinal Valley Fault, located on the east side of the LVFZ, has been studied extensively due the availability of long-term monitoring data of the fault, rapid rate of surface creep, and the frequent occurrence of seismic activity, which have led to a better understanding of its movement characteristics. However, the Central Range Fault on the west side of the LVFZ has experienced few earthquakes, and therefore, little is known about its movement characteristics. The Mw7.0 earthquake in 2022 provided a good opportunity to deepen our understanding of the movement characteristics of the Central Range Fault. Figure 6c shows the optimal coseismic slip distribution obtained through joint inversion, indicating that the earthquake was primarily a left-lateral strike-slip, with some local reverse motion. The Mw6.1 Peinan earthquake also occurred along the Central Range Fault, 30 km southwest of the 2022 Mw7.0 earthquake. The focal mechanism solution provided by the USGS indicated that the Peinan earthquake was also a left-lateral strike-slip earthquake, suggesting that the Central Range Fault underwent an oblique slip with the left-lateral strike-slip as the dominant motion under the background of the oblique convergence relationship between the Philippine Sea Plate and the Eurasion Plate. The 2003 Mw6.8 Chengkung earthquake occurred along the Longitudinal Valley Fault, located 15 km east of the 2022 Mw7.0 earthquake. The focal mechanism solution provided by the USGS indicated that the 2003 Chengkung earthquake was a reverse earthquake occurring along the Longitudinal Valley Fault. As shown in Figure 6d, the optimal coseismic slip distribution is dominated by a reverse motion, with a small amount of strike-slip motion. The comparison of the coseismic slip distributions of the 2003 Chengkung earthquake and the 2022 Mw7.0 earthquake is surprising, as the two earthquakes, which occurred so close to each other, have such different focal mechanisms. This suggests that the Central Range Fault and the southern section of Longitudinal Valley Fault play different roles in accommodating the oblique convergence rates between the Philippine Sea Plate and the Eurasion Plate through strain partitioning. The annual slip rate on the southern segment of the Longitudinal Valley Fault between 1990 and 1997 is composed of a reverse component of 1.7 cm/yr, and a left-lateral strike-slip component of 1.4 cm/yr [5]. This indicates that the southern segment of the Longitudinal Valley Fault is dominated by a reverse motion, accompanied with a strike-slip motion. Therefore, it is reasonable to assume that there is a strain partitioning between the Central Range Fault and the Longitudinal Valley Fault when the southern segment of the Longitudinal Valley Fault accommodates the oblique convergence between the Pacific Plate and the Eurasian Plate. The Central Range Fault underwent an oblique slip with a left-lateral strike-slip component as the dominant motion, while the Longitudinal Valley Fault underwent an oblique slip with a reverse motion component as the dominant motion. This situation is also observed along the Lenglongling Fault, located on the northeastern margin of the Qinghai-Tibet Plateau [28]. The Central Range Fault and the Longitudinal Valley Fault jointly play a tectonic suturing role between the Philippine Sea Plate and the Eurasion Plate.

4.4. Insights from Construction

Some people believe that the Taiwan Orogeny is a simple, one-sided thrust structure, formed by the eastward-dipping faults that penetrate the basement rock [29,30]. However, this model struggles to explain the rapid uplift behavior of the Central Range [31]. The westward-dipping fault along the eastern boundary of the Central Range contributes to the uplift of the Central Range, and the exhumation of metamorphic rocks in eastern Taiwan [32]. Although the slip rate of the Central Range fault is not well constrained, the maximum possible slip rate of 12.8 mm/yr may be an overestimation, but it still indicates that the fault plays a crucial role in absorbing the convergence rates and causing the uplift of the Central Range [3]. Since the slip rate of the fault is similar to the exhumation rate of the Central Range over the past few hundred years, slip along the fault appears to be an important component of the range’s exhumation and uplift [31]. Therefore, we believe that the presence of the Central Range fault is important in regulating the uplift of the Central Range, as well as the subsidence of the Coastal Range.

5. Conclusions

In this study, we obtained the surface displacement field of the 2022 Mw7.0 Taiwan earthquake using strong-motion and GPS data and jointly inverted the coseismic slip distribution. The following conclusions are obtained: (1) The displacement obtained from the strong-motion data after the baseline correction through two integrations has a good consistency with the displacement obtained from the GPS data, which indicates the reliability of the displacement obtained from the strong-motion data. (2) The horizontal displacement field generally shows a four-quadrant distribution, indicating the left-lateral strike-slip characteristics of the earthquake. The east and west sides of the LVFZ are dominated by subsidence and uplift, respectively. (3) The seismogenic fault of this 2022 Taitung earthquake was the Central Range Fault, and its characteristic of a dip to west will result in the uplift of the Central Mountain Range and the subsidence of the Coastal Mountain Range. (4) The optimal slip distribution result of the joint inversion shows that this earthquake was a left-lateral strike-slip earthquake, with some thrust motion, with a maximum slip of 2.5 m at a depth of 10 km, which released the energy equivalent to an Mw7.04 earthquake. The Central Range Fault and the Longitudinal Valley Fault experienced oblique slip and were dominated by a strike-slip and a thrust motion, respectively, forming the LVFZ, which bears the convergence of the Philippine Sea Plate and the Eurasian Plate.

Author Contributions

Methodology, C.H.; software, W.W.; data curation, J.-C.H.; writing—original draft, C.H.; writing—review and editing, G.Z. and M.-C.T.; funding acquisition, C.X. All authors have read and agreed to the published version of the manuscript.

Funding

This study was supported by the National Natural Science Foundation of China (Grant No. 41964001), and the Basic Scientific Funding of Institute of Geology, China Earthquake Administration (Grant No. IGCEA2005).

Data Availability Statement

The moment tensor solutions of the 2022 Taiwan earthquake come from the Global Centroid-Moment-Tensor (CMT; https://www.globalcmt.org/, accessed on 15 June 2022). The drawing software uses Generic Mapping Tools (GMT). Strong-motion data and GNSS data are downloaded from the Central Weather Bureau (CWB; https://gdmsn.cwb.gov.tw/, accessed on 20 January 2023).

Conflicts of Interest

The authors declare no competing interest.

References

  1. Toda, S.; Stein, R. Taiwan Earthquake Sequence May Signal Future Shocks. Temblor. 2022. Available online: https://temblor.net/earthquake-insights/taiwan-earthquake-may-have-more-shocks-in-store-14484/ (accessed on 1 January 2023).
  2. Franklin, K.R.; Huang, M.H. Revealing Crustal Deformation and Strain Rate in Taiwan Using InSAR and GNSS. Geophys. Res. Lett. 2022, 49, e2022GL101306. [Google Scholar] [CrossRef]
  3. Shyu, J.B.H.; Sieh, K.; Avouac, J.P.; Chen, W.S.; Chen, Y.G. Millennial slip rate of the Longitudinal Valley fault from river terraces: Implications for convergence across the active suture of eastern Taiwan. J. Geophys. Res. Solid Earth 2006, 111. [Google Scholar] [CrossRef]
  4. Huang, W.J.; Johnson, K.M.; Fukuda, J.I.; Yu, S.-B. Insights into active tectonics of eastern Taiwan from analyses of geodetic and geologic data. J. Geophys. Res. 2010, 115. [Google Scholar] [CrossRef]
  5. Angelier, J.; Chu, H.T.; Lee, J.C. Shear concentration in a collision zone- kinematics of the Chihshang Fault as revealed by outcrop-scale quantification of active faulting, Longitudinal Valley eastern Taiwan. Tectonophysics 1997, 274, 117–143. [Google Scholar] [CrossRef]
  6. Lee, J.C.; Angelier, J.; Chu, H.T.; Yu, S.B.; Hu, J.C. Plate-boundary strain partitioning along the sinistral collision suture of the Philippine and Eurasian plates: Analysis of geodetic data and geological observation in southeastern Taiwan. Tectonics 1998, 17, 859–871. [Google Scholar] [CrossRef]
  7. Thomas, M.Y.; Avouac, J.P.; Champenois, J.; Lee, J.C.; Kuo, L.C. Spatiotemporal evolution of seismic and aseismic slip on the Longitudinal Valley Fault, Taiwan. J. Geophys. Res. Solid Earth 2014, 119, 5114–5139. [Google Scholar] [CrossRef]
  8. Angelier, J.; Chu, H.T.; Lee, J.C.; Hu, J.C. Active faulting and earthquake hazard the case study of continuous monitoring of the Chihshang Fault Taiwan. J. Geodyn. 2000, 29, 151–185. [Google Scholar] [CrossRef]
  9. Lee, J.C.; Angelier, J.; Chu, H.T.; Hu, J.C.; Jeng, F.S.; Rau, R.J. Active fault creep variations at Chihshang, Taiwan, revealed by creep meter monitoring, 1998–2001. J. Geophys. Res. Solid Earth 2003, 108, 25285. [Google Scholar] [CrossRef]
  10. Big, C. The eastern Taiwan Rift. Petrol. Geol. Taiwan 1965, 4, 93–106. [Google Scholar]
  11. Crespi, J.M.; Chan, Y.C.; Swaim, M.S. Synorogenic extension and exhumation of the Taiwan hinterland. Geology 1996, 24, 247–250. [Google Scholar] [CrossRef]
  12. Lee, J.C.; Angelier, J.; Chu, H.T.; Hu, J.C.; Jeng, F.S. Continuous monitoring of an active fault in a plate suture zone: A creepmeter study of the Chihshang Fault, eastern Taiwan. Tectonophysics 2001, 333, 219–240. [Google Scholar] [CrossRef]
  13. Malavieille, J.; Lallemand, S.E.; Dominguez, S.; Deschamps, A. Arc-continent collision in Taiwan: New marine observations and tectonic evolution. Geol. Soc. Am. Spec. Pap. 2002, 358, 189–213. [Google Scholar]
  14. Wu, Y.M.; Chen, Y.G.; Chang, C.H.; Chung, L.H.; Teng, T.L.; Wu, F.T.; Wu, C.F. Seismogenic structure in a tectonic suture zone: With new constraints from 2006 Mw6.1 Taitung earthquake. Geophys. Res. Lett. 2006, 33. [Google Scholar] [CrossRef]
  15. Chen, H.Y.; Hsu, Y.J.; Lee, J.C.; Yu, S.B.; Kuo, L.C.; Jiang, Y.L.; Liu, C.C.; Tsai, C.S. Coseismic displacements and slip distribution from GPS and leveling observations for the 2006 Peinan earthquake (Mw 6.1) in southeastern Taiwan. Earth Planets Space 2009, 61, 299–318. [Google Scholar] [CrossRef]
  16. Yagi, Y.; Okuwaki, R.; Enescu, B.; Lu, J. Irregular rupture process of the 2022 Taitung, Taiwan, earthquake sequence. Sci. Rep. 2023, 13, 1107. [Google Scholar] [CrossRef]
  17. Lee, S.J.; Liu, T.Y.; Lin, T.C. The role of the west-dipping collision boundary fault in the Taiwan 2022 Chihshang earthquake sequence. Sci. Rep. 2023, 13, 3552. [Google Scholar] [CrossRef] [PubMed]
  18. Chang, C.-P.; Angelier, J.; Huang, C.-Y. Origin and evolution of a melange: The active plate boundary and suture zone of the Longitudinal Valley, Taiwan. Tectonophysics 2000, 325, 43–62. [Google Scholar]
  19. Hsu, Y.J.; Simons, M.; Yu, S.B.; Kuo, L.C.; Chen, H.Y. A two-dimensional dislocation model for interseismic deformation of the Taiwan mountain belt. Earth Planet. Sci. Lett. 2003, 211, 287–294. [Google Scholar] [CrossRef]
  20. Shyu, J.B.H.; Chung, L.H.; Chen, Y.G.; Lee, J.C.; Sieh, K. Re-evaluation of the surface ruptures of the November 1951 earthquake series in eastern Taiwan, and its neotectonic implications. J. Asian Earth Sci. 2007, 31, 317–331. [Google Scholar] [CrossRef]
  21. Sboras, S.; Lazos, I.; Bitharis, S.; Pikridas, C.; Galanakis, D.; Fotiou, A.; Chatzipetros, A.; Pavlides, S. Source modelling and stress transfer scenarios of the October 30, 2020 Samos earthquake: Seismotectonic implications. Turk. J. Earth Sci. 2021, 30, 699–717. [Google Scholar] [CrossRef]
  22. Yi, L.; Xu, C.; Zhang, X.; Wen, Y.; Jiang, G.; Li, M.; Wang, Y. Joint inversion of GPS, InSAR and teleseismic data sets for the rupture process of the 2015 Gorkha, Nepal, earthquake using a generalized ABIC method. J. Asian Earth Sci. 2017, 148, 121–130. [Google Scholar] [CrossRef]
  23. Toda, S.; Enescu, B. Rate/state Coulomb stress transfer model for the CSEP Japan seismicity forecast. Earth Planets Space 2011, 63, 171–185. [Google Scholar]
  24. Chen, H.Y.; Yu, S.B.; Kuo, L.C.; Liu, C.C. Coseismic and postseismic surface displacements of the 10 December 2003(MW 6.5) Chengkung, eastern Taiwan, earthquake. Earth Planets Space 2006, 58, 5–21. [Google Scholar] [CrossRef]
  25. Seitz, M.; Angermann, D.; Blossfeld, M.; Gerstl, M.; Schmid, R. 2014 ITRS realization of DGFI: DTRF2014. In Proceedings of the EGU General Assembly 2015, Vienna, Austria, 12–17 April 2015. [Google Scholar]
  26. Okada, Y. Surface deformation due to shear and tensile faults in a half-space. Bull. Seismol. Soc. Am. 1985, 75, 1135–1154. [Google Scholar]
  27. Wang, R.; Parolai, S.; Ge, M.; Jin, M.; Walter, T.R.; Zschau, J. The 2011 M w 9.0 Tohoku earthquake: Comparison of GPS and strong-motion data. Bull. Seismol. Soc. Am. 2013, 103, 1336–1347. [Google Scholar] [CrossRef]
  28. Huang, C.; Zhang, G.; Zhao, D.; Shan, X.; Xie, C.; Tu, H.; Qu, C.; Zhu, C.; Han, N.; Chen, J. Rupture Process of the 2022 Mw6. 6 Menyuan, China, Earthquake from Joint Inversion of Accelerogram Data and InSAR Measurements. Remote Sens. 2022, 14, 5104. [Google Scholar] [CrossRef]
  29. Davis, D.; Suppe, J.; Dahlen, F.A. Mechanics of fold-and-thrust belts and accretionary wedges. J. Geophys. Res. 1983, 88, 1153–1172. [Google Scholar] [CrossRef]
  30. Carena, S.; Suppe, J.; Kao, H. Active detachment of Taiwan illuminated by small earthquakes and its control of first-order topography. Geology 2002, 30, 935–938. [Google Scholar] [CrossRef]
  31. Bruce, J.; Shyu, H.; Sieh, K.; Chen, Y.G.; Chung, L.H. Geomorphic analysis of the Central Range fault, the second major active structure of the Longitudinal Valley suture, eastern Taiwan. Geol. Soc. Am. Bull. 2006, 118, 1447–1462. [Google Scholar] [CrossRef]
  32. Willett, S.D.; Brandon, M.T. On steady states in mountain belts. Geology 2002, 30, 175–178. [Google Scholar] [CrossRef]
Figure 1. (a) Map showing the main tectonic elements in Taiwan. (b) For the area marked by the red rectangle in (a), the red pentagram represents the Mw7.0 main shock that occurred on 18 September 2022, and the blue pentagram represents the M6.6 foreshock that occurred on 17 September 2022. The gray circle represents the aftershocks of the earthquake sequence in 2022. The blue circle represents historical earthquakes. The black beach ball represents the focal mechanism of earthquakes. The black arrow shows the convergence rate between the Eurasian Plate and the Pacific Plate [18]. CRF: Central Range fault, LVF: Longitudinal Valley Fault.
Remotesensing 15 04868 g001
Figure 2. Baseline correction of strong-motion data for the station G020. (a) Uncorrected acceleration waveform, (b) velocity waveform with dotted line indicating uncorrected and solid line indicating baseline-corrected data, and (c) the displacement waveform with dotted line indicating uncorrected and solid line indicating baseline-corrected data.
Remotesensing 15 04868 g002
Figure 3. Comparison between static displacements of GPS data and the strong-motion data after baseline correction. Every three pairs of bars in the figure represent a comparison between a very close pair of strong-motion stations and GPS stations. The pink color represents the static displacement of the strong-motion data, and the green color represents the static displacement of the GPS data.
Remotesensing 15 04868 g003
Figure 4. Coseismic displacement field of the ground surface. (a) The coseismic displacement field in the horizontal direction, and (b) the coseismic displacement field in the vertical direction. The red arrow represents the displacements that were obtained based on the strong-motion data, and the blue arrow represents the calculated displacement based on the GPS data. The black line represents the Longitudinal Valley Fault zone. The green line represent the fault model used to invert.
Remotesensing 15 04868 g004
Figure 5. (a) The inclination angle with west-dipping faults represented on the horizontal axis, where 90 represents an inclination angle of 90°, less than 90° represents a west-dipping fault, and greater than 90° represents an east-dipping fault. The vertical axis represents the residual value of the fitting. (b) The smoothing factor on the horizontal axis, where the blue curve represents the roughness and the red curve represents the residual value of the fitting. The red dot represents the optimal location.
Remotesensing 15 04868 g005
Figure 6. Fault surface slip distribution map. (a) The inversion results using only the strong-motion data, (b) the inversion results using only the GPS data, (c) the inversion results combining both types of data, and (d) the coseismic slip distribution based on inversion of the GPS data for the 2003 Chengkung earthquake. The red pentagon represents the location of the hypocenter. The white arrows represents the direction in which the subfault slip.
Remotesensing 15 04868 g006
Figure 7. Comparison between observed data and simulated data based on the joint inversion model. (a) The coseismic displacement field in the horizontal direction, and (b) the coseismic displacement field in the vertical direction. The red arrow represents the observed data, and the blue arrow represents the simulated data. The black line represents the Longitudinal Valley Fault zone. The green line represent the fault model used to invert.
Remotesensing 15 04868 g007
Figure 8. Slip distribution resolution test. (a) The input slip distribution, (b) the inversion results based on the strong-motion network, (c) the inversion results based on the GPS network, and (d) the joint inversion results based on both data types. The blue star represents the hypocenter of earthquake. SM: strong motion; GPS: Global Positioning System.
Remotesensing 15 04868 g008
Figure 9. Spatial position relationship between the Central Range and Longitudinal Valley Faults. The fault on the eastern boundary of the Central Range is the Central Range Fault, with the red dotted line indicating that the fault does not exposed to the surface, and the fault on the western boundary of the Coastal Range is the longitudinal valley fault. The red and blue stars indicate the hypocenter of the 2022 Mw7.0 earthquake and the 2003 Mw6.5 earthquake, respectively. CRF: Central Range Fault, LVF: Longitudinal Valley Fault.
Remotesensing 15 04868 g009
Disclaimer/Publisher’s Note: The statements, opinions and data contained in all publications are solely those of the individual author(s) and contributor(s) and not of MDPI and/or the editor(s). MDPI and/or the editor(s) disclaim responsibility for any injury to people or property resulting from any ideas, methods, instructions or products referred to in the content.

