Article

Characteristics of Regional GPS Crustal Deformation before the 2021 Yunnan Yangbi Ms 6.4 Earthquake and Its Implications for Determining Potential Areas of Future Strong Earthquakes

1
State Key Laboratory of Earthquake Dynamics, Institute of Geology, China Earthquake Administration, Beijing 100029, China
2
Key Laboratory of Orogenic Belts and Crustal Evolution, Ministry of Education, School of Earth and Space Sciences, Peking University, Beijing 100871, China
3
School of Surveying and Geoinformation Engineering, East China University of Technology, Nanchang 330013, China
4
Nanjing Zhixing Map Information Technology Co., Ltd., Nanjing 210023, China
*
Author to whom correspondence should be addressed.
Remote Sens. 2023, 15(12), 3195; https://doi.org/10.3390/rs15123195
Submission received: 25 May 2023 / Revised: 14 June 2023 / Accepted: 16 June 2023 / Published: 20 June 2023
(This article belongs to the Special Issue Monitoring Subtle Ground Deformation of Geohazards from Space)

Abstract

:
The 2021 Yangbi Ms 6.4 earthquake in Yunnan, China, occurred in an area where the Global Positioning System (GPS) geodetic observations are particularly intensive. Based on a detailed retrospective analysis of the GPS observations of about 133 stations distributed in the proximately 400 km × 400 km region that contains the area affected by the earthquake., we obtain a high-resolution GPS velocity field and strain rate field and then derive the present-day slip rates of major faults in the region with the commonly used half-space elastic dislocation model and constraints from the GPS velocity field. Furthermore, by calculating the seismic moment accumulation and release and deficit rates in the main fault segments and combining with the distribution characteristics of small earthquakes, we evaluate the regional seismic risk. The results show that (1) there was a localized prominent strain accumulation rate around the seismogenic area of the impending Yangbi Ms 6.4 earthquake, although this was not the only area with a prominent strain rate in the whole region. (2) The seismogenic area of the earthquake was just located where the strain direction was deflected, which, together with the localized outstanding maximum shear strain and dilatation rates, provides us with important hints to determine the potential areas of future strong earthquakes. (3) Of all the seismogenic fault segments with relatively high potentials, judged using the elapsed time of historical earthquakes and effective strain accumulation rate, the middle section of the Weixi–Qiaohou fault has a higher earthquake risk than the southern section, the Midu–Binchuan section of the Chenghai fault has a higher risk than the Yongsheng section and the Jianchuan section of the Jianchuan–Qiaohou–Lijiang–Xiaojinhe fault has a higher risk than the Lijiang section.

1. Introduction

On 21 May 2021, a powerful earthquake with a magnitude of 6.4 struck Yangbi County, Dali Prefecture, Yunnan Province, China, resulting in three deaths and serious damage to some buildings. Judging from the distribution of aftershocks and the results of the GPS co-seismic deformation field, the seismogenic fault is nearly parallel to the west side of the Weixi–Qiaohou fault. The rupture direction is NW and the rupture pattern is dextral strike–slip and slight tension, with a rupture length of 15–20 km. There is a significant deviation of about 5 km from the surface trace of the Weixi–Qiaohou fault, which is a NW-trending secondary fault or buried fracture [1,2,3,4].
From the regional tectonic background (Figure 1), the earthquake area is located in the tectonic dispersion bifurcation area at the northern end of the Red River fault zone, which is densely covered with a series of quaternary active faults of various sizes. The results of geological surveying and research show that the main active faults in the late Pleistocene or Holocene in this region generally show weak slip rates, with typical values within 2 mm/yr, such as the NW-trending Weixi–Qiaohou fault, Nanjian–Weishan fault and Dali–Eryuan fault, and the NE-trending Chenghai fault, Heqing–Eryuan fault, Jianchuan–Qiaohou fault and Lijiang–Xiaojinhe fault [5]. The current GPS crustal deformation observations also reflect that the largest principal strain rate, shear strain rate and surface dilatation rates in the region are 40–50, 20–30 and 20–30 nano strain/yr, respectively [6,7], which is complementary to the low slip rate of regional faults.
According to the historical earthquake catalogue, there were four earthquakes with M ≥ 7.0 in the affected area of the Yangbi Ms 6.4 earthquake from 1900 to 2020, including the Dali Ms 7.0 earthquake in 1925, Longling Ms 7.3 and M7.4 earthquakes in 1976 and Lijiang Ms 7.0 earthquake in 1996. In the same period, there were about 120 earthquakes with M ≥ 5.0. The distribution of these moderate to strong earthquakes shows a large dispersion, and there is no obvious correlation with the spatial distribution of the main faults. Therefore, it is difficult to determine the location of strong earthquakes based on active faults in the seismic hazard assessment of this region.
This study attempts to analyze the characteristics of regional crustal deformation before the Yangbi earthquake from the perspective of GPS crustal deformation, and then analyze the background crustal deformation field characteristics of the location of regional strong earthquakes (especially the Yangbi earthquake). Based on these analyses, combined with the results of tectonic geology and geophysics studies, the potential locations of future strong earthquakes in this region are speculated and delineated.

2. GPS Observation Data and Data Processing

The ‘Crustal Movement Observation Network of China’ [10] and the second phase of the project ‘Continental Tectonic Environment Monitoring Network of China’ [11] were major national scientific projects during the ‘Ninth Five-Year Plan’ period in China. These projects provide large-scale and high-precision GPS crustal deformation observation data for the region. Wang and Shen [6] published the most intensive horizontal velocity field results of crustal movement in mainland China and its surrounding areas after processing the GPS observation data of the ‘China Crustal Movement Observation Network’ (Phase I and II) and other projects for many years. This paper will directly use the velocity field data in the study area. In addition, since 2017, we have deployed a dense GPS observation array with an average station spacing of less than 15 km within a range of about 50 km around Eryuan County, Dali Prefecture, including 34 continuous GPS observation stations [4,12], of which 28 stations had accumulated more than three years of observation data before the 2021 Yangbi earthquake. The combination of the ‘China Crustal Movement Observation Network’ (Phase I and II) and our GPS observation array can enable us to produce a regional GPS crustal movement velocity field with high temporal-spatial resolution.
For the GPS observation data of the 30 s sampling rate of the self-built observation network, we adopt one of the commonly used strategies around the world. First, we use the GIPSY/OASIS (Version 6.0) [13] software of the NASA Jet Propulsion Laboratory (JPL, NASA) and the PPP (precise point positioning) model [14] to perform rigorous processing of the daily 24 h period to obtain daily coordinate solutions with loose constraints. Then, st_filter (spatio-temporal filtering, an upgraded version of QOCA) [15] is used to jointly solve the daily loose constraint solutions of all stations to form a set of internally consistent and unified solutions. Finally, we use the Helmert transformation to shift and rotate the daily solutions of local stations to the ITRF2014 reference frame (International Terrestrial Reference Frame) [16]. In the data processing, we set up linear combinations to eliminate the effects of the ionosphere, with a satellite elevation angle of 15°, using precise ephemeris, the FES2004 model for ocean tide correction and GPT2 and GMF for the tropospheric wet delay model and mapping function, respectively. We also consider the effects of clock bias, phase center errors (antenna and satellite), etc. Ultimately, we obtain the coordinate time series of each station in the ITRF2014 reference frame.
The velocity values of each observation station are obtained through linear least squares fitting of the time series. Then, the fitted velocity values of each station are integrated into the velocity field of Wang and Shen [6] through five public stations (YNLJ, YNYL, XIAG, H204, H323) as a ‘bridge’ to generate a unified GPS velocity field. The following are the specific implementation methods for integrating velocity fields:
  • Normalize the collected velocity vector data into a unified recording format;
  • Find the common data points and ‘quasi common points’. The former refers to a point where the station name or point coordinates completely coincide; the latter refers to two points on the same tectonic block that are not completely coincident in coordinates, but are not far apart (within a few tens of meters);
  • Solve the Euler vector of the difference of the velocity vector at common stations. The least squares method is used to solve the Euler rotation parameters based on the best fit of all common or “quasi common” velocity difference vectors;
  • Eliminate outliers. For stations with large fitting residuals (greater than 2 times the mean square error), remove them and repeat step 3 until all residuals meet the requirements.
After merging the two sets of velocity fields, the velocity of all common points is the weighted average of the two data sets. Finally, the horizontal crustal movement velocity field is formed under the stable Eurasian reference frame (Table 1; Figure 2).

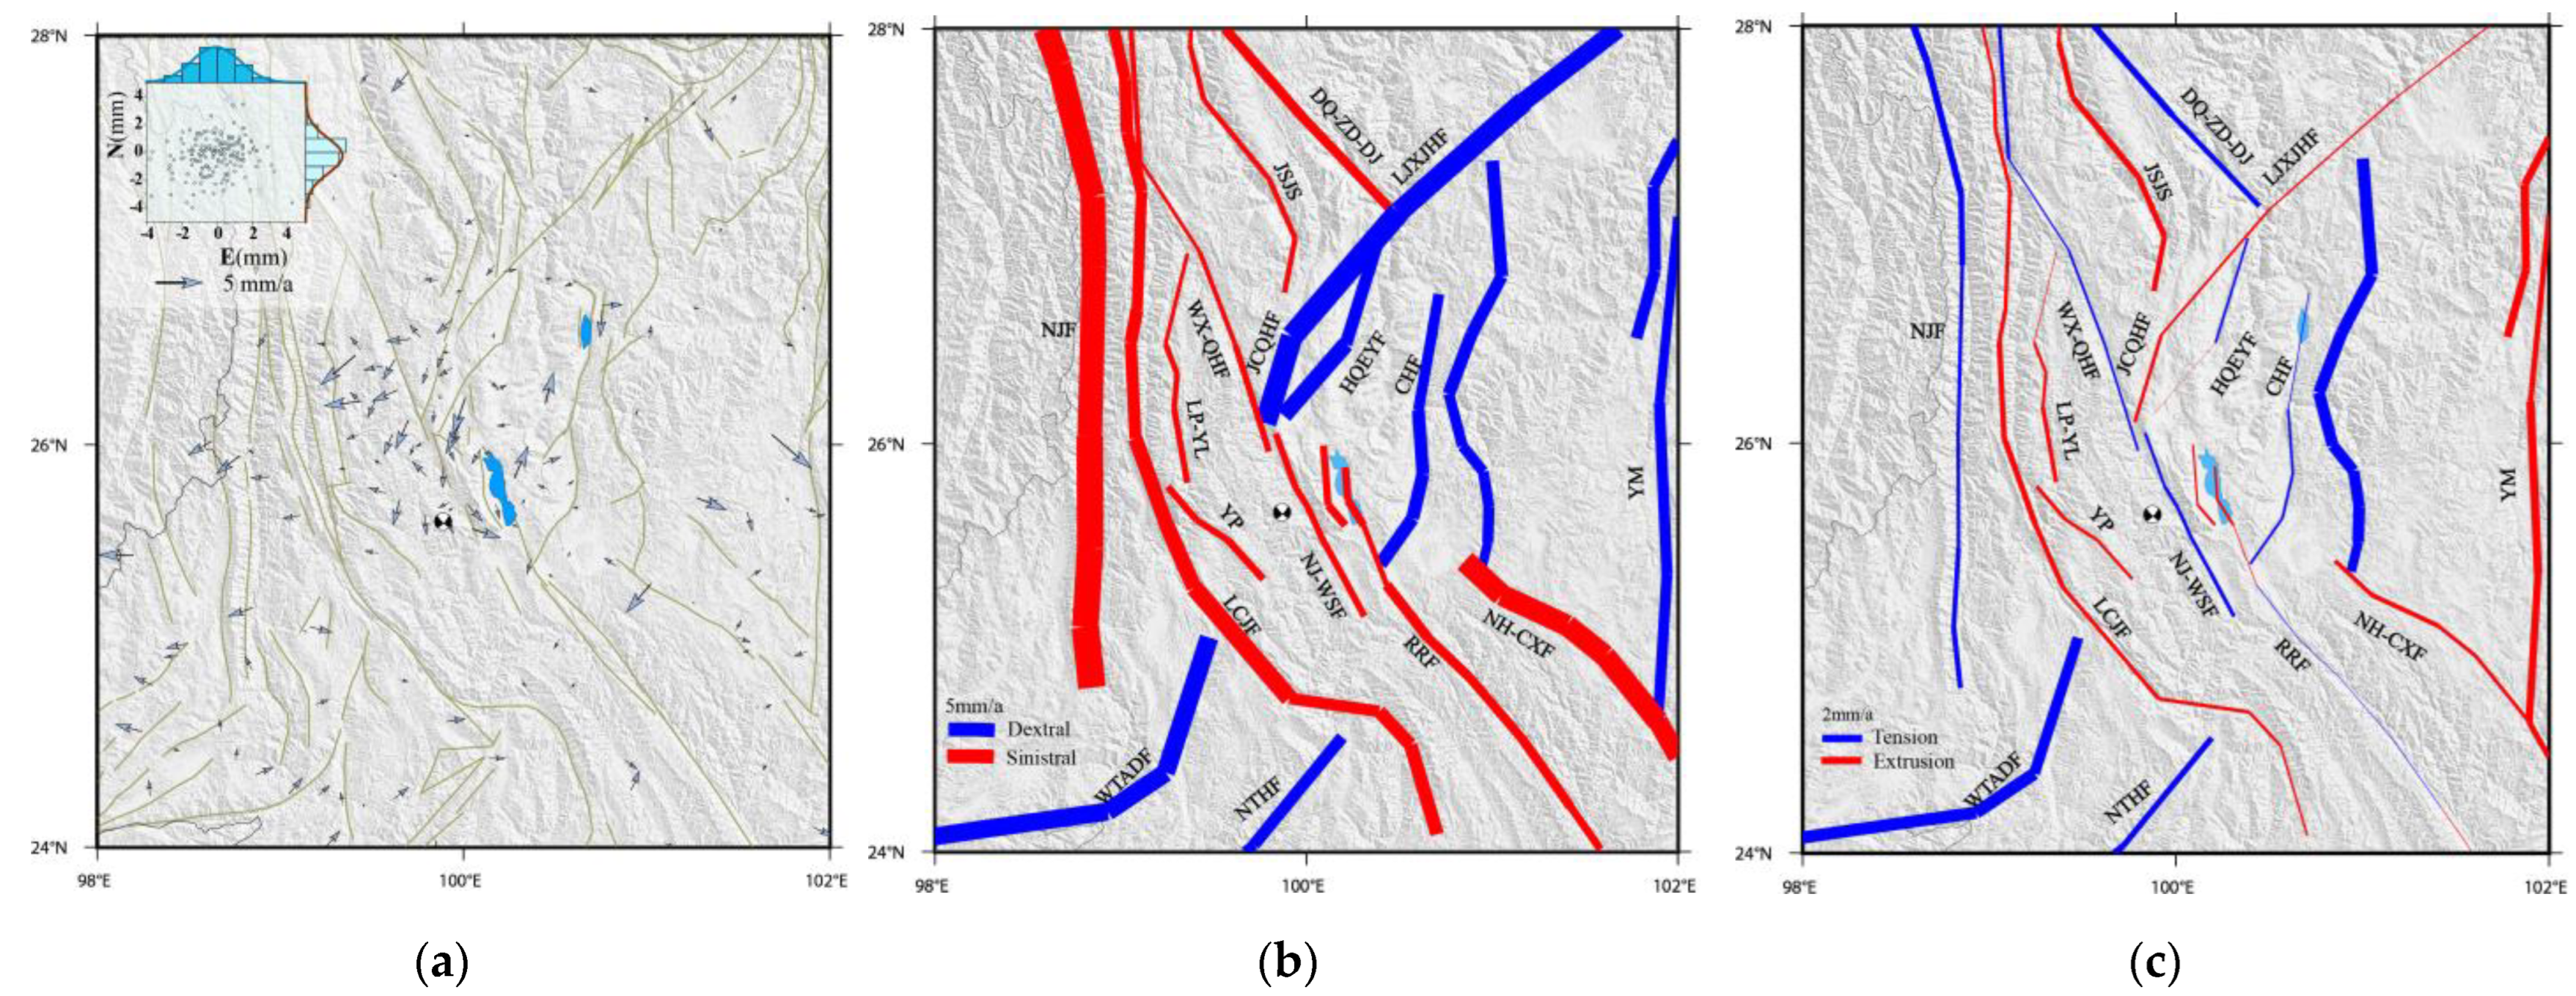
3. Regional Crustal Strain Rate Field and Its Characteristics before Earthquake

Compared with the GPS velocity field, the GPS strain rate field does not depend on the reference frame, so it can reflect the tension, compression, shear of regional crustal deformation more intuitively and sensitively. There are many velocity interpolation methods to calculate strain rate fields, such as the least square collocation method, distance weighting method, polyhedral function method, tension spline method, Kriging interpolation method and multi-scale wavelet method [17,18,19,20,21,22,23,24]. Although these methods may produce slightly different results due to different assumptions, the differences are insignificant. This will not have a substantial impact on the analysis of the characteristics of the regional crustal strain field. In this study, we employ the VISR (velocity interpolation for strain rate) method proposed by Shen et al. [19]. This method uses the improved least squares algorithm and the spatial weighting function to model the strain as a continuous function and re-weights the data to give more weight to the stations near the interpolation points. The VISR method does not depend on the assumption of a homogeneous and isotropic deformation field or the geometry of stations near the interpolation point. The smoothing distance can be determined based on site density, which can better balance the stability and resolution to maximize the utilization of GPS observations, and then present more detailed strain field features. However, a critical step in this method is to select an appropriate weight threshold (Wt), which determines the smoothness of the strain rate field. To strike a balance between the resolution and robustness of the strain rate field, we tested various weighted thresholds and selected Wt = 24 as the optimal parameter to characterize the strain rate field in the study area of 0.2° × 0.2° regular grids. Employing the strain estimation strategy outlined above, we calculated the strain rate parameters of each grid area to obtain the strain rate field. Figure 3 shows that the effective spatial resolution of the strain rate field in the Yangbi earthquake area can reach 30–40 km.
The principal strain rate field (Figure 4a) indicates that the Yangbi earthquake is situated in the region with the highest principal strain values along the Weixi–Qiaohou–Weishan–Red River fault. The tectonic environment of this area is characterized by evident EW extension (48.5 nano strain/yr) and weak SN compression (−23.7 nano strain/yr). Decomposing the principal strain into the parallel and perpendicular components of the seismogenic fault, the dextral and extensional tectonic stress (strain) background of the seismogenic fault can be seen, which is consistent with the dextral and extensional rupture dislocation reflected by the coseismic deformation of the Yangbi earthquake [4], suggesting that the characteristics of the crustal deformation field before the earthquake give a clear indication of the future seismic rupture mode.
From west to east of the study area, the principal tensile strain direction gradually changes from NW-SE to NE-SW. The principal compressive strain direction also gradually transitions from NE-SW to NW-SE. The Yangbi earthquake is in the deflection area where the principal strain direction changes, indicating that the properties of crustal strain (stress) movement in this area differ from the surrounding area. The maximum shear strain rate along the fault can directly reflect the magnitude of the shear deformation of the fault, so it can be used to quantitatively determine the magnitude of the fault strike–slip motion. The maximum shear strain rate field (Figure 4a) and the principal strain field show that the Weixi–Qiaohou fault, Jianchuan–Qiaohou fault, Heqing–Eryuan fault, Lijiang–Xiaojinhe fault and Chenghai fault are located in the high shear strain rate area. Moreover, the Yangbi earthquake occurred at the junction of the edge of the high shear strain zone and the Red River fault, which is consistent with the previous understanding that earthquakes usually occur at the edge of the high-value area of the large-scale horizontal strain rate zones that are consistent with the tectonic deformation background [25,26]. The surface dilatation rate field (Figure 4b) shows two high-value areas in the study region, with the Yangbi earthquake located in one of them, close to the intersection edge of surface expansion and compression. The rotation rate field (Figure 4c) demonstrates the presence of an obvious rotation difference boundary in the study area, with the rotation rates on both sides of this boundary being significantly different, forming two distinct rotation units. The Yangbi earthquake occurred in the transition zone from high rotation rate to low rotation rate, indicating that it occurred in the area where the rotation rates on the east and west sides differ significantly.

4. GPS-Constrained Inversion of Regional Main Fault Slip Rate

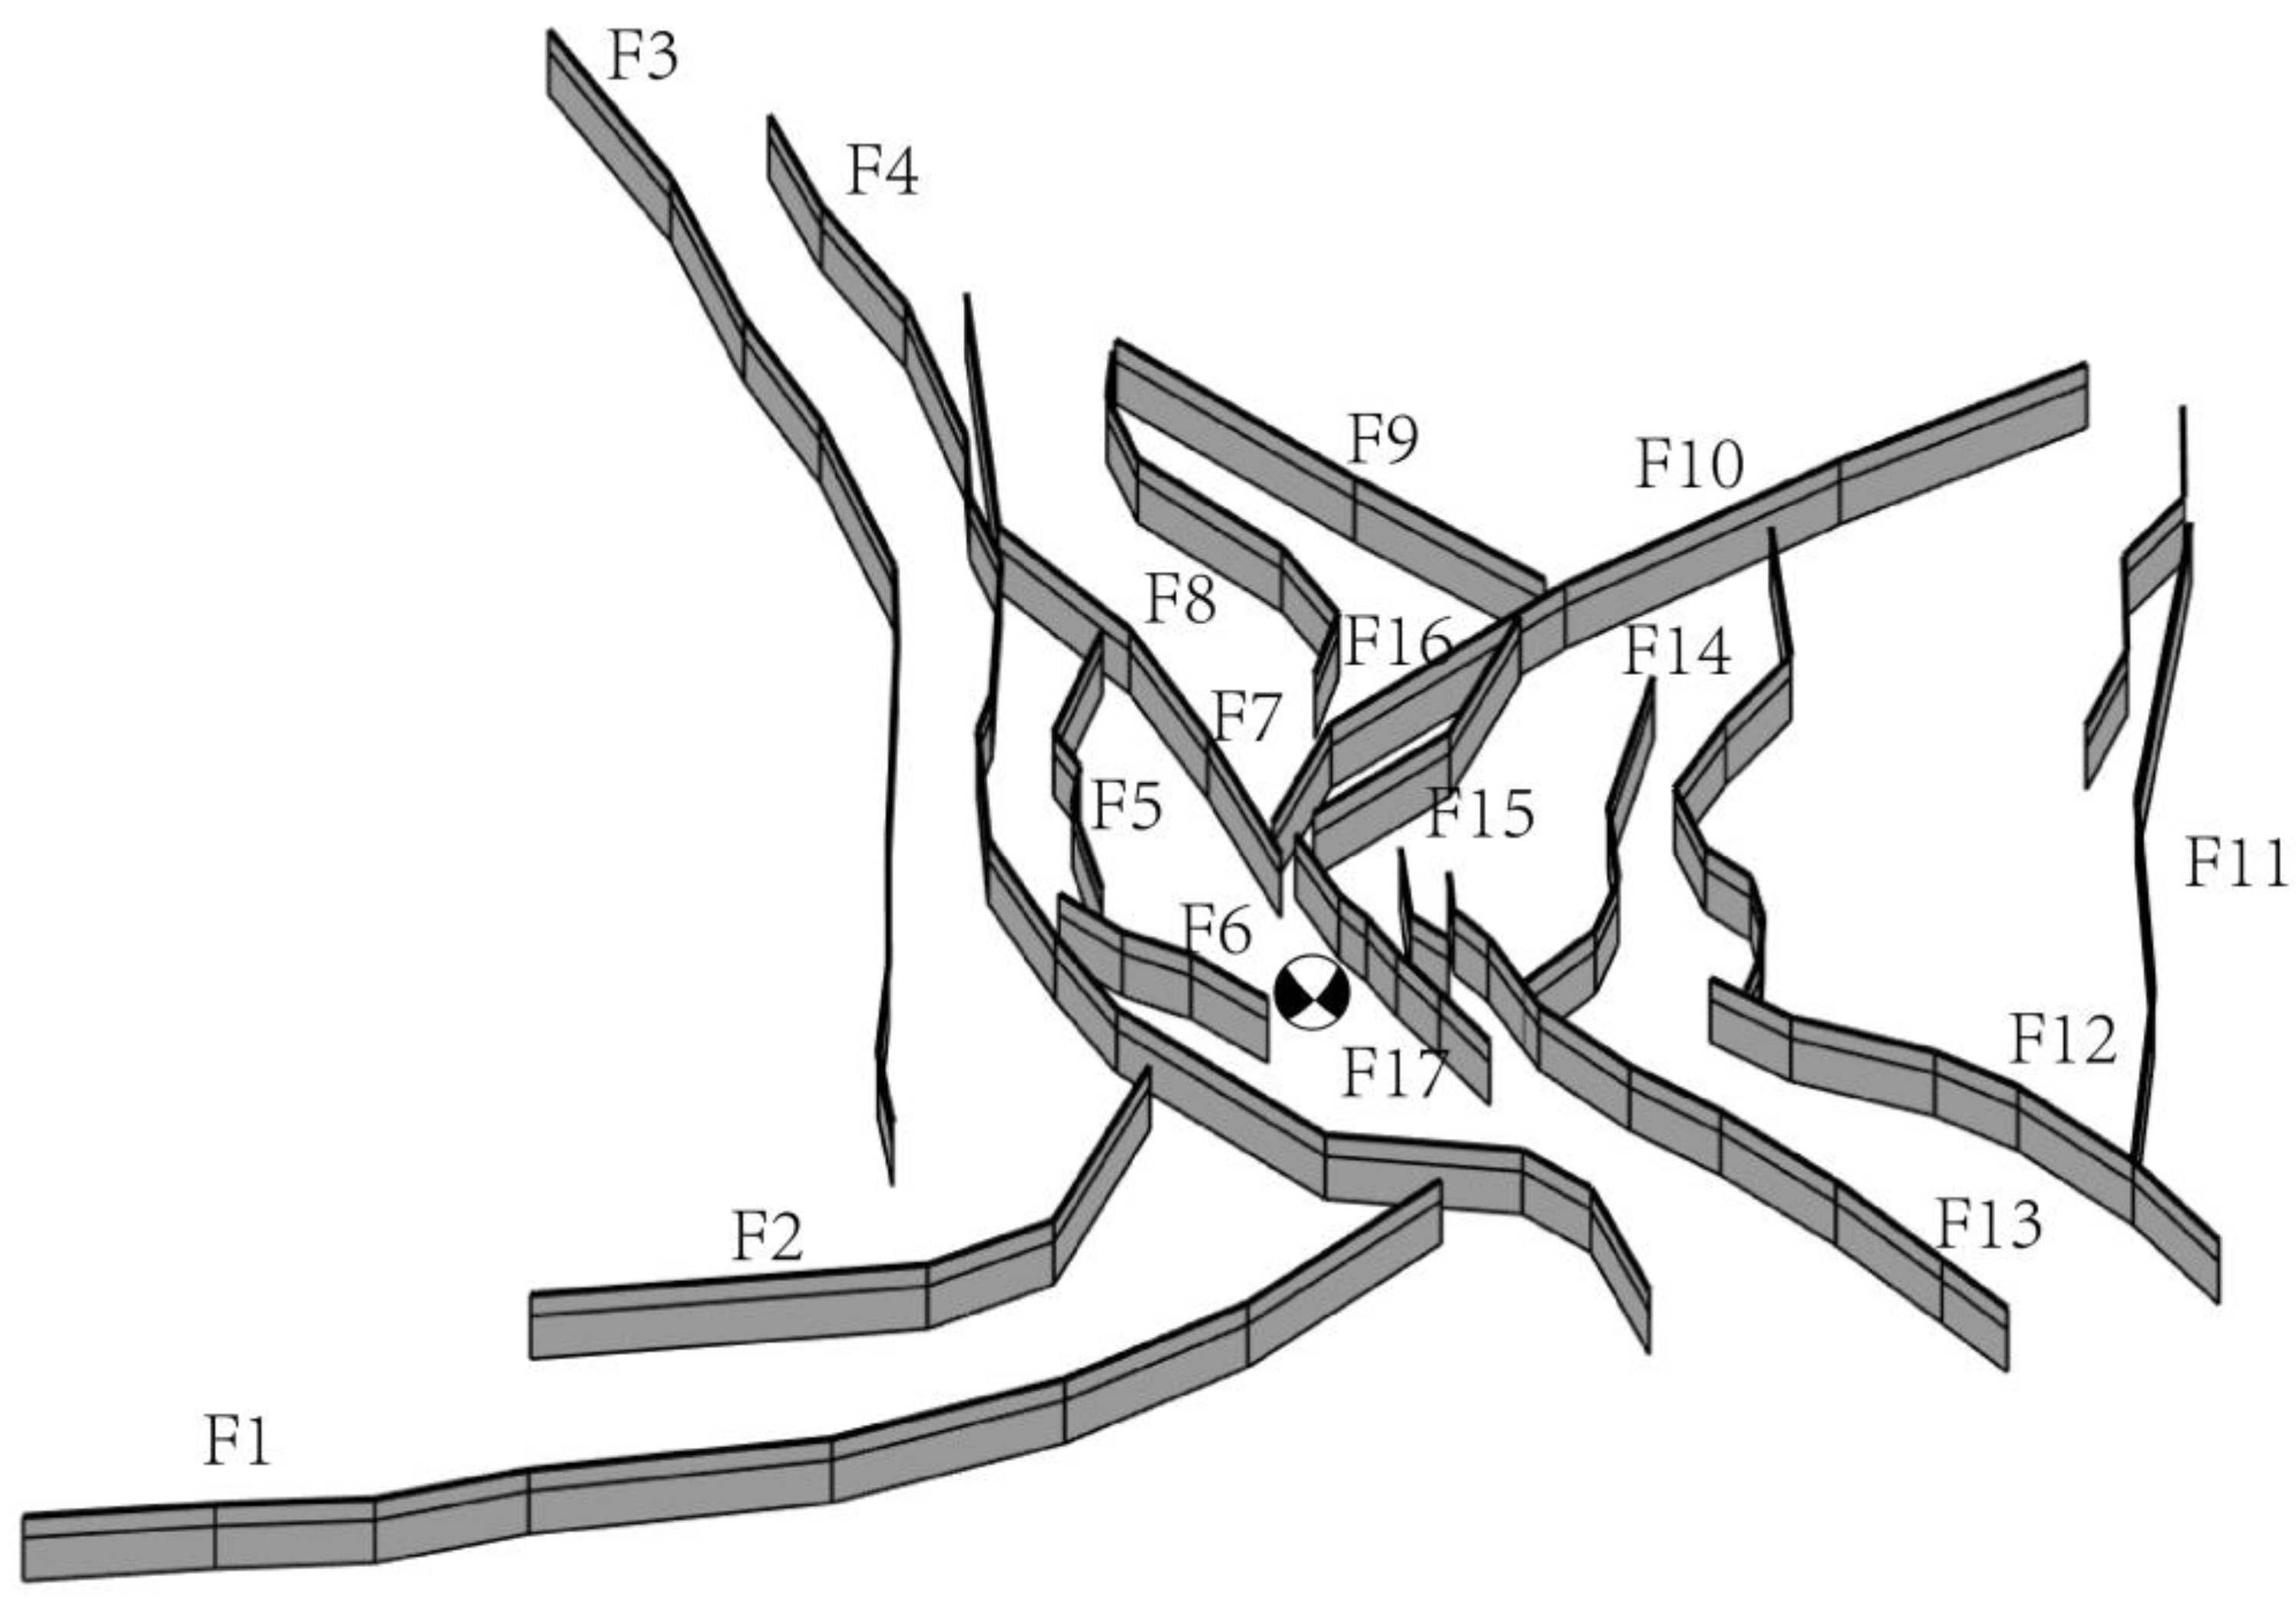
4.1. Construction of Regional Main Fault Geometry Model

In seismic hazard assessment, the fault slip rate is a critical parameter. To accurately determine the slip rate of the primary active faults in the study area, we selected the main complex small and large faults in the region that needed consideration and geometrically modeled them. Based on the deformation model of thick lithosphere fracture proposed by Savage et al. [27], each fracture was represented as a geometric and kinematic pattern of ‘segmented link, upper locking and lower infinite deep uniform sliding.’ It was assumed that the regional crust deformation resulted from the continuous sliding of the primary faults under the locking layer. This geometric model of fault movement has been widely adopted globally to explain the relationship between the GPS crustal deformation field and fault movement [17,27,28].
The main fault geometry models we constructed are shown in Figure 5 and Table 2. These models serve as the basis for inverting the fault (segment) slip rate via GPS velocity field constraint. During the model establishment, we assumed that the fault plane was vertical, mainly based on the following considerations: most faults had high uncertainty in their deep geometry, and there were few data on the fault dip angle. Moreover, the fault shape was complex and could not be accurately described by only the fault dip angle. Therefore, considering the influence of the fault dip angle in the model may increase the uncertainty of the model, and the improvement of the model itself may not be noticeable. Thus, we set all fault dip angles to 90° in the model. The fault slip rate obtained in this study includes the strike–slip component and compression/tension component. The compression/tension component on the vertical fault can approximate the thrust/normal fault effect on the non-vertical fault plane. Similar assumptions have been adopted in many previous studies and have been well applied [17,29,30,31,32].
Regarding the locking depth, previous research has shown that M ≥ 2.5 earthquakes in the southeastern margin of the Tibetan Plateau mainly occur above 25 km [28]. Liu [33] calculated the seismic depth of the northwestern Yunnan region to be above 20 km through seismic relocation. Within this seismic depth range, setting 25 km as the a priori value of the locking depth is reasonable.

4.2. GPS-Constrained Inversion Method of Fault Slip Rate

Based on the “three-dimensional fault dislocation model in semi-infinite elastic space”, the slip rate of main faults (segments) is inversed with the constraint of the GPS crustal movement velocity field [34,35,36,37,38]. The concise principle is that if there are multiple rectangular fault sliding plates, where the strike–slip and dip–slip motion parameters of each rectangular plate are D S D D i , respectively, then the three-component deformation values U X U Y U Z P of any point P in space caused by fault dislocation can be expressed as
U X U Y U Z P = i n G XS G XD G YS G YD G ZS G ZD i × D S D D i = i n G i × D S D D i
where the matrix G i is Green’s function matrix, which describes the three-component deformation value of the unit strike–slip and dip–slip at the point of the ith fault segment. As long as the geometric parameters of the point and the fault section are determined, the G i is uniquely determined. Clearly, for the fault dislocation model, the three-component deformation value caused by a series of fault dislocations at a point is a linear function of the motion parameters of each fault segment, and the coefficients in the linear function are uniquely determined using the geometric parameters of the point and the fault segment. Therefore, the displacement of a point on the ground is the simple superposition of the displacements caused by the sliding of these rectangular surfaces at each point.
For the inversion problem, when the three-dimensional velocity components of the GPS observation points and the geometric parameters of the fault are known, the dislocation slip rate of the fault segment can be obtained through inversion according to the least squares fitting principle [17,28].

4.3. Inversion Results

The results of fault slip rate inversion based on the Okada fault dislocation model are shown in Table 2 and Figure 6b,c. The fitting residuals (Figure 6a) show that the residual values of the model are almost less than 2 mm/yr, except for a few points on the edge of the model. Overall, the SE-trending faults in the study area show right-lateral strike–slip characteristics, and the NW-trending faults show left-lateral strike–slip characteristics, consistent with previous research results [31,32]. Below, we will briefly analyze the inversion results of the main faults in the study area.
The Nujiang fault zone is a large-scale regional deep fault, and its right-lateral slip rate and tensile rate are 5.5 ± 1.1 mm/yr and 2.2 ± 1 mm/yr, respectively. This agrees with the 4.3–6.4 mm/yr results from Wang et al. [39] based on GPS profiles. The inversion results of the average right-lateral slip rate and compression rate of the northern segment of the Lancangjiang fault are 3.3 ± 0.8 mm/yr and 1.0 ± 0.7 mm/yr, respectively, which are consistent with the results obtained by Wang et al. [31] based on the fault element connection model.
The Wanding fault is an essential arc-shaped fault in southwestern Yunnan [40], where there have been many moderate to strong earthquakes in history. The inversion left-lateral slip and tensile rates are 4.6 ± 1 mm/yr and 2.9 ± 1 mm/yr, respectively. This is slightly larger than the 1.7~3 mm/yr obtained by Chang et al. [40] and Wu et al. [5] based on a field investigation of active tectonics.
The Nantinghe fault is a NE-trending arc-shaped sinistral fault. According to the inversion results, its sinistral slip and tensile rates are 2.8 ± 1.1 mm/yr and 1.6 ± 0.7 mm/yr, respectively. This is consistent with the left-lateral strike–slip rate of 3.6 ± 0.4 mm/yr obtained by Shi [41] through terrace offset and C14 dating.
As the northwest boundary of the Sichuan–Yunnan rhombic block, the inversion results of the dextral slip and the extrusion rate for the Jinshajiang fault are 1.4 ± 0.8 mm/yr and 1.5 ± 0.7 mm/yr, respectively. The dextral slip rate and tensile rate of the Deqin–Zhongdian–Daju fault are 2.7 ± 0.6 mm/yr and 1.5 ± 0.6 mm/yr, respectively, which are consistent with the results of Chang et al. [42] and slightly smaller than the 5 mm/yr obtained by Xu et al. [43] and 6 mm/yr obtained by Li et al. [31]. The Weixi–Qiaohou fault is one of the branch faults of the Red River fault zone extending northward. Its dextral strike–slip rate is 1.1 ± 0.7 mm/yr, and the tensile rate is 0.8 ± 0.7 mm/yr. The reversion result is consistent with the 1–3 mm/yr estimated using geological methods [44,45]. As a deep large boundary fault in the Red River fault zone, this paper’s inversion results show that the middle section’s activity is stronger than that of the northern section. The northern section’s dextral strike–slip and extrusion rates are 1.9 ± 0.7 mm/yr and 1.0 ± 0.9 mm/yr, respectively. The dextral strike–slip and extension rates of the middle segment are 2.5 ± 0.7 mm/yr and 0.3 ± 0.6 mm/yr, respectively, which are essentially consistent with the results of Li et al. [28] and Li et al. [46].
The Lijiang–Xiaojinhe fault is a secondary boundary fault in the Sichuan–Yunnan rhombic block that has been continuously active since the Holocene. The inversion results of its left-lateral strike–slip rate and extrusion rate are 4.7 ± 0.8 mm/yr and 0.6 ± 0.6 mm/yr, respectively, which are slightly larger than the 3.7~3.8 mm/yr obtained by Xiang et al. [47]. Recent studies based on tectonic geomorphology and field investigations suggest that the Chenghai fault is characterized by left-slip and normal fault activity and has a maximum left-slip rate of 1.0–1.2 mm/yr [48,49], which is smaller than the 3.1 ± 0.7 mm/yr obtained from the inversion of this paper. The Heqing–Eryuan fault is a NE-SW extension, and the southern section is oblique to the Red River fault zone, which is has been active since the Late Quaternary. The research results of Fang et al. [50] and Sun et al. [51] show that its left-lateral strike–slip rate is 1.8~2.0 mm/yr, which is slightly smaller than the 3.6 ± 0.6 mm/yr obtained from the inversion in this paper. The Chuxiong–Nanhua fault is nearly parallel to the Red River fault in geometric distribution. It is considered to be the southwest boundary of the Sichuan–Yunnan rhombic block, together with the Red River fault. In this paper, the right-lateral strike–slip rate and extrusion rate of the Chuxiong–Nanhua fault are 5.4 ± 1.0 mm/yr and 1.1 ± 0.7 mm/yr, respectively, which are slightly larger than the geologically given 2.3~4.0 mm/yr [52].

5. Seismic Moment Balance

During the inter-seismic period, the accumulated elastic energy of a locked fault will eventually be released in the form of an earthquake. Therefore, the net accumulated energy on a fault should be the difference between the accumulated elastic energy and the released seismic energy. The seismic moment accumulation rate can be calculated based on the fault slip rate inverted in this study. By using historical earthquake catalogs and previously published paleoseismic data, the seismic moment release on the fault can be obtained. Then, the seismic moment loss of a fault can be estimated. The study of seismic moment deficit is significant for understanding the long-term seismic risk of seismogenic faults [29,31,53].

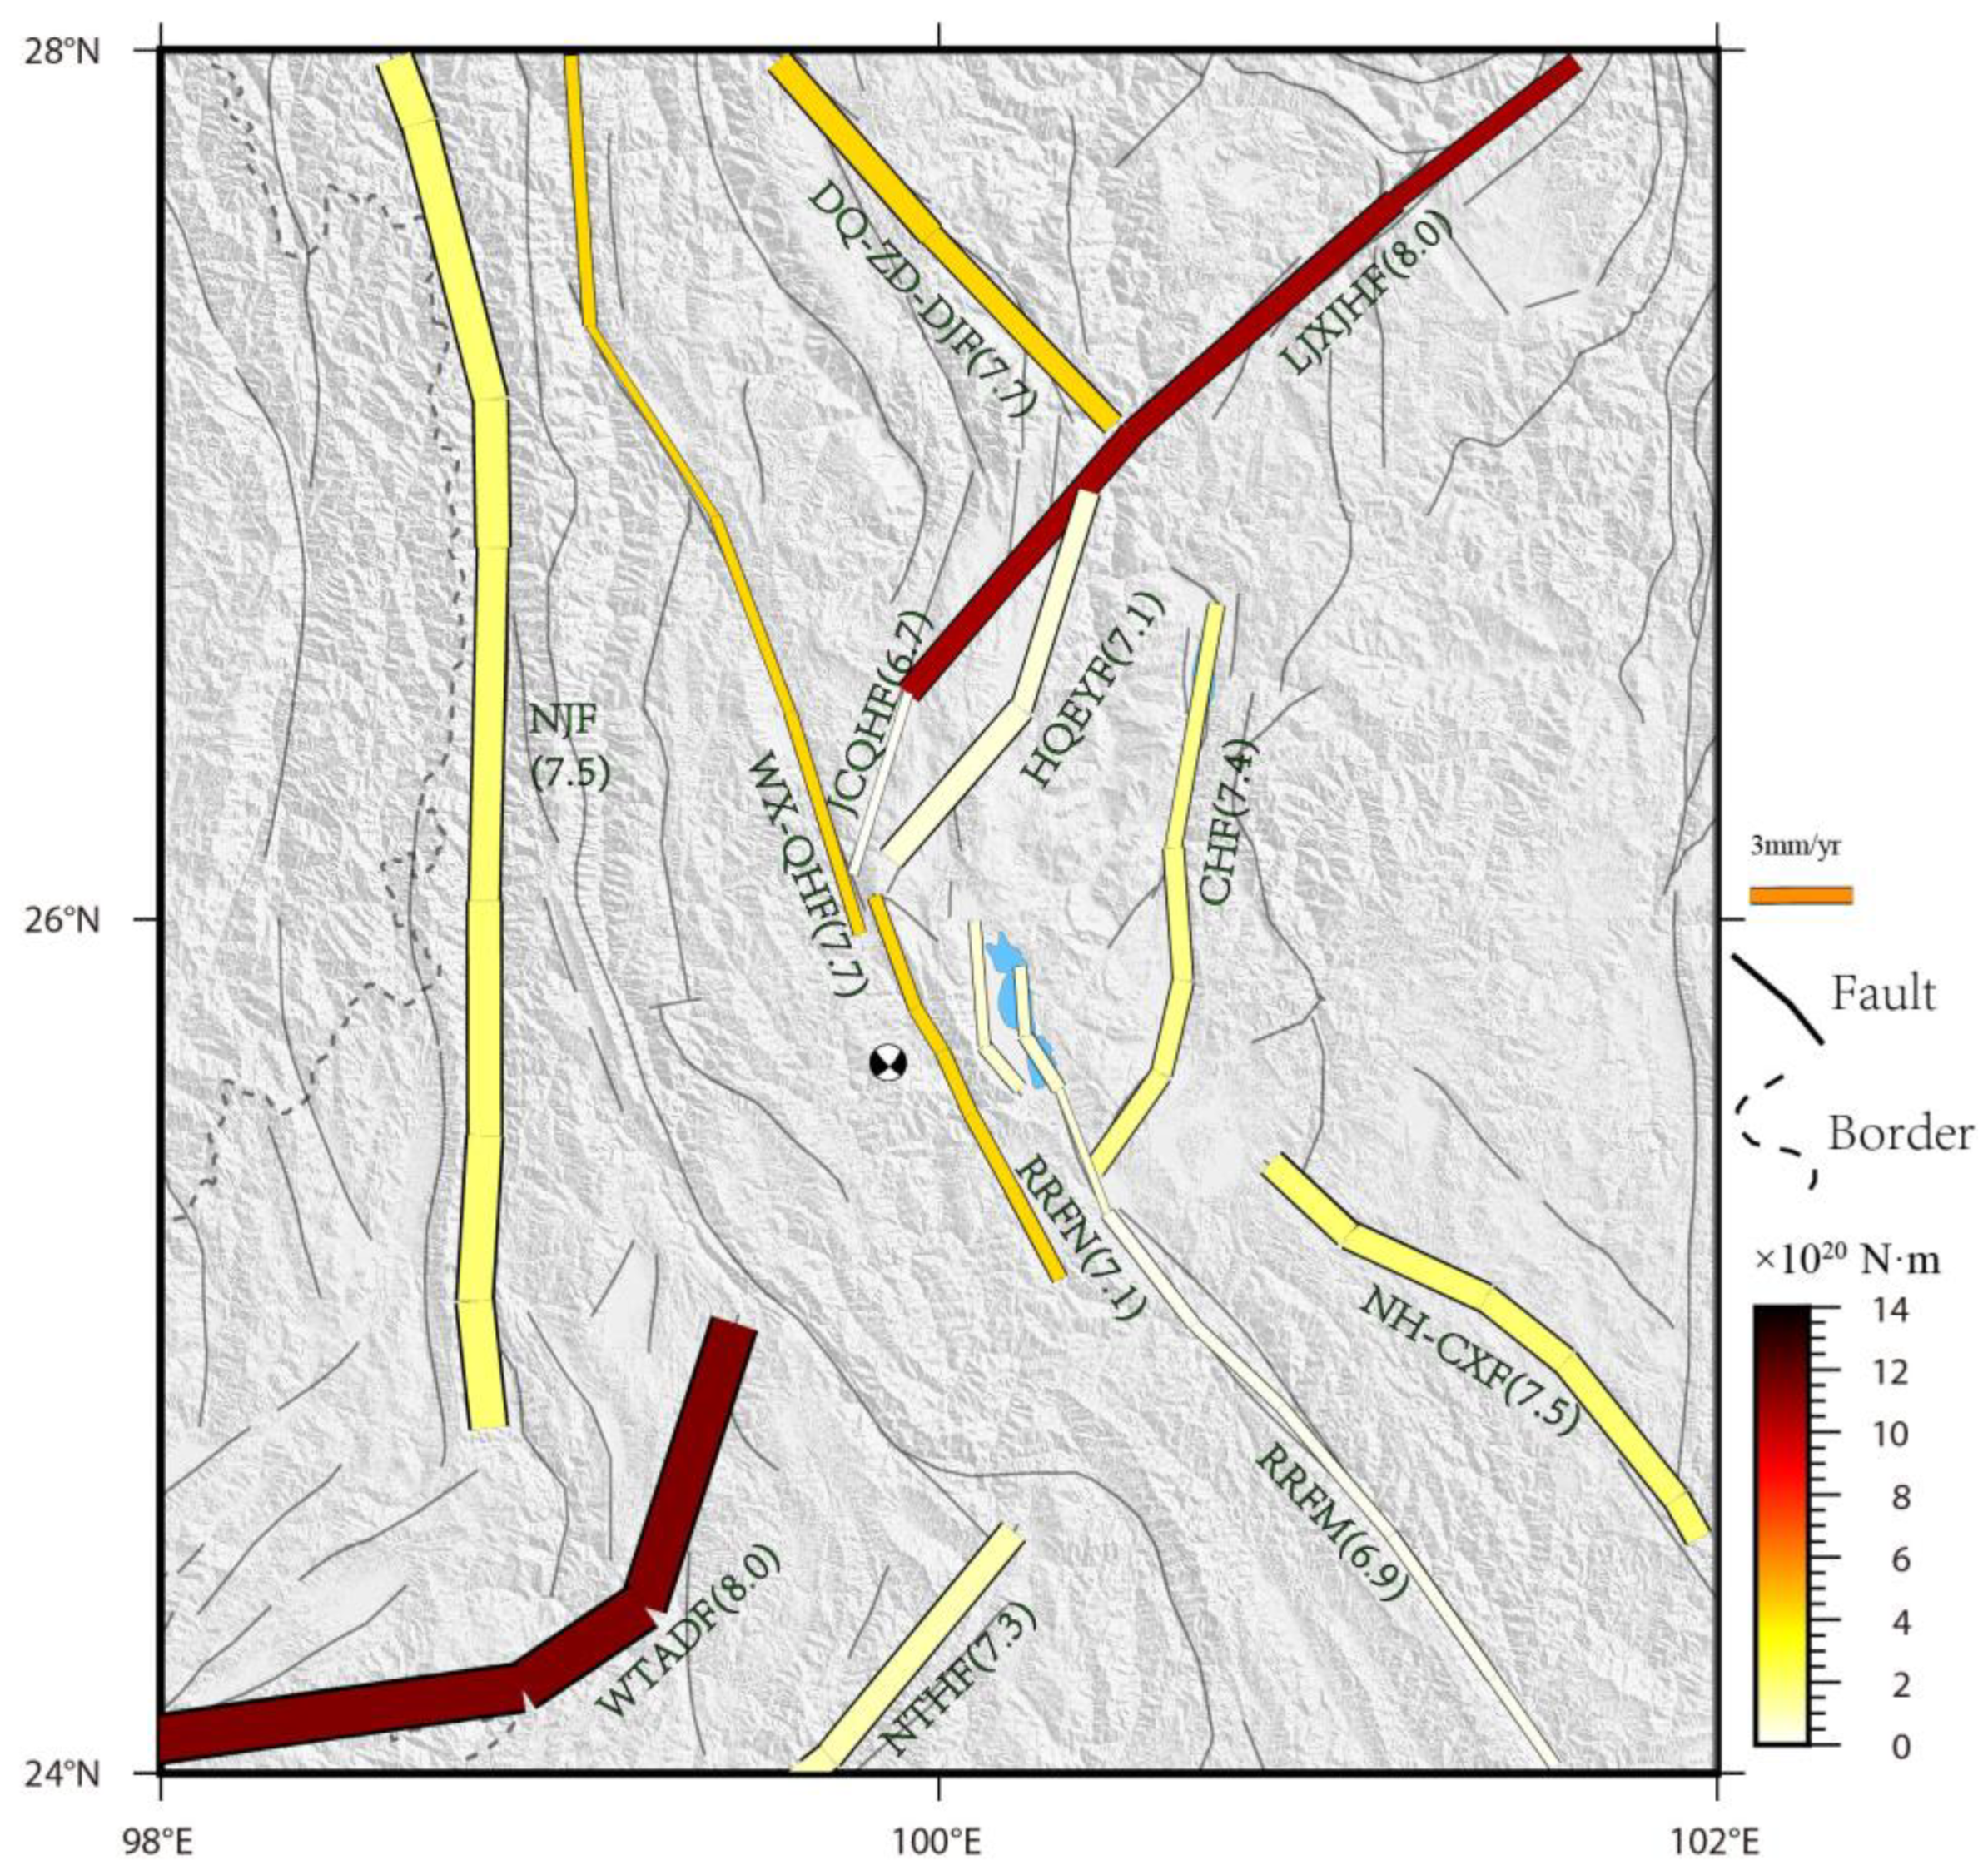
5.1. Moment Accumulation Rate

The cumulative rate of seismic moments on a given fault can be calculated according to formula M 0 = μ s A , where μ is the shear modulus, take 30 GPa, s is the total slip rate of the fault obtained above, including the strike–slip and dip–slip on the fault (the extension/convergence of the vertical fault) rate, and A is the locking area of the fault plane. According to the fault locking depth set above, the cumulative rate of the moments of the main faults in the study area can be calculated. If the time interval is given, the moment accumulation of a fault in the period can be calculated.

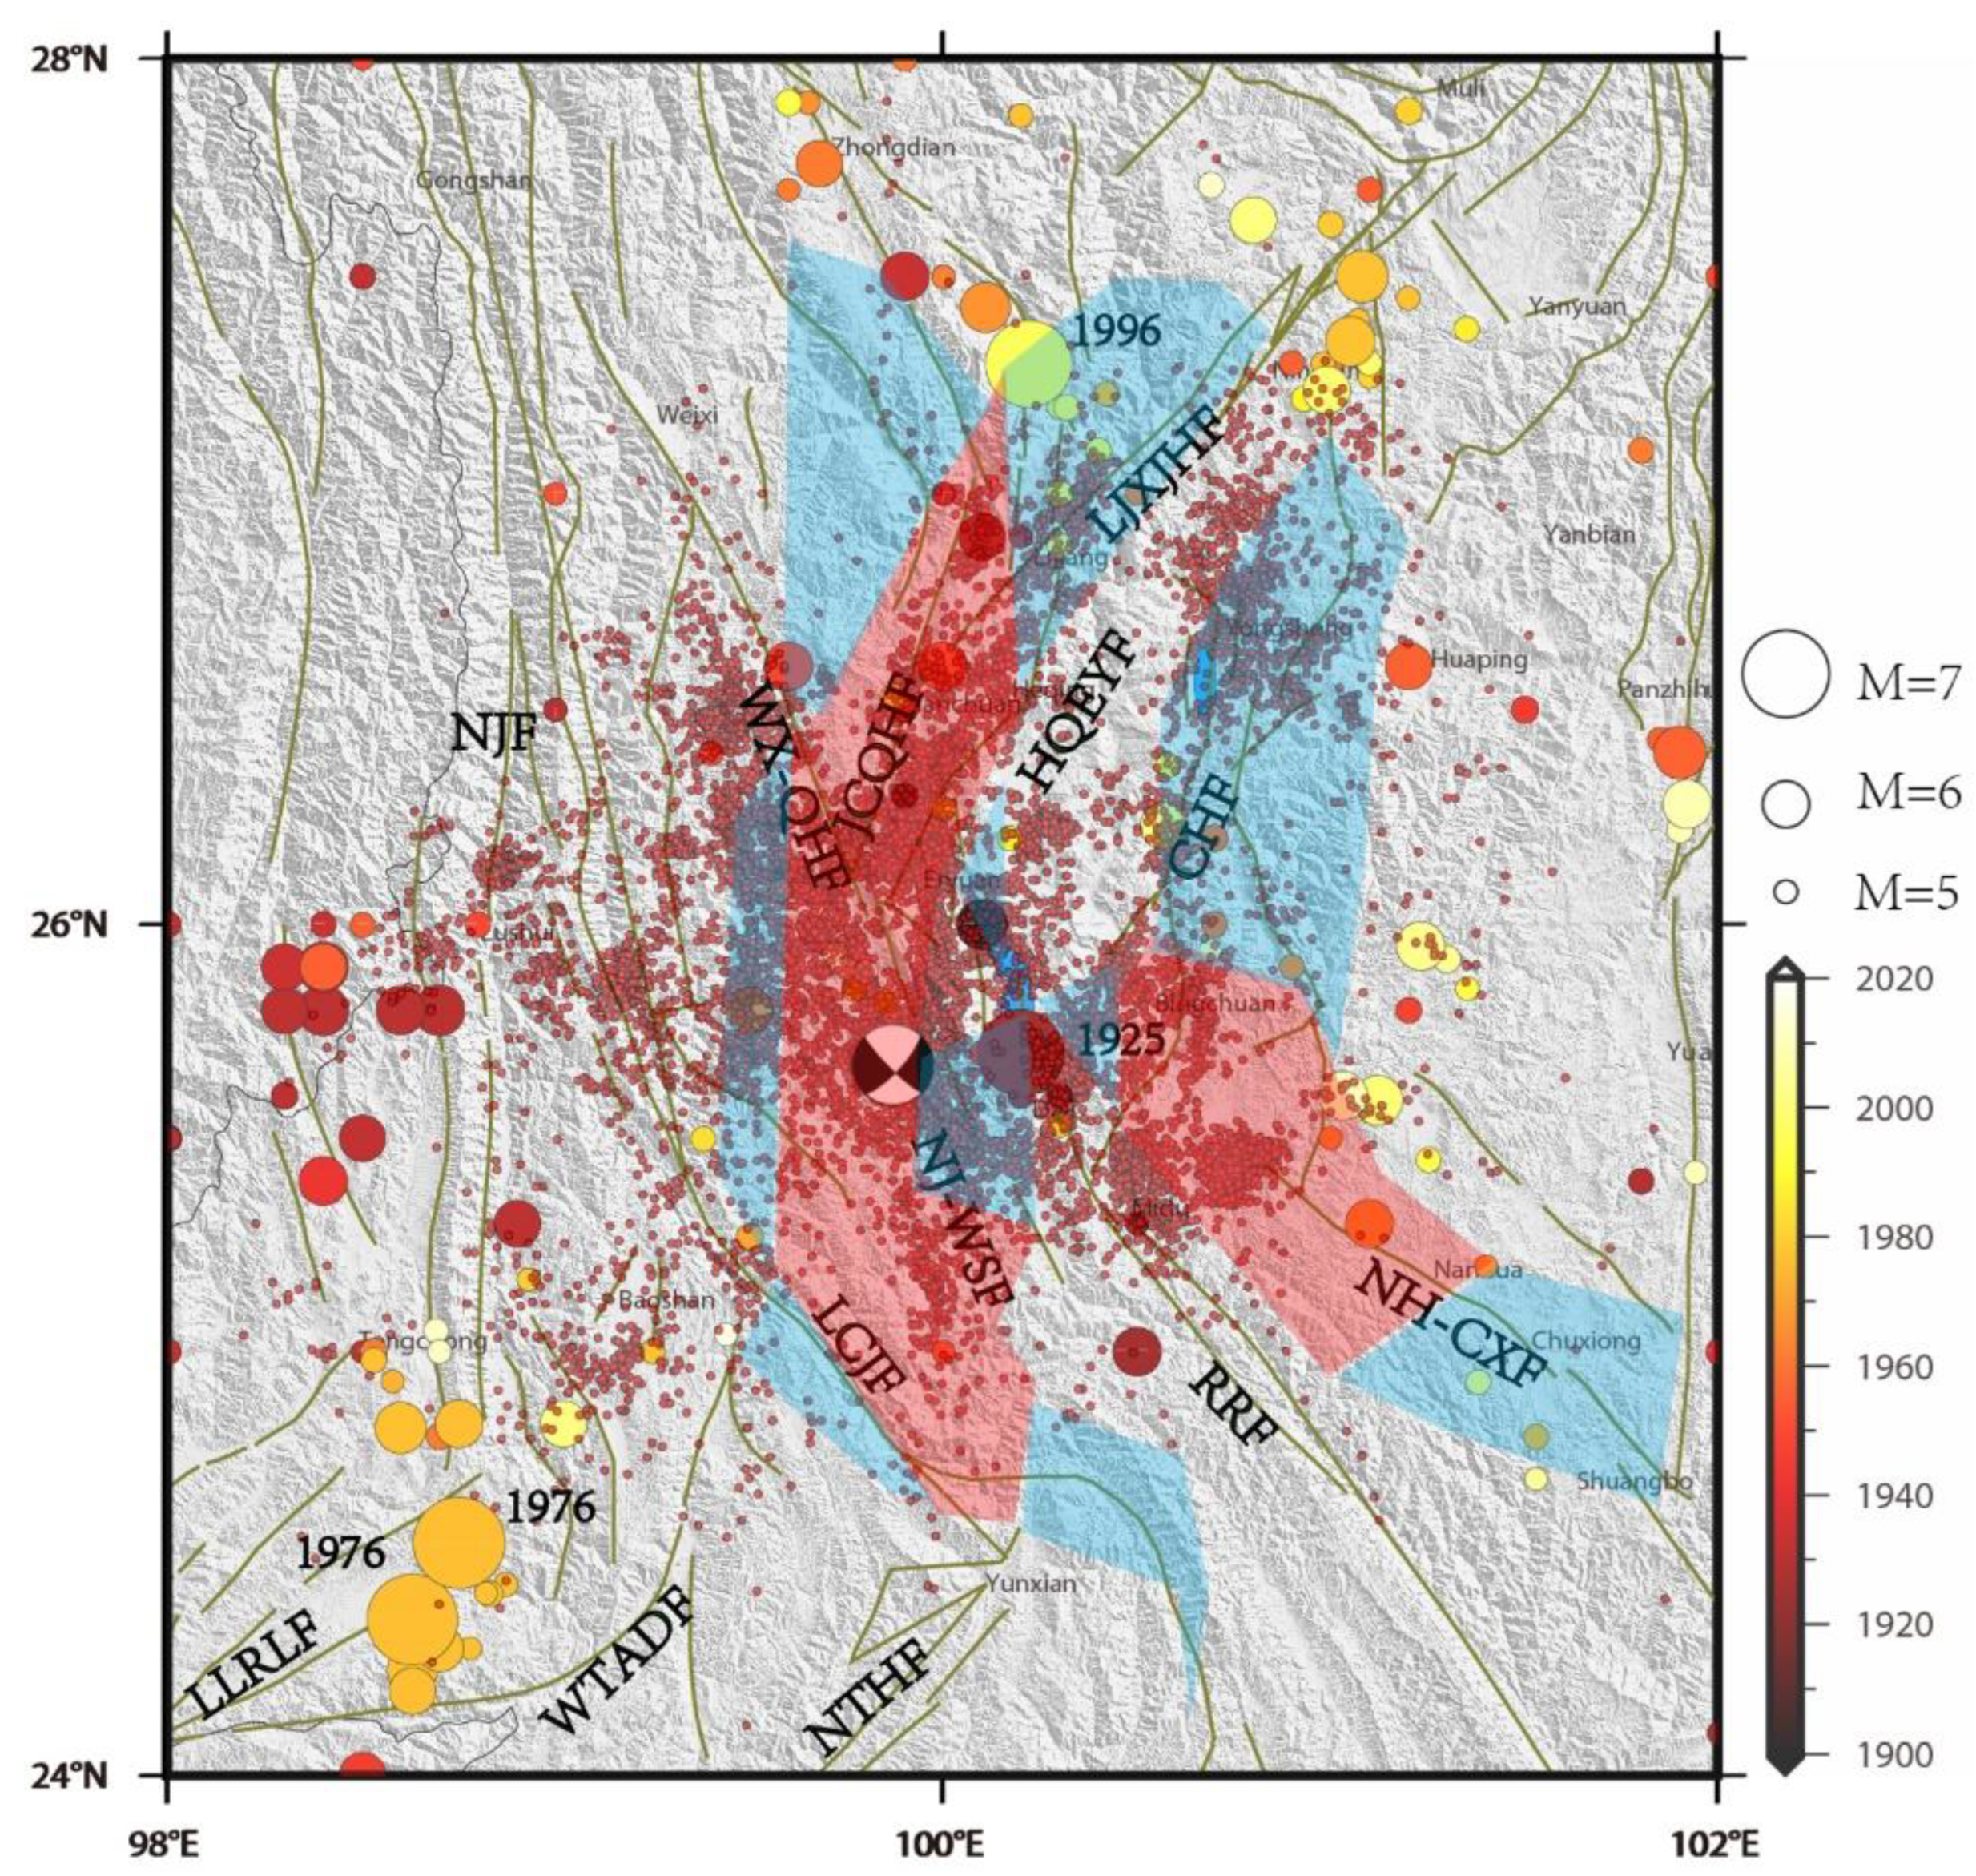
5.2. Seismic Moment Release

The seismic moment release of an earthquake can be calculated by its moment magnitude. The formula of moment magnitude is as follows:
M w = 2 / 3 log M 0 6.03  
Since most of the early earthquake catalogs give surface wave magnitudes, Ms, but the difference between the moment magnitude and the surface wave magnitude is very small [54], the magnitudes in the earthquake catalogs are treated as approximate moment magnitudes to estimate the release of seismic moments. The energy released by a magnitude 5 earthquake is about 3% of the energy released by a magnitude 6 earthquake and 0.1% of the energy released by a magnitude 7 earthquake. Therefore, the energy released by these earthquakes can be negligible when estimating the hazard of earthquakes above magnitude 6. Therefore, only earthquakes above magnitude 6 are considered in the later estimation of seismic moment release.

5.3. Seismic Moment Deficit

The completeness and reliability of the strong earthquake catalogs are crucial for estimating the seismic moment release and moment deficit. In this study, the seismic moment accumulation starting time and seismic moment release were determined based on Xu et al.’s [9] historical earthquake catalog and published fault paleoseismic data. The principle of determining the seismic moment accumulation starting time is as follows: for earthquakes with a clear magnitude of ≥7 in the catalog, we take the most recent magnitude 7 earthquake as the starting point in time and assign this earthquake to the closest major fault. For faults that are not recorded in the earthquake catalog, we determine the starting time of the last strong earthquake through paleoseismic data. Then, using the fault moment accumulation rate obtained in the previous section, the moment accumulation of the major faults in the study area is estimated and, finally, the seismic moment deficit is calculated (Table 3, Figure 7).
Figure 7 shows that most of the main faults in the region have high seismic potential. Particularly noteworthy are the Wanding–Anding fault (11.392 × 10²⁰ N m) and Lijiang–Xiaojinhe fault (10.986 × 10²⁰ N m), whose deficit has reached an 8.0 magnitude earthquake. Wu et al. [55] found that the Wanding–Anding fault has had no earthquakes with M ≥ 7 on the scale of nearly a thousand years through historical seismic records. They believe that it is currently a seismic gap and has the possibility of earthquakes with M ≥ 8. Ding et al. [56] found that the last paleoearthquake of the Lijiang–Xiaojinhe fault occurred 1700 years ago, and no earthquakes with M ≥ 7 were recorded during this period. Due to its long accumulation time of seismic moments, the moment deficit of the Lijiang–Xiaojinhe fault is significant. In addition, the Weixi–Qiaohou–Weishan fault (3.398×10²⁰ N·m) and the Deqin–Zhongdian–Daju fault (4.353 × 10²⁰ N m) also have high seismic moment deficits, with the equivalent magnitudes of 7.7.

6. Discussion

6.1. Seismic Hazard Analysis

As a retrospective tracking after the Yangbi earthquake, this study will focus on two issues: (1) what are the prominent characteristics in the regional strain rate field before the Yangbi earthquake? (2) Based on the characteristics of the strain field before the earthquake, according to the principle of simple analogy, the most likely location of strong earthquakes in the future will be infered. After analyzing the seismic strain characteristics of the Yangbi earthquake, the following four characteristics are identified:
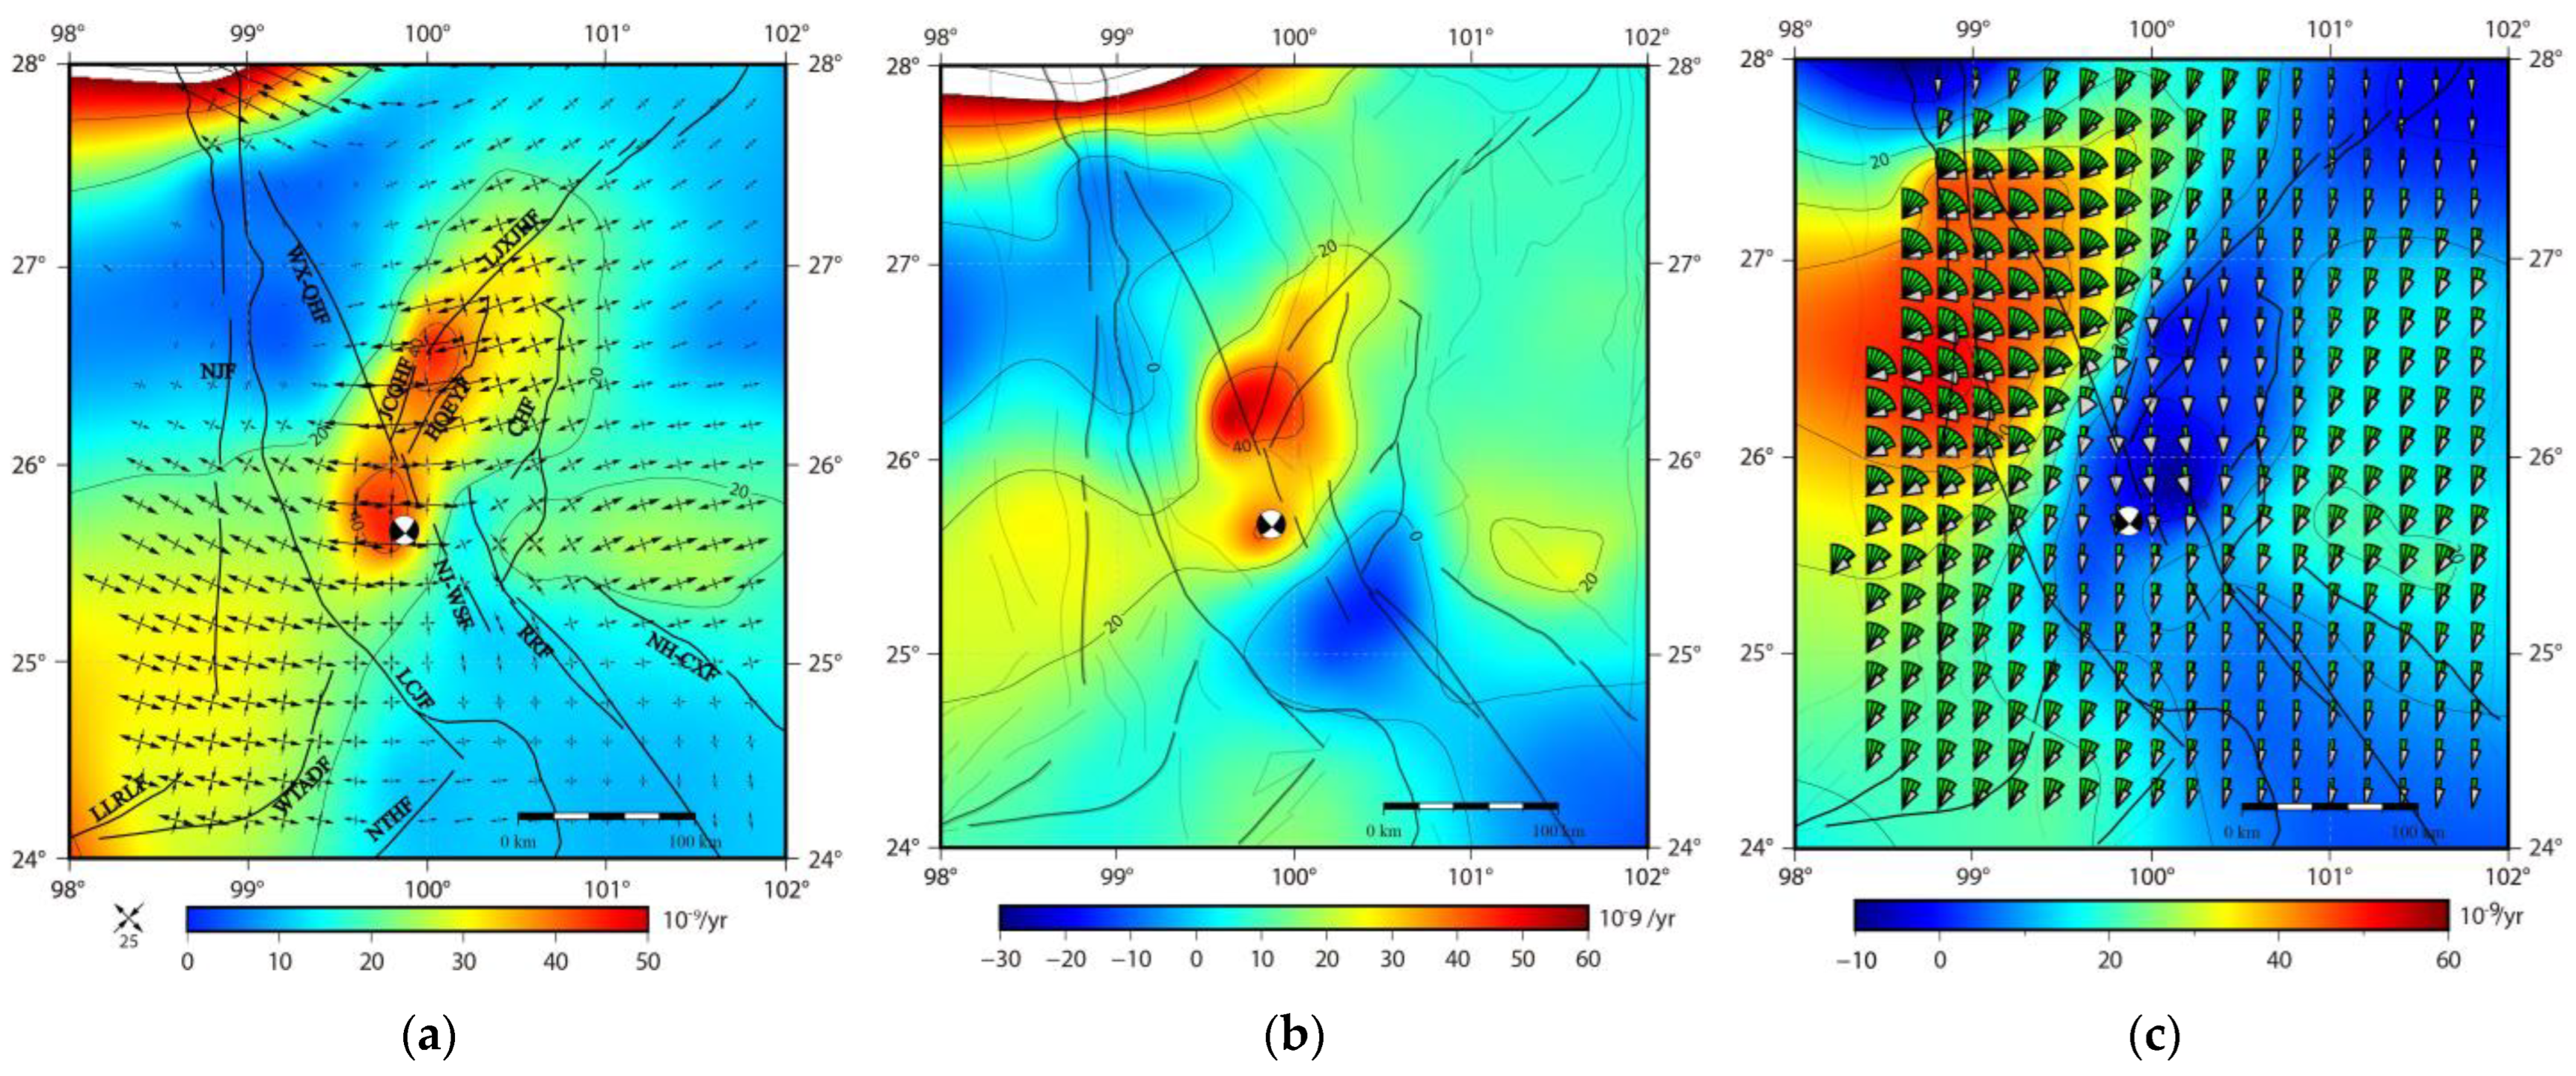
  • Located in the transition zone where the strain direction of the principal strain field has changed;
  • Located at the junction between the high value of maximum shear strain and fault;
  • Located at the edge of the transition between the surface dilatation and compression;
  • Located at the position where the rotation rates on both sides are quite different.
Based on the characteristics summarized above, the visual judgment method is used to analyze the seismic risk of the area that meets the above characteristics and to delineate the future seismic risk area (Figure 8).
The study area is divided into several risk areas according to the above strain characteristics. Figure 8 shows that the distribution of small earthquakes [57] has a high coincidence with the division of seismic risk areas. Combined with the analysis of small earthquake distribution and strain rate field, the seismic risk of the Chenghai fault, Jianchuan–Qiaohou fault, Heqing–Eryuan fault and Lijiang–Xiaojinhe fault is relatively high. Zhou et al. [58] delineated the potential source area in northwest Yunnan and concluded that there is also a potential for 7–8 magnitude earthquakes in the Chenghai fault. Cheng et al. [59] analyzed the coseismic deformation field of the Wenchuan and Lushan earthquakes, and concluded that the Wenchuan and Lushan earthquakes promoted the accumulation of seismic energy in the southwestern segment of the Lijiang–Xiaojinhe fault at the junction of Sichuan and Yunnan. Through numerical simulation, Li et al. [60] determined that the current stress accumulation rate of the middle and southern segments of the Lijiang–Xiaojinhe fault and the northeastern segment of the Chenghai fault is still higher than that of other faults in the region. The division of potential source areas based on the principle of the repetition of historical earthquakes considers that areas where strong earthquakes have occurred historically are likely to experience earthquakes of similar or higher magnitude than historical earthquakes again in the future. Since the Lijiang M7 earthquake occurred in 1996 and the Dali M7 earthquake occurred in 1925, and these two large earthquakes are also within the defined seismic risk zone, there is still the potential for earthquakes above M7 in the future. In the divided seismic risk area, there have been more than six earthquakes along the Weixi–Qiaohou fault and the Jianchuan–Qiaohou fault. Therefore, the seismic potential of these two areas cannot be underestimated.

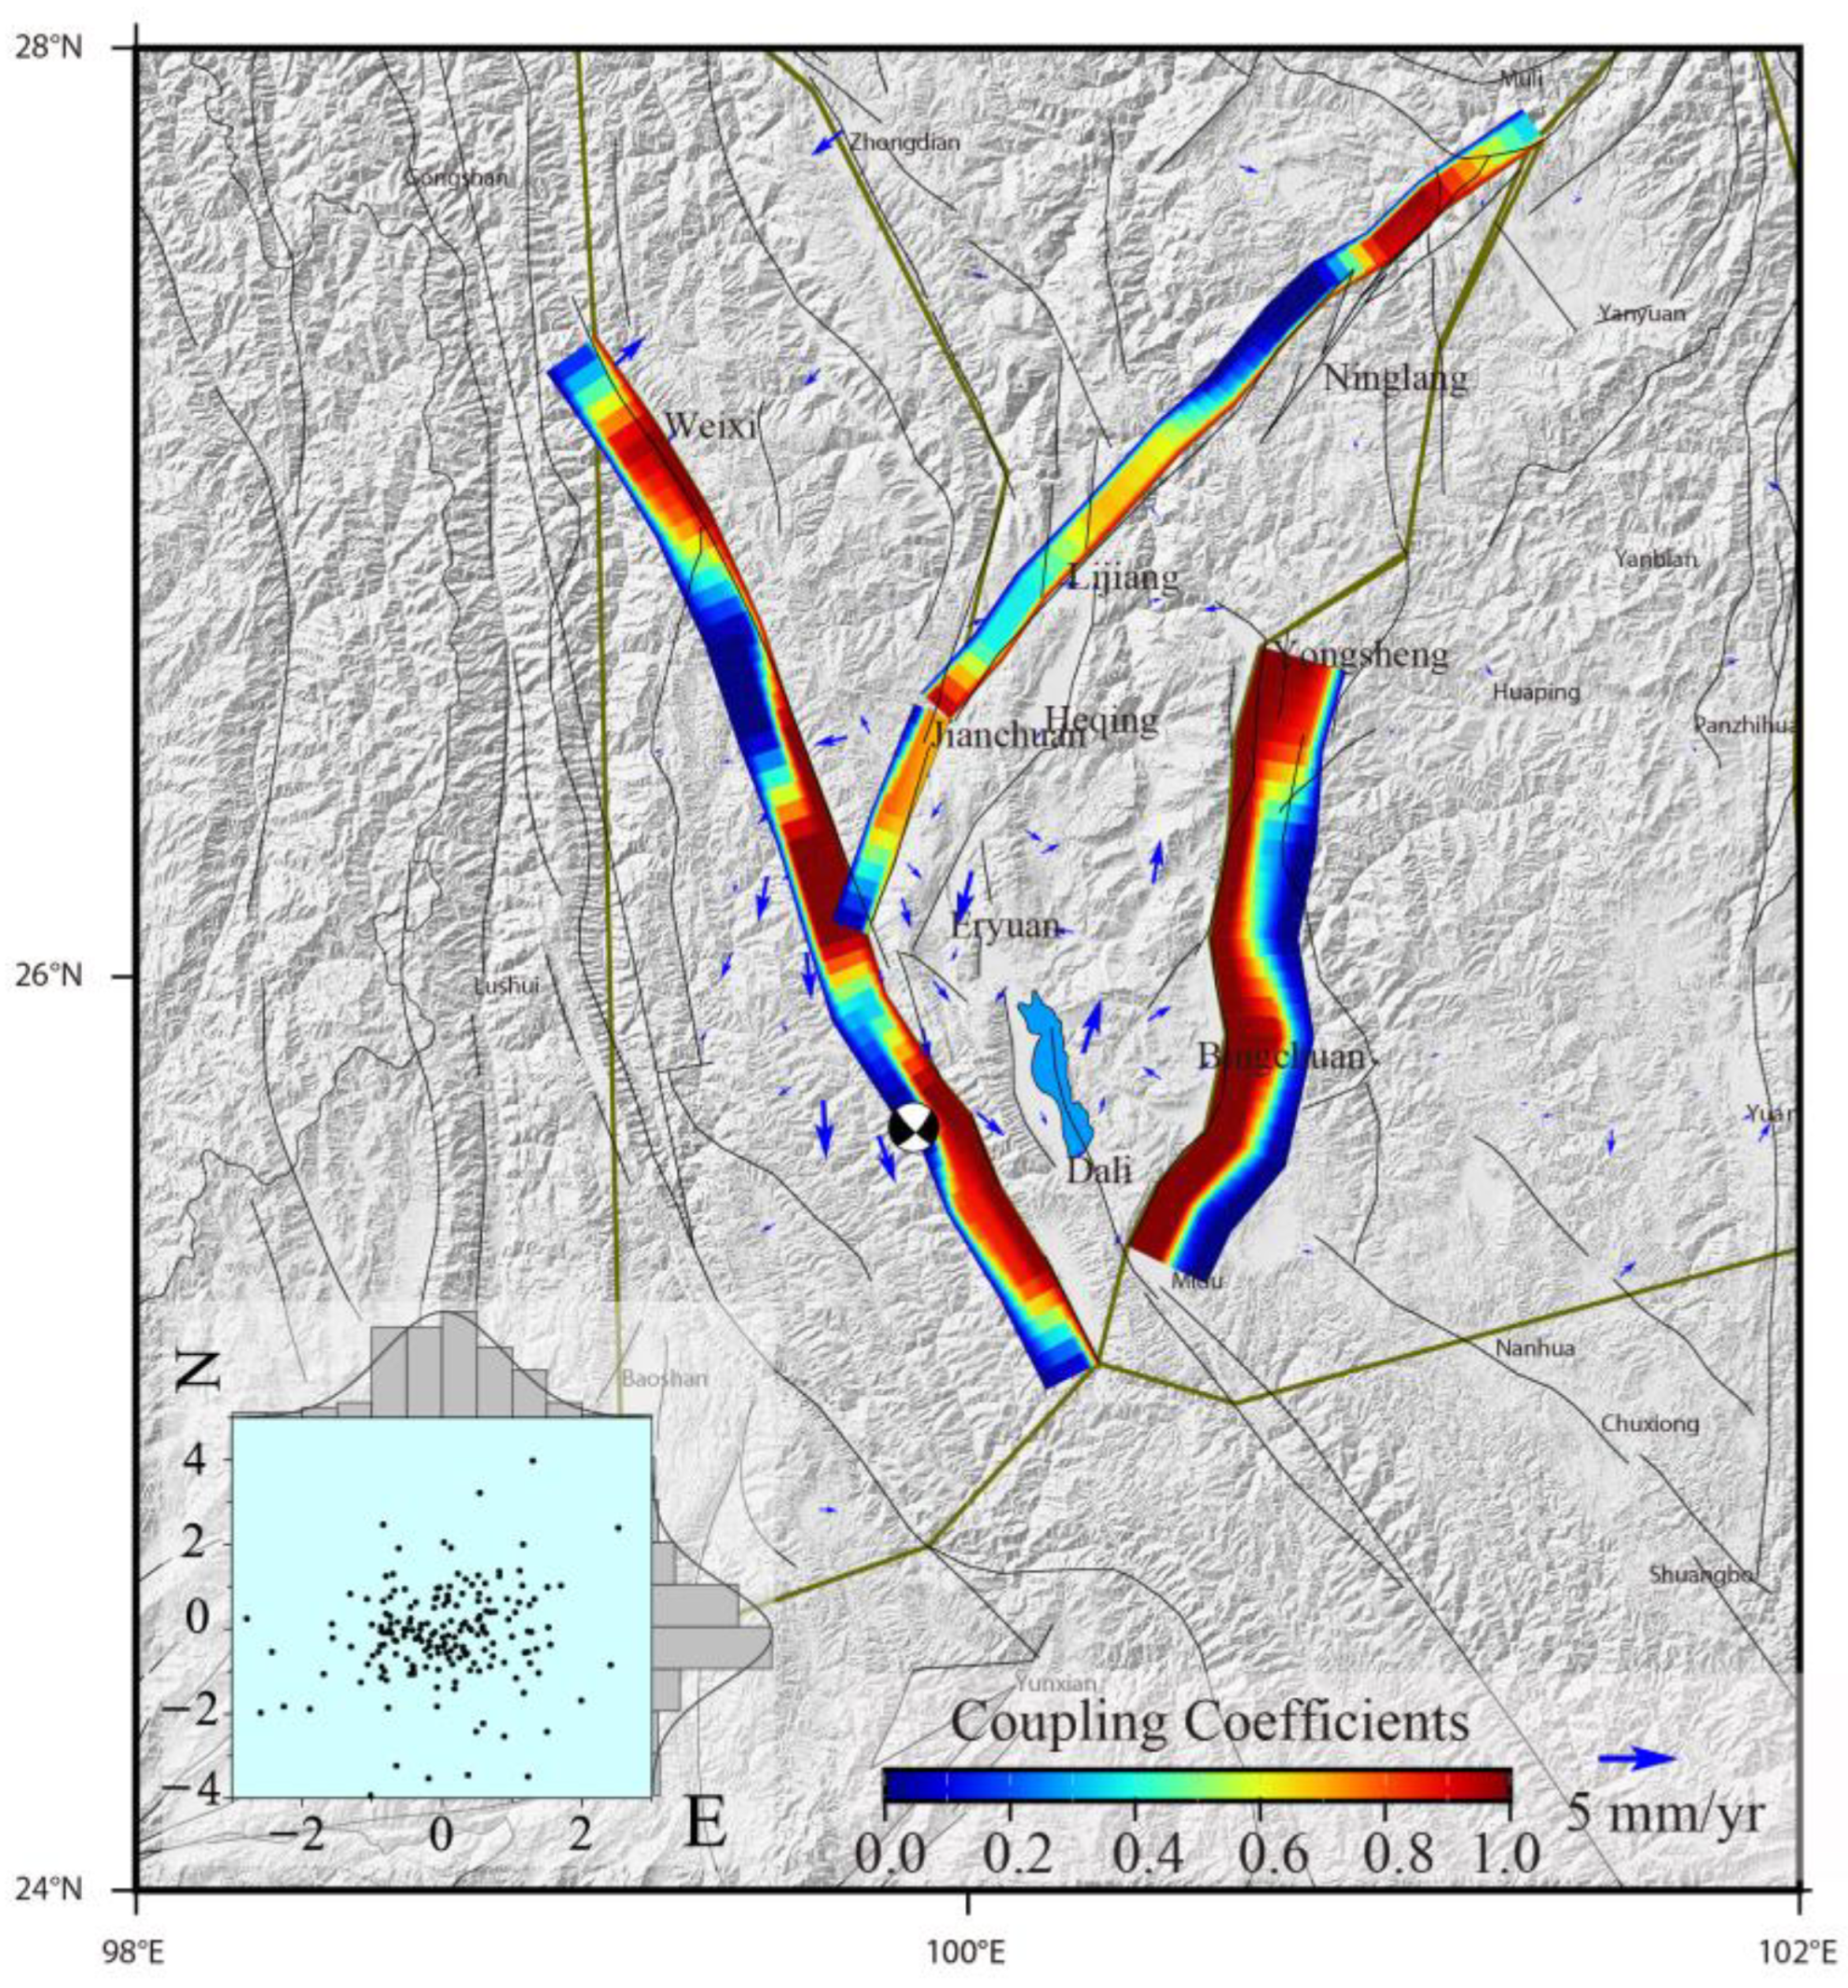
6.2. Analysis of Fault Locking Degree

The fault locking degree is an essential factor to weigh the seismic risk of a fault [61,62]. The above analysis shows that there is still a high seismic risk in the Lijiang–Xiaojinhe, Chenghai and Weixi–Qiaohou faults. In order to analyze the seismic risk of these three faults more accurately, this paper uses Tdefnode software based on negative dislocation theory [62,63] and inverses the locking degree of these faults.
In the inversion process, the fault slip rate obtained above is used as the prior value input of the inversion model, and the locking depth is still set to 25 km. Li et al. [64] determined that the inversion results were not sensitive to the fault dip angle by setting different parameters, and the setting of different fault dip angles had little effect on the inversion results. Therefore, the Lijiang–Xiaojinhe fault, Jianchuan–Qiaohou fault, Weixi–Qiaohou fault and Chenghai fault are set to 70°, 70°, 60° and 50°, respectively, and the locking degree is gradually reduced along the dip direction. The inversion results show that most of the fitting residuals are less than 2 mm/yr (Figure 9), which is within the GPS observation error. In general, the model can properly describe the crustal movement characteristics of the study area.
Figure 9 shows that the locking degree of the Weixi–Qiaohou fault is unevenly distributed along the strike. The sections with a higher locking degree are located in the northern, middle and southern sections of the Weixi–Qiaohou fault, which seems to form three asperities. The locked area in the middle section is consistent with the red dangerous area obtained through the previous division, and the strong locked area in the southern section is consistent with the blue dangerous area. Combined with the dangerous area obtained through the previous division, it is considered that the seismic risk in the middle section of the Weixi–Qiaohou fault is stronger, followed by the south section. This result is consistent with the higher rupture risk zone through the coseismic Coulomb stress change [65,66].
The locking distribution of the Chenghai fault shows the characteristics of uneven variation in the locking degree along the strike. The strongest locking occurs in the south segment, the locking depth in the middle and north sections is gradually reduced and then it increases again in the north segment. Moreover, the inverted slip rate of the Chenghai fault gradually decreases from south to north. Combined with the distribution of small earthquakes and the division of seismic hazard zones, it is considered that the seismic hazard is higher in the southern segment, i.e., Midu–Binchuan segment, than in the northern segment, i.e., Yongsheng segment. This result is consistent with Xu et al.’s [66] finding that the Coulomb stress changes induced by earthquakes have a more significant impact on the Chenghai fault.
The overall locking strength of the Lijiang–Xiaojinhe fault and the Jianchuan–Qiaohou fault is not high. The locking degree is higher in the northeastern segment of the Lijiang–Xiaojinhe fault, while the locking degree is lower in the Ninglang section, as a boundary segment, and then increases in the Lijiang segment. The Jianchuan–Qiaohou fault shows the characteristics of increasing locking degree from southwest to northeast, but the overall locking degree is not high. Combined with the analysis of the divided seismic hazard zone, the seismic hazard in the Jianchuan section is currently higher than that in the Lijiang section.

7. Conclusions

In this paper, the strain rate field is calculated based on the GPS velocity field solved by Wang and Shen [6] and the data of regional self-built continuous observation stations. The characteristics of crustal movement in the area of about 400 km × 400 km and the characteristics of strain rate field before the Yangbi earthquake are discussed. The results show that the Yangbi earthquake was located in the high-value area of principal strain along the Weixi–Qiaohou–Weishan–Red River fault, which is in a tectonic environment of EW tension and SN compression. By analyzing the seismic strain characteristics of the Yangbi earthquake, four characteristics are identified. The study areas meeting the characteristics and combined with the distribution of small earthquakes are analyzed for seismic hazard and delineated for future seismic hazard zones. It is considered that the seismic risk of the Chenghai fault, Jianchuan–Qiaohou fault, Heqing–Eryuan fault and Lijiang–Xiaojinhe fault is relatively high. The locking coefficients of the Weixi–Qiaohou fault, Chenghai fault, Jianchuan–Qiaohou fault and Lijiang–Xiaojinhe fault are inversed according to the negative dislocation method. Combined with the divided risk areas, it is considered that the seismic risk in the middle segment of the Weixi–Qiaohou fault is stronger, followed by the southern section. The seismic hazard is higher in the southern section of the Chenghai fault, i.e., the Midu–Binchuan segment, and lower in the northern section, i.e., the Yongsheng segment. The locking strength of the Lijiang–Xiaojinhe fault and Jianchuan–Qiaohou fault is not high as a whole. Combined with the analysis of the divided seismic risk zones, it is considered that the seismic risk in the Jianchuan segment is higher than that in the Lijiang segment.
In this paper, the semi-infinite space elastic dislocation model is used to invert the current slip rate of the main faults in the Yangbi earthquake-affected area. Combining this with the reliable historical strong earthquake catalogs, the moment accumulation, seismic moment release and seismic moment deficit of the main faults are estimated. The results show that the Wanding–Anding fault, the Lijiang–Xiaojinhe fault, the Weixi–Qiaohou fault and the Deqin–Zhongdian–Daju fault have apparent deficits. Moreover, the Wanding–Anding fault and the Lijiang–Xiaojinhe fault have the potential for earthquakes with magnitudes above 8.

Author Contributions

Conceptualization, C.D. and W.G.; methodology, C.D. and Z.L.; data curation, C.D., G.X. and S.L.; writing—original draft preparation, C.D.; writing—review and editing, W.G., S.L., Z.L., K.Z. and L.Z. All authors have read and agreed to the published version of the manuscript.

Funding

This research was funded by the National Key Research and Development Plan of China (2019YFE0108900,2018YFC1503304), National Natural Science Foundation of China (41974113) and the Science and Technology Fundamental Resources Investigation Program (2021FY100105-03).

Data Availability Statement

The GPS data used in the current study are available from Wang and Shen (2020) and self-buil. The self-buil GPS data presented in this study are available.

Acknowledgments

We thank three anonymous reviewers and the Editor who contributed significantly to improving the quality of the original paper. We also would like to thank all the staff who participated in the construction of the GPS site.

Conflicts of Interest

The authors declare no conflict of interest.

References

  1. Duan, M.; Zhao, C.; Zhou, L.; Zhao, C.; Zuo, K. Seismogenic structure of the 21 May 2021 MS6.4 Yunnan Yangbi earthquake sequence. Chin. J. Geophys. 2021, 64, 3111–3125. [Google Scholar] [CrossRef]
  2. Li, C.; Zhang, J.; Wang, W.; Sun, K.; Dan, X. The Seismogenic Fault of the 2021Yunnan Yangbi Ms6.4 Earthquake. Seismol. Geol. 2021, 43, 706–721. [Google Scholar] [CrossRef]
  3. Wang, G.; Wu, Z.; Peng, G.; Liu, Z.; Luo, R.; Huang, X.; Chen, H. Seismogenic fault and it’s rupture characteristics of the 21 May, 2021 Yangbi MS6.4 earthquake: Analysis results from the relocation of the earthquake sequence. J. Geomech. 2021, 27, 662–678. [Google Scholar]
  4. Zhang, K.; Gan, W.; Liang, S.; Xiao, G.; Dai, C.; Wang, Y.; Li, Z.; Zhang, L.; Ma, G. Coseismic displacement and slip distribution of the 21 May 2021, MS6.4, Yangbi Earthquake derived from GNSS observations. Chin. J. Geophys. 2021, 64, 2253–2266. [Google Scholar] [CrossRef]
  5. Wu, Z.; Zhao, X.; Fan, T.; Ye, P.; Tong, Y.; Yang, Z. Active faults and seismologic characteristics along the Dali-Ruili railway in western Yunnan Province. Geol. Bull. Chin. 2012, 31, 191–217. [Google Scholar]
  6. Wang, M.; Shen, Z. Present-day crustal deformation of continental China derived from GPS and its tectonic implications. J. Geophys. Res. Solid Earth 2020, 125, e2019JB018774. [Google Scholar] [CrossRef] [Green Version]
  7. Zhao, G.; Meng, G.; Wu, W.; Su, X.; Pan, Z. Earthquake Potential Assessment Around the Southeastern Tibetan Plateau Based on Seismic and Geodetic Data. Pure Appl. Geophys. 2022, 179, 11–44. [Google Scholar] [CrossRef]
  8. Yang, T.; Li, B.; Fang, L.; Su, Y.; Zhong, Y.; Yang, J.; Qin, M.; Xu, Y. Relocation of the Foreshocks and Aftershocks of the 2021 Ms 6.4 Yangbi Earthquake Sequence, Yunnan, China. J. Earth Sci. 2022, 33, 892–900. [Google Scholar] [CrossRef]
  9. Xu, W.; Gao, M. Statistical analysis of the completeness of earthquake catalogs in China mainland. Chin. J. Geophys. 2014, 57, 2802–2812. [Google Scholar] [CrossRef]
  10. Gan, W.; Zhang, R.; Zhang, Y.; Tang, F. Development of the Crustal Movement Observation Network in China and its Applications. Recent Dev. World Seismol. 2007, 7, 43–52. [Google Scholar]
  11. Gan, W.; Li, Q.; Zhang, R.; Shi, H. Construction and Application of Tectonic and Environmental Observation Network of China’s mainland. J. Eng. Stud. 2012, 4, 324–331. [Google Scholar]
  12. Liang, S.; Gan, W.; Xiao, G.; Wang, G.; Dai, C.; Zhang, K.; Dai, D.; Li, Z.; Zhang, L.; Zhang, Y.; et al. Strong Ground Motion Recorded by High-Rate GPS during the 2021 Ms 6.4 Yangbi, China, Earthquake. Seismol. Res. Lett. 2022, 93, 3219–3233. [Google Scholar] [CrossRef]
  13. Webb, F.; Zumberge, J. An Introduction to GIPSY/OASIS-II Precision Software for the Analysis of Data from GLobal Positioning System; JPL Publ.: La Cañada Flintridge, CA, USA, 1993; p. D-11088. [Google Scholar]
  14. Zumberge, J.; Heflin, M.; Jefferson, D.; Watkins, M.; Webb, F. Precise point positioning for the efficient and robust analysis of GPS data from large networks. J. Geophys. Res. Solid Earth 1997, 102, 5005–5017. [Google Scholar] [CrossRef] [Green Version]
  15. Dong, D.; Fang, P.; Bock, Y.; Webb, F.; Prawirodirdjo, L.; Kedar, S.; Jamason, P. Spatiotemporal filtering using principal component analysis and Karhunen-Loeve expansion approaches for regional GPS network analysis. J. Geophys. Res. Solid Earth 2006, 111, B03405. [Google Scholar] [CrossRef] [Green Version]
  16. Altamimi, Z.; Metivier, L.; Rebischung, P.; Rouby, H.; Collilieux, X. ITRF2014 plate motion model. Geophys. J. Int. 2017, 209, 1906–1912. [Google Scholar] [CrossRef]
  17. Gan, W.; Zhang, P.; Shen, Z.; Niu, Z.; Wang, M.; Wan, Y.; Zhou, D.; Cheng, J. Present-day crustal motion within the Tibetan Plateau inferred from GPS measurements. J. Geophys. Res. Solid Earth 2007, 112, B08416. [Google Scholar] [CrossRef] [Green Version]
  18. Shen, Z.K. Crustal deformation across and beyond the Los Angeles. basin from geodetic measurements. J. Geophys. Res. Solid Earth 1996, 101, 27957–27980. [Google Scholar] [CrossRef]
  19. Shen, Z.; Wang, M.; Zeng, Y.; Wang, F. Optimal Interpolation of Spatially Discretized Geodetic Data. Bull. Seismol. Soc. Amer. 2015, 105, 2117–2127. [Google Scholar] [CrossRef] [Green Version]
  20. Wu, Y.; Jiang, Z.; Yang, G.; Wei, W.; Liu, X. Comparison of GPS strain rate computing methods and their reliability. Geophys. J. Int. 2011, 185, 703–717. [Google Scholar] [CrossRef] [Green Version]
  21. Jiang, Z.; Liu, J. The method in establishing strain field and velocity field of crustal movement using least squares collocation. Chin. J. Geophys. 2010, 53, 1109–1116. [Google Scholar] [CrossRef]
  22. Liu, X.; Jiang, Z.; Wu, Y. The applicability of kriging interpolation method in GPS velocity gridding and strain calculating. Geomat. Inf. Sci. Wuhan Univ. 2014, 39, 457–461. [Google Scholar] [CrossRef]
  23. Wu, Y.; Jiang, Z.; Yang, G. The Application and Method of GPS Strain Calculation in Whole Mode Using Least Square Collocation in Sphere Surface. Chin. J. Geophys. 2009, 32, 306–311. [Google Scholar] [CrossRef]
  24. Su, X.; Yao, L.; Wu, W.; Meng, G.; Su, L.; Xiong, R.; Hong, S. Crustal Deformation on the Northeastern Margin of the Tibetan Plateau from Continuous GPS Observations. Remote Sens. 2019, 11, 34. [Google Scholar] [CrossRef] [Green Version]
  25. Wu, Y.; Jiang, Z.; Zhao, J.; Liu, X.; Wei, W.; Liu, Q.; Li, Q.; Zou, Z.; Zhang, L. Crustal deformation before the 2008 Wenchuan MS8. 0 earthquake studied using GPS data. J. Geodyn. 2015, 85, 11–23. [Google Scholar] [CrossRef]
  26. Jiang, Z.; Ma, Z.; Zhang, X.; Wang, Q.; Wang, S. Horizontal Strain Field and Tectonic Deformation of China Mainland Revealed by Preliminary Gps Result. Chin. J. Geophys. 2003, 46, 352–358. [Google Scholar] [CrossRef]
  27. Savage, J.; Simpson, R. Surface strain accumulation and the seismic moment tensor. Bull. Seismol. Soc. Amer. 1997, 87, 1345–1353. [Google Scholar] [CrossRef]
  28. Li, Z.; Wang, Y.; Gan, W.; Fang, L.; Zhou, R.; Seagren, E.G.; Zhang, H.; Liang, S.; Zhuang, W.; Yang, F. Diffuse Deformation in the SE Tibetan Plateau: New Insights from Geodetic Observations. J. Geophys. Res. Solid Earth 2020, 125, e2020JB019383. [Google Scholar] [CrossRef]
  29. Meade, B.; Hager, B. Block models of crustal motion in southern California constrained by GPS measurements. J. Geophys. Res. Solid Earth 2005, 110, B03403. [Google Scholar] [CrossRef]
  30. Meade, B. Present-day kinematics at the India-Asia collision zone. Geology 2007, 35, 81–84. [Google Scholar] [CrossRef]
  31. Li, Y.; Hao, M.; Ji, L.; Qin, S. Fault slip rate and seismic moment deficit on major active faults in mid and south part of the Eastern margin of Tibet plateau. Chin. J. Geophys. 2014, 57, 1062–1078. [Google Scholar] [CrossRef]
  32. Wang, Y.; Wang, E.; Shen, Z.; Wang, M.; Gan, W.; Qiao, X.; Meng, G.; Li, T.; Tao, W.; Yang, Y.; et al. GPS-constrained inversion of present-day slip rates along major faults of the Sichuan-Yunnan region, China. Sci. China Ser. D Earth Sci. 2008, 51, 582–597. [Google Scholar] [CrossRef]
  33. Liu, Y. Fine Velocity Structure and Earthquake Relocation in Source and Peripheral Area of Eryuan Earthquake. Master’s Thesis, China University of Geosciences, Beijing, China, 2020. [Google Scholar]
  34. Okada, Y. Internal deformation due to shear and tensile faults in a half-space. Bull. Seismol. Soc. Amer. 1992, 82, 1018–1040. [Google Scholar] [CrossRef]
  35. Comninou, M.; Dundurs, J. The angular dislocation in a half space. J. Elast. 1975, 5, 203–216. [Google Scholar] [CrossRef] [Green Version]
  36. Mansinha, L.; Symlie, D.E. The displacement fields of inclined faults. Bull. Seismol. Soc. Amer. 1971, 61, 1433–1440. [Google Scholar] [CrossRef]
  37. Maruyama, T. Statical elastic dislocation in an infinite and semi-infinite medium. Bull. Earthq. Res. Inst. 1964, 42, 289–368. [Google Scholar]
  38. Smylie, D.E.; Mansinha, L. The Elasticity Theory of Dislocations in Real Earth Models and Changes in the Rotation of the Earth. Geophys. J. R. Astron. Soc. 1971, 23, 329–354. [Google Scholar] [CrossRef] [Green Version]
  39. Wang, Y.; Wang, M.; Shen, Z.; Shao, D.; Shi, F. Present-Day Slip Rates and Potential Earthquake Risks along The Nujiang Fault. Seismol. Geol. 2015, 37, 374–383. [Google Scholar] [CrossRef]
  40. Chang, Z.; An, X.; Zhang, Y. Study on Late-Quaternary Activity and Displacement of Drainage Systems along the Wanding Fault. Seismol. Geol. 2012, 34, 228–239. [Google Scholar] [CrossRef]
  41. Shi, F. Tectonic Geomorphology of the Nantinghe Fault in Southwestern Yunnan. Doctoral Dissertations, Institute of Geology, China Earthquake Administrator, Beijing, China, 2014. [Google Scholar]
  42. Chang, Z.; Zhang, Y.; Li, J.; Zang, Y. The Geological and Geomorphic Characteristic of Late Quaternary Activity of the Deqin-Zhongdian-Daju Fault. J. Seismol. Res. 2014, 37, 46–52. [Google Scholar]
  43. Xu, X.; Wen, X.; Zheng, R.; Ma, W.; Song, F.; Yu, G. The latest tectonic change pattern and its dynamic source of active blocks in Sichuan-Yunnan region. Sci. China Ser. D Earth Sci. 2003, 33, 151–162. [Google Scholar] [CrossRef]
  44. Guo, S.; Zhang, J.; Li, X.; Xiang, H.; Chen, T.; Zhang, G. Fault Displacement and Recurrence Intervals of Earthquakes at the Northern Segment of The Honghe Fault Zone, Yunnan Province. Seismol. Geol. 1984, 6, 1–12. [Google Scholar]
  45. Shi, X.; Wang, Y.; Sieh, K.; Weldon, R.; Feng, L.; Chan, C.; Liu-Zeng, J. Fault Slip and GPS Velocities Across the Shan Plateau Define a Curved Southwestward Crustal Motion Around the Eastern Himalayan Syntaxis. J. Geophys. Res. Solid Earth 2018, 123, 2502–2518. [Google Scholar] [CrossRef] [Green Version]
  46. Li, Z.; Gan, W.; Qin, S.; Hao, M.; Liang, S.; Yang, F. Present-day deformation characteristics of the southeast borderland of the Tibetan Plateau. Chin. J. Geophys. 2019, 62, 4540–4553. [Google Scholar]
  47. Xiang, H.; Xu, X.; Guo, S.; Zhang, W.; Li, H.; Yu, G. Sinistral Thrusting Along the Lijiang-Xiaojinhe Fault Since Quaternary and Its Geologic-Tectonic Significance—Shielding Effect of Transverse Structure of Intracontinental Active Block. Seismol. Geol. 2002, 24, 188–198. [Google Scholar]
  48. Huang, X.; Wu, Z.; Liu, F.; Tian, T.; Huang, X.; Zhang, D. Tectonic interpretation of the main paleoseismic landslides and their distribution characteristics in the Chenghai fault zone, Northwest Yunnan. Earth Sci. Front. 2021, 28, 125–139. [Google Scholar] [CrossRef]
  49. Huang, X.; Wu, Z.; Huang, X.; Luo, R. Tectonic geomorphology constrains on quaternary activity and segmentation along Chenghai-Binchuan fault zone in Northwest Yunnan, China. Earth Sci. 2018, 43, 4651–4670. [Google Scholar] [CrossRef]
  50. Fang, Y.; Luo, W.; Ye, H.; Zhou, Y. Late Quaternary Activity of Heqing-Eryuan Fault and Its Impact on Water Diversion Project in the Central Yunnan. S. China J. Seismol. 2019, 39, 6–13. [Google Scholar]
  51. Sun, C.; Li, D.; Shen, X.; Kang, Y.; Liu, R.; Zhang, Y. Holocene activity evidence on the southeast boundary fault of Heqing basin, middle segment of Heqing-Eryuan fault zone, West Yunnan Province, China. J. Mt. Sci. 2017, 14, 1445–1453. [Google Scholar] [CrossRef]
  52. Wang, Y.; Zhang, B.; Hou, J.; Ai, S. Late Quaternary Activity of the Qujiang Fault and Analysis of the Slip Rate. Seismol. Geol. 2015, 37, 1177–1192. [Google Scholar]
  53. Wang, H.; Liu, M.; Cao, J.; Shen, X.; Zhang, G. Slip rates and seismic moment deficits on major active faults in mainland China. J. Geophys. Res. Solid Earth 2011, 116, B02405. [Google Scholar] [CrossRef] [Green Version]
  54. Liu, R.; Chen, Y.; Bormann, P.; Ren, X.; Hou, J.; Zou, L.; Yang, H. Comparison between Earthquake Magnitudes Determined by China Seismograph Network and U.S. Seismograph Network (II): Surface Wave Magnitude. Acta Seismol. Sin. 2006, 19, 1–7. [Google Scholar] [CrossRef]
  55. Wu, Z.; Zhao, G.; Long, Z.; Zhou, C.; Fan, T. The Seismic Hazard Assessment around South-East Area of Qinghai-Xizang Plateau: A Preliminary Results from Active Tectonics System Analysis. Acta Geol. Sin. 2014, 88, 1401–1416. [Google Scholar]
  56. Ding, R.; Ren, J.; Zhang, S.; Lu, Y.; Liu, H. Late Quaternary Paleoearthquakes on the Middle Segment of the Lijiang-Xiaojinhe Fault, Southeastern Tibet. Seismol. Geol. 2018, 40, 622–640. [Google Scholar]
  57. Wang, K.; Jin, M.; Huang, Y.; Dang, W.; Li, W.; Zhuo, Y.; He, C. Temporal and spatial evolution of the 2021 Yangbi (Yunnan China) Ms6.4 earthquake sequence. Seismol. Geol. 2021, 43, 1030–1039. [Google Scholar] [CrossRef]
  58. Zhou, Q.; Guo, S.; Xiang, H. Principle and Method of Delineation of Potential Seismic Sources in Northeastern Yunnan Province. Seismol. Geol. 2004, 26, 761–771. [Google Scholar]
  59. Cheng, J.; Liu, J.; Gan, W.; Li, G. Influence of coseismic deformation of the Wenchuan earthquake on the occurrence of earthquakes on active faults in Sichuan-Yunnan region. Acta Seismol. Sin. 2009, 31, 477–490. [Google Scholar]
  60. Li, L.; Liu, X.; Wan, Y.; Zheng, Z. Crustal deformation characteristics and recent movement changes of main fault zones in northwest Yunnan revealed by GPS and numerical simulation. Acta Geol. Sin. 2021, 95, 3205–3219. [Google Scholar]
  61. Zhao, B.; Bürgmann, R.; Wang, D.; Zhang, J.; Yu, J.; Li, Q. Aseismic slip and recent ruptures of persistent asperities along the Alaska-Aleutian subduction zone. Nat. Commun. 2022, 13, 3098. [Google Scholar] [CrossRef] [PubMed]
  62. McCaffrey, R.; Qamar, A.; King, R.; Wells, R.; Khazaradze, G.; Williams, C.; Stevens, C.; Vollick, J.; Zwick, P. Fault locking, block rotation and crustal deformation in the Pacific Northwest. Geophys. J. Int. 2007, 169, 1315–1340. [Google Scholar] [CrossRef] [Green Version]
  63. Mccaffrey, R. Time-dependent inversion of three-component continuous GPS for steady and transient sources in northern Cascadia. Geophys. Res. Lett. 2009, 36, 2497–2502. [Google Scholar] [CrossRef] [Green Version]
  64. Li, Y.C.; Dan, X.J.; Song, X.G.; Jiang, Y.; Gan, W.J.; Qu, C.Y.; Wang, Z.J. Fault locking and slip rate deficit on the middle and southern segment of the Tancheng-Lujiang fault inverted from GPS data. Chin. J. Geophys. 2016, 59, 4022–4034. [Google Scholar] [CrossRef]
  65. Yang, J.; Wen, Y.; Xu, C. The 21 May 2021 MS6.4 Yangbi (Yunnan) earthquake: A shallow strike-slip event rupturing in a blind fault. Chin. J. Geophys. 2021, 64, 3101–3110. [Google Scholar] [CrossRef]
  66. Xu, X.; Ji, L.; Zhu, L.; Wang, G.; Zhang, W.; Li, N. The Co-Seismic Deformation Characteristics and Seismogenic Structure of the Yangbi Ms6.4 Earthquake. Seismol. Geol. 2021, 43, 771–789. [Google Scholar] [CrossRef]
Figure 1. Schematic diagram of the distribution of active faults and moderately strong earthquakes in northwest Yunnan, where the Yangbi Ms 6.4 earthquake of 2021 was located. The green star denotes epicenter and the dense blue circles denote foreshocks and aftershocks before 24 May (earthquake catalog is from Yang et al. [8]). The colored dots are historical earthquakes with M ≥ 5 from 1900 to the present, where the radius of the dots distinguishes the magnitude and the color distinguishes the approximate age. Seismic data were obtained from Xu et al. [9] and the China Earthquake Network Center (http://www.cenc.ac.cn/ (accessed on 1 January 2021)). NTHF: Nantinghe fault; WTADF: Wanding–Anding fault; NJF: Nujiang fault; LCJF: Lancangjiang fault; WX-QHF: Weixi–Qiaohou fault; LJXJHF: Lijiang–Xiaojinhe fault; NH-CHF: Nanhua–Chuxiong fault; RRF: Red River fault; HQ-ERF: Heqing–Eryuan fault; CHF: Chenghai fault; NJ-WSF: Nanjian–Weishan fault.
Remotesensing 15 03195 g001
Figure 2. GPS crustal movement horizontal velocity field under the Eurasian reference frame. The blue arrows are the velocity field of the ‘China Crustal Movement Observation Network’ (Phase I and II) calculated by Wang and Shen [6]. The red arrows are the velocity field of the self-built observation station, and the error ellipses represent 70% confidence.
Remotesensing 15 03195 g002
Figure 3. Smoothing distance of strain rate field.
Remotesensing 15 03195 g003
Figure 4. Strain rate field and rotation rate field. (a) The maximum shear strain rate (background color), principal strain rate; (b) dilatational strain rate (background color, the negative indicates compression and the positive denotes extension), principal strain rate; (c) rotation rate (the negative indicates clockwise and the positive indicates anti-clockwise).
Remotesensing 15 03195 g004
Figure 5. Three-dimensional fault model. F1 Nantinghe fault; F2 Wanding fault; F3 Nujiang fault; F4 Lancangjiang fault; F5 Lanping–Yunlong fault F6 Yongping fault; F7 Weixi–Qiaohou fault; F8 south section of Jinshajiang fault (Jidala section); F9 Deqin–Zhongdian–Daju fault; F10 Lijiang–Xiaojinhe fault; F11 Yuanmou fault; F12 Chuxiong–Nanhua fault; F13 Honghe fault; F14 Chenghai fault; F15 Heqing–Eryuan fault; F16 Jianchuan–Qiaohou fault; F17 Nanjian–Weishan fault.
Remotesensing 15 03195 g005
Figure 6. (a) Residual value of model fitting; (b) modeled strike—slip rates. Red lines denote sinistral movements and blue lines represent dextral movements. (c) Modeled dip—slip rates. Red lines indicate tension rate and blue lines indicate extrusion rate. The faults abbreviations are shown in Figure 1.
Remotesensing 15 03195 g006
Figure 7. The seismic moment deficit of the main faults, where the color of the fault segment indicates the seismic moment deficit, the thickness indicates the sum of the total sliding rates of the fault and the number in parentheses indicates the magnitude of the equivalent moment of the earthquake if the earthquake released all moments.
Remotesensing 15 03195 g007
Figure 8. Seismic risk distribution map. The red area satisfies three characteristics and the blue area satisfies two characteristics. The small red dot indicates small earthquakes from April 2018 to August 2020.
Remotesensing 15 03195 g008
Figure 9. Block division, fitting residuals and distribution of fault locking.
Remotesensing 15 03195 g009
Table 1. The velocity of the self-built GNSS observation network under the Eurasian reference frame.
SiteLongitudeLatitudeVe
(mm/yr)
Vn
(mm/yr)
Se
(mm/yr)
Sn
(mm/yr)
Cen
EYFY99.9225.993.40−12.610.940.90−0.04
EYNJ99.9826.062.29−12.390.930.90−0.06
EYSY100.0126.232.42−15.710.930.90−0.01
EYHH99.7326.001.88−12.820.930.90−0.01
EYLG99.8925.892.41−13.140.700.690.09
EYTZ99.8426.172.93−13.320.700.69−0.01
EYXP99.6126.051.10−14.210.700.69−0.03
EYYX99.7026.120.99−15.110.700.690.04
JCMS99.6426.27−0.34−13.630.580.580.10
JCXT99.5226.221.19−13.970.580.580.03
JCYC99.7126.520.89−13.310.580.570.00
JCHC99.9426.382.62−13.330.720.71−0.07
JCMD99.5626.390.64−12.950.580.57−0.02
JCSH99.8626.253.77−12.620.580.57−0.06
JCSL99.8026.382.88−14.530.710.70−0.04
YBZM100.0225.713.77−12.240.710.700.01
YBZZ99.7925.662.12−12.690.700.690.01
YBXL99.9125.642.52−11.940.700.690.00
YLCX99.4326.050.39−12.540.580.58−0.13
YLZH99.4426.210.85−11.031.281.410.07
YLGP99.5625.900.97−11.180.580.58−0.03
YLTJ99.6525.731.09−13.840.580.58−0.11
YSXG100.4526.205.44−8.711.351.47−0.04
BCHQ100.4325.915.72−10.661.331.470.08
DLWS100.2825.834.65−7.581.281.40−0.03
HQHP100.2626.102.42−11.671.281.20−0.03
EYAJ99.8025.840.70−9.330.670.69−0.07
HQBX100.1426.325.42−12.760.720.70−0.10
Note: Ve: the velocity of EW direction, where eastward movement is positive; Vn: the velocity of SN direction, where northward movement is positive; Se: error of Ve; Sn: error of Vn; Cen: the coefficient between Ve and Vn.
Table 2. Inversion results of main faults.
FaultDip AngleLocking DepthSlip Rate (mm/yr)Extrusion/Tension Rate (mm/yr)
Inversion Geological InversionGeological
Nantinghe9025−2.8 ± 1.1−3.6 ± 0.4−1.6 ± 0.7−1.1 ± 0.3
Wanting9025−4.6 ± 1.0−1.7–3−2.9 ± 1.0
Nujiang90255.5 ± 1.1 −2.2 ± 1.0
Northern segment of Lancangjiang fault90253.3 ± 0.8 1.0 ± 0.7
Lanping–Yunlong90251.4 ± 0.60.1–0.190.7 ± 0.6
Yongping90251.8 ± 0.70.1–0.190.8 ± 0.7
Yuanmou9025−2.7 ± 0.71–21.9 ± 0.50.1–0.3
Deqin–Zhongdian–Daju90252.7 ± 0.6 −1.5 ± 0.6
South section of Jinshajiang fault (Jirada section)90251.4 ± 0.8 1.5 ± 0.7
Lijiang–Xiaojinhe9025−4 ± 0.8−3.8 ± 0.70.6 ± 0.60.64 ± 0.14
Jianchuan–Qiaohou 90250.8 ± 0.3 1.1 ± 0.5
Heqing–Eryuan9025−3.6 ± 0.6−1.8–2.0−0.54 ± 1.0
Chenghai9025−3.1 ± 0.7−1–1.2−0.6 ± 0.7
Chuxiong–Nanhua90255.4 ± 1.02.3–41.1 ± 0.7
Northern segment of Red River fault90251.9 ± 0.7 1.0 ± 0.9
Middle section of Red River fault90252.5 ± 0.7 −0.3 ± 0.6
Weixi–Qiaohou90251.1 ± 0.7 1–3−0.75 ± 0.7
Table 3. Accumulation, release and deficit of seismic moments on faults.
FaultElapsed Time/aMoment Accumulation Rate
(1017 N·m/a)
Moment Accumulation
(1020 N·m)
Moment Release
(1020 N·m)
Moment Deficit
(1020 N·m)
Equivalent Earthquake Magnitude
NTH8113.4151.08701.0877.3
WD-AD102211.17111.4170.02511.3928.0
NJ9220.8891.92201.9227.5
DQ-ZD-DJ10224.4444.5420.0994.3537.7
JC-QH2710.5420.14700.1476.7
LJ-XJH17006.57611.180.19410.9868.0
HQ-EY1833.0040.55000.5507.1
CH5073.3101.6780.0541.6247.4
NH-CX3425.7481.9660.0251.9417.5
RRN971.5360.56800.5687.1
RRM3702.7780.2690.0360.2336.9
WX-QH6005.7243.4340.0363.3987.7
Disclaimer/Publisher’s Note: The statements, opinions and data contained in all publications are solely those of the individual author(s) and contributor(s) and not of MDPI and/or the editor(s). MDPI and/or the editor(s) disclaim responsibility for any injury to people or property resulting from any ideas, methods, instructions or products referred to in the content.

