Article

A Crustal Deformation Pattern on the Northeastern Margin of the Tibetan Plateau Derived from GPS Observations

Faculty of Geomatics, Lanzhou Jiaotong University, Lanzhou 730070, China
*
Author to whom correspondence should be addressed.
Remote Sens. 2023, 15(11), 2905; https://doi.org/10.3390/rs15112905
Submission received: 14 April 2023 / Revised: 29 May 2023 / Accepted: 31 May 2023 / Published: 2 June 2023
(This article belongs to the Special Issue Monitoring Subtle Ground Deformation of Geohazards from Space)

Abstract

:
The northeastern margin is a natural experimental field for studying crustal extrusion and expansion mechanisms. The accurate crustal deformation pattern is a key point in the analysis of regional deformation mechanisms and seismic hazard research and judgment. In this paper, the present-day GPS velocity field on the northeastern margin of the Tibetan Plateau was obtained from encrypted GPS observations around the Haiyuan–Liupanshan fault zone, combined with GPS observations on the northeastern margin of the Tibetan Plateau from 2010 to 2020. Firstly, we divided the study area into three relatively independent blocks: the ORDOS block, Alxa block, and Lanzhou block; secondly, the accurate fault distribution of the Haiyuan–Liupanshan fault zone was taken into account to obtain the optimal inversion model; finally, using the block and fault back-slip dislocation model, the inversion obtained the slip rate distribution, locking depth, and slip deficit rate of each fault. The results indicate that the Laohushan Fault and Haiyuan Fault are dominated by the left-lateral strike-slip, while the Liupanshan Fault is dominated by the thrust dip-slip, and the Guguan–Baoji Fault has both left-lateral strike-slip and thrust dip-slip components. The maximum locking depths of the Laohushan Fault, Haiyuan Fault, Liupanshan Fault, and Guguan–Baoji Fault are 5 km, 13 km, 15 km, and 10 km, respectively, and the locking of the Haiyuan Fault is strong in the middle section and weak in the eastern and western section. The Haiyuan Fault is still in the post-earthquake stress adjustment stage. The slip deficit rate decays from 3.6 mm/yr to 1.8 mm/yr from west to east along the fault zone. Combined with geological and historical seismic data, the results suggest that the mid-long-term seismic risk in the Liupanshan Fault is high.

Graphical Abstract

1. Introduction

The northeastern margin of the Tibetan Plateau is the frontal region of the uplift development that has expanded into the continental interior, the newest and forming part of the plateau, and a natural experimental field to study the continental interior deformation of China. The extrusion and deformation of the crust have resulted in the formation of complex tectonic zones and seismic activity zones; a series of historical earthquakes occurred on the active faults in the region and margins (Figure 1), such as the 1920 Haiyuan M8.5 earthquake and the 1927 Gulang M8.0 earthquake, which occurred on the HYF [1] (Figure 1). According to the back-slip theory, a fault can accumulate strain accumulation near the fault surface due to the relative motion of the footwall and hangingwall blocks when the fault is locked and produce a slip deficit phenomenon [2]. Ref. [3] obtained the crustal motions from the Caucasus mountains to the Adriatic Sea and north–south from the southern edge of the Eurasian plate to the northern edge of the African plate at 189 GPS sites. Ref. [4] analyzed the complex kinematic and deformation fields in the North Aegean Sea and adjacent regions using GPS observations from 1993 to 2009. Ref. [5] studied the crustal deformation in the Northern Aegean Sea using GPS data. Ref. [6] used the GPS velocity field to explore the detailed complexity of Aegean tectonics. Therefore, the quantitative study of the deformation and strain accumulation characteristics of the main faults in this region to achieve precise crustal deformation patterns are the key to analyzing the mechanisms of regional deformation and assessing seismic hazards.
Many scholars have conducted large numbers of studies on this region using three methods: geological methods, GPS, and InSAR. However, due to different spatial resolutions of data, station density, observation duration, and model selection, the slip rates and deformation characteristics show significant discrepancies (Table 1).
In summary, the slip rates of the HYF obtained by geological methods are 3–10 mm/yr, with an average rate of 5–6 mm/yr; the slip rates of the HYF obtained derived from GPS observations and block deformation analysis are 2–9 mm/yr; and the slip rates of the LPSF are 1–3.5 mm/yr. Derived from InSAR technology, the average rate of the HYF is 3–5 mm/yr, and the LPSF is about 3 mm/yr.
In order to obtain a more accurate crustal deformation pattern of the faults on the northeastern corner of the Tibetan Plateau, this paper integrated the observations from encrypted GPS stations around the Haiyuan–Liupanshan fault zone, with the GPS observations on the northeastern margin of the Tibetan Plateau from 2010 to 2020, based on the block-fault back-slip dislocation model to obtain the locking depth, slip rate deficit distribution, and motion characteristics of the faults.

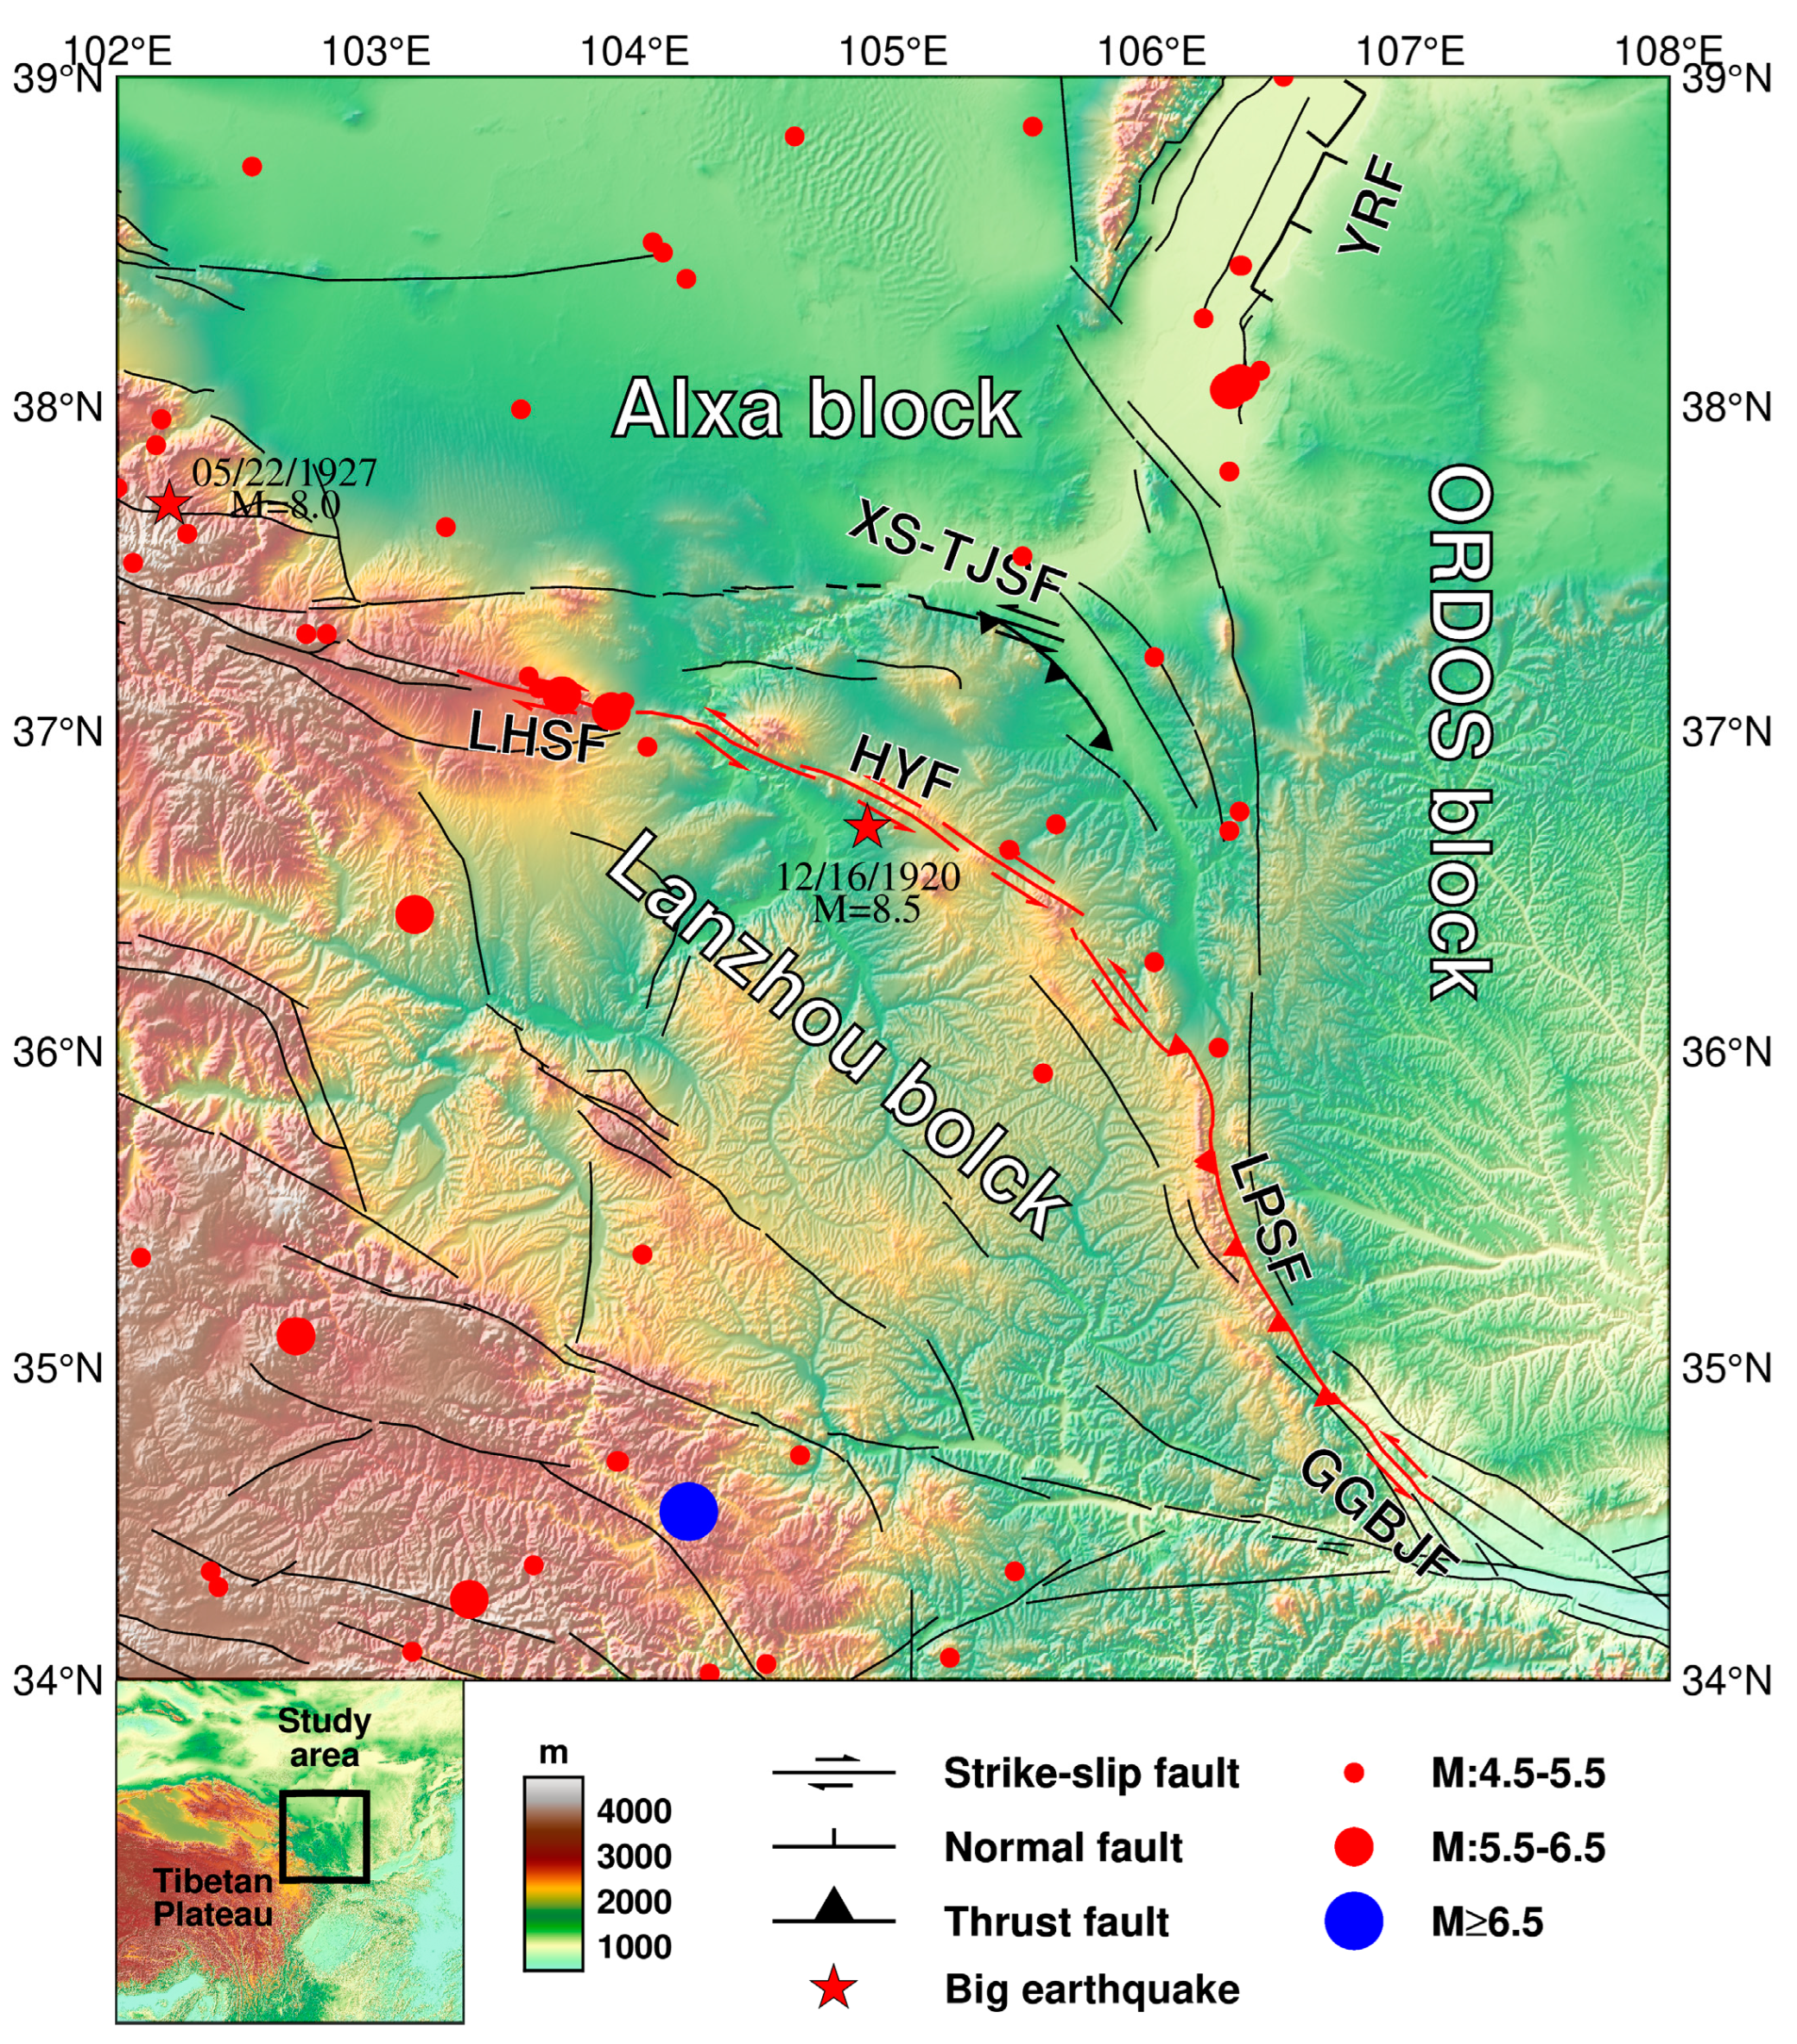
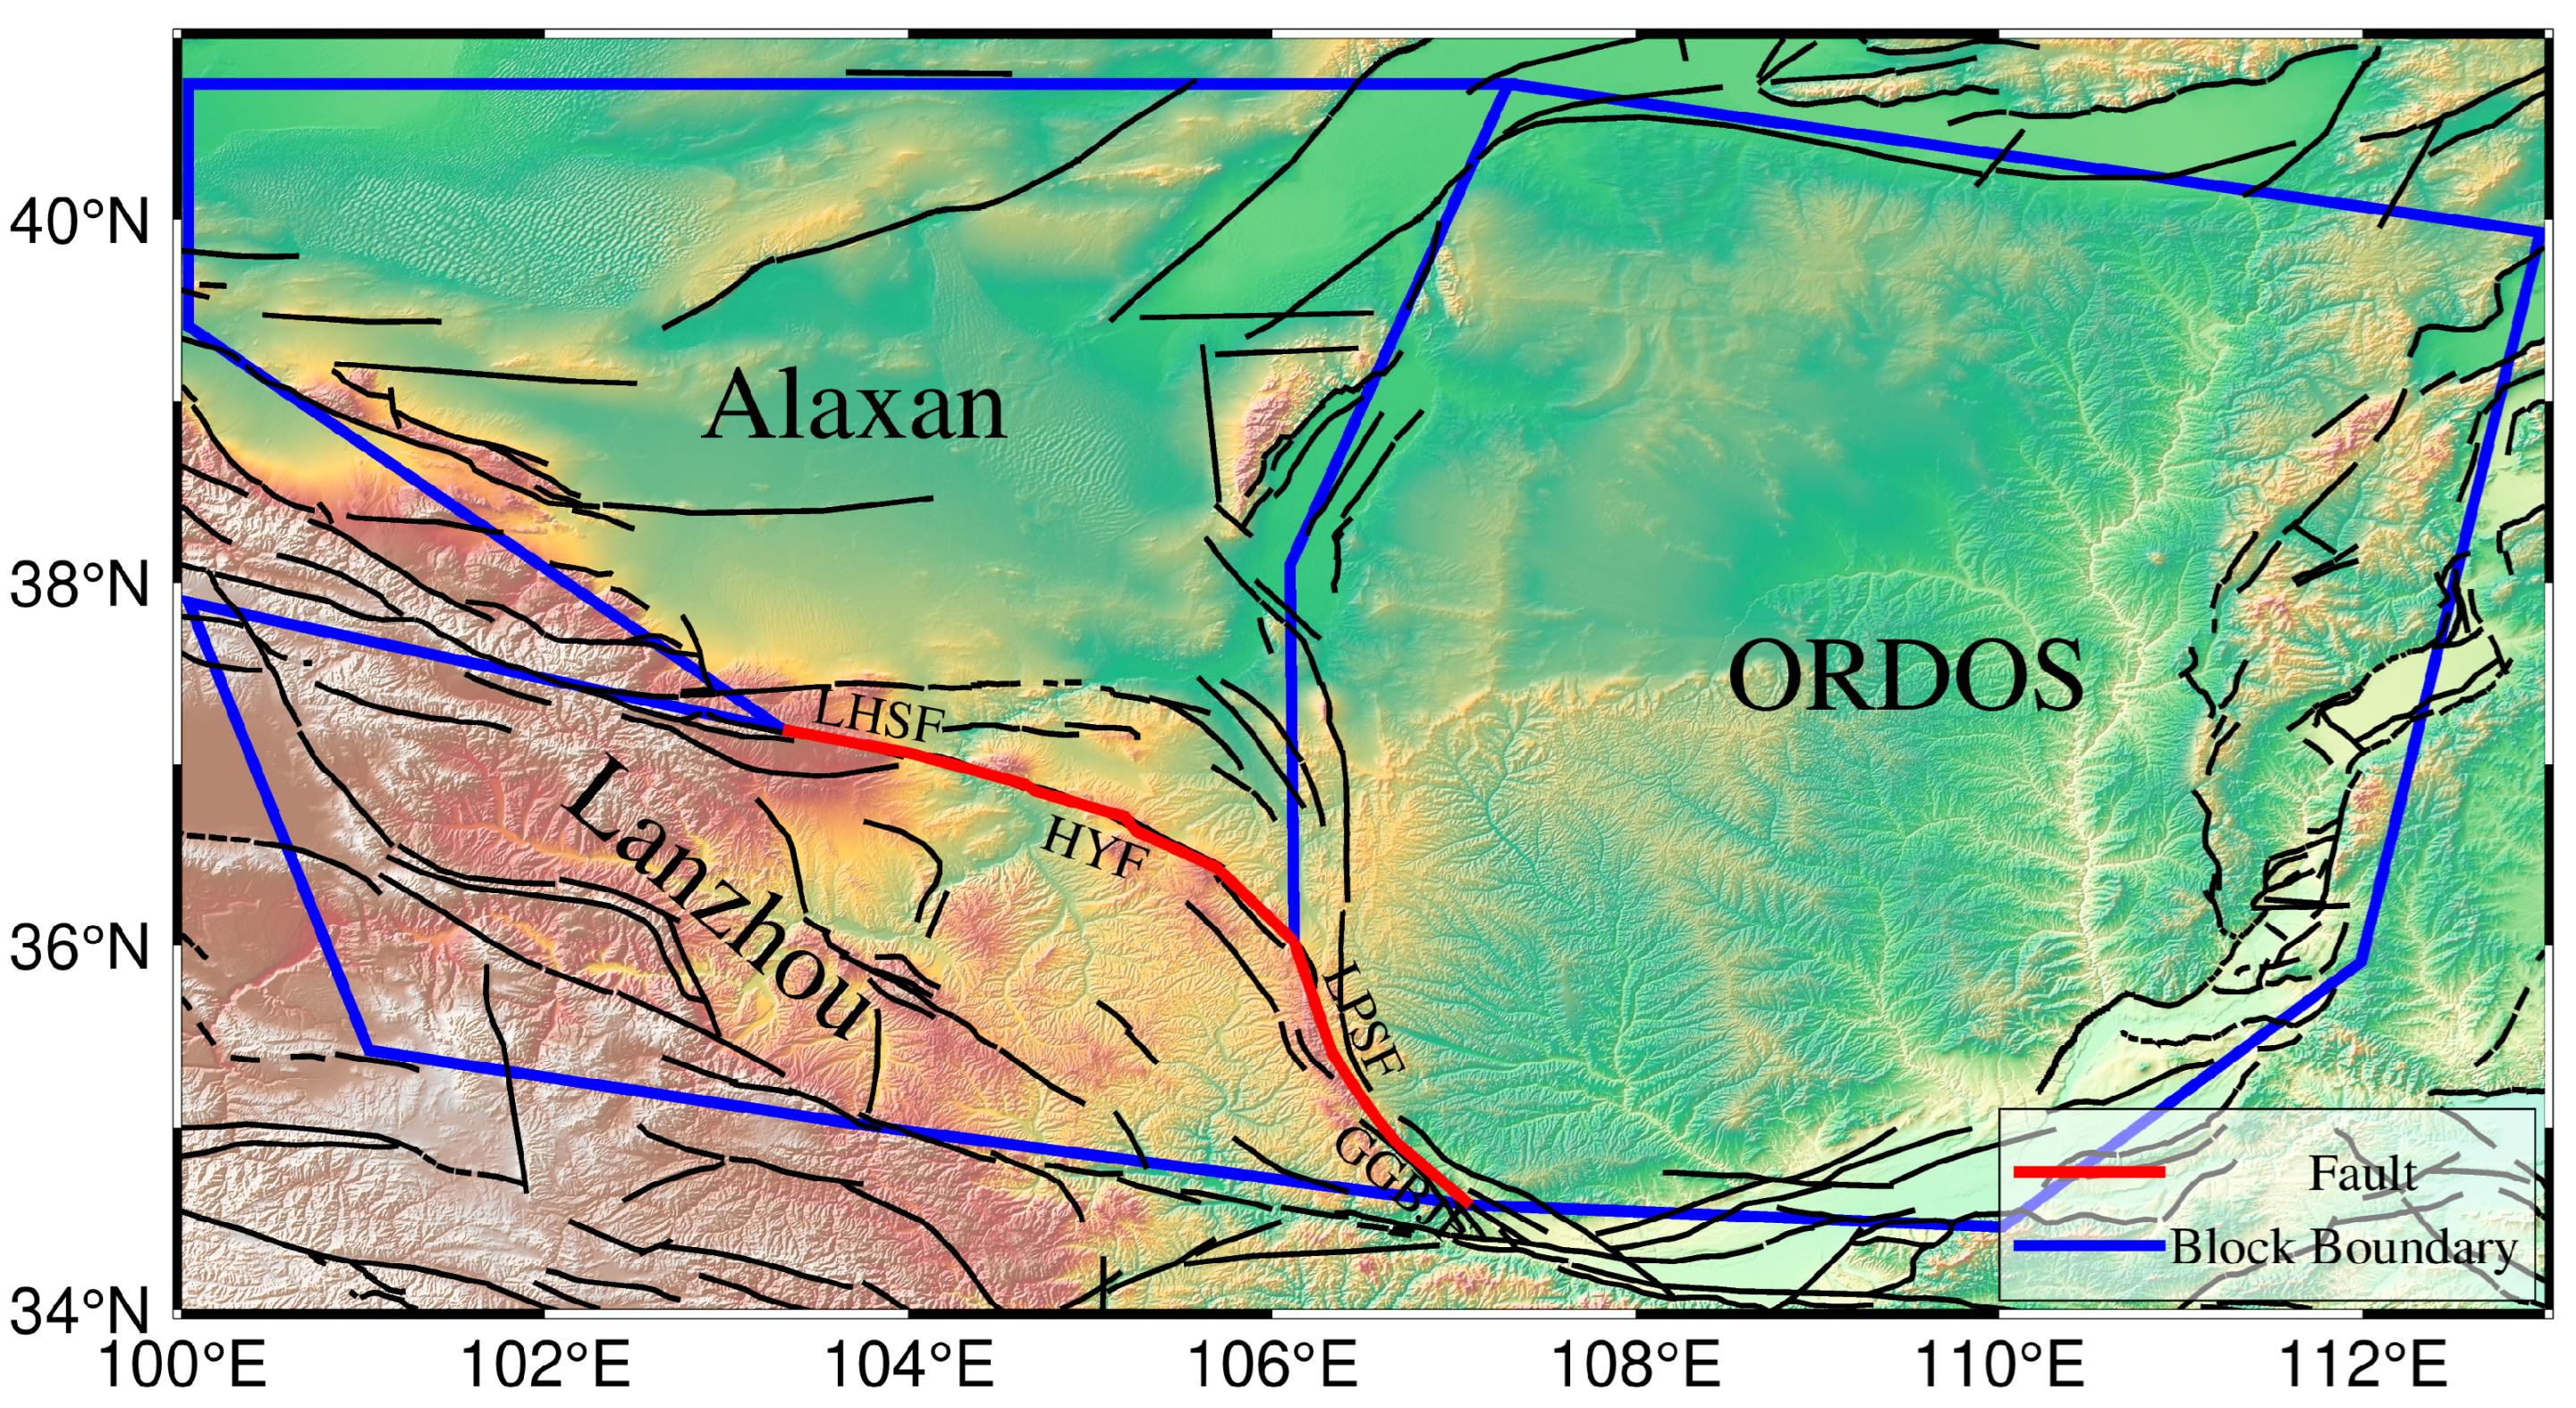
2. Regional Tectonic Background

Figure 1 shows the distribution of active faults and earthquakes. The northeastern margin of the Tibetan Plateau is located on the plate that is extruded eastward by the collisional contraction between the Indian and Eurasian plates at the orientation of N20°E [25]. The Haiyuan–Liupanshan fault zone is the boundary zone between the Lanzhou block and Alxa block on the northeastern corner of the Tibetan Plateau, which occupies a significant function for studying the mechanism of contraction and expansion of the Tibetan Plateau into the interior of the Chinese continent [26]. The HYF and LHSF are the junction faults between the Lanzhou and Alxa blocks, which are NWW, with the top of the arc convex to the NE (Figure 1), and its motion since the Late Cenozoic has been successively thrust left-lateral and strike-slip, and this strike-slip displacement has been absorbed by the LPSF to the east with east–west crustal shortening [27]; and earthquakes with a magnitude of more than seven have not occurred since 1920. The LPSF is located in the boundary zone between the Lanzhou block and the ORDOS block, which is a thrust fault and has left-lateral strike-slip characteristics [26]. Three earthquakes with a magnitude of above seven have occurred from 1200 to 1700 [28], and the earthquake risk should not be underestimated in the LPSF. The GGBJF is connected with the LPSF to the north and the northern edge of the West Qinling Fault in the south, which trends NNW (Figure 1). It can be considered as the southern extension of the LPSF, but its movement pattern is completely different from that, so its movement characteristics also deserve attention. Figure S1 shows the earthquake distribution with magnitudes of more than 3.0, and the time span is from 1976 to 2020. The data is from the National Earthquake Data Center of China (https://data.earthquake.cn/ accessed on 24 September 2022). We can find that many earthquakes have occurred in the northeast margin of the Tibetan Plateau, and the focal depths of most earthquakes are less than 25 km.

3. GPS Observation Data and Block Classification

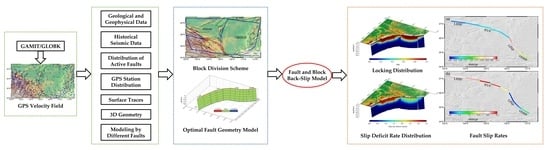
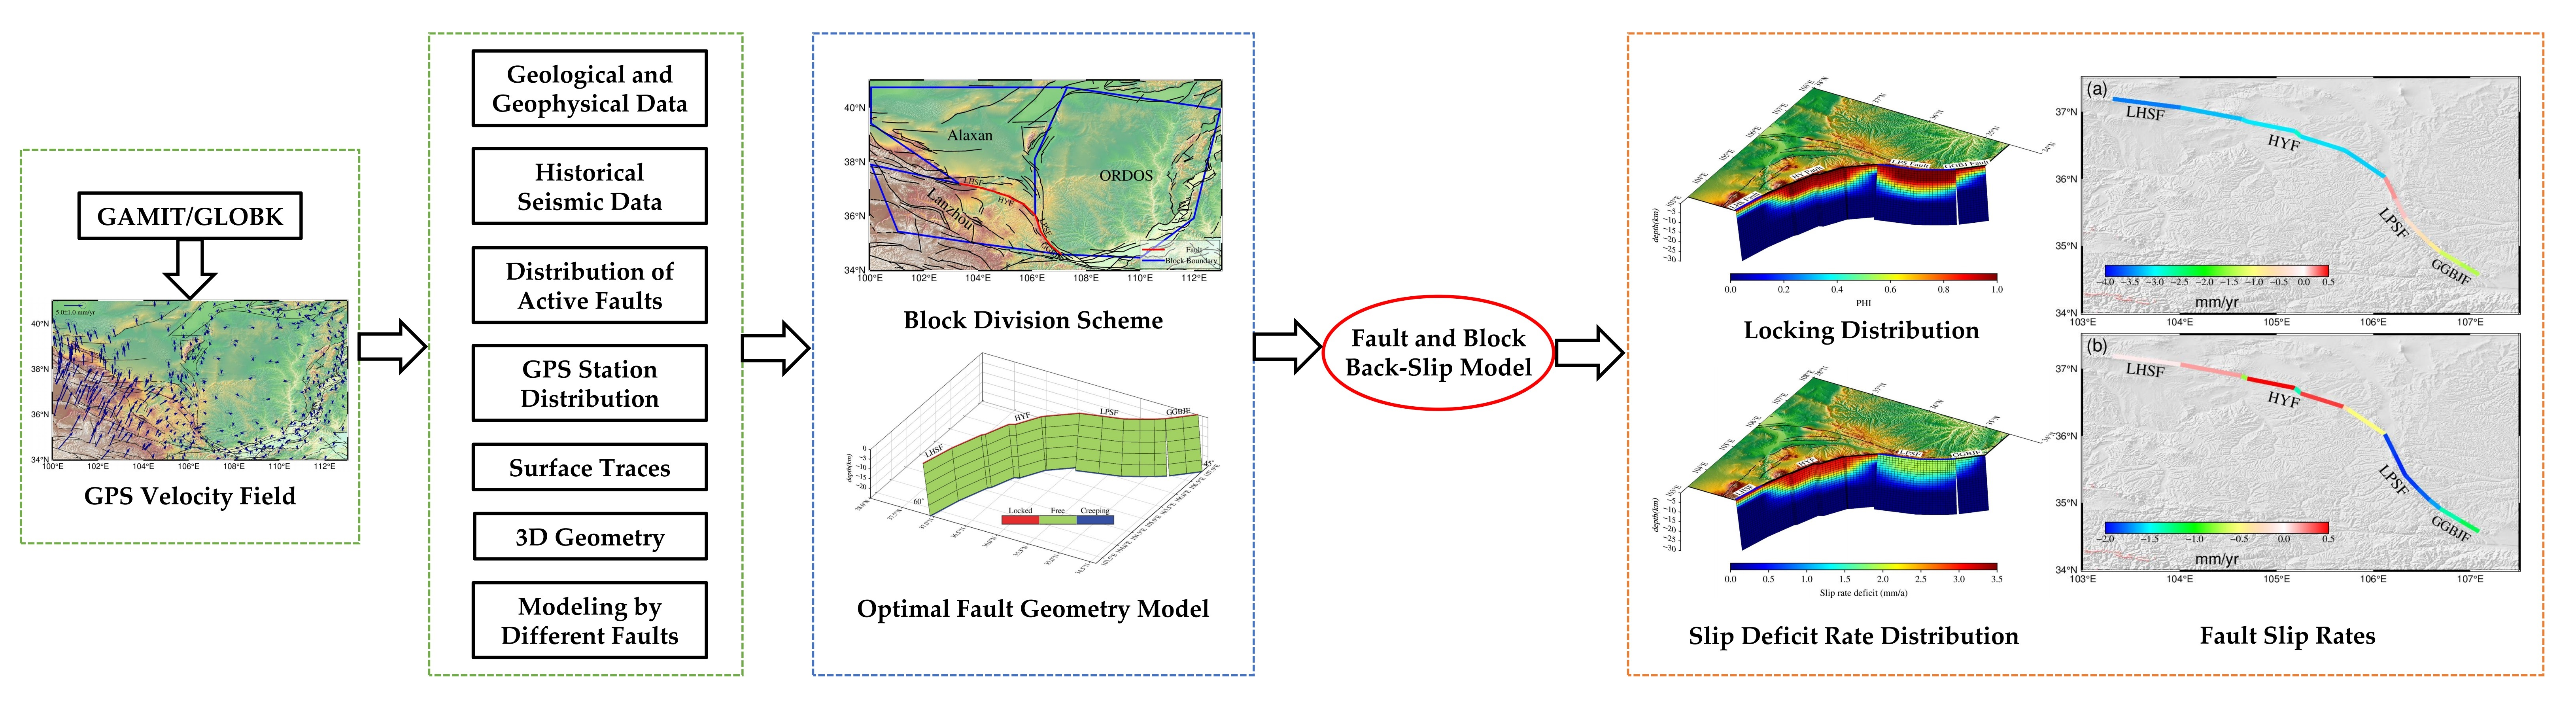
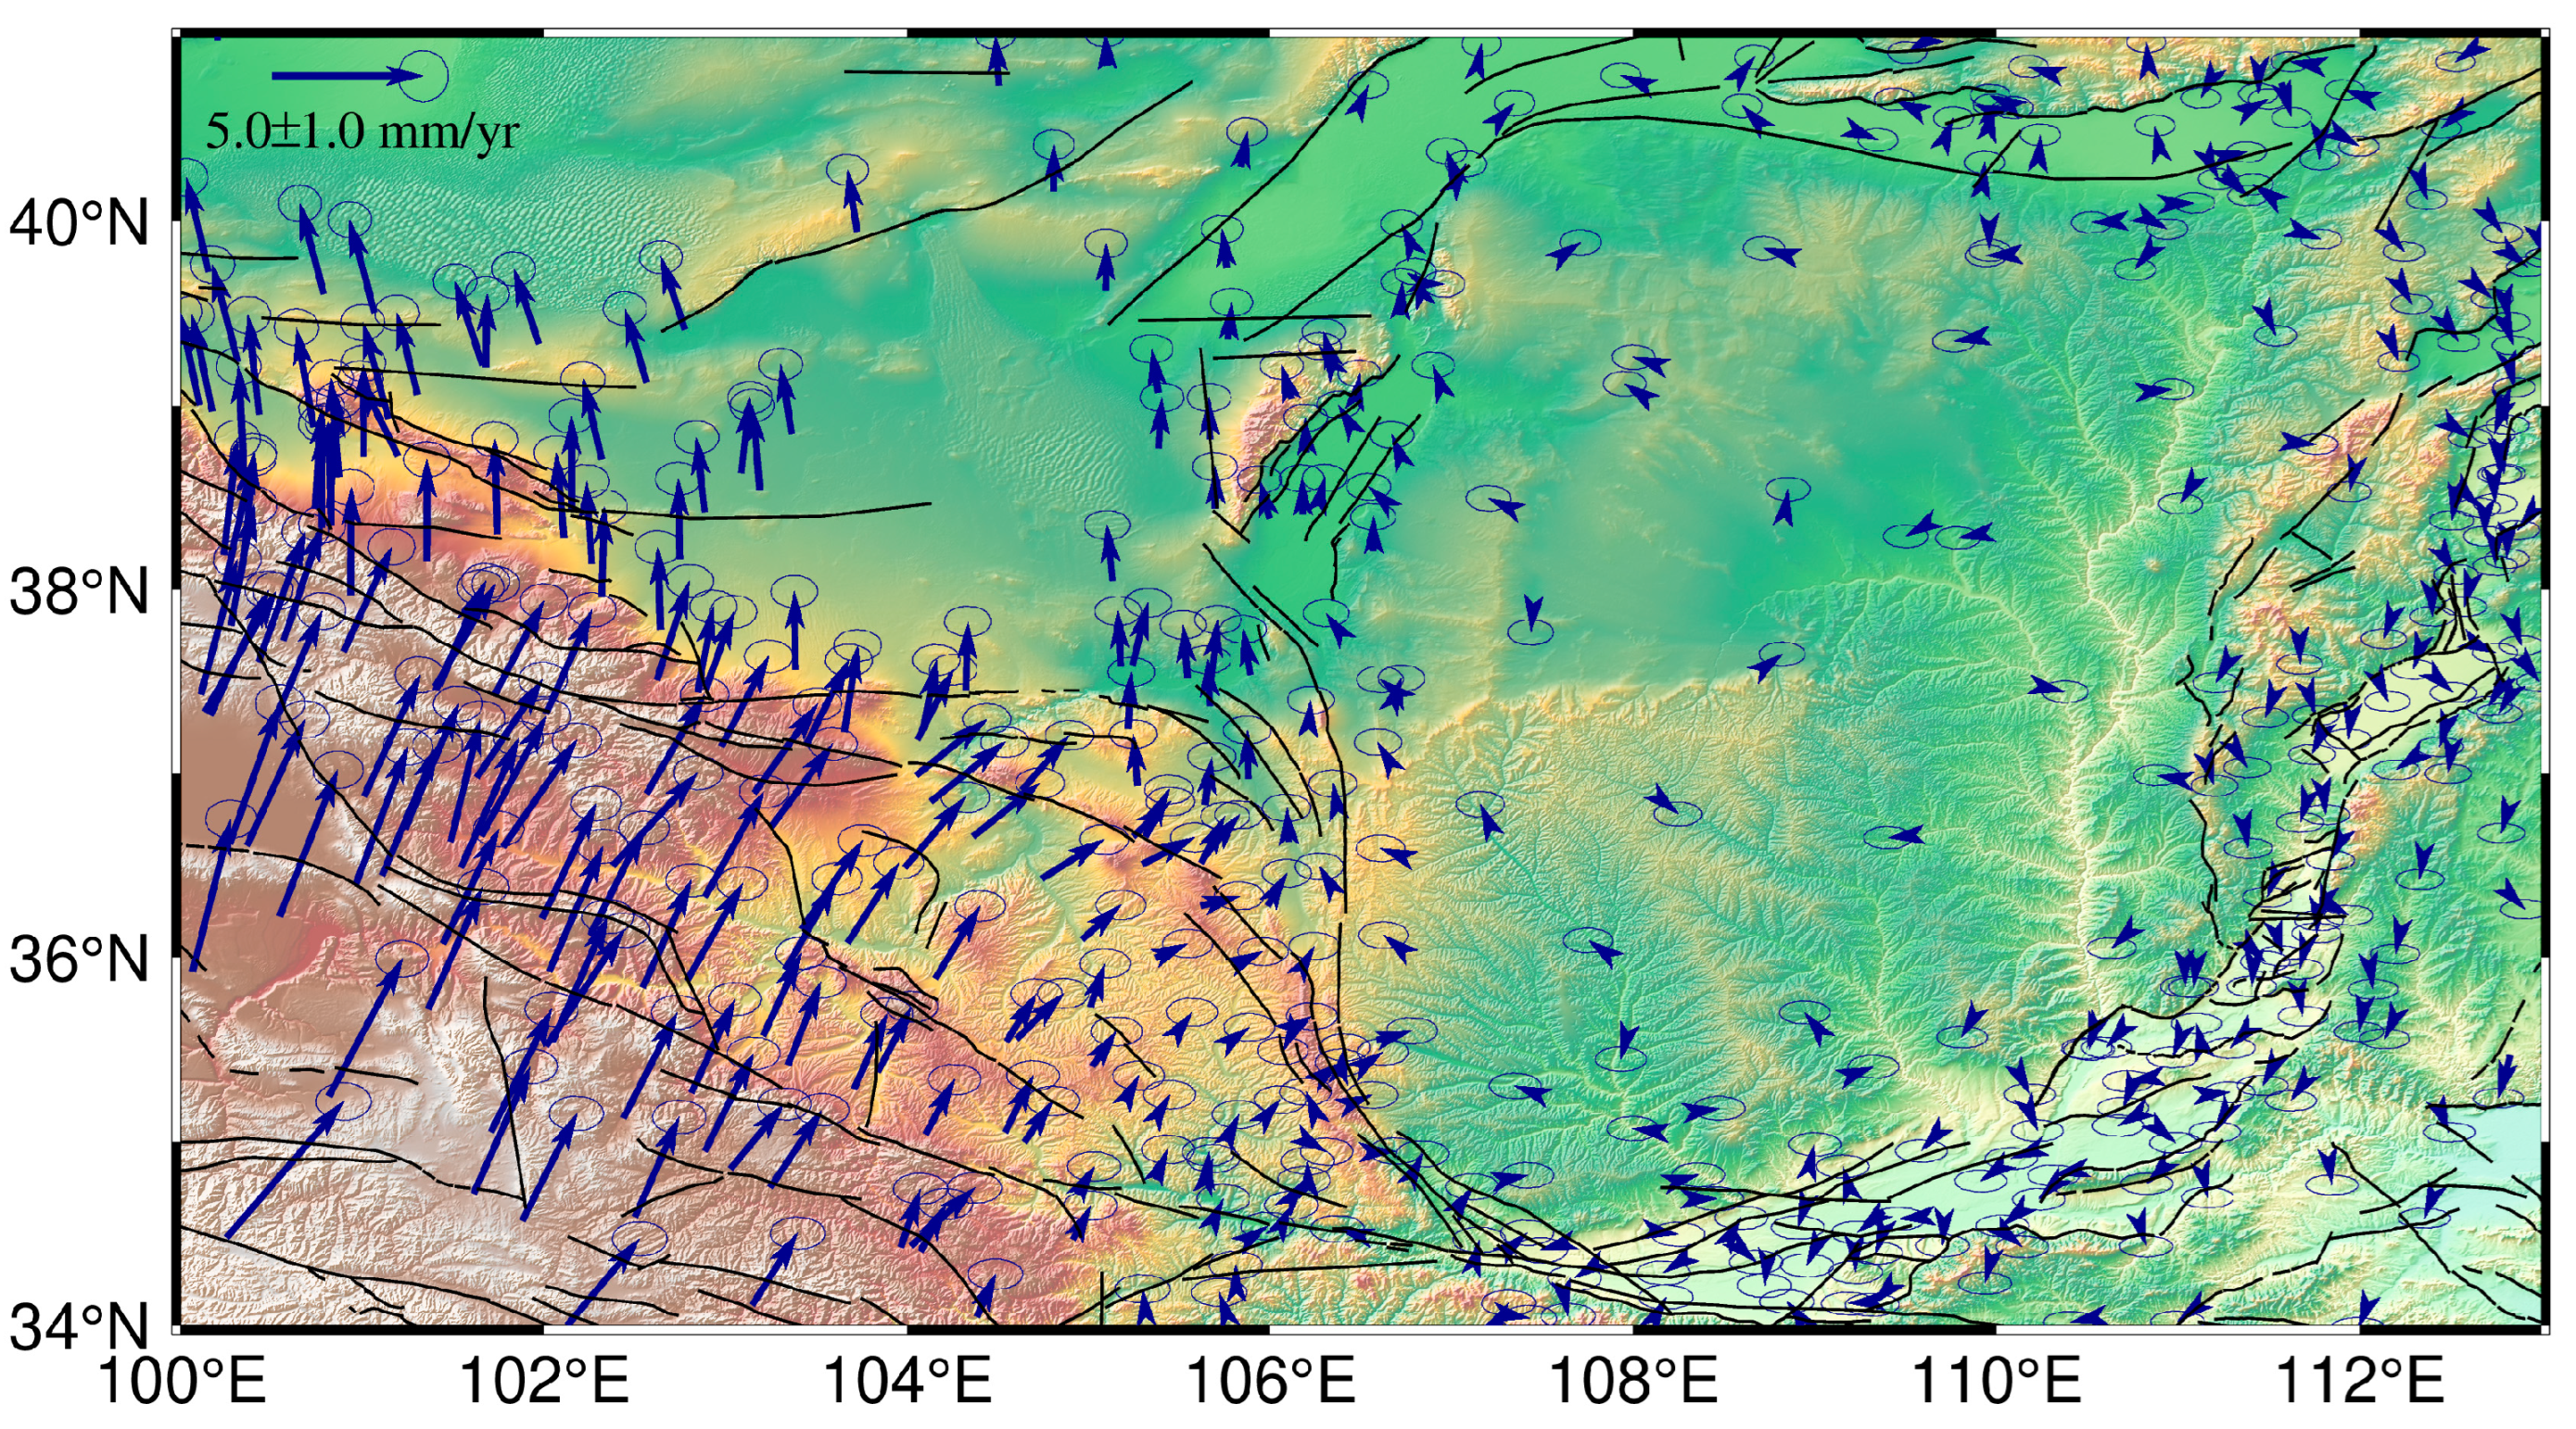
3.1. GPS Data and Data Processing

Figure 2 shows the GPS stations and corresponding horizontal motions with respect to the ORDOS reference block. The GPS observations were obtained from two observation networks. One is the China Continental Environmental Tectonic Monitoring Network (CMONOC), which includes 459 GPS stations in our research area, and the observation time span is from 2010 to 2020. In addition, to better constrain the near-field deformation of the HYF and LPSF, we installed the Institute of Earthquake Forecasting Seismic Forecasting Network (IEFNET) in 2013. The IEFNET includes ten GPS stations, eight stations with an average spacing of 20 km across the middle of LPSF, and another two stations with a spacing of 10 km across the Xiaokou Fault. The distribution of GPS stations of different observation networks can be found in Figure S1. Richer GPS observations were used to obtain the fault slip rate, accurately capture the fault activity characteristics, and discuss the transition of fault activity patterns in the intersection region of the HYF and LPSF. The station distribution covers the main faults, with most stations located near major seismic zones, providing data assurance for obtaining a more accurate regional three-dimensional GNSS velocity field and data basis for obtaining a more accurate crustal deformation pattern in this region.
GAMIT/GLOBK software, version 10.6, was employed to estimate the daily solutions of station coordinates [29,30]. The ORDOS reference frame was defined by five stable GPS stations, and the ITRF2014 velocity field was transformed into the ORDOS reference frame. The specific strategy of the GPS data process can be found in the literature [31]. Figure 2 shows the GPS velocity field with respect to the ORDOS block regional framework.

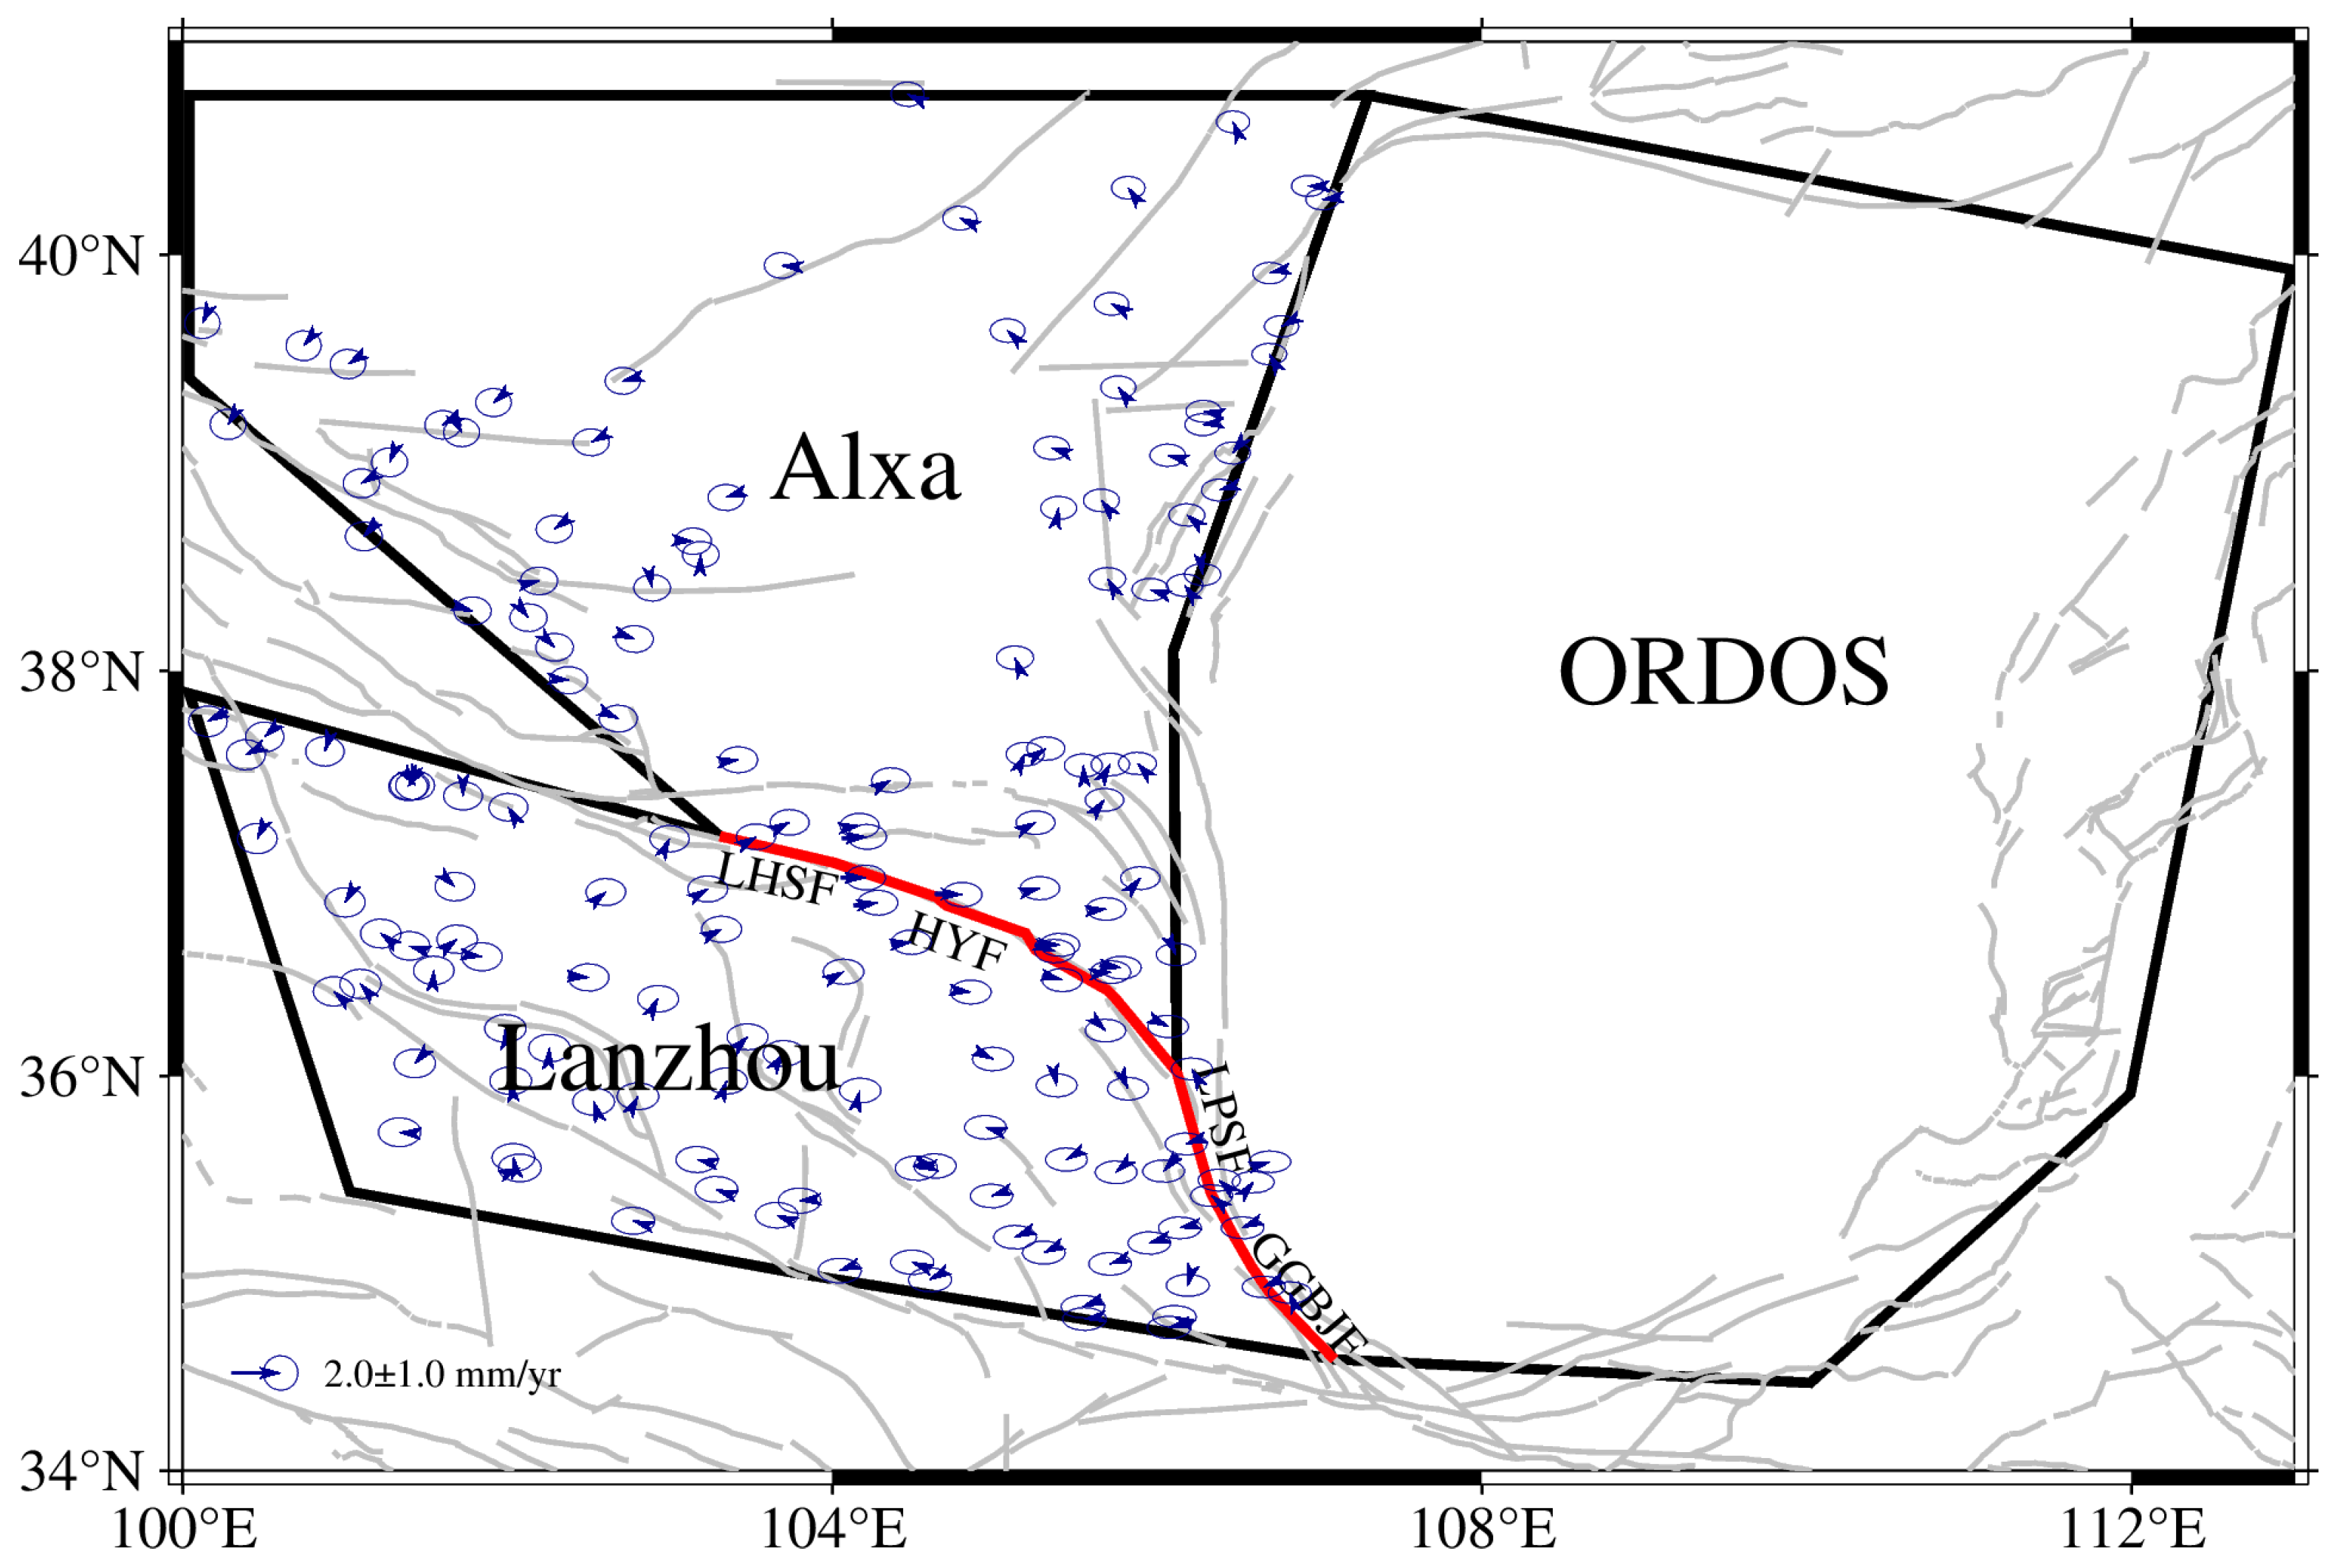
3.2. Block Division Scheme

According to the previous division model of blocks [32], the northeastern margin of the Tibetan Plateau is divided into the ORDOS block, Alxa block, and Lanzhou block with the boundaries of the LHSF, HYF, LPSF, and GGBJF, and block boundaries coincide with the active faults (Figure 3).

3.3. Fault Geometry Model

The LHSF is the boundary zone between the Alxa block and the Lanzhou block, and it intersects with the west section of the HYF; the GGBJF is the boundary zone between the ORDOS block and the Lanzhou block, which is an extensional fault of the LPSF and intersects the south section of it. Both the LHSF and GGBJF are highly active faults and have frequent historical earthquakes (Figure 1) and have a strong influence on the near-field observations of the Haiyuan–Liupanshan fault zone. In order to improve the accuracy of model inversion and better fit the GPS observations, the LHSF and GGBJF were added to the model, and the elastic deformation caused by their locking was considered. The LHSF and HYF are the boundary zone between the Alxa block and the Lanzhou block, and the LPSF and GGBJF are the boundary zone between the ORDOS block and the Lanzhou block.
Accurate determination of the geometric model of the fault could make the model better fit the observed GPS velocity field, thus reducing the residuals of the velocity field to obtain better results. When modeling the fault surface (Figure 4), the dip angle of the LHSF and HYF was set to 60° with an SSW tendency, and the dip angle of the LPSF and GGBJF was set to 45° with an SW tendency. The fault was set to be completely locked ( ϕ = 1) at 0.1 km and free-slipped ( ϕ = 0) below 25 km. The fault node parameterization type was set to a one-dimensional depth profile type in which the node value is a function of depth [33], which was expounded in detail in Section 6.2. In the inversion, two surface nodes were set along the strike, and six nodes were set along the depth direction for the LHSF. The HYF had eight surface nodes and six depth nodes, the LPSF had six surface nodes and six depth nodes, and the GGBJF had three surface nodes and six depth nodes. The fault surface node meshing was based on the actual surface traces of the active fault. Additionally, by setting surface and depth nodes along the strike and dip of the fault, the fault is constructed into a fault surface composed of many small grids. The locking fraction at each small grid is iteratively calculated using an inversion algorithm, thereby obtaining a continuous distribution of the locking fraction of the entire fault surface. The number of nodes on the fault surface and the depth are the optimal values obtained through extensive trial calculations. All these settings are aimed at obtaining more accurate crustal deformation characteristics.

4. Inversion Principle

The model of interseismic deformation inversion of fault is the block-fault back-slip dislocation model, which is calculated by the TDEFNODE program. Constrained by the GPS velocity field, the model can obtain the block rigid motion parameters of the elastic lithosphere, the uniform strain rate inside the block, and the surface elastic deformation caused by the fault locked at the block boundary by inversion [2,34,35,36]. The rigid motion of the block is represented by the Euler pole, the uniform strain rate inside the block is represented by the spherical formula [37], and the slip deficit rate on the fault surface is based on the elastic half-space model [38]. The detailed calculation formula is shown in McCaffrey (2002) [35]. One pure dynamical scalar ϕ is used to represent the degree of locking on the fault surface [34,36]. The locking fraction ϕ has no unit, ϕ = 0 indicates the fault is completely creeping, ϕ = 1 indicates the fault is completely locked, and ϕ between 0 and 1 indicates that the fault is partially locked; its mathematical expression is ϕ = 1 V c / V , V c , which represents the short-term creep rate of the fault, and V represents the long-term slip rate of the fault. The fault geometry is represented by an irregular grid formed by three-dimensional nodes (longitude, latitude, depth) on the fault surface. The ϕ value of each node is calculated in the inversion. In order to obtain the linear change in ϕ value between adjacent nodes, the locking fraction of each divided sub-fault surface is obtained by bilinear interpolation. The slip deficit rate on the fault surface can be expressed by the product of the locking fraction ϕ and the long-term slip rate V .
The goodness-of-fit of the model to the observed data can be expressed by the chi-square value χ n 2 (sum of chi-square/degree of freedom) [34]:
χ n 2 = i = 1 n ( r i f σ i ) 2 / f
In the formula, n is the number of observations, m is the number of parameters to be estimated, f is the degree of freedom; r i is the residual error of the observation, σ i   is the mean square error of the observation, and   f   is the weight of the observation. When χ n 2 approaches 1, we considered that the model fits the observed data well. The weighted root-mean-square error ( W r m s ) is defined as (McCaffrey, 2002) [35]:
W r m s = r i 2 ( f σ i ) 2 / 1 ( f σ i ) 2

5. GPS Data Inversion Results

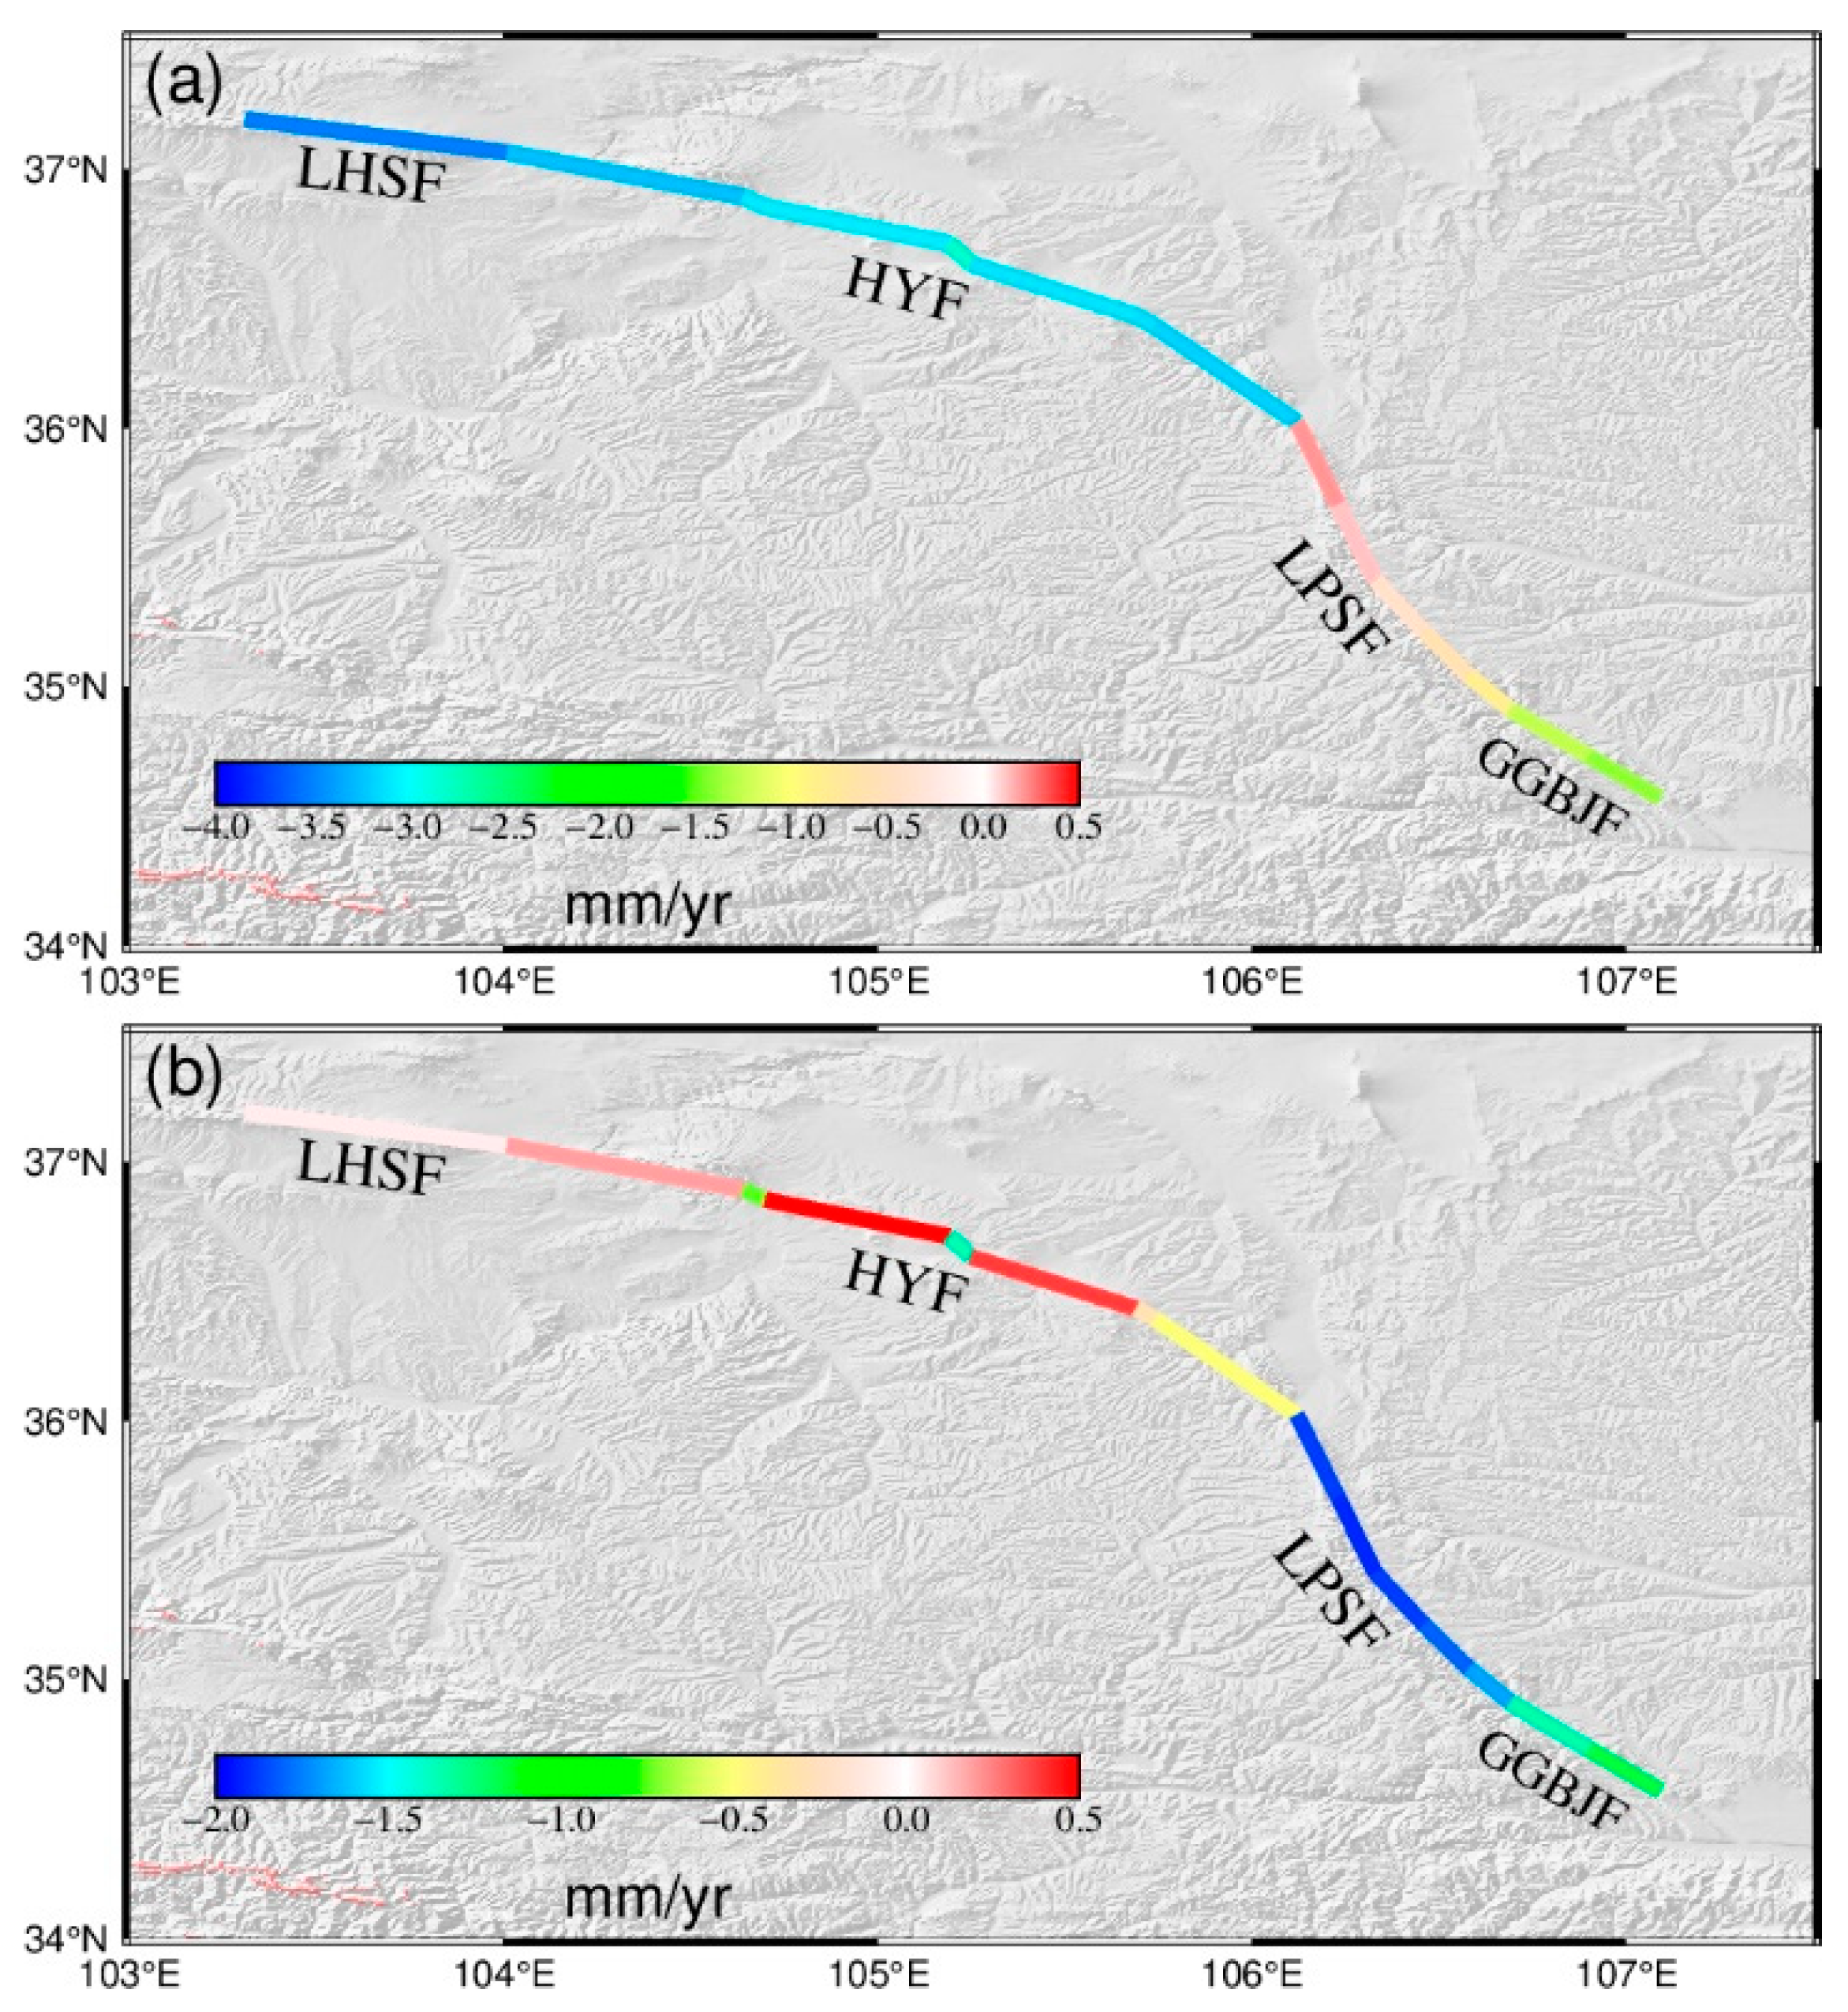
5.1. Fault Slip Rate

The slip rate of the faults quantitatively describes the relative motion of the hangingwall and footwall blocks of the fault, which is of great significance for extracting the characteristics of the deformation field. The TDEFNODE uses the inversed block motion parameters to calculate the slip rate of the boundary fault [39].
The slip rates of the LHSF, HYF, LPSF, and GGBJF are shown in Table 1 and Table 2 and Figure 5. The results of the best-fit model indicate that the LHSF is controlled by a left-lateral strike-slip at a rate of ~3.5 mm/yr, which is consistent with geology [11] and geodesy [12,15,17,18,24], approaching the result of 4.1 ± 0.4 mm/yr [21]. The HYF is controlled by a left-lateral strike-slip at a rate of 2.8–3.3 mm/yr, and the average rate is about 3 mm/yr, which is close to the results of 3.3–9.2 mm/yr obtained by geology [7] and 4.5 ± 1.1 mm/yr [11], is close to the GPS, InSAR, and other geodetic methods [12,15,17,18,23,24], and is also consistent with the rates of 3.9 ± 0.4 mm/yr, 3.7 ± 0.4 mm/yr, and 3.6 ± 0.4 mm/yr for the western, middle, and eastern sections of the HYF [21]. The average contraction rate is 0.6 mm/yr, and the maximum rate is 1.4 mm/yr in the middle of the fault. Overall, the slip rate of the HYF obtained by the geological method is 2–6.5 mm/yr [10,40]. Derived from the GPS, InSAR, and other geodetic methods, the slip rate of the HYF obtained by different scholars using the block model and dislocation model is 1.2–9 mm/yr; our results are within the range of the above results. The LPSF is controlled by a thrust contraction at a rate of 1.7–1.9 mm/yr and a slight left-lateral strike-slip at a rate of 0.1–0.9 mm/yr, which is close to the result rates of 1.3 ± 0.1 mm/yr and 1.7 ± 0.1 mm/yr for the north section and south section obtained by [19], at 1.4 mm/yr and 1.2 mm/yr [22]. The GGBJF has both left-lateral strike-slip and thrust extrusion components. The strike-slip rate is 1.3–1.4 mm/yr and the contraction rate is 1.2–1.3 mm/yr, which is consistent with the result of [22]. The slip rate of the HYF appears consistent with the results of [21], while the slip rate of the LPSF differs significantly. Similarly, the slip rate of the LPSF appears consistent with the results of [22], while the HYF differs significantly. We believe that the reasons for these differences are as follows. Firstly, this paper considered the impact of the activities of the near-field faults. Additionally, this paper included GPS observations from the near-field of the faults. In terms of model settings, they only set free nodes and locking fractions decreasing along the depth, while we set the locking fraction as a function of the depth. Finally, when constructing the fault, we considered the actual surface trace and three-dimensional geometry of the active fault. These differences are the reasons for different results.
Ref. [8] proposed that the total amount of the left-lateral strike-slip component of the HYF should be balanced with the crustal shortening in the LPSF. Based on the inversion results of the model, there is a difference of about ~1 mm/yr. We speculate that this part of the differential motion may be converted into strain accumulation in this region. Refs. [41,42] suggested that the north section and the south section of the LPSF both have the characteristics of thrust movement, and the thrust component of the north section is higher than the south section, which is consistent with our results.
To analyze the impact of fault node density along the fault strike direction on the inverted slip rates, we further increased the density of the nodes along the actual trace of the faults. The distance between adjacent nodes was set at 3–6 km. The inversion was then carried out again while ensuring that other parameters remained unchanged. The resulting fault slip rates are shown in Figure S3. Although there are differences in the inverted slip rates in some areas compared to the previous model, the Haiyuan Fault and the Liupanshan Fault still maintain their characteristic left-lateral strike-slip and thrust compression, respectively. This difference may be due to the different orientations between the newly added fault nodes and the original ones. Considering the limited spatial distribution density of the GPS stations, we believe that dividing dense fault nodes may not effectively improve the final results. The optimal inversion model should not only consider the surface nodes of the fault but also the maximum locking depth, fault dip angle, parameterization type of nodes, global restrictions of parameters, and smoothing methods. Using the residual GPS velocity field as the criterion, a large number of trials were carried out to obtain the optimal inversion result.

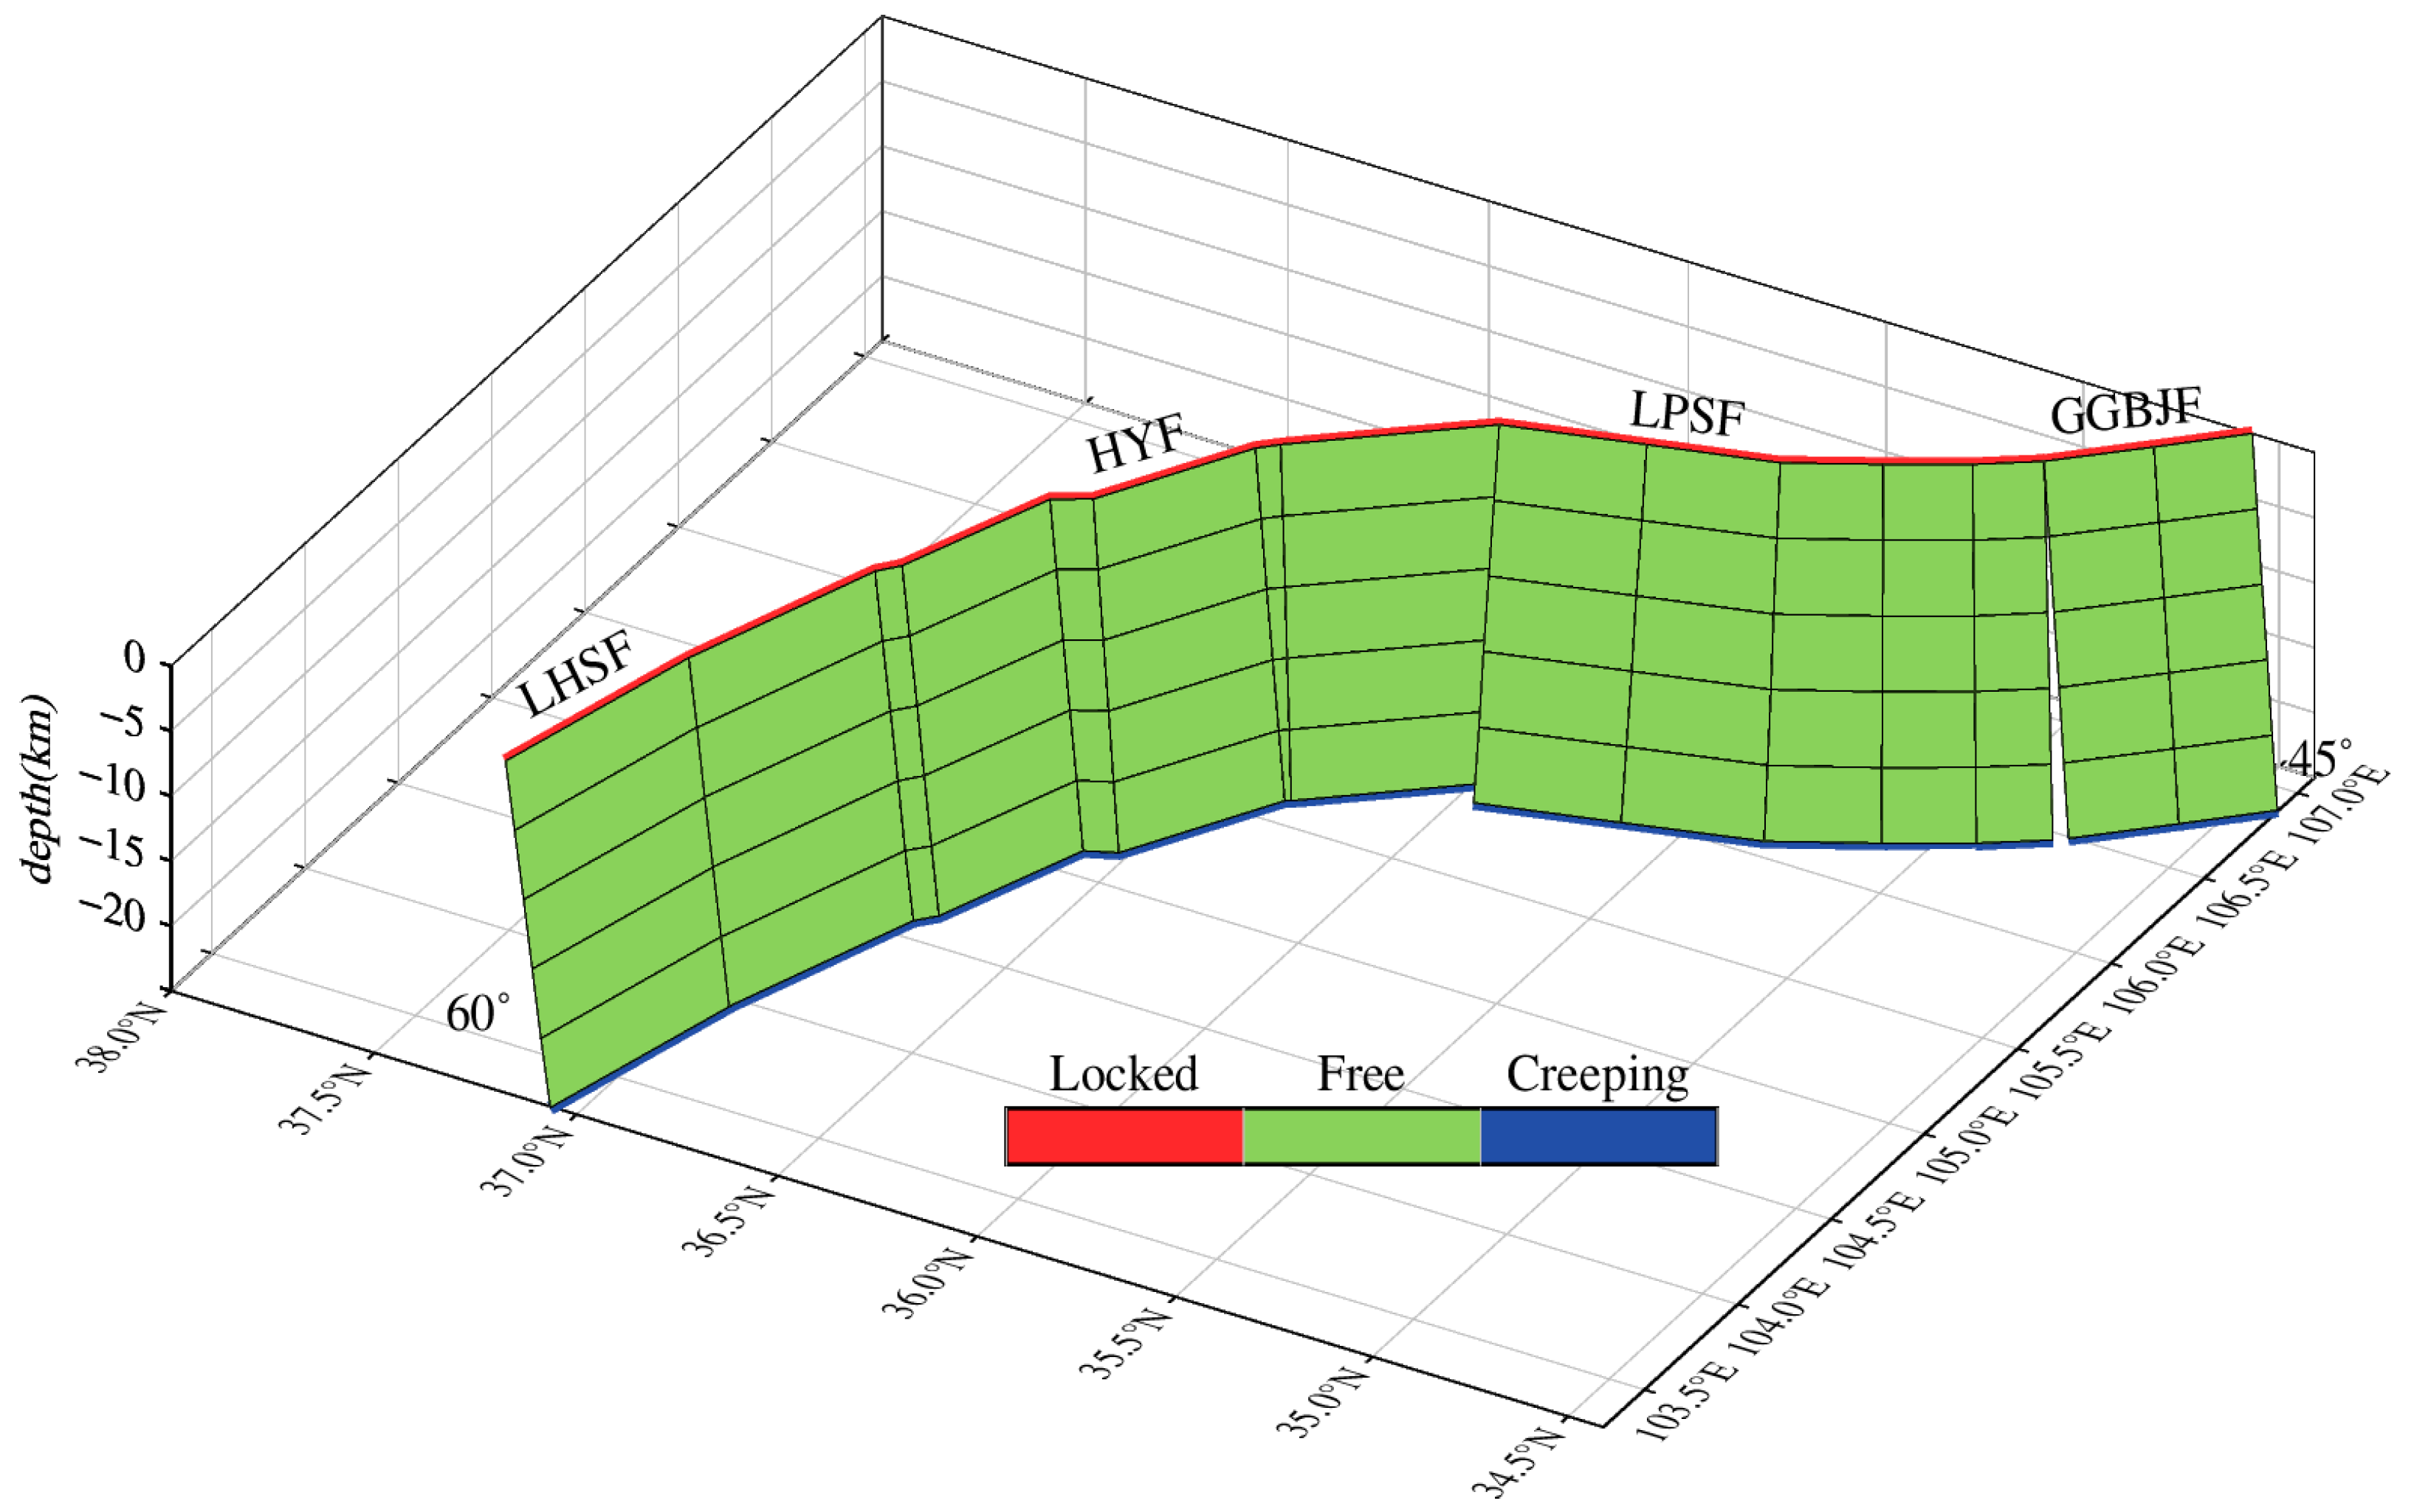
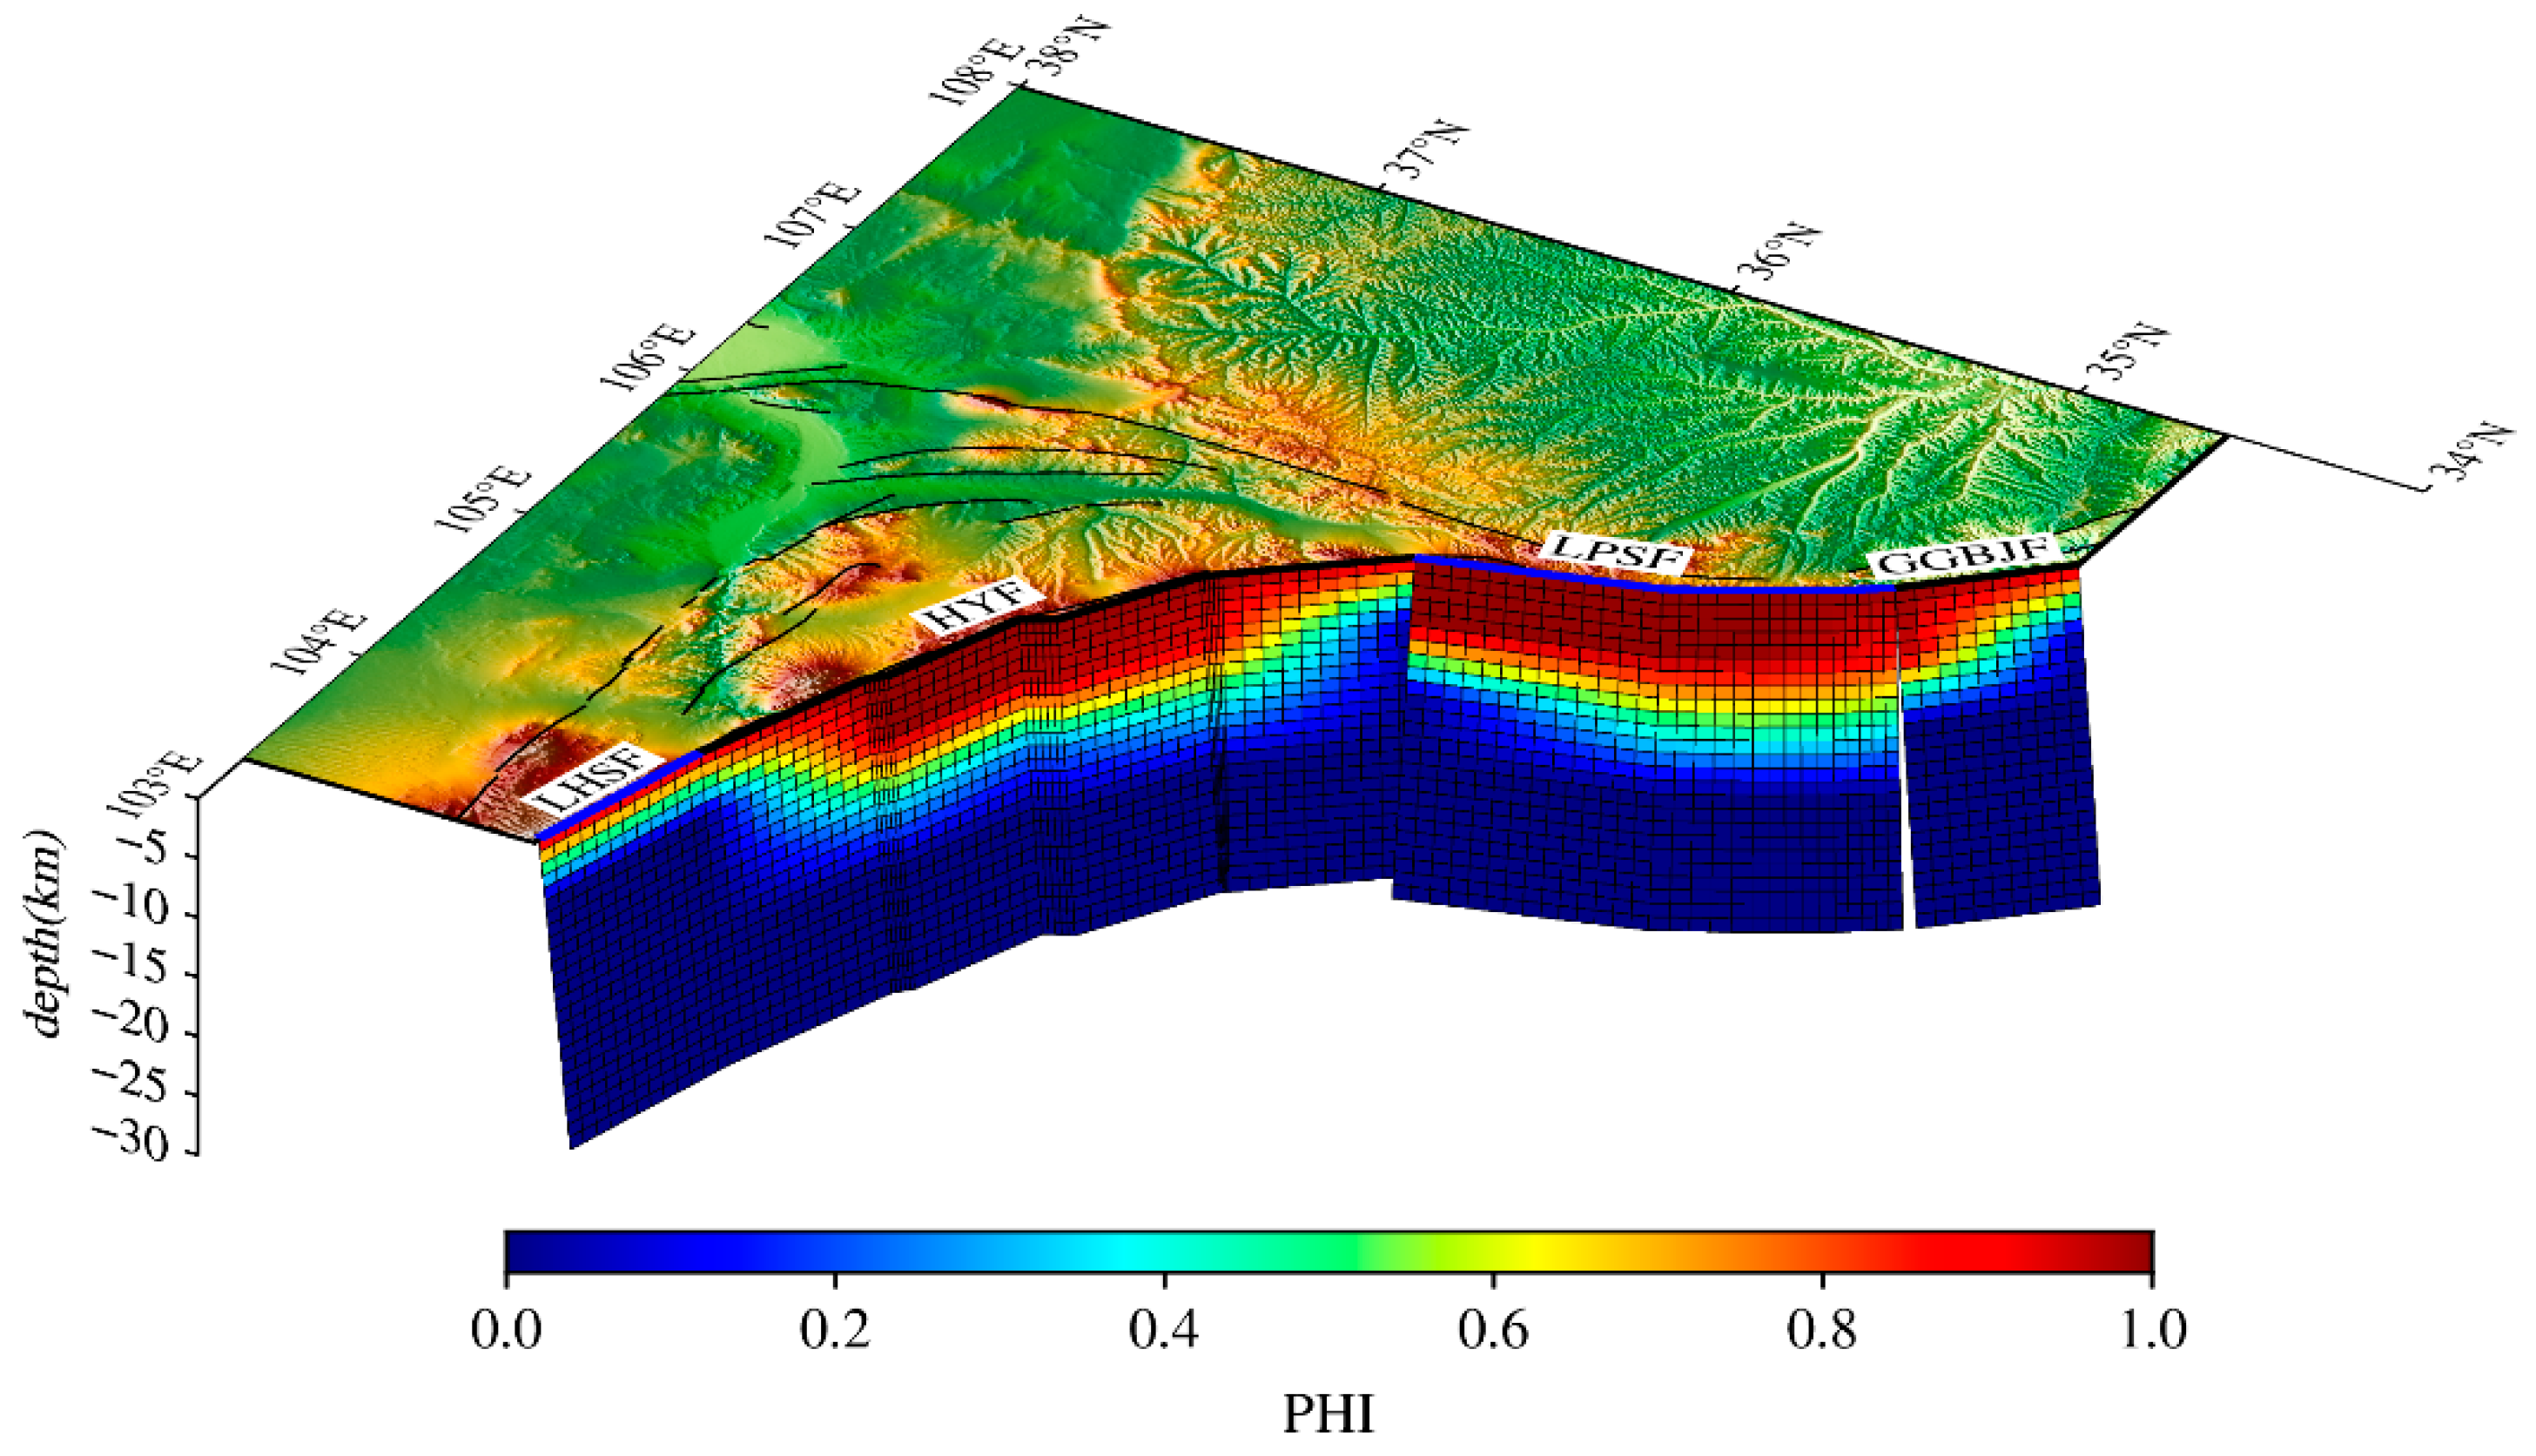
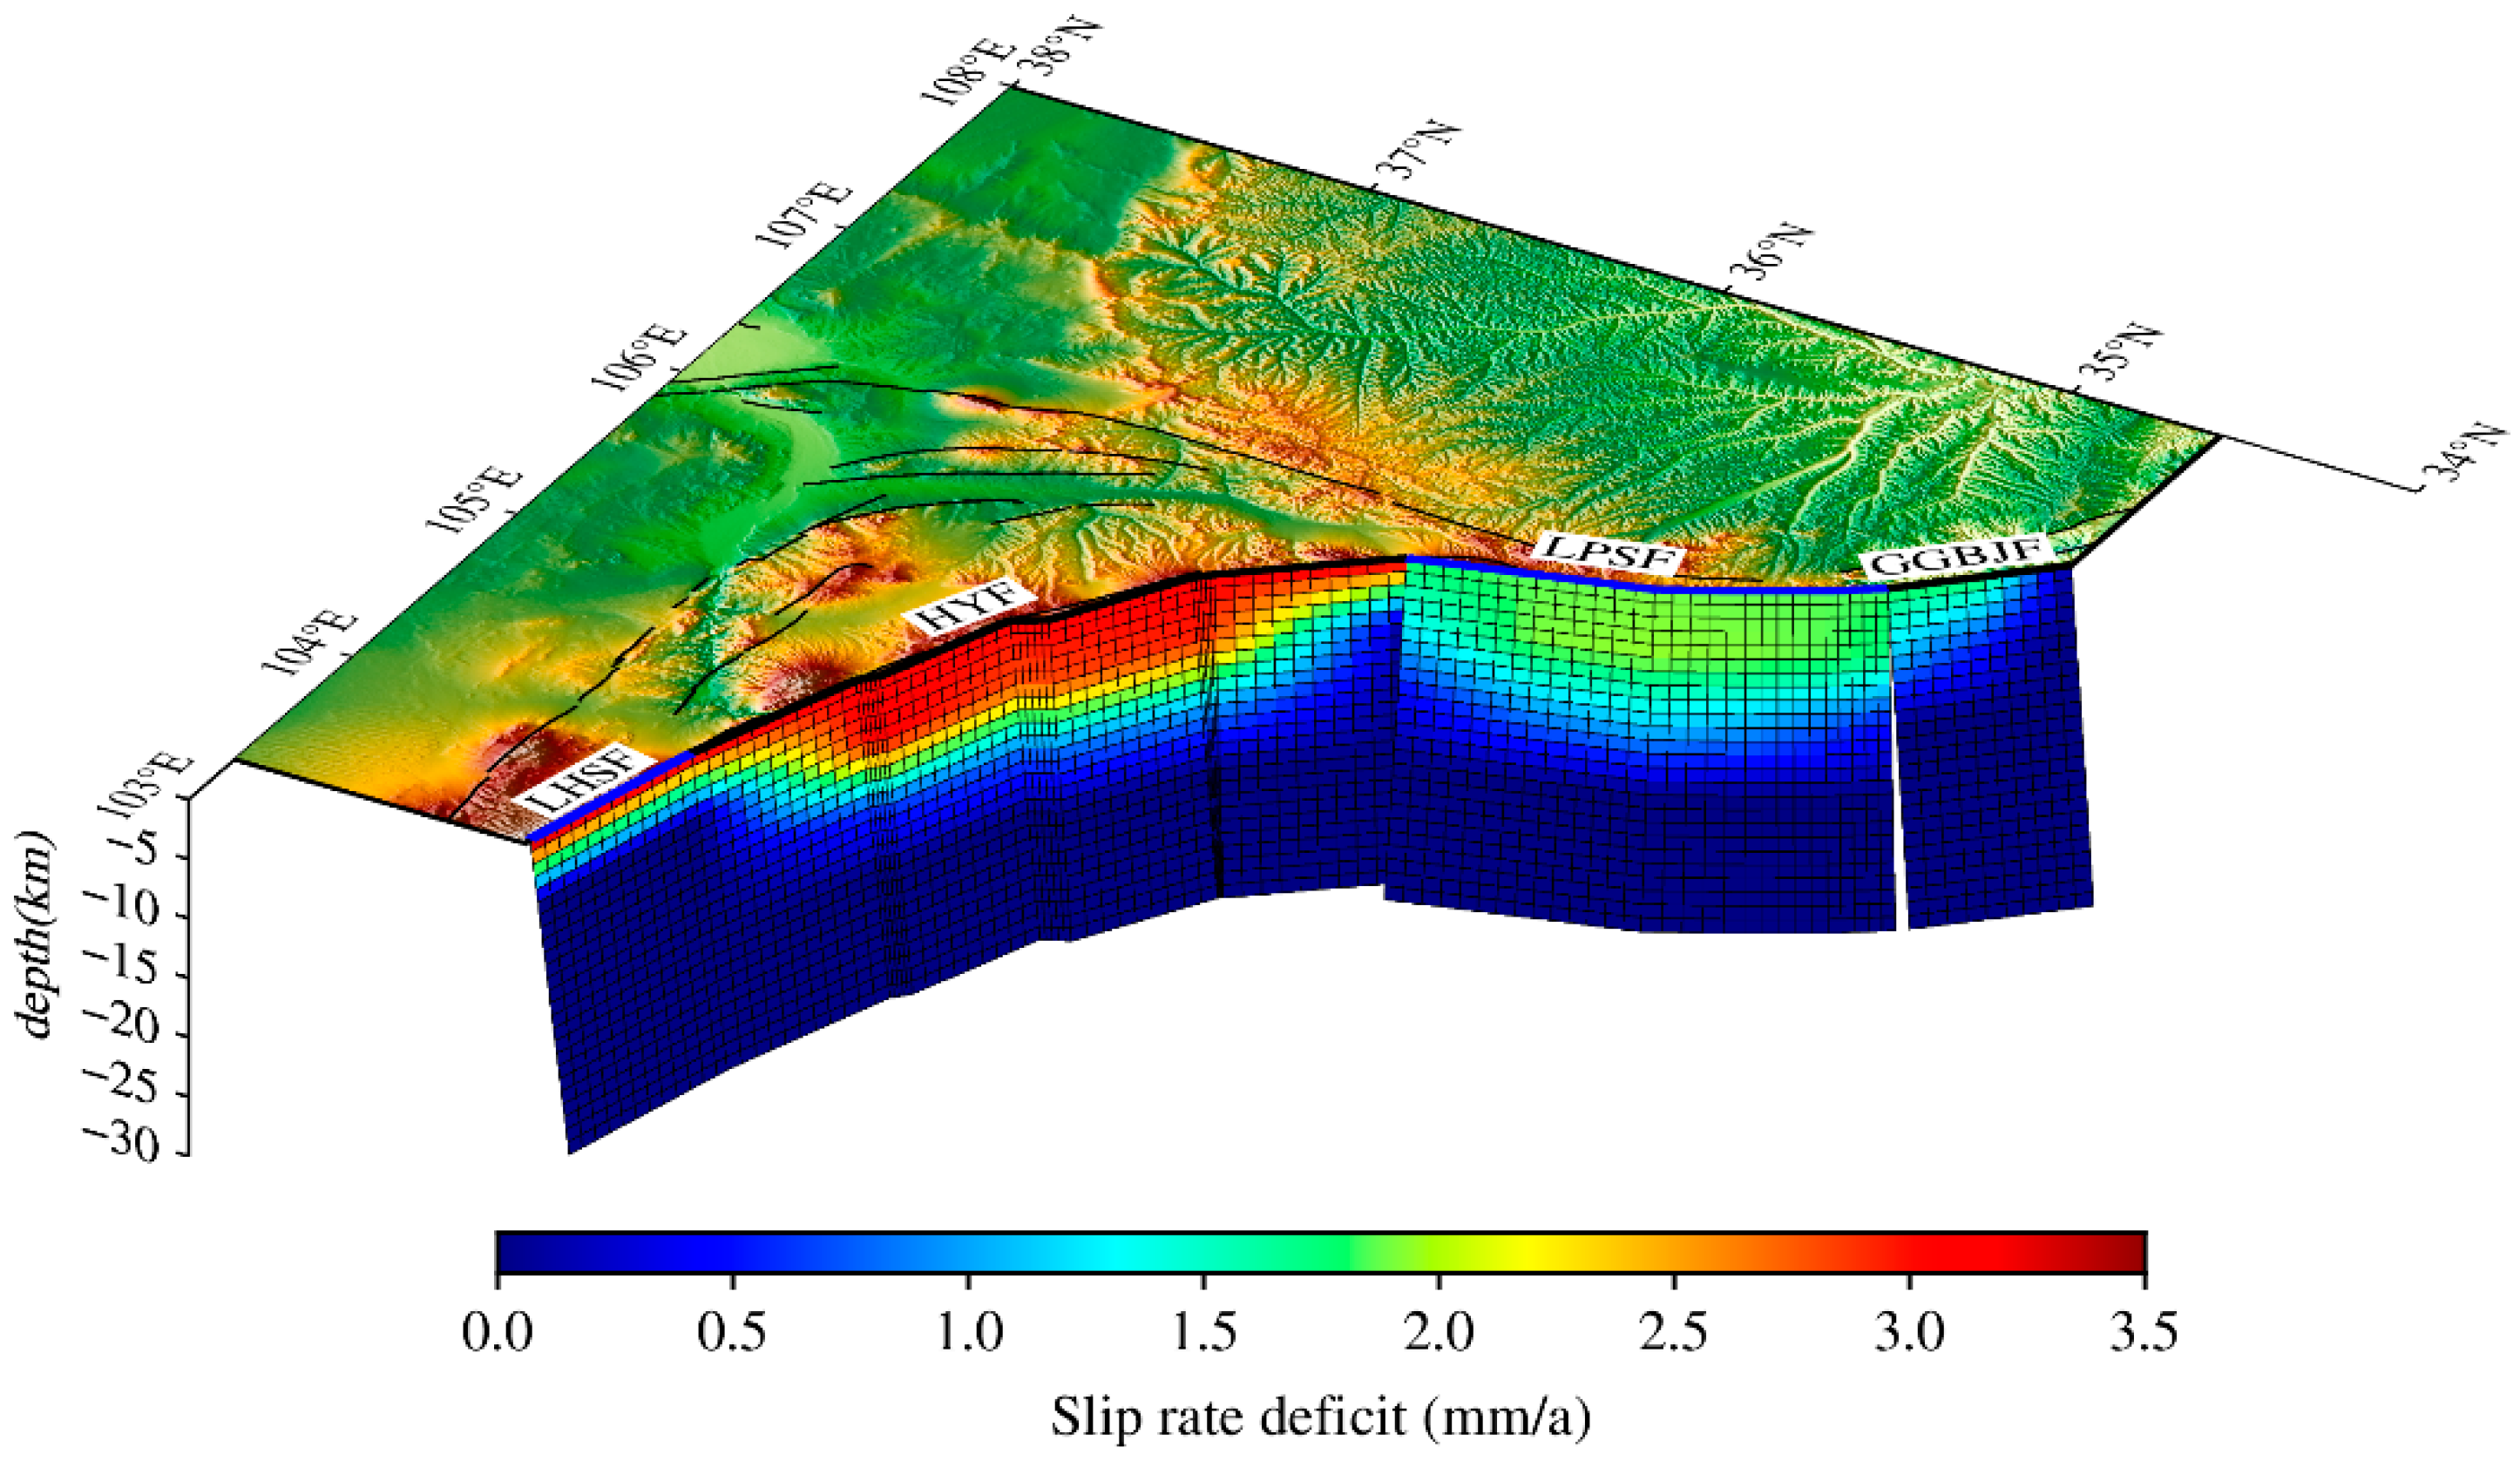
5.2. Fault Locking Slip Distribution

According to fault geometry and optimal model results in Section 3.3, the distribution of interseismic locking degree and slip deficit rate of each fault on the northeastern margin of the Tibetan Plateau were obtained (Figure 6 and Figure 7, Table 3). In Figure 6, the locking degree of each fault is not uniformly distributed in the depth. The locking degree of the LHSF is weak, the distribution is uniform and is strongest within 1 km, and the maximum locking fraction is ~0.9, decreases to 0.302 at a depth of 3–4 km, and completely creeps below 5 km. The HYF is generally in the creeping stage, but the locking degree is stronger than the LHSF. The locking fraction of the west section gradually increases along the depth direction, is strongest at a depth of 0–5 km, gradually decreases below 5 km, and almost completely creeps below 10 km. The east section exhibits the same behavior as the west section. The locking in the middle section is the strongest and is evenly distributed with a depth of 7–8 km, gradually decreases to a depth of 13 km, and completely creeps below 15 km. The HYF had an 8.5 magnitude earthquake in 1920, and the focal depth is generally believed to be 17–20 km [14]. Our results showed that the fault is still relatively weak at present. We considered that the fault is still in the post-earthquake adjustment stage under the influence of the earthquake, and its movement is still dominated by post-earthquake creep. In the LPSF, the overall locking is the highest, with the south section having stronger locking than the north section. The fault is completely locked within a depth of 5 km and is still strongly locked within 10 km. The locking fraction decreases gradually at a depth between 10 km to 15 km and completely creeps below 15 km. Therefore, it is speculated that the fault may have a large strain accumulation. The locking fraction of the GGBJF decreases gradually from the north section to the south section. The locking fraction is stronger when the depth is above 5 km, gradually decreases between 5–10 km, and completely creeps below 10 km. Compared with previous studies, the locking depth of the LPSF and GGBJF obtained in this paper is slightly lower, which may be related to different models and observations, but the overall trend is consistent. The locking characteristics of each section of the fault zone will be discussed in detail in Section 5.3.
A quantitative analysis of the strain accumulation on the fault surface is necessary to understand the seismic activity of the fault, which can be reflected by the locking degree of the fault; the stronger the locking degree, the easier the strain accumulation. The rate of strain accumulation can be quantitatively described by the slip deficit rate. The slip deficit rate could be calculated by the product of the fault long-term slip rate V and the locking fraction ϕ [35]. Figure 7 and Table 3 show the slip deficit rate distribution of the faults.
For the same fault, the area where the slip deficit rate is significantly quick is the strongly locked region of the fault. The rate of slip deficit gradually decreases with depth along the fault surface until it reaches 0 mm/yr. This indicates that the fault surface no longer impedes the relative motion of the two blocks, and the fault is completely creeping. [34] pointed out that the ‘slip deficit rate’ means that the energy not released by the long-term slip rate of the fault through the creep slip is converted into strain energy to accumulate on the fault surface, so we used the slip deficit rate to quantitatively analyze the speed of strain accumulation on the fault surface. Similar to the distribution of the locking, the slip deficit rate of each fault is also unevenly distributed in depth, but the magnitude and trend of the slip deficit rate are similar to the locking distribution. The slip deficit rate decreased from 3.6 mm/yr at the LHSF to 1.8 mm/yr at the GGBJF. Figure 7 shows that the LHSF and HYF are mainly controlled by a left-lateral slip deficit rate, among which the LHSF has the largest slip deficit rate at a rate of 3.6 mm/yr, but its depth is the shallowest, distributed from the surface to 5 km. The strike-slip deficit rate of the HYF is large, with a maximum rate of 3.2 mm/yr, and the depth in the middle section is the deepest, with the west section showing an increasing slip deficit rate with depth, while the east section shows a decreasing slip deficit rate toward the surface, with the distribution in a depth range from the surface to 15 km. The LPSF is mainly controlled by the thrust dip-slip deficit rate, with a maximum rate of 1.9 mm/yr, but its distribution depth of the slip deficit is relatively uniform, ranging from the surface to a depth of 15 km. The GGBJF has both left-lateral strike-slip deficit rate and thrust dip-slip deficit rate components. The rate gradually decreases from the north section to the south section at a maximum rate of 1.8 mm/yr and is distributed within a depth range of 0–10 km.

5.3. Block Motion

The optimal parameter model showed that the present model can better explain the surface GPS observations and obtain the rigid rotation parameters and internal strain parameters of the Alxa blocks and Lanzhou blocks. Figure 8 shows that the GPS velocity residuals of this model are randomly distributed and consistent with a Gaussian distribution. Most of the residuals are within 1 mm and have a random direction. Some individual points have residuals between 2~3 mm, but they are far from the fault zone in this model; this may be due to the existence of active faults with strong activity in the area of larger residuals, such as the West Qinling Fault, which has no significant effect on the actual inversion results of this model. Among 156 residual distributions, 12 residuals exceeded 1 mm, 2 residuals exceeded 2 mm, and 92% of the residuals are within 1 mm. This indicates that the fitting degree between this model and GPS observation data is good, and no obvious signals were missed.
Since the ORDOS block is a rigid block, the model set it as the reference block without calculating its internal strain, so the motion of each block obtained is relative to the motion of the ORDOS block. The obtained rigid rotation parameters and internal strain parameters of each block are shown in Table 4 and Table 5. Relative to the ORDOS block, both the Alxa block and the Lanzhou block make clockwise rotations, and the former has a larger rotation rate than the latter. The Euler pole of the Alxa block is far from the block itself and is located on the northeastern of the ORDOS block; the Euler pole of the Lanzhou block is far from the inner part of the block and is located on the south of the ORDOS block. The motion trend of the block is consistent with the collision of the Indian plate in the N20°E direction [25] with the Eurasian plate, resulting in an eastward extrusion of the northeastern margin of the Tibetan Plateau. However, when the relatively stable ORDOS block is encountered, the movement direction is deflected to the south, showing clockwise movement along the fault zone. Compared with the relatively stable Alxa block, the internal strain rate of the Lanzhou block is larger and dominated by compressive strain and supplemented by tensile strain, which is due to the lateral escape of the crust blocked by the relatively stable Alxa block and the hard ORDOS block [43]; the principal compressive strain rate   ε 1 ˙   = 14.34 nanostrain/yr and the tensile strain rate ε 2 ˙ = 6.05 nanostrain/yr. Compared with the results of previous studies, the magnitude of the kinematic parameters of the blocks differs due to the different block divisions, but the kinematic trend of the block is consistent [41,44,45].

6. Discussion

6.1. Comparison of Modeling Results for Different Fault Participation

In order to verify whether adding the LHSF and GGBJF to the model improved the data fitting degree, four sets of experiments were done for comparison. In the first group, the HYF and LPSF were modeled; in the second group, the LHSF, HYF, and LPSF were modeled; in the third group, the HYF, LPSF, and GGBJF were modeled; and in the fourth group, the LHSF, HYF, LPSF, and GGBJF were modeled and analyzed. When modeling the faults, only the motion of the surrounding circumscribed blocks was considered, and only the data within the corresponding blocks were used while keeping the other model parameters unchanged. The modeling results are shown in Table 6.
The results show that the addition of the LHSF and GGBJF can improve the overall fitting effect of the GPS observations, reducing both the χ n 2 and W r m s of the data within the Alxa and Lanzhou blocks. The effect of adding the GGBJF in the experiment is slightly greater than the LHSF, which may be due to the existence of shallow creeps near the LHSF and the greater activity of the GGBJF, as well as the more abundant near-field observations. When modeling the fault zone, both the LHSF and GGBJF were added in the inversion finally.

6.2. Optimal Model Parameter Settings

Parameter settings in the model mainly include selecting reference blocks, block properties (rigid or elastic), fault parameterization type, the limit of locking depth, constructing faults (node, fault slip type, locking depth, fault dip angle, node index), making pseudo-faults (closure block), etc. The locking depth is the depth at which the fault slips completely freely, and the locking depth was set to 25 km in this model. Previous research showed that the ORDOS block is stable and rigid, so the ORDOS block was set as the reference block in the inversion, and its internal strain was not calculated. The Lanzhou block and Alxa block were set as elastic blocks, and their internal strains were calculated. The geometrical characteristics of the faults had been studied extensively, and some results on the dip angle of the major faults are given in Table 7. The dip angles of the LHSF and HYF are between 41° and 70°, and the optimal dip angle was 60° by a grid search; the dip angle of the LPSF is between 20° and 70°, and the optimal dip angle was 45° by a grid search; and the dip angle of the GGBJF is between 45° and 88°, and the optimal dip angle was 45° by a grid search.
The initial locking depths of the faults can also be calculated by a grid search. For the LHSF and HYF, the initial locking depth is 15 km by searching in the range of 10–20 km; for the LPSF and GGBJF, the initial locking depth is 15 km by searching in the range of 15–25 km. With other parameters unchanged, the model performed inversion at intervals of 5 km at locking depths between 15 km and 40 km. Comparing the χ n 2 of the results, it was concluded that 25 km was the optimal choice for this model. In addition, according to the catalog of earthquakes above M3-magnitude in mainland China and its surrounding areas [50] and the study on the precise location of earthquakes [51], the focal depth of most earthquakes on the northeastern margin of the Tibetan Plateau is less than 25 km. Therefore, the final locking depth was set as 25 km.
The fault node settings were given in Section 3.3. The locking fraction between 0.1 km and 25 km was inverted by the block-fault back-slip dislocation model (0 ≤ ϕ ≤ 1), and the fault locking fraction was set based on [33], who set the node ϕ values as a function of depth, which is expressed as follows.
G = 20.0 G ( 10.0 G 20.0 ) ϕ ( z ) = 1.0 ( z Z 1 ) ϕ ( z ) = exp ( z / G exp ( 1.0 / G ) ) 1.0 exp ( 1.0 / G ) ( Z 1 < z < Z 2 ) Which   z = ( z Z 1 / z Z 2 ) ϕ ( z ) = 1.0 ( z Z 2 )
In Formula (3), G is the shape parameter that constrains the decay of the locking fraction, Z1 is the upper boundary of the transition region, the depth where the fault is completely locked, and Z2 is the lower boundary of the transition region, the depth where the fault slips freely. When z ≤ Z1, the fault is completely locked; when z ≥ Z2, the fault is completely creep-slipped; and in Z1 < z < Z2, the locking fraction of the fault node decays as a function of Formula (3).

6.3. Distribution Characteristics of the Degree of Locking and Slip Deficit Rate in Different Segments of the Fault Zone

The results show that the LHSF and HYF are controlled by a left-lateral strike-slip, the LPSF is controlled by a thrust dip-slip, and the GGBJF has both left-lateral strike-slip and thrust dip-slip components. As shown in Figure 6 and Figure 7, the locking in the LHSF is uniformly distributed, with a strong locking within 1 km, followed by a gradual decrease in the locking fraction to a complete creep slip below 5 km with a slip deficit rate of 3.4 mm/yr, which is consistent with the results of [22,40,42]. The 1920 Haiyuan 8.5 magnitude earthquake in the HYF formed a 200 km long left-lateral strike-slip rupture zone at the surface [1]. The overall HYF is in the creep-slip stage, with an overall locking depth of 15 km, but the locking fraction between the depth of 13 km and 15 km is quite small, so the locking depth is considered to be 13 km. The locking of the western section is weak, with the locking fraction gradually increasing along the strike, and is strong within 5 km, gradually decaying to a depth of 10 km, and the slip deficit rate is 2.8–3.2 mm/yr. The middle section has the strongest locking and relatively uniform distribution with depths reaching 7–8 km, gradually decaying to 13 km and completely creeping below 13 km, and its slip deficit rate is 2.4–2.8 mm/yr; the east section has the same expression as the western, except that its locking fraction gradually decays in the depth along the strike, and the slip deficit rate is ~2.4 mm/yr. In summary, the locking of the HYF is similar to the arc-shaped distribution (Figure 6), with a characteristic of weak locking in the west and east sections and strong locking in the middle section, and the slip deficit rate decreases from 3.2 mm/yr to 2.4 mm/yr from west to east. In general, the strain accumulation capacity of the HYF is relatively low. Combined, the earthquake recurrence interval is 800–1600 years [1], and the focal depth is generally considered to be 17–20 km, so we considered that the HYF is still in the post-earthquake stress adjustment stage, which better explains the absence of earthquakes of a 6.0 magnitude or higher in this fault since 1920. The locking of the LPSF is, overall, the strongest and most evenly distributed, with slightly higher locking in the southern section compared to the northern. The high-value locking fraction areas are distributed almost across the entire fault surface within 10 km (Figure 6), the fault is completely locked within 5 km depth ( ϕ = 1), a strong locking fraction ( ϕ ≥ 0.5) still exists within 5–10 km and gradually decreases between 10 km and 15 km and completely creeps below 15 km, and the overall slip deficit rate is 1.7–1.9 mm/yr, reflecting the characteristic that the south section is higher than the north section. The overall locking of the GGBJF is weak, and the locking fraction gradually decreases along the strike at the depth, with the strongest locking near the south section of the LPSF where the locking degree is strong at 5 km, the locking fraction gradually decreases between 5 km and 10 km in depth and completely creeps below 10 km, and its slip deficit rate decreases from 1.8 mm/yr to 0.2 mm/yr from the north section to the south section. The north–south segmented movement characteristics of the LPSF are clearly evident [52]. The south section of the LPSF refers to the GGBJF in this paper; in this way, our results show that the north–south section of the LPSF has obvious motion characteristics, and the north section is more active than the south section. In terms of the locking degree, the LPSF is easier to strain accumulation, but in terms of the slip deficit rate, it accumulates strain slowly; however, no earthquake with a magnitude of 7.0 or higher had occurred in the LPSF in the past 1400 years [53], so it will still reach high strain accumulation after long-term accumulation, which will lead to a strong earthquake, such as the Wenchuan earthquake.
The results also found that there was a weak right-lateral strike-slip phenomenon with a rate of 0.1–0.2 mm/yr in the top area of the HYF when it was converted from the sinistral strike-slip region at the tail end of the east section to the north section of the LPSF. If we consider the explanation of this phenomenon, we believe that this area is located on the junction transition area of three blocks, while the Alxa block and Lanzhou block are rotating clockwise around the ORDOS block; the Lanzhou block is also slightly rotating clockwise around Alxa block. However, due to the obstruction of the hard ORDOS rigid block to the east, the motion of the block boundary in the transitional area changes, resulting in a right-lateral strike-slip. There is another explanation: the displacement along a strike-slip fault must be absorbed and adjusted at a certain part along the fault, often at both ends of the fault, so that the whole fault can reach a new balance in energy; the contraction area at the end of the HYF is this kind of tectonic deformation [26]. Therefore, we can also assume that the energy accumulated by the left-lateral strike-slip at the end of the HYF may be released by the right-lateral strike-slip at the top of the north section of the LPSF to achieve a relative energy balance. Secondly, the phenomenon of weak left-lateral extension in some sections of the HYF in our results can also be explained by this theory.

7. Conclusions

In this paper, we collected the observations of encrypted GPS stations around the Haiyuan–Liupanshan fault zone, integrated the GPS velocity field of the northeastern margin of the Tibetan Plateau and neighboring areas from 2010 to 2020, and obtained the present-day GPS velocity field of the northeastern margin of the Tibetan Plateau. We divided the region around the fault zone into independent blocks, taking into account the fine fault distribution of the Haiyuan–Liupanshan fault zone to obtain the optimal inversion model. A block-fault back-slip dislocation model was used to invert the slip rate, locking depth, and the slip deficit rate of the fault. Combining the results of historical seismic data, regional geological data, and the motion characteristics of each fault, we discussed and analyzed the locking degree and slip deficit rate distribution characteristics of different sections of the fault zone. The main conclusions are as follows:
(1)
The LHSF is mainly controlled by a left-lateral strike-slip at a rate of ~3.5 mm/yr. The fault is completely locked within a 1 km depth and completely creeps below 5 km, so the locking degree of this fault is low. Combined with the slip deficit rate of 3.2–3.6 mm/yr, we considered that the seismic risk of this fault is low.
(2)
The HYF is mainly controlled by a left-lateral strike-slip at a rate of 3.0–3.2 mm/yr. The western and eastern sections of the fault are weakly locked, with strong locking at a depth of 5 km, and completely creeps at a depth of 10 km or less. The whole fault completely creeps below 13 km, and the overall locking degree showed the distribution characteristics of strong in the middle section and weak in the eastern and western sections. Combined with the slip deficit rate of 2.4–3.2 mm/yr, we believe that there is a certain amount of strain accumulation in the middle section, but combined with the regional geological and historical seismic data, we believe that this fault is still in the post-earthquake stress adjustment stage, the seismic risk is considered low.
(3)
The LPSF is mainly controlled by a thrust dip-slip at a rate of 1.7–1.9 mm/yr. The overall degree of locking in this fault is the strongest and uniformly distributed, it is completely locked at a depth of 5 km, there is still strong locking at a depth of 10 km, and the fault completely creeps at a depth of 15 km or less; the slip deficit rate of this fault is 1.7–1.9 mm/yr. Although its rate of strain accumulation is slow, when combining the analysis of geology, historical seismic data, and the activity characteristics, there is still a risk of a moderate to strong earthquake after a long period of strain accumulation, which should be continuously observed and analyzed.
(4)
The GGBJF has both left-lateral strike-slip and thrust dip-slip components, its strike-slip rate is 1.3–1.4 mm/yr and its dip-slip rate is 1.2–1.3 mm/yr, the locking fraction decreases gradually from north to south, locking is strong in the range of 5 km in depth, it completely creeps below 10 km, and is combined with a slip deficit rate of 1.8 mm/yr and decays to 0.2 mm/yr from west to east. The seismic risk of this fault is considered to be low.

Supplementary Materials

The following supporting information can be downloaded at: https://www.mdpi.com/article/10.3390/rs15112905/s1.

Author Contributions

Conceptualization, S.Y. and X.S.; methodology, S.Y. and X.S.; validation, S.Y. and X.S.; formal analysis, S.Y.; resources, S.Y. and X.S.; data curation, S.Y. and X.S.; writing—original draft preparation, S.Y.; writing—review and editing, X.S.; supervision, X.S.; project administration, X.S.; funding acquisition, X.S. All authors have read and agreed to the published version of the manuscript.

Funding

This research was funded by the National Natural Science Foundation of China (42174003), the Gansu Province Outstanding Youth Foundation (22JR5RA315), the Gansu Province Science and Technology Association, Gansu Province Youth Talent Lifting Project (GXH20210611-06), Lanzhou Jiaotong University, and the Youth Science Foundation Project (2021003).

Data Availability Statement

The data presented in this study are available on request from the corresponding author.

Acknowledgments

The authors would like to thank the editors and anonymous reviewers for their detailed and constructive comments, which helped to significantly improve the manuscript.

Conflicts of Interest

The authors declare no conflict of interest.

References

  1. Zhang, W.Q.; Jiao, D.C.; Zhang, P.Z. Displacement along the Haiyuan fault associated with the great 1920 Haiyuan, China, earthquake. Bull. Seismol. Soc. Am. 1987, 77, 117–131. [Google Scholar]
  2. Savage, J.C. Dislocation model of strain accumulation and release at a subduction zone. J. Geophys. Res. Atmos. 1983, 88, 4984–4996. [Google Scholar] [CrossRef]
  3. McClusky, S.; Balassanian, S.; Barka, A.; Demir, C.; Ergintav, S.; Georgiev, I.; Gurkan, O.; Hamburger, M.; Hurst, K.; Kahle, H.; et al. Global Positioning System constraints on plate kinematics and dynamics in the eastern Mediterranean and Caucasus. J. Geophys. Res. 2000, 105, 5695. [Google Scholar] [CrossRef]
  4. Müller, M.D.; Geiger, A.; Kahle, H.-G.; Veis, G.; Billiris, H.; Paradissis, D.; Felekis, S. Velocity and deformation fields in the North Aegean domain, Greece, and implications for fault kinematics, derived from GPS data 1993–2009. Tectonophysics 2013, 597–598, 34–49. [Google Scholar] [CrossRef]
  5. Lazos, I.; Sboras, S.; Pikridas, C.; Pavlides, S.; Chatzipetros, A. Geodetic analysis of the tectonic crustal deformation pattern in the North Aegean Sea, Greece. Mediterr. Geosci. Rev. 2021, 3, 79–94. [Google Scholar] [CrossRef]
  6. Nyst, M.; Thatcher, W. New constraints on the active tectonic deformation of the Aegean. J. Geophys. Res. Solid Earth 2004, 109, 1–23. [Google Scholar] [CrossRef]
  7. Institute of Geology; China Earthquake Administration; Ningxia Earthquake Administration. Haiyuan Active Fault Zone; Seismological Press: Beijing, China, 1990; (In Chinese).
  8. Zhang, P.Z.; Burchfiel, B.C.; Molnar, P. Amount and style of late Cenozoic deformation in the Liupanshan area, Ningxia autonomous region, China. Tectonics 1991, 10, 1111–1129. [Google Scholar] [CrossRef]
  9. Burchfiel, B.C.; Zhang, P.; Wang, Y.P. Geology of the Haiyuan fault Zone, Ningxia-Hui Autonomous Region, China, and its Relation to the Evolution of the Northeastern Margin of the Tibetan Plateau. Tectonics 1991, 10, 1091–1110. [Google Scholar] [CrossRef]
  10. Tian, Q.J.; Ding, G.Y.; Shen, X.H. Pull-apart Basins and the Totel Lateral Displacement along the Haiyuan Fault Zone in Cenozoic. Earthq. Res. China 2001, 17, 67–75. [Google Scholar] [CrossRef]
  11. Li, C.Y.; Zhang, P.Z.; Yin, J.H. Late Quaternary left-lateral slip rate of the Haiyuan Fault, northeastern margin of the Tibetan plateau. Tectonics 2009, 28, TC5010. [Google Scholar] [CrossRef]
  12. Wang, W.; Yang, S.; Wang, Q. Crustal block rotations in Chinese mainland revealed by GPS measurements. Earthq. Sci. 2009, 22, 639–649. [Google Scholar] [CrossRef] [Green Version]
  13. Hu, Y.X.; Cui, D.X.; Zhang, X.; Wang, X. Inversion and Analysis on the Active Characteristics of Subsections of Haiyuan Fault Belt Using GPS Data. Northwestern Seismol. J. 2009, 31, 227–230, 253. Available online: https://kns.cnki.net/kcms/detail/detail.aspx?FileName=ZBDZ200903004&DbName=CJFQ2009 (accessed on 16 October 2021).
  14. Cui, D.X.; Hu, Y.X.; Wang, W.P.; Zhu, G.Z. Coulomb Stress Accumulation along Haiyuan Fault Zone. Earth Sci. J. China Univ. Geosci. 2009, 34, 641–650. Available online: https://kns.cnki.net/kcms/detail/detail.aspx?FileName=DQKX200904011&DbName=CJFQ2009 (accessed on 16 October 2021).
  15. Duvall, A.R.; Clark, M.K. Dissipation of fast strike-slip faulting within and beyond northeastern Tibet. Geology 2010, 38, 223–226. [Google Scholar] [CrossRef]
  16. Loveless, J.P.; Meade, B.J. Partitioning of localized and diffuse deformation in the Tibetan Plateau from joint inversions of geologic and geodetic observations. Earth Planet. Sci. Lett. 2011, 303, 11–24. [Google Scholar] [CrossRef] [Green Version]
  17. Zhang, X.L.; Shi, Z.M.; Jiang, F.Y.; Zhu, L.Y.; Wang, X. Research on late tectonic deformation evolvement of Huayuan-Liupanshan Arc Fault and Iits surrounding area. J. Geod. Geodyn. 2011, 31, 20–24. [Google Scholar] [CrossRef]
  18. Ge, W.P.; Wang, M.; Shen, Z.K.; Yuan, D.Y.; Zheng, W.J. Intersiesmic kinematics and deformation patterns on the upper crust of Qaidam-Qilianshan block. Chin. J. Geophys. 2013, 56, 2994–3010. (In Chinese) [Google Scholar] [CrossRef]
  19. Li, Q.; Jiang, Z.S.; Wu, Y.Q.; Zhao, J.; Wei, W.X.; Liu, X.X. Present-day tectonic deformation characteristics of Haiyuan-Liupanshan fault zone. J. Geod. Geodyn. 2013, 33, 18–22. [Google Scholar] [CrossRef]
  20. Li, Y.H.; Cui, D.X.; Hao, M. GPS-Constrained Inversion of Slip Rate on Major Active Faults in the Northeastern Margin of Tibet Plateau. Earth Sci. J. China Univ. Geosci. 2015, 40, 1767–1780. [Google Scholar] [CrossRef]
  21. Li, Y.C.; Shan, X.J.; Qu, C.Y. Fault locking and slip rate deficit of the Haiyuan-Liupanshan fault zone in the northeastern margin of the Tibetan Plateau. J. Geodyn. 2016, 102, 47–57. [Google Scholar] [CrossRef]
  22. Ye, M.S.; Meng, G.J.; Su, X.N. Locking Characteristics and Slip Deficits of the Main Faults in the Northeast Margin of Tibetan Plateau. Earthquake 2018, 38, 1–12. Available online: https://kns.cnki.net/kcms/detail/detail.aspx?FileName=DIZN201803001&DbName=CJFQ2018 (accessed on 24 October 2021).
  23. Qiao, X.; Qu, C.Y.; Shan, X.J.; Li, Y.C.; Zhu, C.H. Deformation Characteristics and kinematic Parameters Inversion of Haiyuan Fault Zone Based on Time Series InSAR. Seismol. Mology Geol. 2019, 41, 1481–1496. [Google Scholar] [CrossRef]
  24. Xu, H.C.; Wang, H.; Cao, J.L. Slip Rates of the Major faults in the Northeastern Tibetan Plateau and Their Geodynamic Implications. Earthquake 2018, 38, 13–23. Available online: https://kns.cnki.net/kcms/detail/detail.aspx?FileName=DIZN201803002&DbName=CJFQ2018 (accessed on 18 November 2021).
  25. Sella, G.F.; Dixon, T.H.; Mao, A. A model for recent plate velocities from space geodesy. J. Geophys. Res. Solid Earth 2002, 107, 2081–2091. [Google Scholar] [CrossRef]
  26. Deng, Q.D.; Zhang, W.Q.; Zhang, P.Z. Haiyuan strike-slip fault zone and its compressional structures of the end. Seismol. Geol. 1989, 11, 1–14. (In Chinese) [Google Scholar] [CrossRef]
  27. Wang, W.T.; Zhang, P.Z.; Zheng, D.W.; Pang, J.Z. Late Cenozoic tectonic deformation of the Haiyuan fault zone in the northeastern margin of the Tibetan Plateau. Earth Sci. Front. 2014, 21, 266–274. [Google Scholar] [CrossRef]
  28. Yuan, D.Y.; Lei, Z.S.; Zhang, J.L.; Liu, B.C.; Liang, M.J. Textural research of 1219 A.D. Guyuan earthquake in Ningxia HuiAutonomous Region, China, and discussion on its causative structure. Acta Seismol. Sin. 2008, 30, 648–657. Available online: https://kns.cnki.net/kcms/detail/detail.aspx?FileName=DZXB200806012&DbName=CJFQ2008 (accessed on 18 November 2021).
  29. Herring, T.A.; King, R.W.; Floyd, M.A.; McClusky, S.C. GAMIT Reference Manual (Version 10.6); Massachusetts Institute of Technology: Cambridge, MA, USA, 2015; Available online: http://geoweb.mit.edu/gg/GAMIT_Ref.pdf (accessed on 16 June 2020).
  30. Herring, T.A.; King, R.W.; Floyd, M.A.; McClusky, S.C. GLOBK Reference Manual (Version 10.6); Massachusetts Institute of Technology: Cambridge, MA, USA, 2015; Available online: http://geoweb.mit.edu/gg/GLOBK_Ref.pdf (accessed on 16 June 2020).
  31. Su, X.N.; Yao, L.B.; Wu, W.W.; Meng, G.J.; Su, L.N.; Xiong, R.W.; Hong, S.Y. Crustal Deformation on the Northeastern Margin of the Tibetan Plateau from Continuous GPS Observations. Remote Sens. 2019, 11, 34. [Google Scholar] [CrossRef] [Green Version]
  32. Zhang, P.Z.; Deng, Q.D.; Zhang, G.M. Strong Earthquake Activity and Active blocks in Chinese Mainland. Sci. Sin. 2003, 33, 12–20. (In Chinese). Available online: https://kns.cnki.net/kcms/detail/detail.aspx?FileName=JDXK2003S1001&DbName=CJFQ2003 (accessed on 18 November 2021).
  33. Wang, K.; Wells, R.; Mazzotti, S. A revised dislocation model of interseismic deformation of the Cascadia subduction zone. J. Geophys. Res. Atmos. 2003, 108, 327. [Google Scholar] [CrossRef] [Green Version]
  34. McCaffrey, R.; Qamar, A.I.; King, R.W. Fault locking, block rotation and crustal deformation in the Pacific Northwest. Geophys. J. Int. 2007, 169, 1315–1340. [Google Scholar] [CrossRef] [Green Version]
  35. McCaffrey, R. Crustal block rotations and plate coupling. In Plate Boundary Zones; Stein, S.C., Freymueller, J.T., Eds.; AGU: Washington, DC, USA, 2002; pp. 101–122. [Google Scholar] [CrossRef]
  36. McCaffrey, R. Block kinematics of the pacific–north America plate boundary in the southwestern United States from inversion of GPS, seismological, and geologic data. J. Geophys. Res. 2005, 110, 1–25. [Google Scholar] [CrossRef] [Green Version]
  37. Savage, J.C.; Gan, W.; Svarc, J.L. Strain accumulation and rotation in the Eastern California Shear Zone. J. Geophys. Res. Solid Earth 2001, 106, 21995–22007. [Google Scholar] [CrossRef]
  38. Okada, Y. Surface deformation due to shear and tensile faults in a half-space. Bull. Seismol. Soc. Am. 1985, 75, 1135–1154. [Google Scholar] [CrossRef]
  39. McCaffrey, R.; Wallace, L.M. A Comparison of Geodetic and Paleomagnetic Estimates of Block Rotation Rates in Deforming Zones. In AGU Fall Meeting Abstracts; AGU: Washington, DC, USA, 2004. [Google Scholar]
  40. Yuan, D.Y.; Liu, B.C.; Lv, T.Y.; He, W.G.; Liu, X.F.; Gan, W.J. The Study on Seismic SpatialCharacters by using the Self-Organized Critical phenomenom. Northeast. Seismol. J. 1998, 20, 27–34. Available online: https://kns.cnki.net/kcms2/article/abstract?v=2OF-LjPvQ9c0PiCsnwFA4jYVnFp1eiSIzRvhRnUS5yn7umIf8mPXJfcb-d37k2YKnWjzZglLBbBPTGwsYiPwC6otnihN5J-LAIBxqJC9naVDJRJV3JieCw==&uniplatform=NZKPT&language=CHS (accessed on 18 November 2021).
  41. Li, Q.; Jiang, Z.S.; Wu, Y.Q.; Zhao, J. Inversion of Locking and Distribution of Slip Deficit inHaiyuan-Liupanshan Fault Zone Using GPS Data. Geomat. Inf. Sci. Wuhan Univ. 2014, 39, 575–580. [Google Scholar] [CrossRef]
  42. Li, Y.C.; Qu, C.Y.; Shan, X.J. Deformation of the Haiyuan-Liupanshan fault zone inferred from the denser GPS observations. Earthq. Sci. 2015, 28, 319–331. [Google Scholar] [CrossRef] [Green Version]
  43. Meyer, B.; Tapponnier, P.; Bourjot, L. Crustal thickening in Gansu-Qinghai, lithospheric mantle subduction, and oblique, strike-slip controlled growth of the Tibet Plateau. Geophys. J. Int. 1998, 135, 1–47. [Google Scholar] [CrossRef] [Green Version]
  44. Wang, Y.P.; Shen, J.; Wang, Q. On the lateral contraction of Sichuan-Yunnan block (Chuandian block). Earth Sci. Front. 2003, 10, 188–192. (In Chinese) [Google Scholar]
  45. Hao, M.; Li, Y.H.; Qin, S.L. Spatial and Temporal Distribution of Slip Rate Deficit Across Haiyuan-Liupannshan Fault Zone Constrained by GPS Data. Seismol. Geol. 2017, 39, 471–484. [Google Scholar] [CrossRef]
  46. Zhao, J.; Niu, A.F.; Li, Q.; Yuan, Z.Y. Study on Dynamic Characteristics of Fault Locking and Fault Slip Deficit in the Faults around the Longxi Block. J. Seismol. Res. 2016, 31, 20–24. [Google Scholar]
  47. Zhang, X.; Jiang, Z.S.; Wang, Q.; Wang, X.X.; Cui, D.X.; Zhang, X.L. Invesion for negative dislocation on elastic block boundaries along the northeast margin of Qinghai-Xizang block and prediction for strong earthquake location. Acta Seismol. Sin. 2005, 27, 620–629. [Google Scholar] [CrossRef]
  48. Wan, Y.G.; Shen, Z.K.; Sheng, S.Z.; Xu, X.F. The influence of 2008 Wenchuan earthquake on surrounding faults. Acta Seismol. Sin. 2009, 31, 128–139. Available online: https://kns.cnki.net/kcms2/article/abstract?v=2OF-LjPvQ9eKuVkTgByJqbqBWmlnkjxJJDGs7mn47PGNiT_Iw8jEwCkr1Y25xQ_3cwmFszdefsuL_VtMZr5AnIIPbtC064G1KUzuPUjNPqxM9EOcj0rAqA==&uniplatform=NZKPT&language=CHS (accessed on 28 January 2022).
  49. Shi, W. The Analysis of the Developmental Characteristics and Activity about Fault Zone of Longxian-Baoji. Ph.D. Thesis, Chang’an University, Xi’an, China, 2011. Available online: https://kns.cnki.net/kcms2/article/abstract?v=2OF-LjPvQ9cFh1umQjfhDTBaw1FnlZyyQSXGbPPGumAtXPtDIGPvggWEGTC5THc7Y-WbtRDiqQDYk1vBcmm3lj39hg_t9QrTMsXd_vJs0ebFMNHYbZ8RTg==&uniplatform=NZKPT&language=CHS (accessed on 28 January 2022).
  50. Xu, W.J.; Gao, M.T. Statistical analysis of the completeness of earthquake catalogs in China mainland. Chin. J. Geophys. 2014, 57, 2802–2812. [Google Scholar] [CrossRef]
  51. Yang, Z.X.; Waldhuser, F.; Chen, Y.T.; Richards, P.G. Double-difference relocation of earthquakes in central-western China. J. Seismol. 2005, 9, 241–264. [Google Scholar] [CrossRef] [Green Version]
  52. Hao, M.; Wang, Q.L.; Shen, Z.K. Present-day crustal vertical movement inferred from precise leveling data in eastern margin of Tibetan plateau. Tectonophysics 2014, 632, 281–292. [Google Scholar] [CrossRef]
  53. Working Group of M7. Study on the Mid-to Long-Term Potential of Large Earthquakes on the Chinese Continent; Seismological Press: Beijing, China, 2012. [Google Scholar]
Figure 1. Tectonic background and distribution of faults and earthquakes on the northeastern margin of Tibetan Plateau. The red lines represent the Laohushan Fault (LHSF), Haiyuan Fault (HYF), Liupanshan Fault (LPSF), and Guguan–Baoji Fault (GGBJF). The black lines indicate other active faults in the region and mark the Xiangshan–Tianjingshan Fault and the Yellow River Fault. The red five-pointed stars indicate the epicenter positions of the Gulang M8.0 earthquake on 22 May 1927 and the Haiyuan M8.5 earthquake on 16 December 1920. The seismic data in the study area are from earthquakes with a magnitude of 4.5 or above in the center of China’s seismic network from January 1976 to January 2022.
Remotesensing 15 02905 g001
Figure 2. GPS velocity field of regional horizontal motion with respect to the ORDOS block. The arrows represent the magnitude and direction of GPS velocity.
Remotesensing 15 02905 g002
Figure 3. Block division scheme on the northeastern margin of the Tibetan Plateau. The red line indicates the faults studied in this paper.
Remotesensing 15 02905 g003
Figure 4. A simplified map and boundary conditions of the faults model. The dip angle of the LHSF and HYF was 60°, and the dip angle of the LPSF and GGBJF was 45°. The fault was completely locked ( ϕ = 1) at 0.1 km and free-slipped ( ϕ = 0) below 25 km. The LHSF had two surface nodes and six depth nodes, the HYF had eight surface nodes and six depth nodes, the LPSF had six surface nodes and six depth nodes, and the GGBJF had three surface nodes and six depth nodes.
Remotesensing 15 02905 g004
Figure 5. Fault slip rates. (a) is the strike-slip component; the positive value represents the right-lateral strike-slip and the negative value represents the left-lateral strike-slip; (b) is the dip-slip component; the positive value represents extension and the negative value represents contraction.
Remotesensing 15 02905 g005
Figure 6. Locking degree of the Haiyuan–Liupanshan fault zone.
Remotesensing 15 02905 g006
Figure 7. Slip deficit rate of the Haiyuan–Liupanshan fault zone.
Remotesensing 15 02905 g007
Figure 8. Residual distribution of GPS velocity. The arrows represent the magnitude and direction of GPS velocity residuals. The black lines represent the block boundary. The red line represents the fault involved in our study.
Remotesensing 15 02905 g008
Table 1. A comparison of the slip rate of four faults in different papers. The slip rate unit is mm/yr. Blank parts indicate no research results. The Haiyuan Fault is divided into western, middle, and eastern sections. The Liupanshan Fault is divided into southern and northern sections.
Literature SourcesLHSFHYFLPSFGGBJF
WesternMiddleEasternNorthernSouthern
[7] 3.3–9.2
Geological
results
[8]Zhongwei section: 8–10,
reduced eastward to 4–6
[9]
[10]5.8
[11]4.5 ± 1.1
[12]3.4 ± 0.2
[13]8.255.495.97
[14]6.54.55.65.5
[15]2–4.5
[16]4.6–4.7
[17]2–5.51.0
Terrestrial[18]2.9–5.9
measurement[19]5.4 ± 0.15.0 ± 0.15.0 ± 0.21.3 ± 0.11.7 ± 0.1
results[20]7.8–8.43.23.9
[21]4.1 ± 0.43.9 ± 0.43.7 ± 0.43.6 ± 0.43.2 ± 0.33.1 ± 0.3
[22] 6.46.15.91.41.21.2
[23]4.5–7.63.2–5.4
[24]3.4 ± 0.23.2 ± 0.23.0 ± 0.2
This article3.53.23.03.11.91.81.3
Table 2. Slip rate of each segment of the fault zone.
FaultSegmentDip-Slip Rate (mm/yr)Dip-Slip Rate (mm/yr)
LHSF 3.50.0
HYFWest3.20.5
Middle3.00.8
East3.20.4
LPSFNorth0.31.9
South0.61.8
GGBJF 1.31.3
Table 3. Slip rate, locking depth, and slip deficit rate of each segment of the fault zone.
FaultSlip Rate (mm/yr)Locking Depth (km)Slip Deficit Rate (mm/yr)
LHSF3.553.2–3.6
West section of HYF3.2102.8–3.2
Middle section of HYF3.0132.4–2.8
East section of HYF3.210~2.4
North section of LPSF0.3151.7–1.8
South section of LPSF0.6151.8–1.9
GGBJF1.310~1.8
Table 4. Euler parameters and the internal strain rate of each block relative to the ORDOS block. The angular velocity of the rigid body rotation is positive with a counterclockwise rotation.
Block NameEulerian VectorInternal Strain Rate (Nanostrain/yr)
Λ ( ° ) ϕ ( ° ) Ω ( ° / M a ) ε 1 ˙ ε 2 ˙ A ( ° )
Alxa Block110.465839.0087−0.4106−5.104.4628.18
Lanzhou block110.363632.0201−0.3731−14.346.0550.04
Table 5. Internal uniform strain tensor of each block.
Block NameInternal Strain Rate (Nanostrain/yr)
ε x x ε y y ε x y
Alxa Block2.33−2.96−3.98
Lanzhou block−5.93−2.36−10.04
Table 6. A comparison of the modeling results of different faults.
NumberFaultsDataBlocks χ n 2 W r m s of the Alxa Block W r m s of the
Lanzhou Block
1HYF, LPSF526 stationsORDOS, Alxa, Lanzhou1.6330.6290.892
2LHSF, HYF, LPSF538 stationsORDOS, Alxa, Lanzhou1.5990.5890.872
3HYF, LPSF, GGBJF542 stationsORDOS, Alxa, Lanzhou1.5910.6520.845
4LHSF, HYF, LPSF, GGBJF554 stationsORDOS, Alxa, Lanzhou1.5340.6130.784
Table 7. Fault dip angles of the Haiyuan–Liupanshan fault zone.
FaultFault Dip Angle
LHSF65° [21]; 60° [22]; 70° [45]
HYF75° [41]; 50° [46]; 40~60° [47]; 65° [21]; 60° [22]; 70° [45]
LPSF45° [21,22,41,45]; 20~70° [47]; 35~55° [45]
GGBJF45° [48]; 55~88° [49]
Disclaimer/Publisher’s Note: The statements, opinions and data contained in all publications are solely those of the individual author(s) and contributor(s) and not of MDPI and/or the editor(s). MDPI and/or the editor(s) disclaim responsibility for any injury to people or property resulting from any ideas, methods, instructions or products referred to in the content.

