Communication

Spatiotemporal Distribution of Afterslip following the 2014 Yutian Mw 6.9 Earthquake Using COSMO-SkyMed and Sentinel-1 InSAR Data

School of Geosciences and Info-Physics, Central South University, Changsha 410083, China
*
Author to whom correspondence should be addressed.
Remote Sens. 2023, 15(9), 2258; https://doi.org/10.3390/rs15092258
Submission received: 5 March 2023 / Revised: 11 April 2023 / Accepted: 19 April 2023 / Published: 25 April 2023
(This article belongs to the Special Issue Monitoring Subtle Ground Deformation of Geohazards from Space)

Abstract

:
Spatiotemporal distribution of early afterslip is essential for seismic hazard evaluation and determination of fault friction properties. In this study, we used early post-seismic COSMO-SkyMed (19 February 2014–08 April 2014) and long-term Sentinel-1 (16 October 2014–17 June 2020) observations from multiple platforms over different periods to create a rate decay model driven by post-seismic afterslip. The combined observations provide full coverage of the post-seismic deformation following the 2014 Yutian Mw 6.9 earthquake that occurred at the southwestern end of the Altyn Tagh Fault. The observation and modeling results showed that post-seismic deformation was characterized by left-lateral strike-slip movement with minor normal slip, which was consistent with that of co-seismic rupture. The maximum early afterslip (7–55 days) was as large as approximately 0.09 m with a depth of 7 km in the west of co-seismic rupture, and the maximum long-term afterslip was about 0.24 m. The simulated post-seismic deformation caused by poroelastic rebound and viscoelastic relaxation suggests that the afterslip mechanism controls the post-seismic deformation. The coupling pattern of the aftershock and afterslip indicates that the aftershock was mainly caused by the afterslip. The post-seismic spatiotemporal features of the 2014 Yutian earthquake have significant implications for analyzing seismic hazards at the southwestern end of the Altyn Tagh Fault.

1. Introduction

The continuous collision between the Indian and Eurasian plates formed a series of large strike-slip faults and secondary blocks within the Tibetan Plateau [1,2,3]. The southwest end of the Altyn Tagh Fault is a junction point for several secondary blocks, including the Bayan Har, West Kunlun, and Tarim blocks [4,5]. This tectonically active area is characterized by significant EW strike-slip movement. The spatial distribution of the faults in this region is complex. The faults are as follows, from north to south, the Kegang thrust fault, North Xor Kol fault that connects to the Kangxiwa fault in the west, Ashikule-Xor Kol fault passing through the center of the Xor Kol basin, and South Xor Kol fault on the southern boundary of the basin [6,7]. From 2008 to 2020, four moderate-to-strong earthquakes occurred within 100 km of the southwestern segment of the Altyn Tagh fault [8,9], including events of Mw 7.2 in 2008 [10,11,12], Mw 6.2 in 2012, Mw 6.9 in 2014, and Mw 6.3 in 2020 (Figure 1) [13,14,15]. Among them, the Mw 6.9 Yutian earthquake on February 12 2014 was the only strike-slip earthquake. Therefore, the 2014 Yutian earthquake provides an important opportunity to study the characteristics of crustal deformation and tectonic activity on the northern Tibetan Plateau.
The mainshock of the 2014 Yutian earthquake ruptured on the Ashikule and South Xor Kol faults, which presents a left-slip motion. Several studies have been conducted on co-seismic deformation fields and slip distributions based on geodetic and seismic data. The field survey and high-resolution satellite and UAV images identified rupture traces distributed along two NEE-trending faults (namely, the Ashikule-Xor Kol and South Xor Kol faults). In addition, a series of dextral ruptures between the two faults formed a conjugate rupture zone [6,16]. The main rupture zone presents tensile shear characteristics that represent sinistral strike-slip with a minor normal slip. The maximum horizontal and vertical displacements are approximately 1 m and 0.75 m, respectively. Based on the inversion of the teleseismic waveform, Zhang et al. [17] determined that a seismogenic fault dips to the northwest and extends along the southwest, with a maximum slip of approximately 1.8 m located at a depth of 20 km. Zhang and Ge [18] used inverse projection of multi-array teleseismic P-wave to obtain the co-seismic rupture model. They found that the earthquake primarily ruptured on the South Xor Kol Fault and then extended to both sides. Liang et al. [19] estimated that the maximum slip was approximately 2.75 m at 16.6 km depth using the Global Navigation Satellite System (GNSS) data. Li et al. [20] first obtained co-seismic surface deformation from Tandem-X and SPOT 6/7, and the inversion results showed that the co-seismic slip was mainly distributed in the shallow part of the fault (0–10 km). The maximum slip was approximately 2.5 m, located at a depth of 6 km. Although the co-seismic rupture of the 2014 Yutian earthquake has been fully investigated, there have been limited studies on the mechanism of early post-seismic deformation in Yutian in 2014 and the spatiotemporal evolution process of regional seismic activity, owing to the observation gap of Synthetic Aperture Radar (SAR) satellites and the vacancy of GNSS data. To the best of our knowledge, only Li et al. [20] and Luo et al. [21] obtained the deformation eight months after the earthquake (after October 2014) using Sentinel-1 data, which only recorded a small amount of afterslip on the southwest side of the mainshock. Its slip was above 4 km in the shallow layer, with a maximum slip of approximately 0.15 m.
The spatiotemporal patterns of post-seismic deformation reflect the different rock mechanical properties of the faults. Post-seismic deformation following large earthquakes can generally be explained by afterslip, viscoelastic relaxation, and poroelastic rebound [22,23,24]. The post-seismic afterslip deformation was mainly concentrated near the surface rupture and exhibited a logarithmic process in the temporal domain. Poroelastic rebound is the short-term near-field deformation of a surface driven by co-seismic stress. Viscoelastic relaxation is generally a long-term deformation response in the far-field. Given that different post-seismic mechanisms exhibit unique surface deformation patterns, geodetic data can be used for mechanism identification and research.
In this study, the X-band COSMO-Skymed (CSK) ascending track data were used to obtain early post-seismic deformation from 7 to 55 days after the mainshock. Post-seismic time-series deformation fields of the ascending and descending tracks were obtained from Sentinel-1 data using the LiCSBAS method. A post-seismic deformation rate decay model was used to combine the datasets from the two observation periods to construct a complete post-seismic deformation. In addition, we modeled the post-seismic deformation fields caused by poroelastic rebound and viscoelastic relaxation to probe the predominant deformation mechanism. Finally, we inverted the distribution of afterslip to evaluate the contribution and implication of the 2014 Yutian earthquake on regional crustal deformation and tectonic activity.
Figure 1. Tectonic setting of the 2014 Yutian earthquake. (a) The red focal mechanism solutions and red circles represent the historical earthquake focal mechanism solutions and epicenter locations (USGS) for Mw > 6, respectively. (b) Red beach balls represent the four earthquakes in Yutian from USGS, while the blue and pink ones indicate the 2014 Yutian earthquake from GCMT and China Earthquake Networks Center (CENC), respectively. Purple dots represent the aftershocks of the 2014 event from the CENC earthquake catalog (as of 1 September 2020). Blue dots indicate the relocated aftershocks (as of 24 February 2014) [25]. Blue and yellow boxes indicate the data coverage areas of Sentinel-1 and COSMO-Skymed data. Black and red solid lines indicate the active faults and co-seismic rupture traces, respectively. Blue arrows indicate current crustal deformation rate fields based on GNSS observations [26]. NXKF: North Xor Kol fault, ASKF: Ashikule fault, SXKF: South Xor Kol fault.
Remotesensing 15 02258 g001

2. Data and Methods

2.1. InSAR Data Processing

In this study, synthetic aperture radar data from the COSMO-Skymed and Sentinel-1 A/B satellites were used to obtain the early and time-series post-seismic deformation maps, respectively (Table 1). SAR data were processed using the GAMMA software. For two ascending COSMO-Skymed data, a multilook ratio of 5:4 was used in range and azimuth directions to improve the signal to noise ratio (SNR). The 1-arc Shuttle Radar Topography Mission (SRTM) digital elevation model was used to simulate and remove the topographic-related phases [27]. We filtered the interferogram using an adaptive filter, and unwrapped the phase using the minimum cost flow (MCF) method [28]. Finally, we fit a linear ramp to decrease the residual orbital error for the early post-seismic deformation fields.
We used both ascending and descending Sentinel-1 data (71 images of ascending track AT165 and 77 images of descending track DT158) to obtain a time series of post-seismic deformation from 8 months to 6.2 years (16 October 2014–17 June 2020) after the earthquake. To reduce the influence of topography and snow coverage and maintain a high coherence, we used a combination of long- and short-term baseline configurations, with the spatial baseline limited to 100 m. The atmospheric phase delay was estimated and corrected using the common scene stacking (CSS) method [29,30]. This method estimates the atmospheric-phase common scene by stacking multiple interferograms containing the same acquisition, under the assumption that the deformation is linear or quasi-linear over a time period. The open-source InSAR time-series processing analysis program, LiCSBAS, was then used for low-coherence masking and closed-loop detection to remove poor-quality interferograms [31,32]. Finally, the residual phase and noise in the timeseries deformation field were further reduced by spatiotemporal filtering, and the accumulated deformation was decomposed in the east–west and vertical directions.

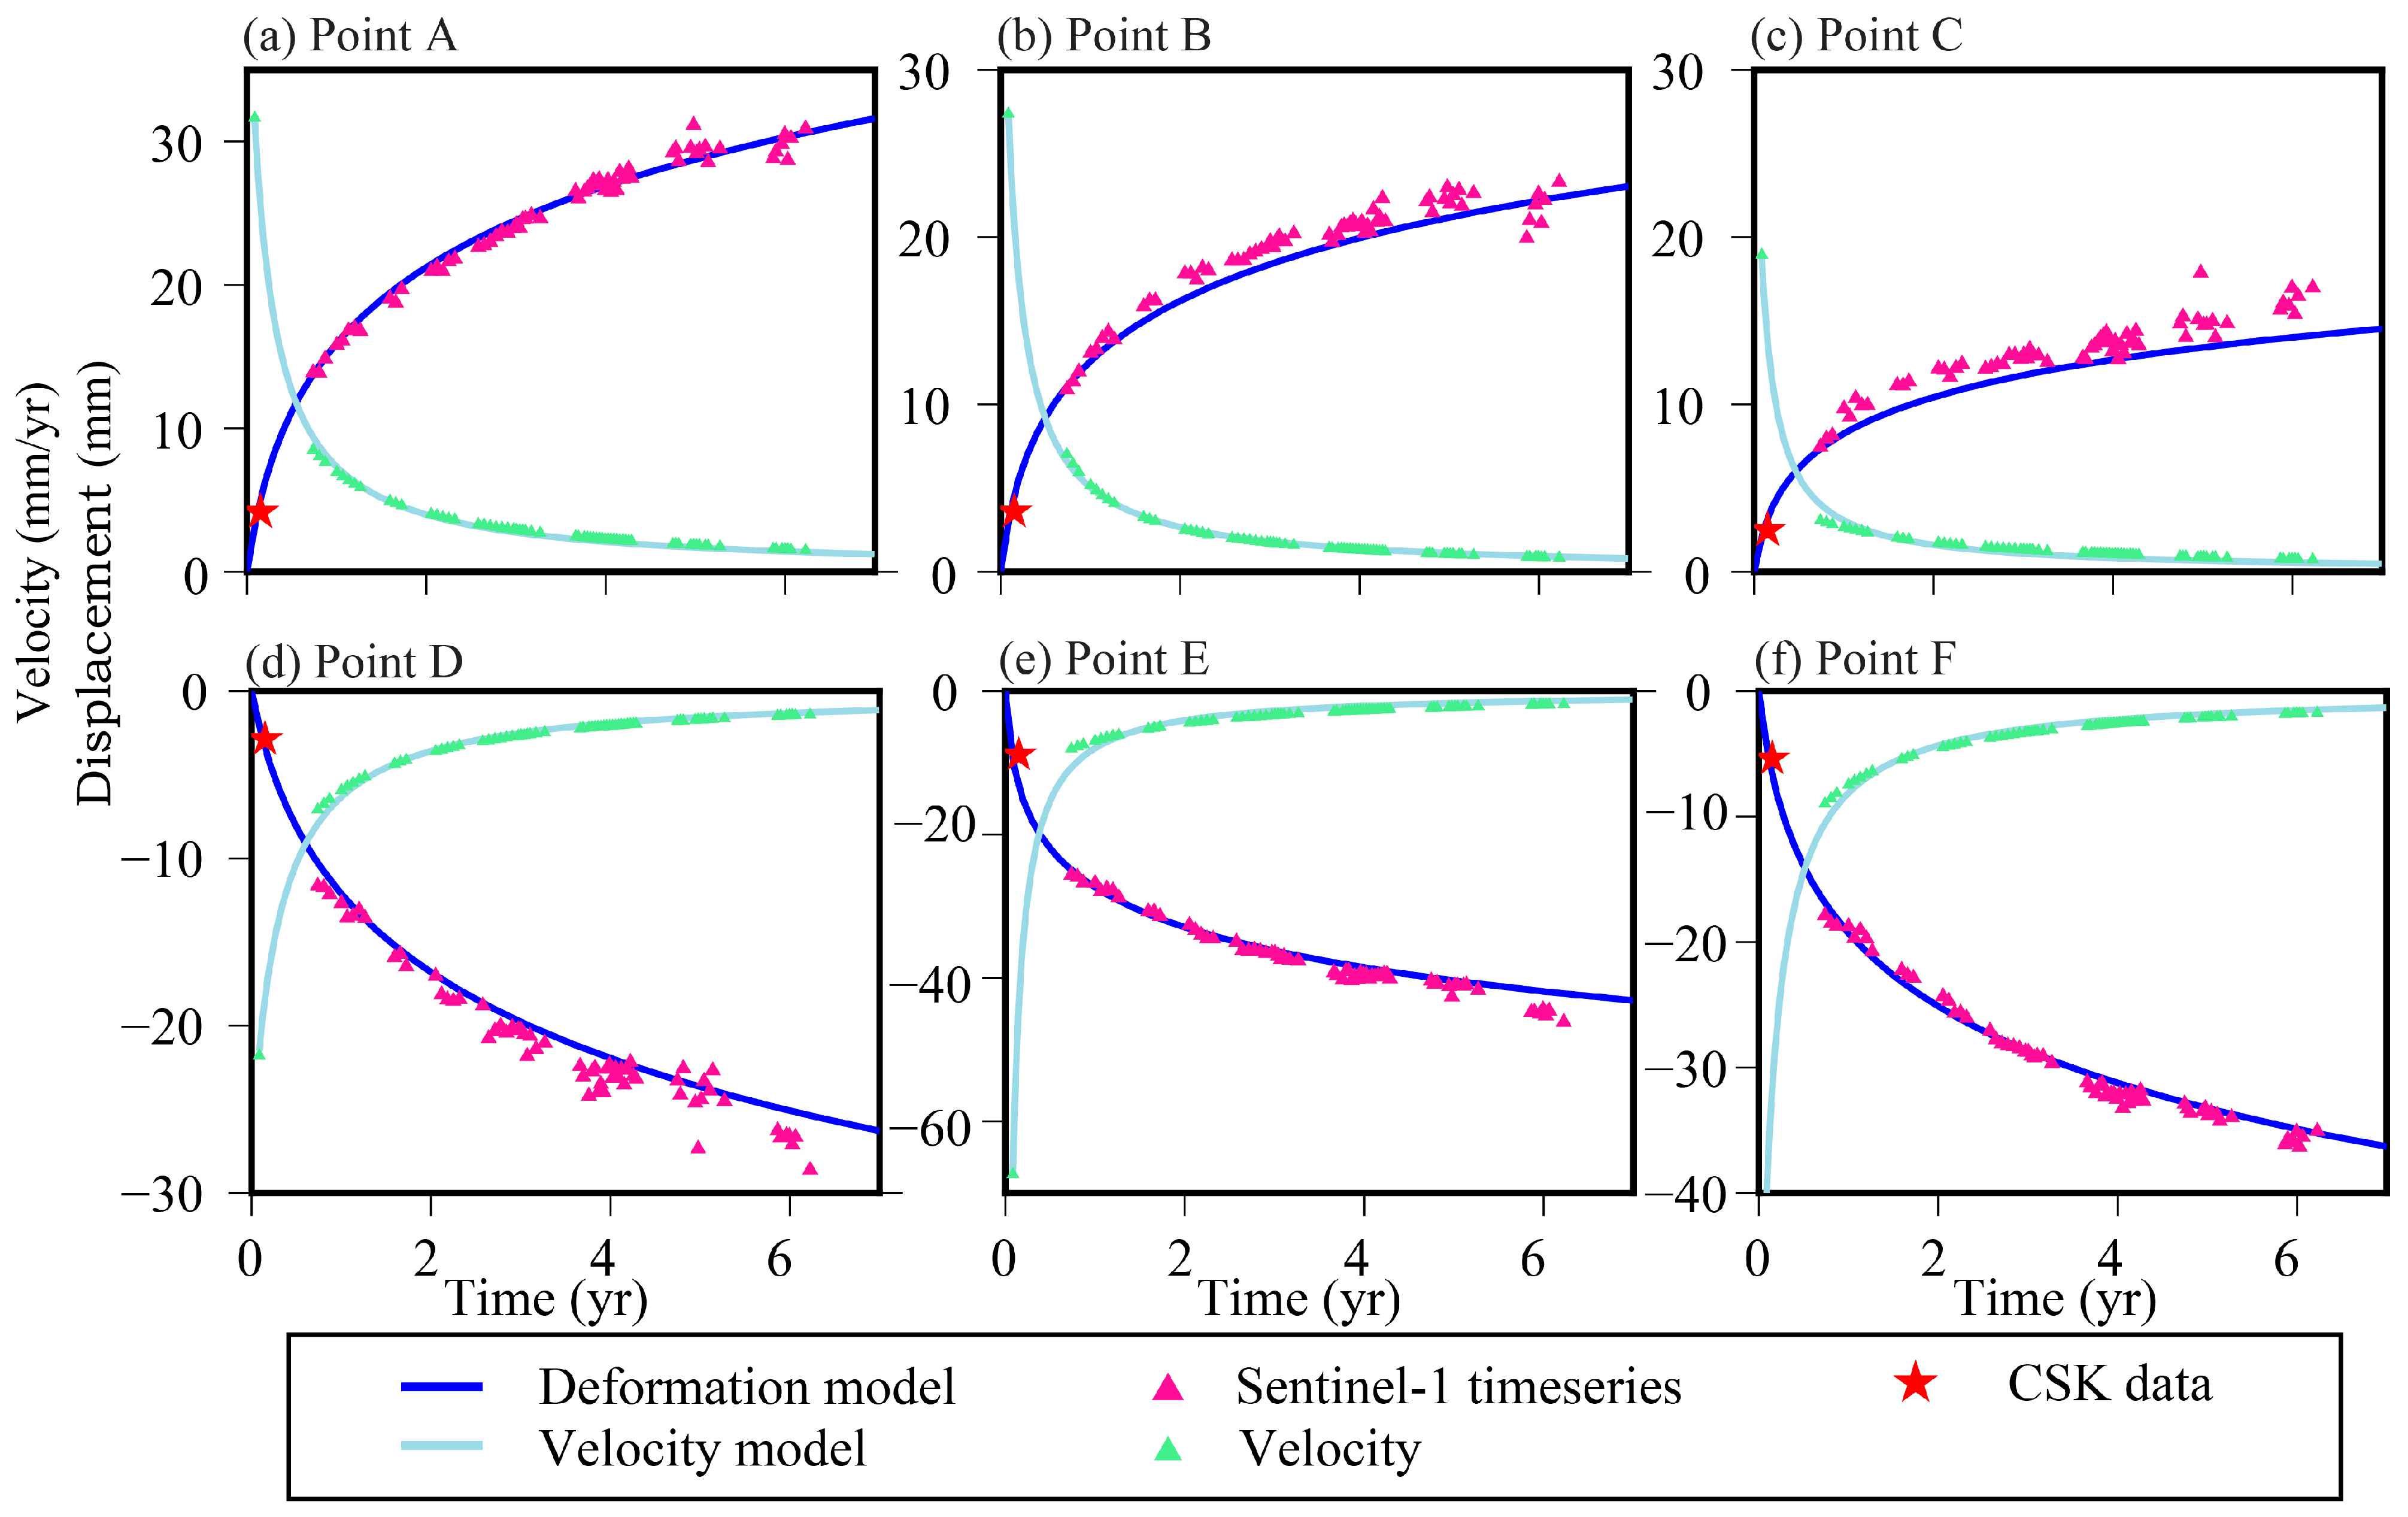
2.2. Post-Seismic Full Time Deformation Estimation

To obtain the full spatial and temporal evolution of post-seismic deformation, this study used the afterslip deformation rate decay model to establish a function of COSMO-Skymed observations in the early post-seismic period and Sentinel-1 time series deformation eight months after the earthquake. It provides a novel approach to recover early post-seismic deformations when there are limited SAR data to construct continuous time-series observations. The reference frame of the observations needs to be normalized first because of the different starting times of the two periods of the InSAR results. InSAR observes relative deformation, and observations from different satellites and different time periods are not continuous. However, the deformation rate is not affected by the start time. Therefore, we proposed a deformation rate decay model for time normalization.
We assumed that the post-seismic deformation was dominated by afterslip and that the temporal deformation conforms to the logarithmic function d ( t ) = A   l n ( 1 + t / τ ) + δ , where d ( t ) is the cumulative displacement at time epoch t after the earthquake, A is the deformation decay amplitude, τ is the decay constant, and δ is the constant offset associated with the reference point displacement. The initial deformation parameters of the model were first estimated using Sentinel-1 timeseries cumulative deformation and differentiated to obtain the rate decay model v e l = A / ( t + τ ) . We then estimated the early post-seismic average deformation rate of the same pixel at the time of the COSMO-Skymed observation and recalculated the deformation rate decay model parameters using the non-linear least squares method. Finally, the complete post-seismic time series deformation containing the early post-seismic period was recovered by integration.

2.3. Poroelastic Rebound Modeling

Stress changes from seismic ruptures cause pore pressure gradients in the rocks around the fault, and post-seismic fluid flow and equilibrium processes within the rocky porous medium lead to poroelastic rebound deformation on the surface [24]. Owing to the lack of real hydrological parameters in the source region, the time-dependent pore elastic deformation was not considered.
The cumulative response of poroelastic rebound is usually modeled by the difference of surface displacements with different Poisson’s ratio between the post-seismic “drained” and co-seismic “undrained” states [24], i.e., μ = μ drained μ undrained . μ drained and μ undrained denote the surface displacements due to drained and undrained states, respectively. In this study, Poisson’s ratio was set to 0.28 and 0.25 for the co-seismic undrained and post-seismic drained conditions, respectively, to simulate the post-seismic poroelastic deformation according to the co-seismic slip distribution of Li et al. [20].

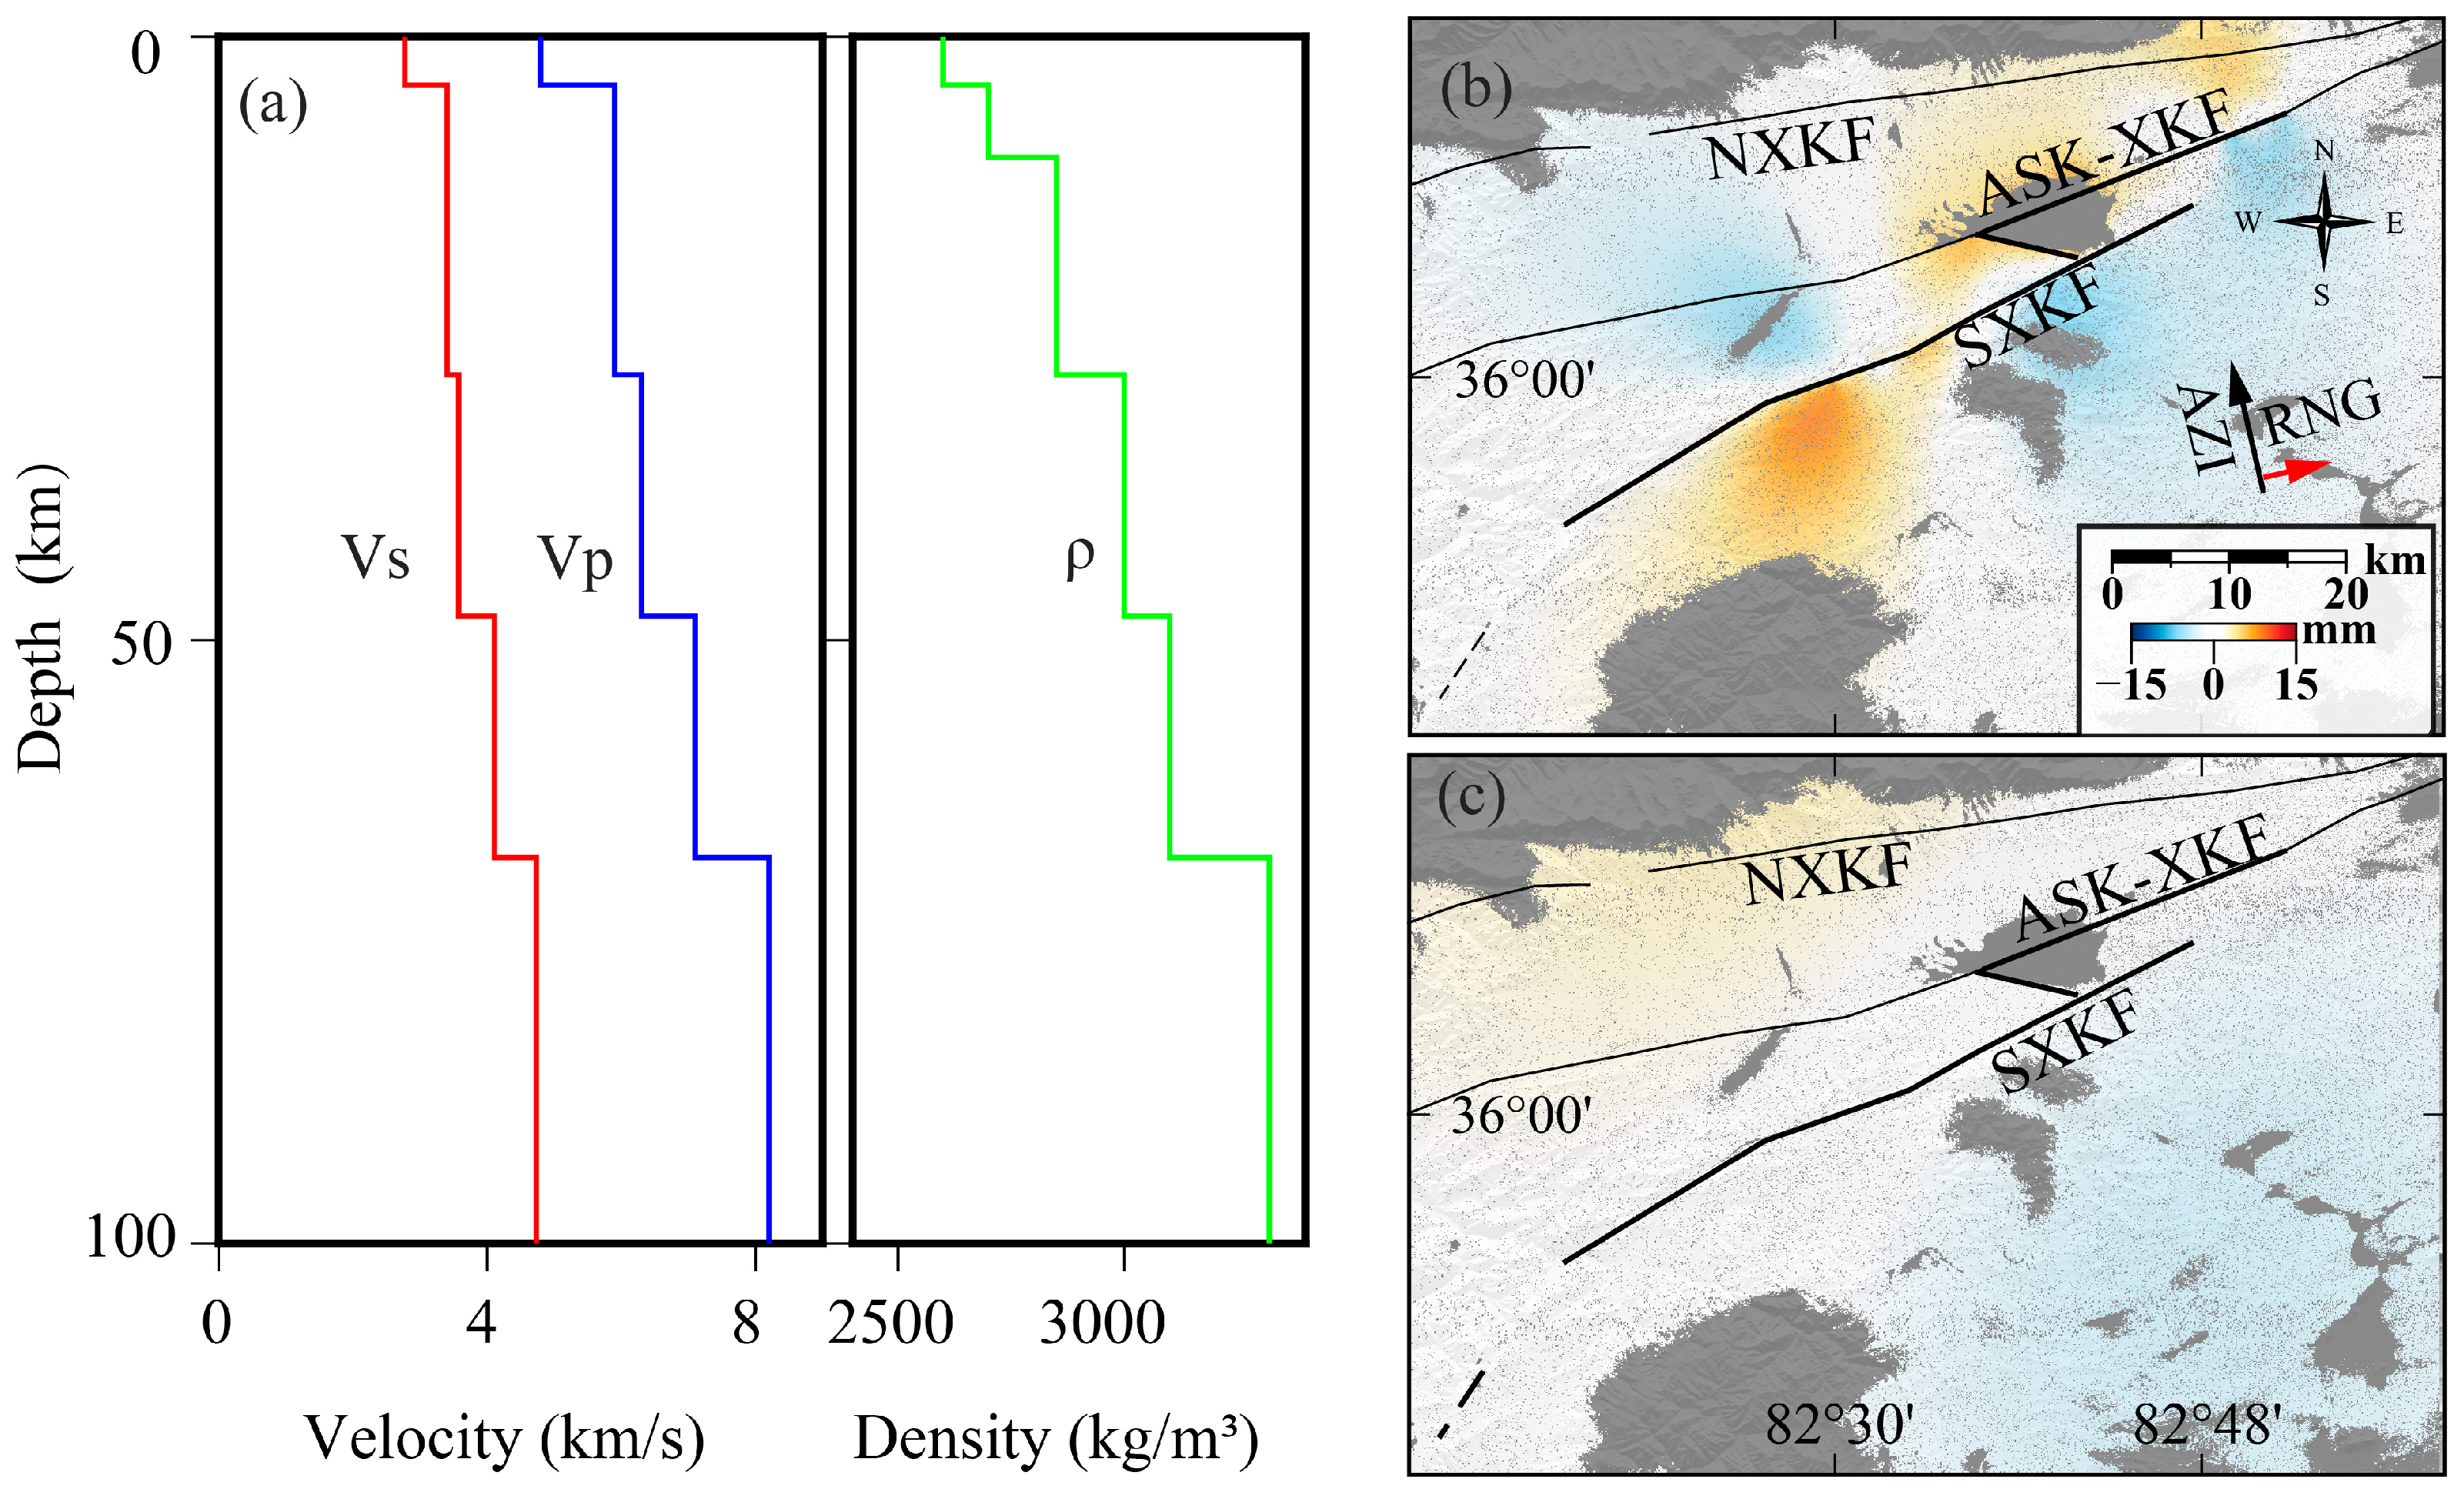
2.4. Viscoelastic Relaxation Modeling

Viscoelastic relaxation is the slow release of stress in the viscoelastic lower crust and upper mantle after an earthquake, which causes widespread surface deformation [22,33]. It is difficult to determine the viscoelastic coefficients of the lower crust and upper mantle because of the lack of an accurate crustal structure and continuous GNSS observations near seismogenic faults. In this study, we refer to the crustal structure model used in previous studies on strong earthquakes around the Bayan Har Block [34,35]. The layered viscoelastic model of the Yutian crust consists of an elastic upper crust and a Maxwell body composed of the lower crust and upper mantle below 28 km depth. The PSGRN/PSCMP program was used to simulate and calculate the surface displacement field resulting from viscoelastic relaxation for 6.2 years after the 2014 Yutian earthquake to further quantify the viscoelastic response of the lower crust and upper mantle [36].

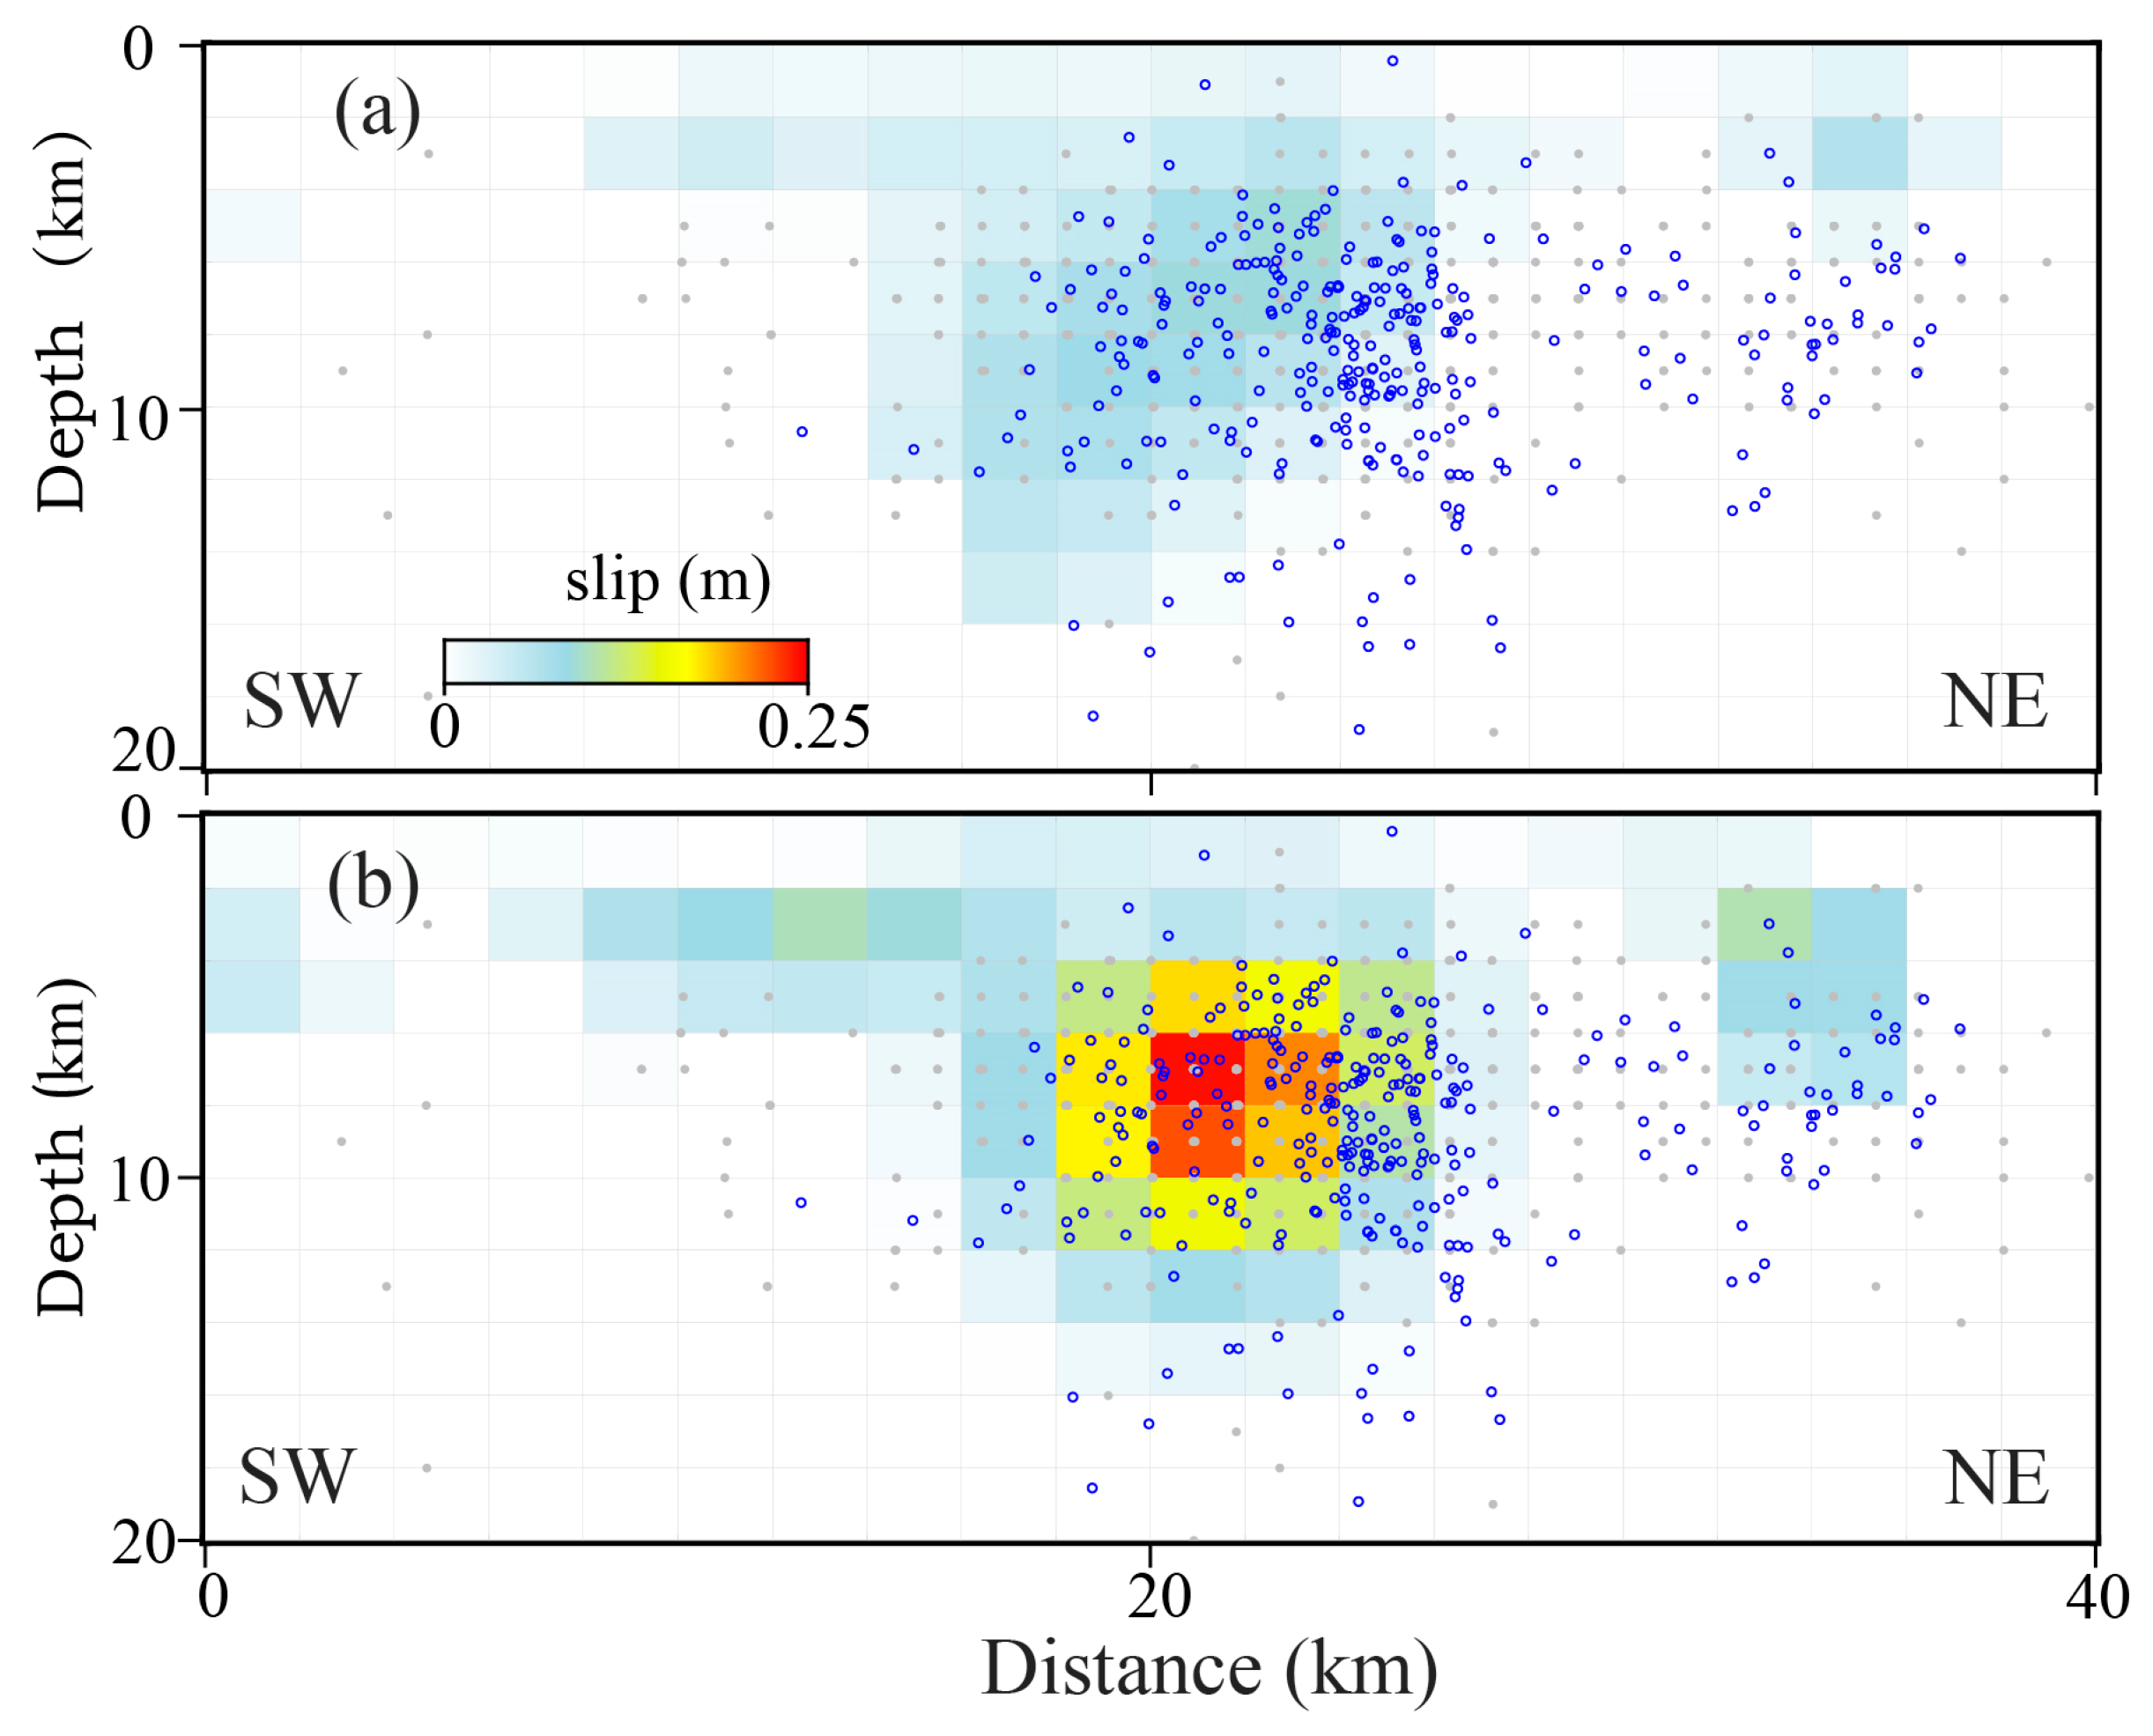
2.5. Kinematic Afterslip Modeling

The kinematic slip inversion method is based on Okada homogeneous elastic half-space rectangular dislocations, and uses post-seismic surface observations as constraints to obtain the fault afterslip model. F ( s , λ ) = G s d + λ 2 s denotes the objective function between surface deformation observations and the slip model, where 2 is the Laplace operator, λ is the smoothing factor, d is the surface deformation, s is the fault slip, and G is a Green’s function characterizing the response between deformation and fault dislocation. In this study, we adopted the co-seismic fault geometry parameters of Li et al. [20] for the afterslip inversion of the deformation region west of the mainshock. The fault geometry was extended along the strike according to the post-seismic deformation map, with an average fault strike of 242° and dip of 78°. The width of the fault was set to 20 km, and the fault plane was discretized into patches of 2 km × 2 km. To reduce the redundancy of the InSAR observations, the early post-seismic deformation field acquired by the COSMO-Skymed and the cumulative deformation field were downsampled using the quadratic tree method [37]. A linear inversion method was used to estimate slip distribution on the fault plane.

3. Results

3.1. Spatiotemporal Characteristics of Post-Seismic Deformation

The early post-seismic deformation of the 2014 Yutian earthquake obtained from the COSMO-Skymed images is shown in Figure 2a. The results show a significant line-of-sight (LOS) deformation gradient across the co-seismic seismogenic fault at the southwestern end of the South Xor Kol fault, while there was no apparent deformation in the region of the mainshock rupture. This indicates a localized surface creep slip on the fault in the early post-seismic period, with a maximum deformation displacement of approximately 1.2 cm.
The post-seismic time-series cumulative deformations of the Sentinel-1 ascending and descending tracks are shown in Figure 2b,c. The observations indicate significant cross-fault deformation along the South Xor Kol fault and continuous deformation in the southwestern part of the South Xor Kol fault. The spatial distribution and tendency were consistent with early post-seismic deformation, and the maximum post-seismic cumulative displacement was more than 3 cm. The opposite deformation signals in the cumulative deformation fields of the ascending and descending tracks indicate the SW direction movement of the southeast plate and the NE direction movement of the northwest plate of the South Xor Kol Fault, which is consistent with the left-lateral strike-slip mechanism of the mainshock and the background field of crustal dynamics.
In order to better analyze and understand the magnitude of post-seismic deformation and rupture details in the near field, we extracted a series of profiles with a significant cross-fault deformation gradient (Figure 2 and Figure 3). The two-dimensional decomposition results from the accumulated deformation of the ascending and descending orbits (Figure 3a,b) indicate that the displacement mainly contributed to the horizontal motion, with relatively little deformation in the vertical upward direction. Vertical deformation signals primarily occurred at the location of profile cc’ in Figure 2, which shows subsidence on the northwest side and uplift on the southeast side. The subsidence deformation located at the south of the fault may responsible to the residual atmospheric noise. The post-seismic deformation was the same as the co-seismic deformation dominated by strike-slip with a minor normal slip.
Significant non-topographic deformation was also found in the ascending track deformation field, as well as in the results for the aa’ and bb’ profiles at 2 km (Figure 3). The fault trace is outlined by the 2D decomposition gradient of the deformation map, and the near-field surface rupture indicates the existence of branch faults in the southwestern tail of the South Xor Kol fault. The spatial distribution of post-seismic deformation indicates lateral heterogeneity along the strike of the South Xor Kol fault, reflecting the complex tectonic environment southwest of the Altyn Tagh fault. To further analyze the post-seismic spatial and temporal variation characteristics, the temporal deformation of profiles bb’ and cc’ in Figure 2 was extracted (Figure 4). The significant cross-fault near-field deformation gradient indicates surface rupture, with the magnitude of deformation decreasing from the near field to the far field and a temporal feature of afterslip.

3.2. Mechanism of Post-Seismic Deformation

The post-seismic poroelastic rebound ascending orbit LOS deformation, shown in Figure 5b, was made up of a four-quadrant distribution in the near field of the co-seismic rupture, with a maximum deformation of approximately 0.8 cm, which is much smaller than the InSAR observation. Although poroelastic rebound in the northeastern part of the fault seems to contribute slightly to post-seismic deformation, the opposite trend of poroelastic deformation at the southwestern end of the South Xor Kol fault indicates that poroelastic rebound is not the mechanism of post-seismic deformation.
Based on the crustal structure model adopted by Cheng et al. [34] (Figure 5a), the modelled surface deformation from the post-seismic viscoelastic relaxation (Figure 5c) exhibited a weak deformation in the far field on both sides of the co-seismic rupture zone. The maximum surface deformation was only 0.3 cm, indicating that the viscoelastic relaxation effect made a very limited contribution to post-seismic deformation after the 2014 Yutian earthquake. Therefore, post-seismic deformation in the near field was not dominated by viscoelastic relaxation and poroelastic rebound, especially at the southwest end of South Xor Kol, without the influence of poroelastic and viscoelastic relaxation effects.
To further analyze the post-seismic deformation mechanism, we collected the average time-series deformation of pixels in the six characteristic regions of the ascending track (Figure 6). The rate decay model based on the logarithmic afterslip combines multiple InSAR observations, which provides a practical and efficient solution for mitigating the temporal gap in continuous deformation monitoring. The full time series of post-seismic deformation revealed that the maximum accumulated deformation of the model was approximately 2.5 cm in the first eight months after the earthquake. The fitting residuals of the COSMO-Skymed observations were less than 0.8 mm, showing that early deformation contributed significantly to post-seismic deformation and provided essential constraints. The evolution of post-seismic deformation showed that 40–55% of the total amount occurred in the first eight months, indicating that the deformation rates decayed rapidly during the early post-seismic period. In general, considering the spatial and temporal distribution characteristics of the observation and predictions driven by multiple mechanisms, the post-seismic deformation of the 2014 event was dominated by the afterslip.
In this study, we only used ascending track data to constrain the slip model because the observation geometry of the satellite’s ascending tracks is better suited for capturing post-seismic movement along the South Xor Kol fault, and the descending track data are more affected by significant atmospheric noise. We selected an area at the southwest end of the South Xor Kol fault with significant afterslip features for post-seismic kinematic inversion using ascending data. The inversion results obtained from the high-resolution deformation map from COSMO-Skymed (Figure 7a) showed that the afterslip was primarily distributed within a shallow depth of 10 km at the southwest end of the South Xor Kol fault. The afterslip distribution in the eastern discontinuity was above 4 km. The afterslip rupture to the surface was consistent with the results of the observed deformation across the fault. In the early period, the maximum afterslip was approximately 0.09 m at a depth of 7 km, and the seismic moment release was 2.7 × 10¹⁷ N·m at 7–55 days after the earthquake, which is equivalent to an Mw 5.59 earthquake. The Sentinel-1 data offered effective constraints for the completed distribution of the afterslip model. The total afterslip had the same overall distribution characteristics as the early afterslip model, showing shallow slip and discontinuous afterslip (Figure 7b). The maximum afterslip was approximately 0.24 m at a depth of 7 km. The seismic moment of 0.74–6.2 year after the earthquake was 5.78 × 10¹⁷ N·m, equivalent to an Mw 5.8 earthquake, and the residual was 0.38 cm. While the model prediction and observed deformation match well in the southwest part of the fault, due to the possible low dip angle of the fault geometry, the model still underestimated the deformation of the southern part. The afterslip distribution of the South Xor Kol fault was adjacent to the co-seismic rupture, reflecting shallow velocity-strengthening frictional properties.

4. Discussion

For determining post-seismic stress release and redistribution, InSAR provides large-scale and high-accuracy spatio-temporal evidence that reflects various scales of post-seismic deformation responses. Following the 2014 Yutian earthquake, there appeared to be a close relationship between aftershocks and post-seismic afterslip [38]. The spatial and temporal distributions of aftershocks were in agreement with the early post-seismic deformation pattern of the COSMO-Skymed, but the InSAR data provided more accurate details that reflected post-seismic stress changes. The discontinuous distribution of aftershocks in the northeast and southwest directions from the epicentre [39] (Figure 1b) indicates that the post-seismic continuation of the mainshock was characterized by bilateral rupture. The limited recorded aftershocks in the northeastern direction and their deformation across the fault suggest that there was still a weak stress release on the Ashikule-Xor Kol fault after the earthquake. The aftershocks were concentrated mainly in the afterslip deformation area at the southwestern end of the fault. The depth distribution of the aftershocks was consistent with the spatial distribution of the afterslip on the fault surface (Figure 7), which is concentrated at depths of 4–14 km, revealing that stress was released in the shallow portion. InSAR was used to reveal the temporal distribution. The moment released by aftershock during the COSMO-Skymed period was approximately 4.47 × 10¹⁶ N·m, equivalent to an Mw 5.07 earthquake, representing 17% of the energy released by the early afterslip and 5% of the accumulated afterslip. Sadeghi-Chorsi et al. [40] found a comparable post-seismic pattern after the 2020 Mw 6.5 Monte Cristo Range earthquake, Nevada, in which the ratio of aftershocks to the moment release of the afterslip was about 10% during the initial first 8-month period. Therefore, early post-seismic InSAR data provided evidence of constraints on energy release. The spatiotemporal coupling pattern of aftershocks and afterslip implies that a rapidly decaying afterslip triggers aftershocks [41]. Accordingly, we conclude that the majority of aftershock activity in the SW was driven by afterslip at the end of the rupture.
The South Xor Kol fault exhibited complexity along the strike at the southwest end. The ratio of released moment between afterslip and co-seismic was only 5%. Churchill et al. [42] showed significant fluctuations of the ratio from 58 earthquakes globally, ranging from <1% to >300%, with an interquartile range of 9% to 32%. The lack of early afterslip and the fault maturity may contribute to the variations of ratios, and partly explain our result. The clustered pattern of aftershocks and afterslip reflects the tendency of co-seismic stress to load at both ends of the co-seismic rupture, and in this case predominantly its southwest end. Afterslip along the strike of the southern Xor Kol fault was driven by co-seismic shear stress release in adjacent areas [43], and it reflects the velocity-strengthening frictional properties. On one hand, the Yutian earthquake sequence is located at the southwest end of the Altyn Tagh fault, which is characterized by the Altyn Tagh strike-slip shear kinematics. On the other hand, the South Xor Kol fault is connected to a series of normal faults in the south, which form the western boundary of the Bayan Har block with east–west extensional characteristics [2,13,44]. This implies that fault transformations with different kinematic properties may have occurred in the area. Li et al. [6] used the Riedel shear rupture structure to explain the co-seismic surface rupture of the 2014 Yutian earthquake, indicating regional shear characteristics. Therefore, the southern-branch fault may have been caused by redistribution and adjustment of a similar local shear stress. Continuous shear stress persists at the end of the fault transformation in the region. In the tectonic environment of the continuous eastward movement of the Bayan Har Block and shear stress in the boundary region, seismic hazards persist within the region.

5. Conclusions

In this study, we obtained early post-seismic deformation data for the 2014 Yutian Mw 6.9 earthquake. Based on the logarithmic characteristics of post-seismic deformation, a rate decay function model was proposed to combine InSAR observations from different platforms and periods. We obtained the spatial and temporal evolution characteristics of the post-seismic deformation. Analysis of the post-seismic deformation mechanism indicated that post-seismic deformation of the 2014 Yutian earthquake was dominated by the afterslip, which was mainly distributed at the southwest end of the epicenter. The afterslip in the adjacent area was triggered by co-seismic shear stress. Energy release of the co-seismic rupture stress in the southwest direction contributed to the rupture of the south branch fault at the end of the South Xor Kol fault. The spatiotemporal relationship between the aftershocks and afterslip suggests that afterslip-driven aftershocks occur. Considering the complex tectonics in this region, a significant seismic hazard still exists in the southwestern section of the Altyn Tagh fault.

Author Contributions

Conceptualization, Z.H. and W.X.; methodology, Z.H. and W.X.; software, Z.H.; validation, Z.H., L.X. and W.X.; formal analysis, Z.H., L.X., L.Z. and W.X.; investigation, W.X. and Z.H.; resources, W.X.; data curation, Z.H. and L.Z.; writing—original draft preparation, Z.H.; writing—review and editing, all authors; visualization, Z.H.; supervision, L.X. and W.X.; project administration, W.X.; funding acquisition, W.X. All authors have read and agreed to the published version of the manuscript.

Funding

This research was funded by the National Natural Science Foundation of China (No. 42174023).

Data Availability Statement

Sentinel-1 SAR data used in this study are available from the European Space (https://scihub.copernicus.eu/dhus/#/home). COSMO-SkyMed commercial SAR data are from Agenzia Spaziale Italiana. The GAMMA commercial software from https://www.gamma-rs.ch/software. Seismic data from the U.S. Geological Survey (https://www.usgs.gov/programs/earthquake-hazards), the Global Central Moment Tensor (http://www.globalcmt.org/CMTsearch.html), and the China Earthquake Networks Center (http://data.earthquake.cn/index.html). The relocated aftershocks provided by L. Fang (https://doi.org/10.6038/cjg20150310). The LiSBAS software downloads from https://github.com/yumorishita/LiCSBAS. All the data and websites were last accessed on 23 April 2023.

Acknowledgments

The authors would like to thank the European Space Agency (ESA) for providing the free Sentinel-1 data. Deep appreciation is expressed to the editor and anonymous reviewers for their professional and constructive comments. The authors would also like to thank Xiaoge Liu and Hongzhi Liu for their suggestion during the development of this study. The figures are generated by the Generic Mapping Tools (GMT 6) software package.

Conflicts of Interest

The authors declare no conflict of interest.

References

  1. Molnar, P.; Tapponnier, P. Cenozoic Tectonics of Asia: Effects of a Continental Collision: Features of recent continental tectonics in Asia can be interpreted as results of the India-Eurasia collision. Science 1975, 189, 419–426. [Google Scholar] [CrossRef] [PubMed]
  2. Taylor, M.; Yin, A. Active structures of the Himalayan-Tibetan orogen and their relationships to earthquake distribution, contemporary strain field, and Cenozoic volcanism. Geosphere 2009, 5, 199–214. [Google Scholar] [CrossRef]
  3. Deng, Q.; Zhang, P.; Ran, Y.; Yang, X.; Min, W.; Chu, Q. Basic characteristics of active tectonics of China. Sci. China Ser. D-Earth Sci. 2003, 46, 356–372. [Google Scholar] [CrossRef]
  4. Zhang, P.; Deng, Q.; Zhang, G.; Ma, J.; Gan, W.; Min, W.; Mao, F.; Wan, Q. Active Blocks and Strong Earthquake in the continent of China. Sci. China Ser. D-Earth Sci. 2003, 46, 13–24. [Google Scholar] [CrossRef]
  5. Zhang, P.; Deng, Q.; Zhang, Z.; Li, H. Active faults, earthquake hazards and associated geodynamic processes in continental China. Sci. Sin. Terr. 2013, 43, 1607–1620. (In Chinese) [Google Scholar] [CrossRef]
  6. Li, H.; Pan, J.; Sun, Z.; Liu, D.; Zhang, J.; Li, C.; Liu, K.; Yun, K.; Gong, Z. Seismogenic Structure and Surface Rupture Characteristics of the of the 2014 Ms 7.3 Yutian Earthquake. Acta Geol. Sin. 2015, 89, 180–194. [Google Scholar]
  7. Xu, X.; Tan, X.; Yu, G.; Wu, G.; Fang, W.; Chen, J.; Song, H.; Shen, J. Normal- and oblique-slip of the 2008 Yutian earthquake: Evidence for eastward block motion, northern Tibetan Plateau. Tectonophysics 2013, 584, 152–165. [Google Scholar] [CrossRef]
  8. Wang, J.; Xu, C.; Freymueller, J.T.; Li, Z. Probing Coulomb stress triggering effects for a Mw > 6.0 earthquake sequence from 1997 to 2014 along the periphery of the Bayan Har block on the Tibetan Plateau. Tectonophysics 2017, 694, 249–267. [Google Scholar] [CrossRef]
  9. Jia, K.; Zhou, S.; Zhuang, J.; Jiang, C. Stress transfer in the western boundary of Bayan Har Block in Tibet Plateau from the 2008 to 2020 Yutian Earthquake sequence in China. Geophys. Res. Lett. 2021, 48, e2021GL094125. [Google Scholar] [CrossRef]
  10. Elliott, J.R.; Walters, R.J.; England, P.C.; Jackson, J.A.; Li, Z.; Parsons, B. Extension on the Tibetan plateau: Recent normal faulting measured by InSAR and body wave seismology. Geophys. J. Int. 2010, 183, 503–535. [Google Scholar] [CrossRef]
  11. Furuya, M.; Yasuda, T. The 2008 Yutian normal faulting earthquake (Mw 7.1), NW Tibet: Non-planar fault modeling and implications for the Karakax Fault. Tectonophysics 2011, 511, 125–133. [Google Scholar] [CrossRef]
  12. Shan, X.; Zhang, G.; Wang, C.; Qu, C.; Song, X.; Zhang, G.; Guo, L. Source characteristics of the Yutian earthquake in 2008 from inversion of the coseismic deformation field mapped by InSAR. J. Asian Earth Sci. 2011, 40, 935–942. [Google Scholar] [CrossRef]
  13. Li, Q.; Li, C.; Tan, K.; Lu, X.; Zuo, X. Slip Model of the 2020 Yutian (Northwestern Tibetan Plateau) Earthquake Derived From Joint Inversion of InSAR and Teleseismic Data. Earth Space Sci. 2021, 8, e2020EA001409. [Google Scholar] [CrossRef]
  14. He, P.; Wen, Y.; Ding, K.; Xu, C. Normal Faulting in the 2020 Mw 6.2 Yutian Event: Implications for Ongoing E–W Thinning in Northern Tibet. Remote Sens. 2020, 12, 3012. [Google Scholar] [CrossRef]
  15. Yu, J.; Wang, D.; Zhao, B.; Li, Q. Normal Faulting Movement During the 2020 Mw 6.4 Yutian Earthquake: A Shallow Rupture in NW Tibet Revealed by Geodetic Measurements. Pure Appl. Geophys. 2021, 178, 1563–1578. [Google Scholar] [CrossRef]
  16. Yuan, Z.; Liu, J.; Li, X.; Xu, J.; Yao, W.; Han, L.; Li, T. Detailed mapping of the surface rupture of the 12 February 2014 Yutian Ms 7.3 earthquake, Altyn Tagh fault, Xinjiang, China. Sci. China Earth Sci. 2021, 64, 127–147. [Google Scholar] [CrossRef]
  17. Zhang, Y.; Xu, L.; Chen, Y.; Wang, R. Fast inversion for the rupture process of the 12 February 2014 Yutian Mw 6.9 earthquake: Discussion on the impacts of focal mechanisms on rupture process inversions. Acta Seismol. Sin. 2014, 36, 159–164. [Google Scholar]
  18. Zhang, H.; Ge, Z. Stepover Rupture of the 2014 Mw 7.0 Yutian, Xinjiang, Earthquake. Bull. Seismol. Soc. Am. 2017, 107, 581–591. [Google Scholar] [CrossRef]
  19. Liang, H.; Wu, Y.; Chen, C.; Xiong, W. Coseismic displacement and dislocation inversion of 2014 Yutian Ms 7.3 earthquake in Xinjiang. Chin. J. Geophys. 2018, 61, 4817–4826. [Google Scholar]
  20. Li, X.; Xu, W.; Jónsson, S.; Klinger, Y.; Zhang, G. Source Model of the 2014 Mw 6.9 Yutian Earthquake at the Southwestern End of the Altyn Tagh Fault in Tibet Estimated from Satellite Images. Seismol. Res. Lett. 2020, 91, 3161–3170. [Google Scholar] [CrossRef]
  21. Luo, Y.; Hu, Y.; Tian, Y.; Zhang, J. Seismogenic fault and aftershock characteristics for the 2014 Ms 7.3 Yutian earthquake, Xinjiang. Acta Geol. Sin. 2021, 43, 48–56. [Google Scholar]
  22. Nur, A.; Mavko, G. Postseismic Viscoelastic Rebound. Science 1974, 183, 204–206. [Google Scholar] [CrossRef] [PubMed]
  23. Perfettini, H.; Avouac, J.P. Postseismic relaxation driven by brittle creep: A possible mechanism to reconcile geodetic measurements and the decay rate of aftershocks, application to the Chi-Chi earthquake, Taiwan. J. Geophys. Res. Solid Earth 2004, 109, B02304. [Google Scholar] [CrossRef]
  24. Jónsson, S.; Segall, P.; Pedersen, R.; Björnsson, G. Post-earthquake ground movements correlated to pore-pressure transients. Nature 2003, 424, 179–183. [Google Scholar] [CrossRef] [PubMed]
  25. Fang, L.; Wu, J.; Wang, W.; Yang, T.; Wang, C. Relocation of the 2014 Ms 7.3 earthquake sequence in Yutian, Xinjiang. Chin. J. Geophys. 2015, 58, 802–808. [Google Scholar] [CrossRef]
  26. Wang, M.; Shen, Z. Present-Day Crustal Deformation of Continental China Derived From GPS and Its Tectonic Implications. J. Geophys. Res. Solid Earth 2020, 125, e2019JB018774. [Google Scholar] [CrossRef]
  27. Farr, T.G.; Rosen, P.A.; Caro, E.; Crippen, R.; Duren, R.; Hensley, S.; Kobrick, M.; Paller, M.; Rodriguez, E.; Roth, L.; et al. The Shuttle Radar Topography Mission. Rev. Geophys. 2007, 45, RG2004. [Google Scholar] [CrossRef]
  28. Chen, C.W.; Zebker, H.A. Phase unwrapping for large SAR interferograms: Statistical segmentation and generalized network models. IEEE Trans. Geosci. Remote Sens. 2002, 40, 1709–1719. [Google Scholar] [CrossRef]
  29. Tymofyeyeva, E.; Fialko, Y. Mitigation of atmospheric phase delays in InSAR data, with application to the eastern California shear zone. J. Geophys. Res. Solid Earth 2015, 120, 5952–5963. [Google Scholar] [CrossRef]
  30. Wang, K.; Fialko, Y. Observations and Modeling of Coseismic and Postseismic Deformation Due To the 2015 Mw7.8 Gorkha (Nepal) Earthquake. J. Geophys. Res. Solid Earth 2018, 123, 761–779. [Google Scholar] [CrossRef]
  31. Li, S.; Xu, W.; Li, Z. Review of the SBAS InSAR Time-series algorithms, applications, and challenges. Geod. Geodyn. 2022, 13, 114–126. [Google Scholar] [CrossRef]
  32. Morishita, Y.; Lazecky, M.; Wright, T.J.; Weiss, J.R.; Elliott, J.R.; Hooper, A. LiCSBAS: An open-source InSAR time series analysis package integrated with the LiCSAR automated Sentinel-1 InSAR processor. Remote Sens. 2020, 12, 424. [Google Scholar] [CrossRef]
  33. Zhao, D.; Qu, C.; Bürgmann, R.; Gong, W.; Shan, X. Relaxation of Tibetan Lower Crust and Afterslip Driven by the 2001 Mw 7.8 Kokoxili, China, Earthquake Constrained by a Decade of Geodetic Measurements. J. Geophys. Res. Solid Earth 2021, 126, e2020JB021314. [Google Scholar] [CrossRef]
  34. Cheng, J.; Liu, J.; Gan, W.; Yu, H. Coulomb stress interaction among strong earthquakes around the Bayan Har block since the Manyi earthquake in 1997. Chin. J. Geophys. 2011, 54, 1997–2010. [Google Scholar]
  35. Zhang, C.; Cao, J.; Shi, J. Study the the viscosity of lower crust of Qinghai-Tibet Plateau according to postseismic deformation. Sci. China Ser. D-Earth Sci. 2009, 52, 411–419. [Google Scholar] [CrossRef]
  36. Wang, R.; Lorenzo-Martín, F.; Roth, F. PSGRN/PSCMP—A new code for calculating co-and post-seismic deformation, geoid and gravity changes based on the viscoelastic-gravitational dislocation theory. Comput. Geosci. 2006, 32, 527–541. [Google Scholar] [CrossRef]
  37. Jónsson, S.; Zebker, H.; Segall, P.; Amelung, F. Fault slip distribution of the 1999 Mw 7.1 Hector Mine, California, earthquake, estimated from satellite radar and GPS measurements. Bull. Seismol. Soc. Am. 2002, 92, 1377–1389. [Google Scholar] [CrossRef]
  38. Liu, X.; Xu, W. Logarithmic Model Joint Inversion Method for Coseismic and Postseismic Slip: Application to the 2017 Mw 7.3 Sarpol Zahāb Earthquake, Iran. J. Geophys. Res. Solid Earth 2019, 124, 12034–12052. [Google Scholar] [CrossRef]
  39. Tang, M.; Wang, H.; Li, Y.; Reyi, M.; Kong, X.; Wei, Y.; Shangguang, W.; Wei, B. Relocation of the 2014 Yutian, Xinjiang, Ms 7.3 earthquake sequence and a preliminary study of its seismogenic structure. Chin. J. Geophys. 2016, 59, 2126–2137. [Google Scholar]
  40. Sadeghi Chorsi, T.; Braunmiller, J.; Deng, F.; Dixon, T.H. Afterslip from the 2020 M 6.5 Monte Cristo Range, Nevada Earthquake. Geophys. Res. Lett. 2022, 49, e2022GL099952. [Google Scholar] [CrossRef]
  41. Koper, K.D.; Pankow, K.L.; Pechmann, J.C.; Hale, J.M.; Burlacu, R.; Yeck, W.L.; Benz, H.M.; Herrmann, R.B.; Trugman, D.T.; Shearer, P.M. Afterslip Enhanced Aftershock Activity During the 2017 Earthquake Sequence Near Sulphur Peak, Idaho. Geophys. Res. Lett. 2018, 45, 5352–5361. [Google Scholar] [CrossRef]
  42. Churchill, R.M.; Werner, M.J.; Biggs, J.; Fagereng, Å. Afterslip Moment Scaling and Variability From a Global Compilation of Estimates. J. Geophys. Res. Solid Earth 2022, 127, e2021JB023897. [Google Scholar] [CrossRef]
  43. Barnhart, W.D.; Brengman, C.M.; Li, S.; Peterson, K.E. Ramp-flat basement structures of the Zagros Mountains inferred from co-seismic slip and afterslip of the 2017 Mw 7.3 Darbandikhan, Iran/Iraq earthquake. Earth Planet. Sci. Lett. 2018, 496, 96–107. [Google Scholar] [CrossRef]
  44. Chevalier, M.-L.; Pan, J.; Li, H.; Sun, Z.; Liu, D.; Pei, J.; Xu, W.; Wu, C. First tectonic-geomorphology study along the Longmu–Gozha Co fault system, Western Tibet. Gondwana Res. 2017, 41, 411–424. [Google Scholar] [CrossRef]
Figure 2. Results of InSAR deformation observation and modeling. (a) The early post-seismic LOS deformation field of COSMO-Skymed. (b,c) Timeseries cumulative deformation fields of the ascending track AT165 and descending track DT158, respectively. (df) Post-seismic afterslip models for the corresponding time periods. The solid black line indicates regional faults, and the solid red line indicates faults used for the post-seismic afterslip inversion in this study. The blue line represents the location of profile, and the green triangle indicates the selected points for timeseries deformation analysis. (gi) The deformation observation (light red dots), afterslip model prediction (light blue lines), and 2σ-uncertainty (grey shadings) on profiles aa’, bb’, and cc’. The origin of the horizontal axis indicates the cross-section of profile and fault trace.
Remotesensing 15 02258 g002
Figure 3. Two-dimensional decomposition of cumulative deformation. (a,b) East–west and vertical deformation, respectively. (ce) Fault profiles corresponding to aa’, bb’, and cc’ in (a), respectively. The red dot indicates the east–west surface deformation along the fault profiles.
Remotesensing 15 02258 g003
Figure 4. Profiles of InSAR LOS displacement time series. (a,b) Temporal evolutions of deformation on profile bb’ (Figure 2b) of AT165 and profile cc’ (Figure 2c) of DT158, respectively.
Remotesensing 15 02258 g004
Figure 5. Crustal medium parameters and simulated post-seismic surface deformation. (a) Vp and Vs are the P- and S-wave velocities, respectively, and ρ is the Earth medium density. (b) Simulated value of surface deformation due to post-seismic poroelastic rebound. (c) Simulated surface deformation due to viscoelastic relaxation.
Remotesensing 15 02258 g005
Figure 6. Time series of post-seismic deformation on selected points in Figure 2. (af) The dark pink triangles indicate Sentinel-1 time-series displacements, light green triangles indicate deformation rates, and red pentagons indicate the COSMO-Skymed deformation for the early 7–55 days after the earthquake. Blue lines indicate the post-seismic deformation fitted by the deformation model. Light blue lines indicate the fitted post-seismic decay deformation rate.
Remotesensing 15 02258 g006
Figure 7. Afterslip distribution and aftershocks. (a) Early afterslip distribution derived from COSMO-Skymed data. (b) Cumulative afterslip distribution from Sentinel-1 data. Grey dots and blue circles indicate the aftershocks of CENC and relocated aftershocks, respectively.
Remotesensing 15 02258 g007
Table 1. Details of SAR data used in this study.
SatelliteAsc/DescTrackNumber of
Images
TimeMethod
Sentinel-1Asc1657120141016–20200505LiCSBAS
Desc1587720141029–20200617
COSMO-SkyMedAsc420140219–20140408 (7–55 days)
20140227–20140404 (15–51 days)
DInSAR
Disclaimer/Publisher’s Note: The statements, opinions and data contained in all publications are solely those of the individual author(s) and contributor(s) and not of MDPI and/or the editor(s). MDPI and/or the editor(s) disclaim responsibility for any injury to people or property resulting from any ideas, methods, instructions or products referred to in the content.

