Article

The Latest Desertification Process and Its Driving Force in Alxa League from 2000 to 2020

1
Key Laboratory of Desert and Desertification, Northwest Institute of Eco-Environment and Resources, Chinese Academy of Sciences, Lanzhou 730000, China
2
University of Chinese Academy of Sciences, Beijing 100049, China
3
Key Laboratory of Ecological Safety and Sustainable Development in Arid Lands, Northwest Institute of Eco-Environment and Resources, Chinese Academy of Sciences, Lanzhou 730000, China
4
Key Laboratory of Ecohydrology of Inland River Basin, Northwest Institute of Eco-Environment and Resources, Chinese Academy of Sciences, Lanzhou 730000, China
5
Qilian Mountains Eco-Environment Research Center in Gansu Province, Northwest Institute of Eco-Environment and Resources, Chinese Academy of Sciences, Lanzhou 730000, China
*
Author to whom correspondence should be addressed.
Remote Sens. 2023, 15(19), 4867; https://doi.org/10.3390/rs15194867
Submission received: 8 September 2023 / Revised: 30 September 2023 / Accepted: 5 October 2023 / Published: 8 October 2023
(This article belongs to the Special Issue Remote Sensing for Land Degradation and Drought Monitoring II)

Abstract

:
Alxa League of Inner Mongolia Autonomous Region is a concentrated desert distribution area in China, and the latest desertification process and its driving mechanism under the comprehensive influence of the extreme dry climate and intense human activities has attracted much attention. Landsat data, including ETM+ images obtained in 2000, TM images obtained in 2010, and OLI images obtained in 2020, were used to extract three periods of desertification land information using the classification and regression tree (CART) decision tree classification method in Alxa League. The spatio-temporal variation characteristics of desertification land were analyzed by combining the transfer matrix and barycenter migration model; the effects of climate change and human activities on regional desertification evolution were separated and recombined using the multiple regression residual analysis method and by considering the influence of non-zonal factors. The results showed that from 2000 to 2020, the overall area of desertification land in Alxa League was reduced, the desertification degree was alleviated, the desertification trend was reversed, and the desertification degree in the northern part of the region was more serious than in the southern part. The barycenter of the slight, moderate, and severe desertification land migrated to the southeast, whereas the serious desertification land’s barycenter migrated to the northwest in the period of 2000–2010; however, all of them hardly moved from 2010 to 2020. The degree of desertification reversal in the south was more significant than in the north. Regional desertification reversal was mainly influenced by the combination of human activities and climate change, and the area accounted for 61.5%; meanwhile, the localized desertification development was mainly affected by human activities and accounted for 76.8%.

1. Introduction

Aeolian desertification is a land degradation that is mainly marked by wind–sand activities caused by the incoordination of human–land relations in arid, semi-arid, and partially sub-humid areas and is one of the most serious social–economic–environmental problems facing the world today [1,2,3]. In the past few eras, desertification has increasingly caused a serious negative impact on regional social and economic development in many parts of the world, which account for one-half of the global land area [4,5,6]. China is one of the countries most seriously affected by desertification, and scholars have carried out much research in sandy areas since the founding of the People’s Republic of China [3,7,8]. With the rapid development of “3S” technology, especially with the advantages of remote sensing technology being able to rapidly acquire large-scale surface information, it has become a hotspot for the research in the development/reversal of desertification land with respect to combining remote sensing monitoring and field investigation [9,10]. The methods for extracting desertification information based on remote sensing data include visual interpretation, computer automatic classification, and spectral hybrid analysis, which has experienced the changes from the traditional manual visual interpretation to the current multi-source data and multi-index and multi-algorithm classification, which has realized fast and efficient data extraction [6]. The data sources include initial aerial photographs, MODIS, NOAA/AVHRR, SPOT, and Landsat satellite data [11,12]. Based on the remote sensing images, supplemented by field investigation and verification, the construction of long-term desertification land data and the subsequent analysis of the desertification development and reversal process have become the basis of desertification research and ecological assessment.
The driving force of the desertification process has always been the focus of desertification research. According to the definition of desertification proposed by the United Nations Convention to Combat Desertification in 1994, climate change and human activities have been recognized as the two major driving forces of the desertification process [4,13,14]. But which parts of the desertification process are due to climate change and which are due to human activities or a combination of the two? There is a need to isolate the role of factors in order to promote the understanding of the driving mechanisms of desertification and develop targeted desertification control strategies at national and regional scales [15,16]. At present, the research on the driving forces of desertification processes mainly focuses on two aspects. Firstly, statistical analysis methods such as regression models and principal component analyses are used to determine their relative roles through statistical models of meteorological, socio-economic, and desertification data [6,17]. In order to match the obtained statistical data, such methods usually take the administrative boundary as the research scope and cannot distinguish the spatial differences of driving forces on the raster scale. The second approach uses proxy indicators to unify the effects of climate change and human activities on desertification into a comparable indicator, such as the normalized difference vegetation index (NDVI) and net primary productivity (NPP) [6,16,18]. Both methods have been used in regional desertification research in the past, including in the aeolian desertification of grassland in the Sanjiangyuan region using statistical analysis methods [19] and the desertification processes on the Qinghai–Tibet Plateau using NPP data [16]. With the advantage of remote sensing data, the second method has been widely used in the evaluation of desertification driving forces at different spatial and temporal scales. However, MODIS products are commonly used at present, and their spatial resolutions are mostly 250 m, 500 m, and 1 km. For desertification areas with sparse vegetation, the resolution is slightly coarse and the results are highly uncertain [6,9].
Alxa League is located in the westernmost part of the Inner Mongolia Autonomous Region and is a typical desert area whose desertification environment and climate are also reflected in the proxy factor of pollen spectra [20]. It covers most of the three famous deserts in China, including the Badain Jaran Desert, Tengger Desert, and Ulambu Desert [21]. There are spatial differences in the surface characteristics among the three deserts in Alxa League, and their changes reflect the combined effects of natural conditions and human activity [22]. However, there are paddy fields along the Yellow River and Euphrates poplar forests that are maintained by the runoff of the Heihe River in desert areas, which are important factors that affect the desertification process in this region [6]. In the past 50 years, it has been a key area of ecological governance for the state and autonomous region [23,24]. From 1970 to the end of 1990, Alxa League appeared to have a tendency towards the increase in desertification, but the desertification appeared to have a decreasing trend after 2000; currently, the desertification of Alxa League has been inhibited, while the ecological governing area of the Helan mountain area northwest of the Tengger Desert and the Ejina banner in the Heihe River Basin has improved [25,26]. In recent years, an increase in precipitation in Alxa League was found, and it had a positive effect on carbon sequestration [27]. The dynamic changes in the desertification of the Tengger Desert from 1973 to 2009 were determined using five periods of remote sensing data, and the data also pointed out that reasonable and effective human activities in the southern region of the Tengger Desert was playing a crucial role in preventing desertification [28]. However, the latest spatio-temporal differences in the desertification process in Alxa League and its driving mechanism are not very clear, which limits the precise planning of ecological governance and desertification control in the future.
In the present study, we aim to discover the desertification dynamics in Alxa League from 2000 to 2020, i.e., when the climate had obvious changes and the human activities were intense, based on ETM+, TM, and OLI images obtained in 2000, 2010, and 2020 and using the classification and regression tree (CART) decision tree classification method; then, we aim to separate and quantify the effects of climate change and human activities on the desertification process from 2000 to 2020 using the multiple regression residual analysis method and by combining 30 m resolution NDVI data. The study will improve our understanding of the processes of aeolian desertification and its driving forces and provide a basis for regional desertification control.

2. Materials and Methods

2.1. Study Area

Alxa League of China’s Inner Mongolia Autonomous Region is located in the Inner Mongolia plateau and lies between 97.16°–106.87°E and 37.35°–42.78°N (Figure 1). The annual precipitation decreases from an average of 200 mm in the southeast to 40 mm in the northwest, making it one of the most arid regions in China [21]. Even so, it is rich in plant species with more than 300 kinds of psammophytes and desert plants, including Haloxylon ammodendron, Nitraria tangutorum, Cistanche deserticola, Cynomorium songaricum, and Xanthoceras sorbifolia. The region is also home to more than 180 rare animal species, including Equus przewalskii, Camelus ferus, and Ciconia nigra [21,29].
East of Alxa League is Helan Mountain, south is Heli Mountain and Longshou Mountain, and west is Mazong Mountain. From east to west, there are two important rivers that flow through or into this area, including the Yellow River and the Heihe River. Alxa League consists of three banners from east to west, which are the Alxa Left Banner, Alxa Right Banner, and Ejin Banner. Alxa League is the largest but least populated prefecture-level city in Inner Mongolia, having a population of 251 × 103 in 2019, but it has experienced severe ecological degradation because of the overgrazing of grassland, the unreasonable utilization of water and soil resources, and the decrease in upstream water inflow. In recent years, with the increase in water diversion from the Yellow River in its eastern region and with the discharge from the Heihe River in its western region, the land use and land cover has obviously changed and the regional ecological environment has been significantly improved [23]. In addition, due to the publicity and creation of desert geoparks, desert tourism, and the Euphrates poplar landscape, as well as the improvement of transportation convenience, regional tourism has rapidly developed [30].
Starting from the “Three-North” Shelterbelt project, since 1978, Alxa League has carried out a large number of ecological protection projects, including the “Natural Forest Protection” Project, the “Grain to Green” Program and “Ecological Migrant” Project since the mid-1990s, and the Ecological Water Diversion Project (EWDP) in the Heihe River basin (HRB) since 2000 [23]. Thus, Alxa League is an ideal area to study the desertification process and its driving mechanism.

2.2. Data and Methods

2.2.1. Satellite Data and Pre-Processing

The development of sand sheets and dunes indicates the presence of aeolian desertification and can be clearly recognized by remote sensing images [6]. We used ETM+ images taken in 2000, TM images taken in 2010, and OLI images taken in 2020 to create a database of aeolian desertification land distribution from the United States Geological Survey (USGS, http://glovis.usgs.gov/, accessed on 7 June 2023) and China Geospatial Data Cloud (http://www.gscloud.cn/, accessed on 7 June 2023). Some images from 1999, 2001, and 2009 were chosen to replace unsuitable (bad track and cloudy) images from the relevant periods, respectively. All images were obtained from May to October to represent the growing season for vegetation in the study area (Table 1). ENVI5.5 software was used for radiometric calibration and for the FLASSH atmospheric correction of remote sensing images, and images with different simultaneous phases were registered until the root-mean-square error of registration was less than 0.5 pixels. Finally, the images were mosaiced and cut (Figure 2).
Moreover, the 30 m resolution digital elevation model (DEM) data (http://www.gscloud.cn/home, accessed on 7 June 2023), climate products (https://www.geodata.cn/, accessed on 20 March 2023), and meteorological data (http://www.nmic.cn/, accessed on 20 March 2023) were collected as basic data to calculate the potential NDVI. The actual NDVI was extracted based on Landsat image data in the vegetation growth season, and the annual NDVI data set was obtained using the maximum synthesis method.

2.2.2. Fractional Vegetation Cover

Fractional vegetation cover (FVC), the ratio of the area of vegetation (including branches, stems, and leaves) vertically projected on the ground to the whole statistical area, is an important index for the extraction of aeolian desertification information. The pixel binary model is one of the important methods for estimating vegetation coverage using remote sensing images, and its advantages of being simple, fast and an effective inversion strategy lead to it being widely used. In the process of classification, the first step is dividing the area into a vegetation region and a non-vegetation region based on the FVC [6]. The method is expressed as follows:
F V C = ( N D V I N D V I s o i l ) / ( N D V I v e g N D V I s o i l )
where NDVI is the normalized difference vegetation index, NDVIsoil is the NDVI of bare soil areas, and NDVIveg is the NDVI of the total vegetation pixel.

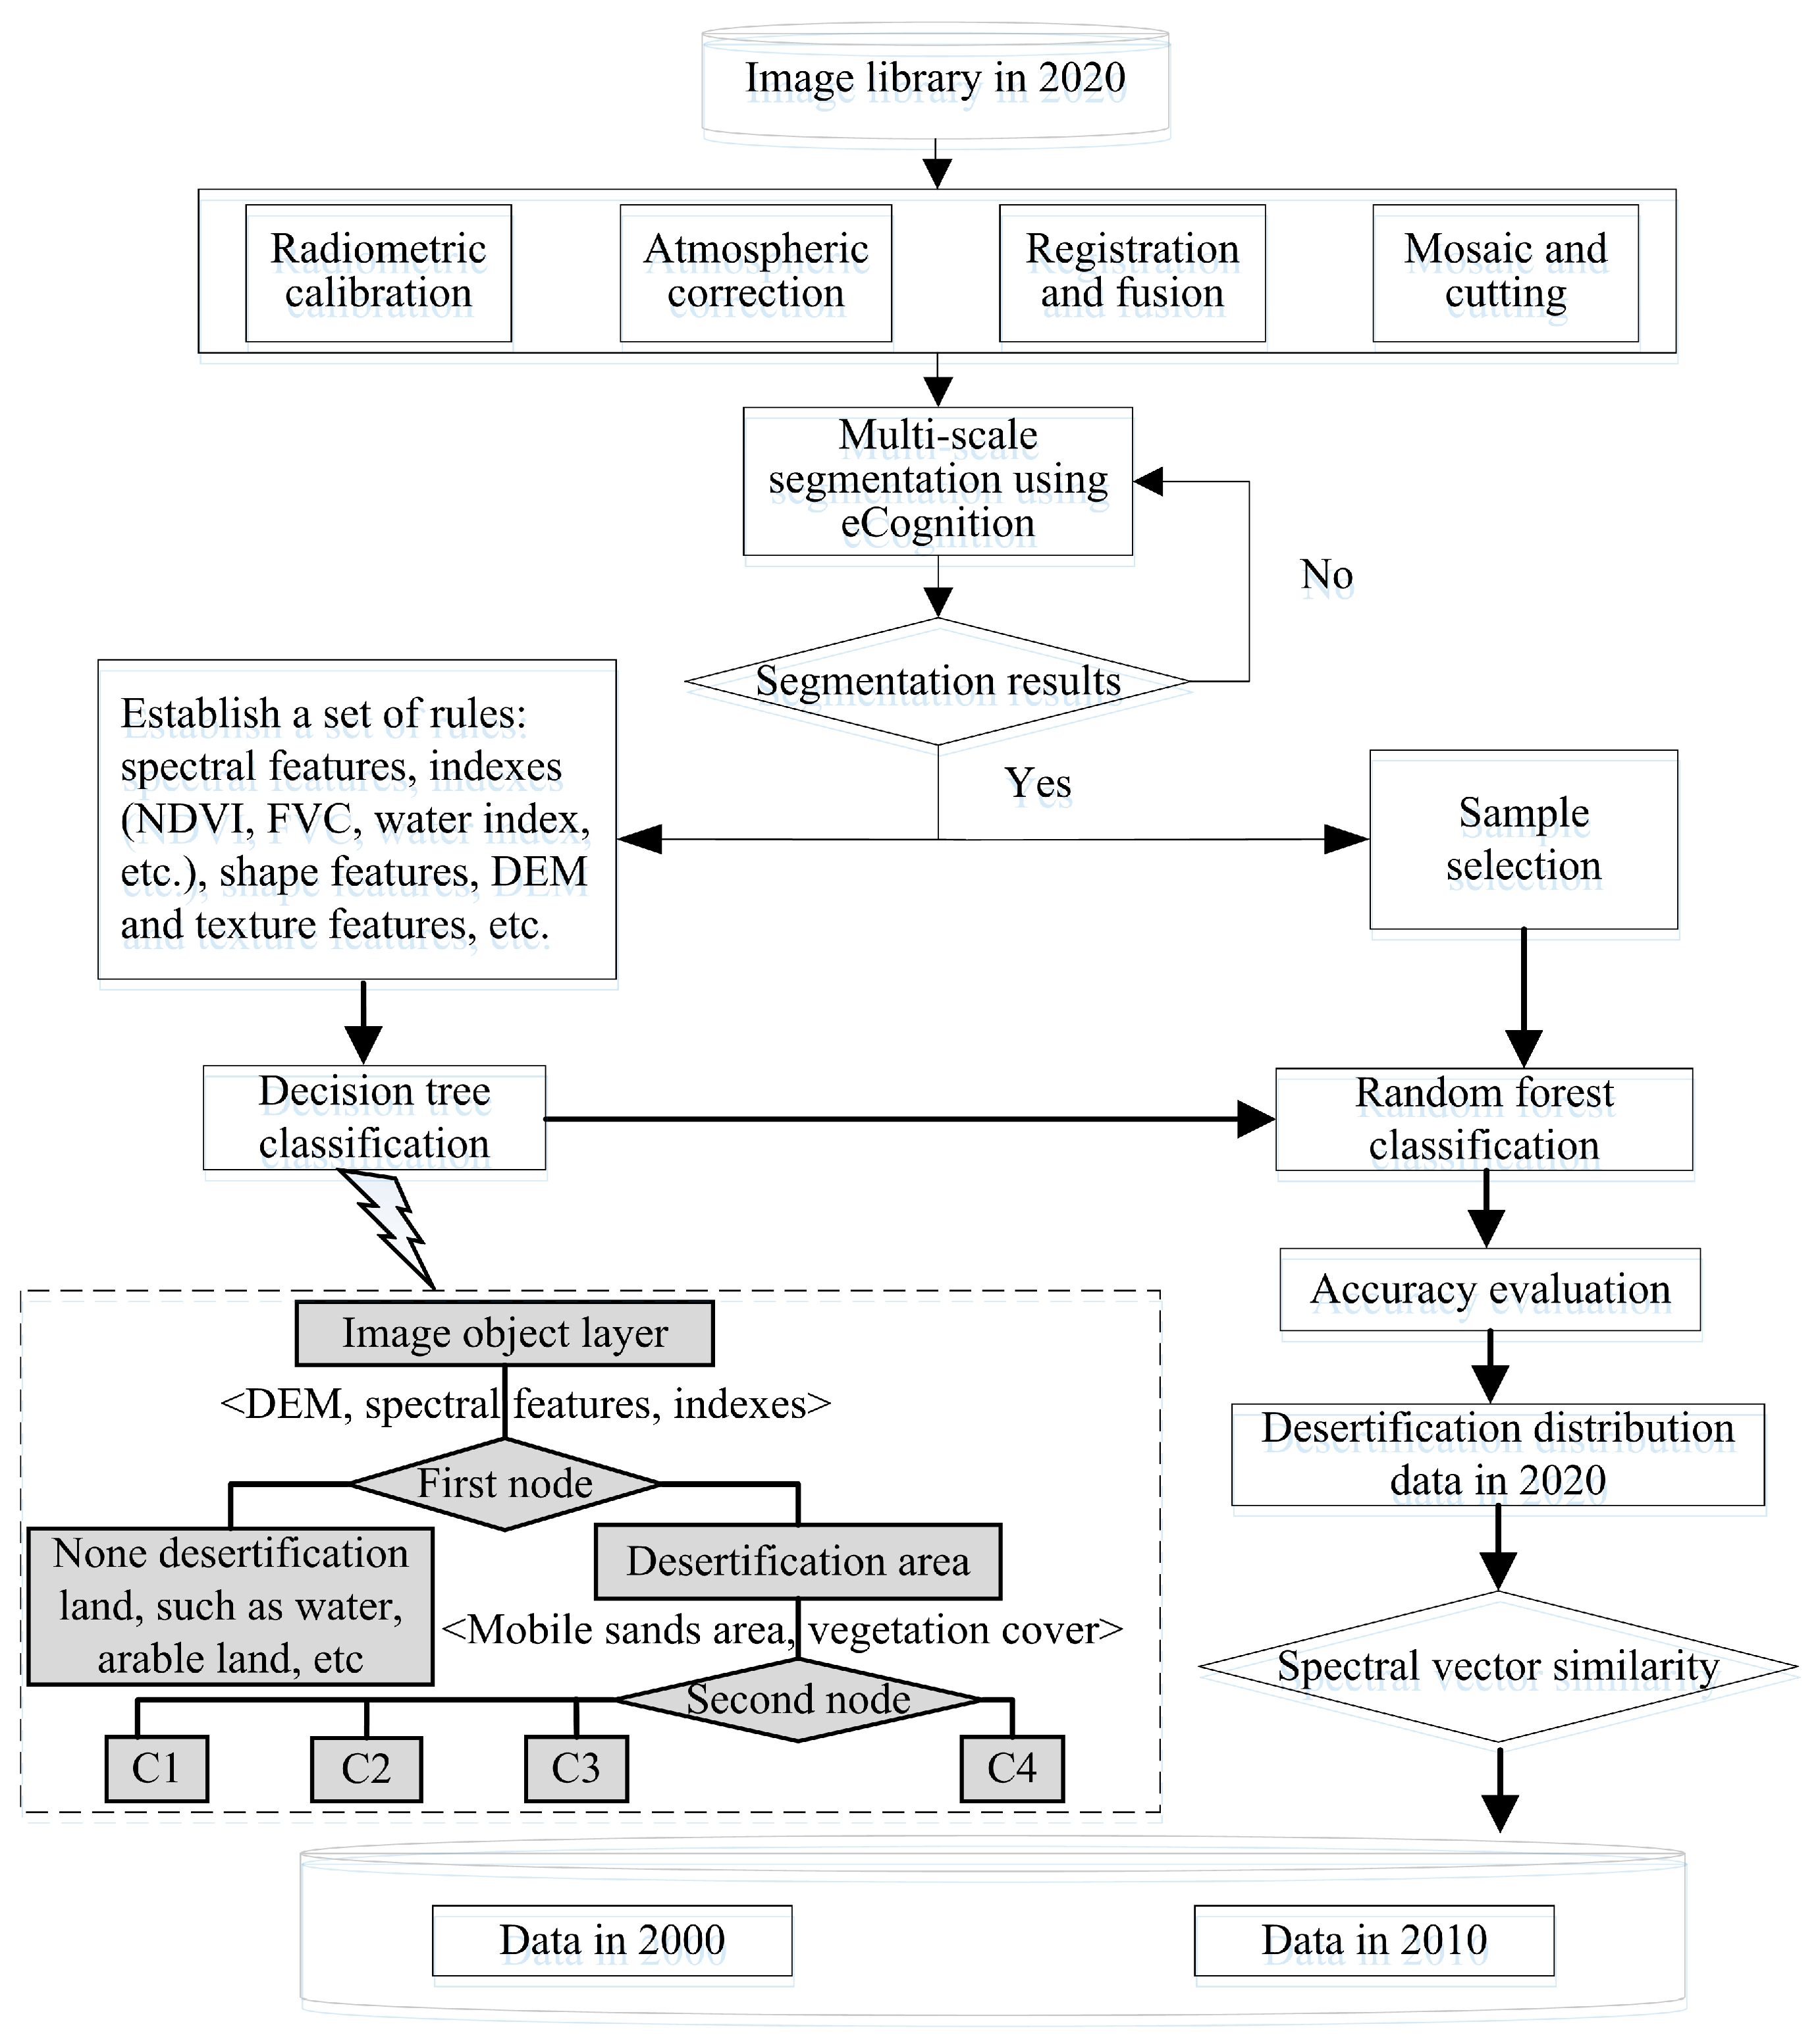
2.2.3. Classification of Aeolian Desertification

Based on the classification system of aeolian desertification in northern China [3], there are four types depending on the vegetation coverage and landscape indicators, including slight, moderate, severe, and serious aeolian desertification (Table 2).
In contrast to the traditional visual interpretation method, which relies on the subjective visual estimation of the proportion of shifting dunes, this study uses eCognition 8.6 software to calculate the entropy of the object and combines the near-infrared spectral eigenvalue (VNIR) to determine the proportion of shifting dunes. In general, the threshold is set as follows: serious, VNIR > 90.5 and 1.035 < Entropy < 1.425; severe, 88.5 < VNIR ≤ 90.5 and 1.425 ≤ Entropy < 1.6; moderate, 81.2 < VNIR ≤ 88.5 and 1.6 ≤ Entropy < 2.05; slight, VNIR ≤ 81.2 and 1.4 ≤ Entropy < 1.7. Because of the relatively homogeneity of the underlying surface in the serious desertification areas, the entropy is low.
Based on multi-parameter indicators, this study adopts the classification and regression tree (CART) decision tree classification method to extract desertification information [31,32], and it verifies the extraction results and optimization parameters by using field investigation data until the accuracy meets the evaluation criteria. The detailed process is shown in Figure 2. Firstly, the image is divided into objects of different sizes in eCognition, and the bands used for segmentation are the near-infrared band, red band, and green band of the image. As different types of land cover have different dependence and stability on the spatial scale, each type has its optimal observation distance and scale; therefore, multi-scale segmentation is adopted for the local optimization. Secondly we perform a decision tree classification, as shown in the dotted wireframe diagram in Figure 2. The rule set of the decision tree is used to classify according to nodes in turns, and multiple indicators are used to set thresholds when establishing rules. Based on the decision tree classification results, the random forest classifier is used to select and remove the confusion spots between C1, C2, C3, and C4 with reference to the selected sample. After obtaining the data in the baseline period T1 (2020), the change detection method based on the spectral vector similarity is used to update the dynamic data in different periods [33]. Remote sensing images in T1 and T2 in the detection period (2000 and 2010) are integrated with the vector map in T1, respectively. In eCognition, the images in the T1 and T2 periods are segmented to obtain image spots, and the reflectance of each band of each image spot in the two-phase images is extracted. The multi-dimensional spectral feature vector of the image spots is formed by each band and is stored in the image spot feature database. The similarity is measured according to the spectral feature vectors of each image spot in the T1 and T2 periods, and if the similarity is lower than the threshold value, it is considered that the image spot has changed. The calculation formula of vector similarity is as follows:
S x y = ( cos θ ) / ( R x y 1 + 1 )
cos θ = ( x i × y i ) / ( x i 2 × y i 2 )
R x y = ( x ) / ( y ) = ( x i 2 ) / ( y i 2 )
where Sxy is vector similarity; and θ is the angle between the feature vectors x and y in the T1 and T2 periods. Rxy is the norm ratio of the vectors x and y.
Using the field verification points and high-resolution image interpretation data of random sampling points, a total of 268 sample points were used to calculate the Kappa coefficient of desertification information extraction results as 0.87; the total classification accuracy reached 89.54%.

2.2.4. Barycenter Migration Model

The barycenter migration model was used to calculate the barycenter of the distribution of different degrees of desertification land, and the change trend and spatial change characteristics were described using the direction and distance of their barycenter migration. The barycentric coordinates of a certain degree of desertification land in year t are calculated as follows [32]:
X t = i = 1 n ( C t i × X t i ) / i = 1 n C t i
Y t = i = 1 n ( C t i × Y t i ) / i = 1 n C t i
where Xt and Yt are the longitude and latitude coordinates of the barycenter of certain desertification types in year t, respectively; n is the number of patches of this desertification type in year t; Cti is the area of patch i of the desertification type in the year t. Xti and Yti are the longitude and latitude coordinates of the geometric center of patch i of the desertification type in year t.

2.2.5. Residual Analysis

The effects of climate change and human activities on the desertification process were separated and recombined using the multiple regression residual analysis method, and their contributions were then determined [31]. The steps of multiple regression residual analysis are mainly as follows: (1) based on the annual NDVI and time series data of temperature and precipitation, a binary linear regression model is established, with NDVI as dependent variable and temperature and precipitation as independent variables, respectively, and all parameters in the model are calculated; (2) based on the temperature and precipitation data and regression model, the predicted value of NDVI is calculated to represent the influence of climate factors on the NDVI; and (3) the difference between the observed and predicted NDVI values, namely the NDVI residual, is calculated to represent the impact of human activities on the vegetation NDVI.
N D V I C C = a × P + b × T + c
N D V I H A = N D V I o b s N D V I C C
where NDVICC and NDVIobs refer to the predicted NDVI value based on the regression model and the observed NDVI value based on the remote sensing image, respectively. a, b, and c are model parameters; T and P refer to the average annual temperature and annual precipitation in °C and mm, respectively. NDVIHA is a residual.
However, due to the presence of non-zonal vegetation in the Ejin Banner and Alxa Right Banner such as riparian forests and lakeside vegetation, which are not entirely determined by climate but are mainly influenced by factors such as groundwater and runoff, the relationship between observed NDVI and climate in Alxa Left Banner was first constructed, and the relationship was extended to the Ejin Banner and Alxa Right Banner to obtain the regional predicted NDVI. Secondly, the predicted NDVI was subtracted from the observed NDVI in 2000, and the result was taken as the background NDVI as affected by regional non-zonal factors. Then, the background NDVI was subtracted from the observed NDVI in the Ejin Banner and Alxa Right Banner in each year, which was taken as the newly obtained actual NDVI without the influence of non-zonal factors. Lastly, the predicted NDVI calculated based on climate was subtracted from the newly obtained actual NDVI to obtain the NDVI influenced by human activities.
The slope trend analysis method was used to determine the driving factors of the NDVI change, and the linear trend rates of actual NDVI, predicted NDVI, and residual NDVI were calculated, representing the NDVI change trends under the influence of real land surface, climate change, and human activities, respectively.
S l o p e = ( n i = 1 n i N D V I i i = 1 n i i = 1 n N D V I i ) / ( n i = 1 n i 2 i = 1 n i 2 )
The F-test method was used to further analyze the significance of the NDVI changing trend.
F = n 2 × r 2 / ( 1 r 2 )
r = ( i = 1 n i i ¯ ( N D V I i N D V I ¯ ) ) / i = 1 n i i ¯ 2 i = 1 n N D V I i N D V I ¯ 2
where n is the length of time series 21; i is the year sequence number ranging 1 to 21 for the period of 2000–2020; i ¯ is the average value of the year sequence number; NDVIi is the NDVI value of year i; N D V I ¯ is the mean value of the NDVI during the period of 2000–2020.
If the actual NDVI, predicted NDVI, and residual NDVI meet significance (p < 0.1) after testing, the effects of climate change and human activities on the desertification process are distinguished based on their linear trend rates (Table 3).
The dynamic of desertification is the changes in desertification land over certain periods. It mainly includes desertification development and desertification reversal, and it is classified into four categories based on the characteristics of desertification land changes, including appeared desertification land, disappeared desertification land, more severe degree of desertification land, and lighter degree of desertification land (Table 3).

3. Results

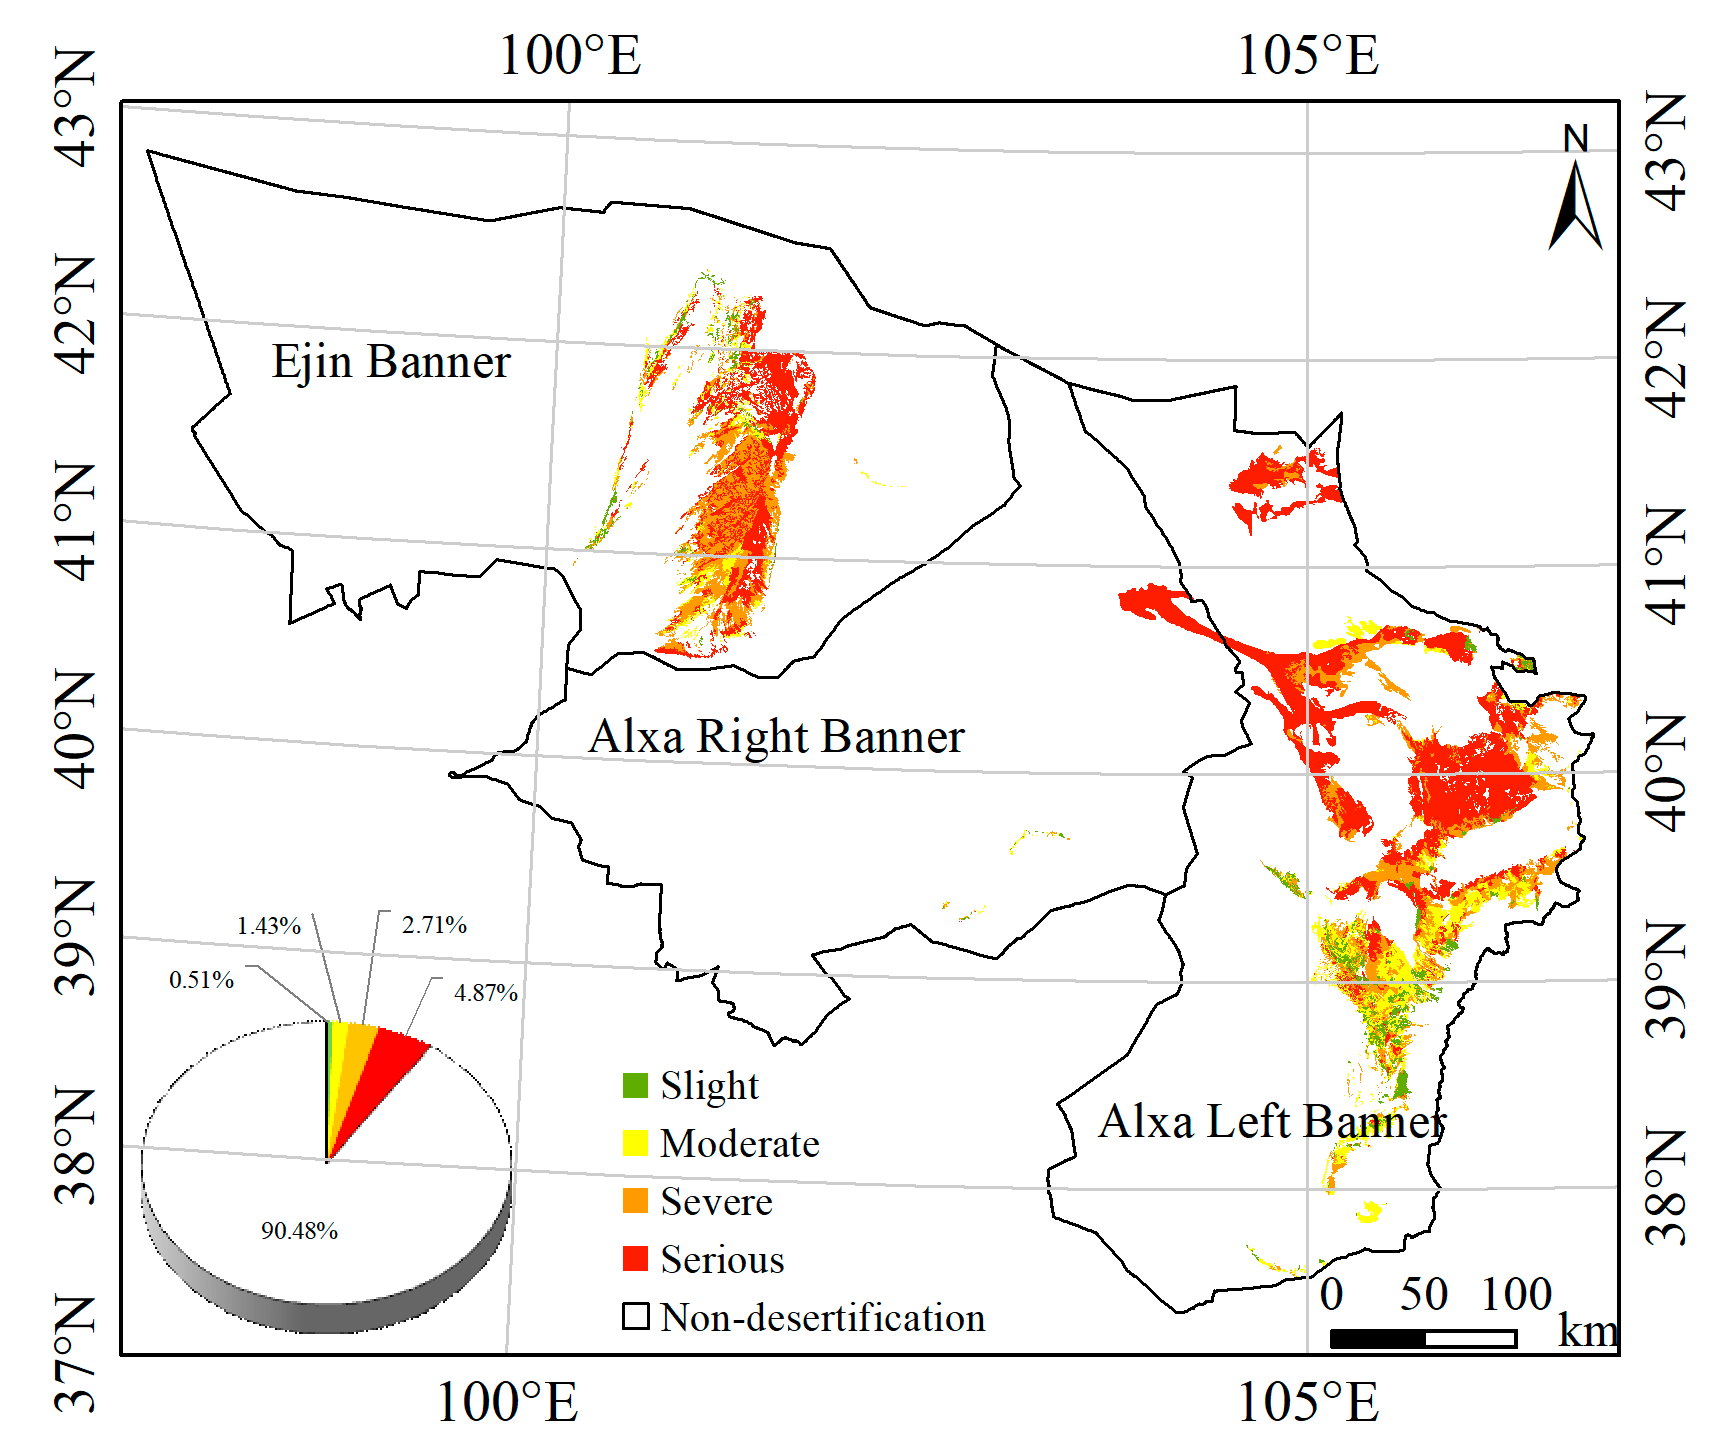
3.1. Characteristics of Desertification Land Transfer

The spatial distribution pattern of desertification in 2020 in Alxa League is shown in Figure 3. The proportion of non-desertification land reached 90.5%, while the desertification land reached about 9.5%, which was mainly located at the Alxa Left Banner and Ejin Banner. Among the desertification land, the serious desertification land was the most prevalent and spanned up to 4.9%, which was distributed in all three banners. The slight, moderate, and severe desertification land accounted for 0.5%, 1.4%, and 2.7%, respectively, and was staggered. They were mainly located at the Alxa Left Banner and Ejin Banner. Thus, the desertification problem in the Ejina Banner and Alxa Left Banner in Alxa League were more serious than in the Alxa Right Banner in 2020.
The desertification land in Alxa League showed a reversing trend in the area and degree during the period ranging from 2000 to 2020 (Figure 4). Desertification development and reversal were mainly concentrated along the Heihe River in the Ejin Banner, the low-lying areas in the west of Badain Jaran Desert, the foothills on the west slope of Helan Mountain in Alxa Left Banner, and the north of the Alxa Left Banner. From 2000 to 2020, the desertification land decreased by 585.9 km2. In addition, 18.1% of the serious desertification land turned into severe desertification land, moderate desertification land, and non-desertification land, and the conversion area reached 1793.9 km2, 395.2 km2, and 275.1 km2, respectively. Meanwhile, there were local phenomena of desertification development, including appeared desertification land and increasing desertification degree, mainly including the moderate to severe type (373.6 km2) and severe to serious type (213.6 km2).
From 2000 to 2010, the area of the developed and reversed desertification land was 886.9 km2 and 2902.6 km2, respectively, which changed into 74.2 km2 and 1486.9 km2 in the period of 2010–2020. In the whole period of 2000–2020, the area of the developed and reversed desertification land was 889.9 km2 and 4211.9 km2, respectively. Desertification was reversed in both stages with the first stage being more obvious, while desertification development occurred in the first stage but hardly appeared in the second stage.

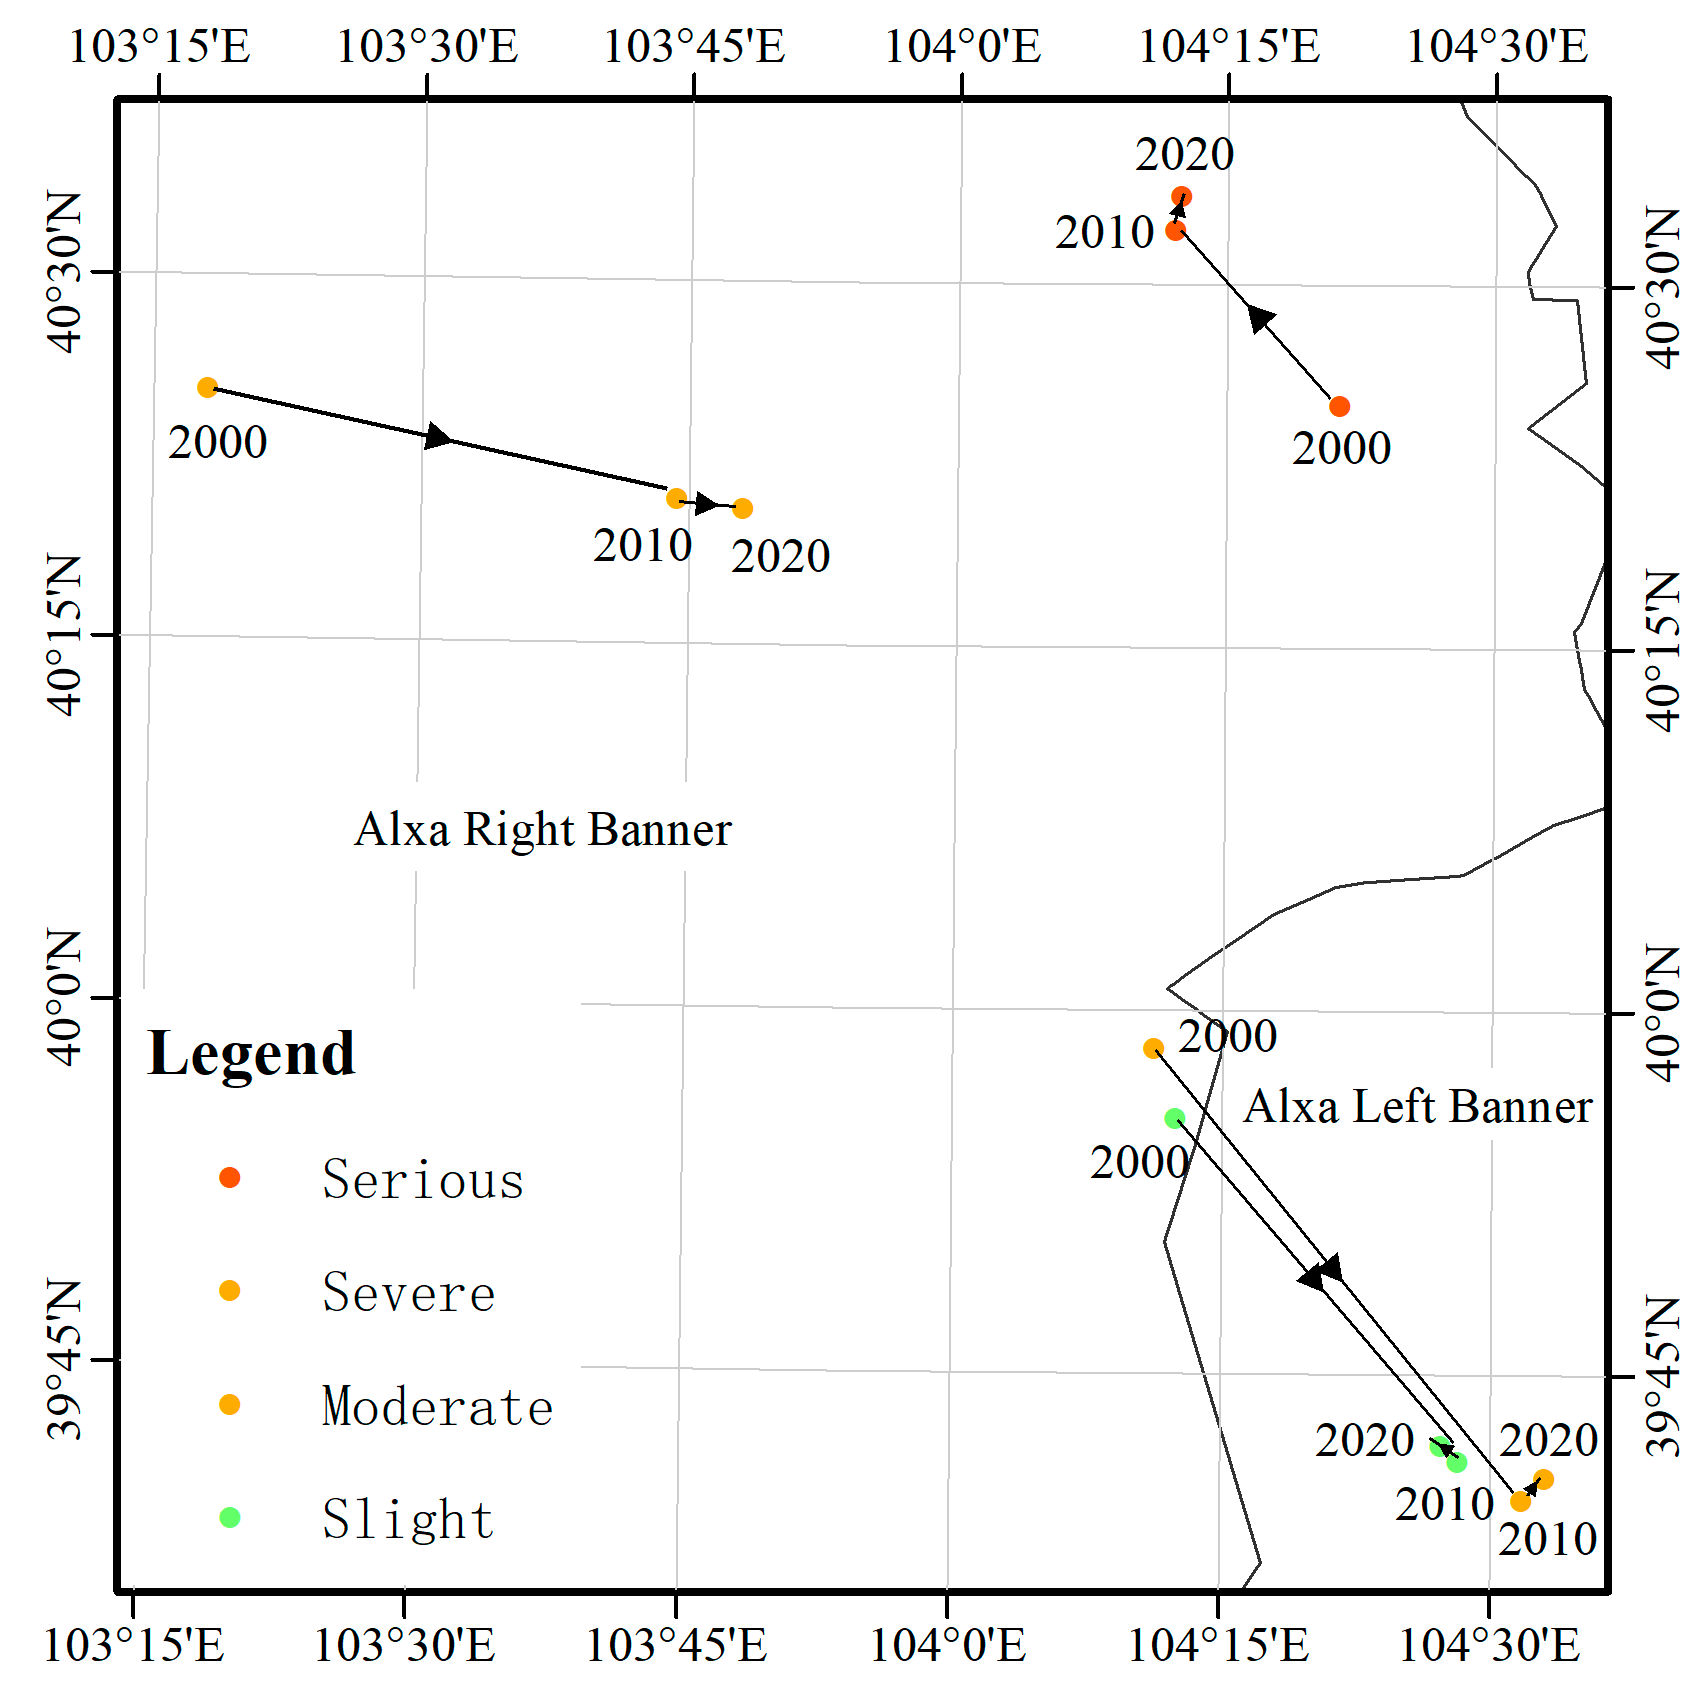
3.2. Migration of Barycenter of Desertification Land

The barycenter of different types of desertification land were mainly located at the middle junction of the Alxa Right Banner and Alxa Left Banner (Figure 5). The barycenter of the slight and moderate desertification land was mainly located in the southeast corner; the barycenter of the severe desertification land was located in the northwest, while the barycenter of the serious desertification land was mainly located in the north. Overall, the desertification degree in the northern part of Alxa League was more serious than that of the southern part.
The barycenter of the slight, moderate, and severe desertification land migrated to the southeast in the period of 2000–2010, and the migration of the moderate desertification land was more obvious. The barycenter of the serious desertification land migrated to the northwest in the period of 2000–2010. However, all of them hardly moved from 2010 to 2020.

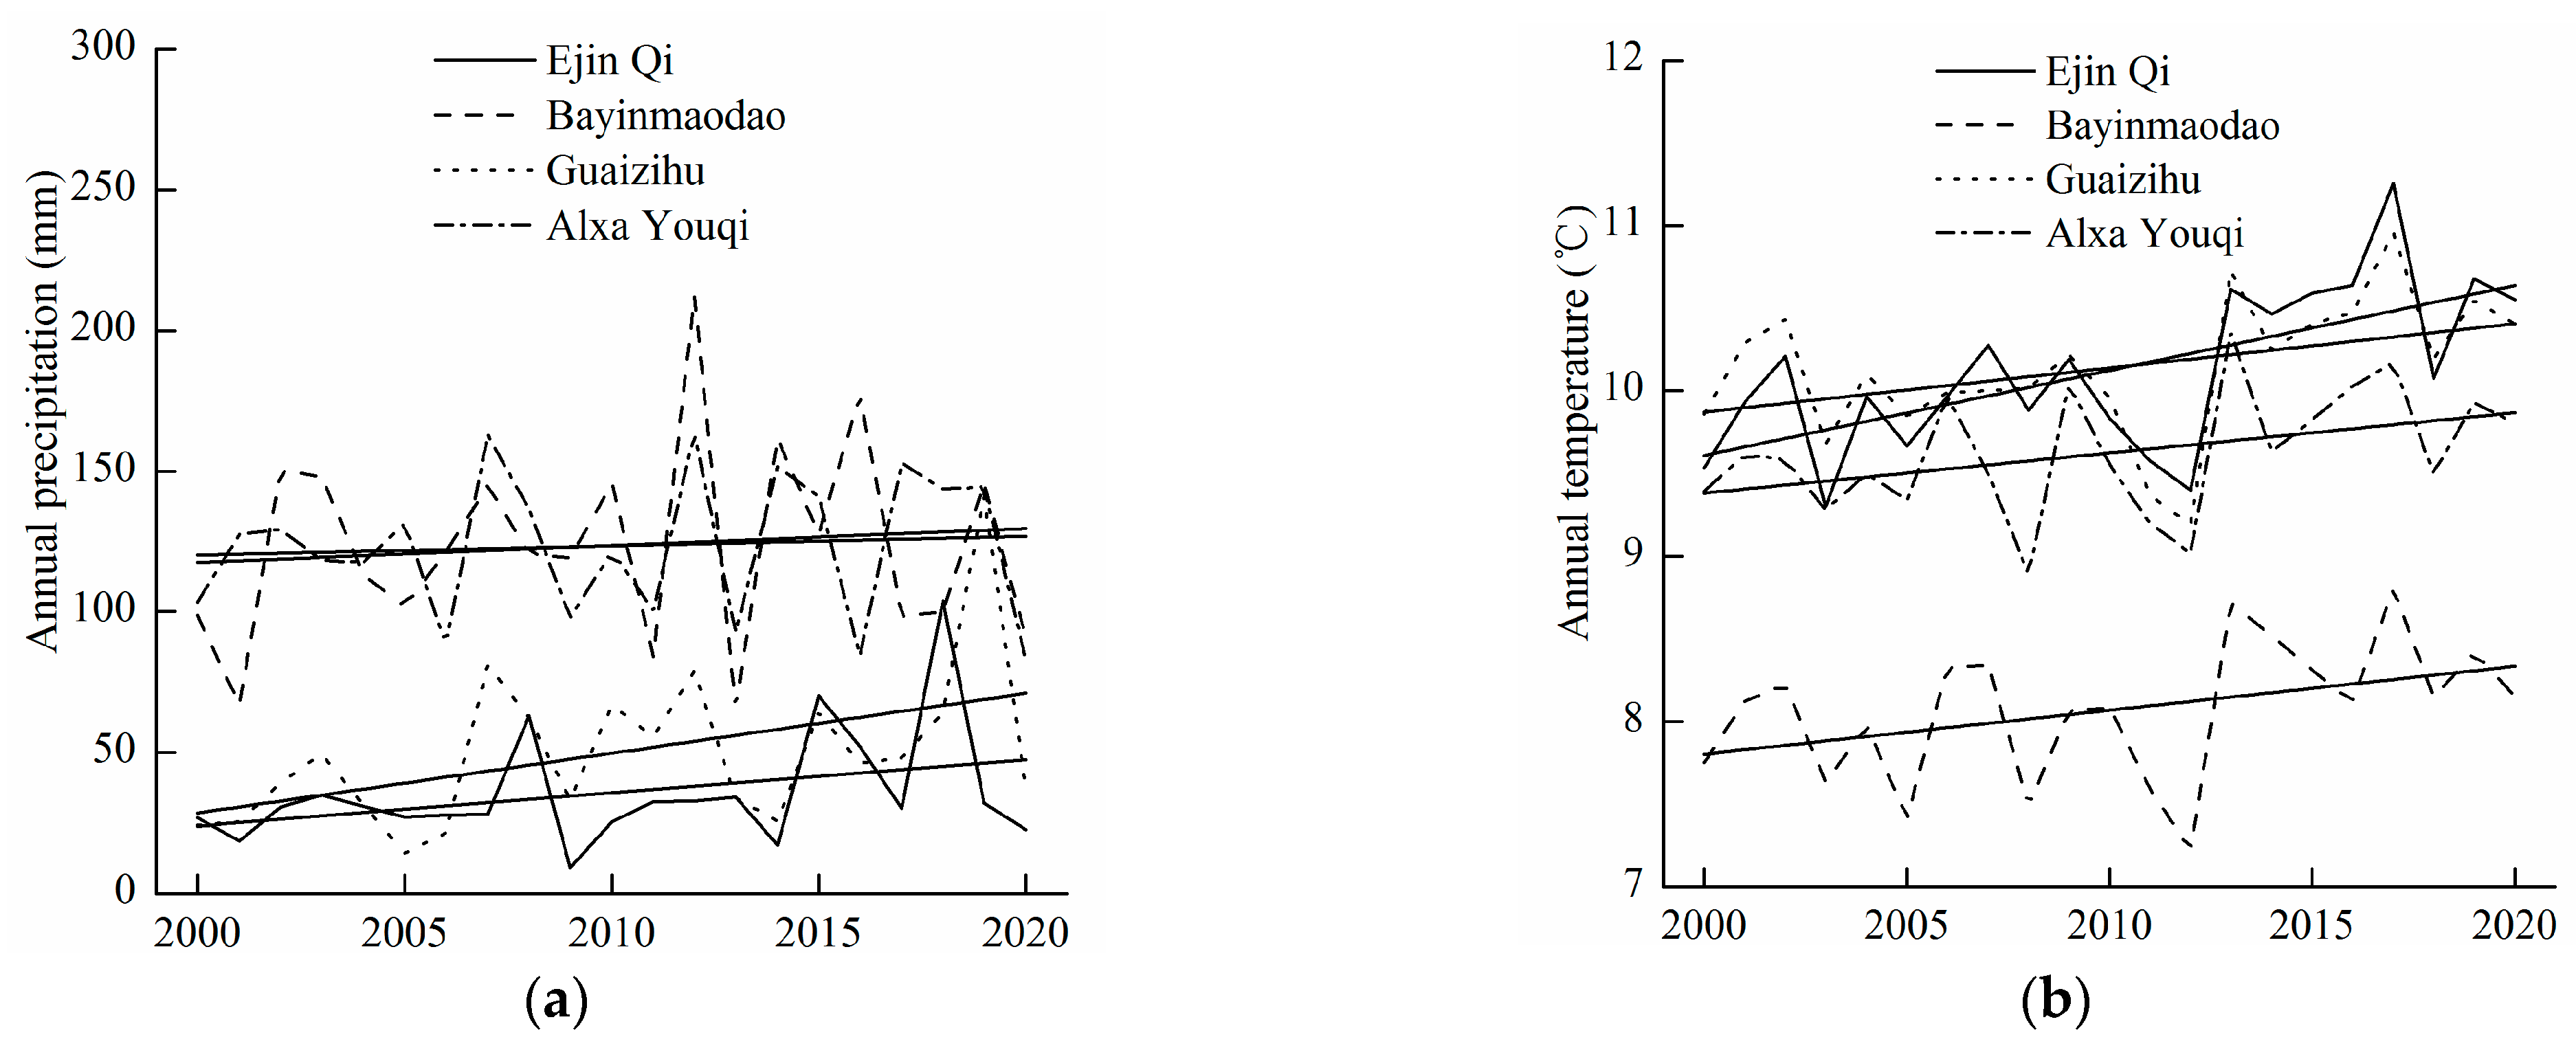
3.3. Impacts of Human Activities and Climate Change on the Evolution of Desertification

From 2000 to 2020, the desertification in Alxa League showed a reversing trend overall, and there was development in some areas. In the desertification reversal in Alxa League, 61.5% was caused by the combination of human activities and climate change and was mainly distributed in the Alxa Left Banner. The human activity-dominated regions were mainly distributed in the Ejin Banner and accounted for 27.9%, while the climate change-dominated regions were distributed in the Alxa Left Banner and accounted for only 10.7% (Figure 6).
In the desertification development in Alxa League, most was caused by human activity, which accounted for 76.8% and was mainly distributed in the north of Alxa Left Banner, while the climate change-dominated regions were distributed in the Ejin Banner and accounted for 22.7% (Figure 6).

4. Discussion

In this study, multiple parameters, such as NDVI, FVC, and DEM, were used to extract desertification information in Alxa League using a CART decision tree classification method, and dynamic data were updated in different periods using the spectral vector similarity change detection method. A total of three periods of desertification land data from 2000 to 2020 were constructed, and the latest desertification process in the region was clarified. Because most of the existing studies were concentrated in the period before 2012 or earlier, this research revealed the latest trend of desertification. In the same research period, the results of this study were basically consistent with previous studies. The desertification appeared as a decreasing trend since 2000 as a whole, and the desertification of Alxa League has been inhibited [25,26]. Moreover, we proposed the background NDVI, which was determined by the non-climatic factor (e.g., groundwater and runoff), and subtracted it from the observed NDVI to estimate the actual vegetation condition of non-zonal vegetation. In the end, the effects of climate change and human activity on the desertification process were successfully quantified.
The formation and development of desertification land in Alxa League has its special environment, which is composed of a special geological environment, climatic factors, and human activities. The special topography and atmospheric circulation factors determine the distribution characteristics of desertification in Alxa League. In the extremely arid region in the Ejin Banner where the rainfall is less than 50 mm, the evaporation capacity that is caused by rising temperature is enhanced, the soil water loss is accelerated, and the soil is dry and loose, which accelerates the process of desertification [25,26]. Therefore, climate drought is one of the main reasons for desertification development in the Ejin Banner. Although the precipitation in the Alxa Left Banner is about 150–200 mm and has had an increasing trend in the past 20 years (Figure 7), the intensification of local human activities such as mining and road building has led to the development of desertification [29].
With the implementation of a series of ecological environmental protection and management projects since 2000, the rapid degradation of the ecological environment in Alxa League has slowed down, and the ecological environment in some areas have tended to improve. In the surrounding areas of Helan Mountain, the project of returning grazing land to forests and returning farmlands to grasslands has been carried out [34]. Moreover, the precipitation in the Alxa Left Banner is in the increasing trend from 2000 to 2020 (Figure 7). The EWDP in the HRB has been carried out since 2000, and the streamflow into the Ejin Banner increased [24]. Meanwhile, ecological environmental protection and management measures, such as returning grazing land to grassland (forest), flying afforestation, and the Ant Forest project, have been undertaken at the edges of the three deserts [35]. Through the above effective ecological management measures and the effect of artificial rainfall enhancement in recent years, the overall desertification area in Alxa League has shown a decreasing trend over the past 20 years [36]. Thus, the combination of human activities and climate change were the determining factors of the desertification reversal in Alxa League.
However, the factors of ecological environment deterioration still exist in Alxa League. On the one hand, drought, sand, rodents, insect pests, and other natural factors still threaten the ecological environment of Alxa League. On the other hand, with the rapid economic and social development, the contradiction between ecological environment protection and economic and social development still exists, such as in excessive mining of biological resources, transportation network construction, photovoltaic power generation development, irrational use of water resources, and overgrazing, which still threaten the ecological environment of Alxa League [26,36]. Because the factors of ecological environment deterioration have not been completely eliminated, the desertification area in some areas of Alxa League is still increasing.
However, there were still some uncertainties in the data processing and vegetation state simulation. On the one hand, the uncertainties were caused by the uniform resampling of the different types of data with different resolutions and because of the non-climatic factor in the extreme arid region [13,37]. The fragmentation of habitat is high in Alxa League, and some information with low and different resolutions can be masked over. On the other hand, the vegetation status in arid areas is relatively unstable and is greatly affected by current or previous weather conditions, meaning that the characteristics of local desertification may be inconsistent with the long-term desertification trend, which leads to some uncertainty [38].

5. Conclusions

From 2000 to 2020, the desertification area of Alxa League decreased; the desertification degree decreased, and the desertification showed a reverse trend, with the obvious change occurring from 2000 to 2010. The barycenter of the slight, moderate, severe, and serious desertification was distributed from south to north, and the desertification degree was more serious in the northern part of the region. The barycenter of the slight, moderate, and severe desertification land migrated to the southeast, while the serious desertification land’s barycenter migrated to the northwest in the period of 2000–2010. However, all of them hardly moved from 2010 to 2020, and the reversal of desertification in the south is more obvious. According to the multiple regression residual analysis, the regional desertification reversal in the past 20 years was mainly affected by the combination of human activities and climate change, and the area accounted for 61.5% of the total reversal. The desertification development was mainly affected by human activities, whose area accounted for 76.8% of the total desertification development area.

Author Contributions

Conceptualization, J.X., S.X. and Z.L.; methodology, J.X.; formal analysis, J.X. and Z.L.; investigation, J.X.; resources, J.X. and Z.L.; data curation, J.X.; writing—original draft preparation, J.X. and Z.L.; writing—review and editing, J.X., Z.L. and C.Y.; visualization, J.X.; supervision, J.X. and S.X.; project administration, J.X. and Z.L.; funding acquisition, S.X. and Z.L. All authors have read and agreed to the published version of the manuscript.

Funding

This research was funded by the Inner Mongolia Special Fund for the Transformation of Scientific and Technological Achievements (2021CG0046); Alxa League Science and Technology Program (AMYY 2021-19); Longyuan Youth Innovation and Entrepreneurship Talent Project (E2390401); Natural Science Foundation of Gansu Province (21JR7RA046); “Light of West China” Program of CAS (23JR6KA008).

Institutional Review Board Statement

Not applicable.

Informed Consent Statement

Not applicable.

Data Availability Statement

The source of relevant data acquisition has been described in the text.

Conflicts of Interest

The authors declare no conflict of interest.

References

  1. Adger, W.N.; Benjaminsen, T.A.; Brown, K.; Svarstad, H. Advancing a Political Ecology of Global Environmental Discourses. Dev. Change 2001, 32, 681–715. [Google Scholar] [CrossRef]
  2. Reynolds, J.F.; Dms, S.; Lambin, E.F.; Turner, B.L.; Mortimore, M.; Batterbury, S.P.J.; Downing, T.E.; Dowlatabadi, H.; Fernandez, R.J.; Herrick, J.E. Global desertification: Building a science for dryland development. Science 2007, 316, 847–851. [Google Scholar] [PubMed]
  3. Wang, T. Aeolian desertification and its control in Northern China. Int. Soil Water Conserv. Res. 2014, 2, 34–41. [Google Scholar]
  4. UNEP. Development of Guidelines for Assessment and Mapping of Desertification and Degradation in Asia/Pacific; UNEP: Nairobi, Kenya, 1994. [Google Scholar]
  5. Martínez-Graña, A.M.; Goy, J.L.; Zazo, C. Cartographic Procedure for the Analysis of Aeolian Erosion Hazard in Natural Parks (Central System, Spain). Land Degrad. Dev. 2015, 26, 110–117. [Google Scholar] [CrossRef]
  6. Xie, J.; Lu, Z.; Feng, K. Effects of Climate Change and Human Activities on Aeolian Desertification Reversal in Mu Us Sandy Land, China. Sustainability 2022, 14, 1669. [Google Scholar] [CrossRef]
  7. D’Odorico, P.; Bhattachan, A.; Davis, K.F.; Ravi, S.; Runyan, C.W. Global desertification: Drivers and feedbacks. Adv. Water Resour. 2013, 51, 326–344. [Google Scholar]
  8. Xu, D.; Li, C.; Song, X.; Ren, H. The dynamics of desertification in the farming-pastoral region of North China over the past 10 years and their relationship to climate change and human activity. Catena 2014, 123, 11–22. [Google Scholar] [CrossRef]
  9. Li, N.; Yan, C.; Xie, J. Remote sensing monitoring recent rapid increase of coal mining activity of an important energy base in northern China, a case study of Mu Us Sandy Land. Resour. Conserv. Recycl. 2015, 94, 129–135. [Google Scholar] [CrossRef]
  10. Wang, X.; Hua, T.; Lang, L.; Ma, W. Spatial differences of aeolian desertification responses to climate in arid Asia. Glob. Planet Change 2017, 148, 22–28. [Google Scholar]
  11. Paudel, K.P.; Andersen, P. Assessing rangeland degradation using multi temporal satellite images and grazing pressure surface model in Upper Mustang, Trans Himalaya, Nepal. Remote Sens. Environ. 2010, 114, 1845–1855. [Google Scholar] [CrossRef]
  12. Zhang, Z.; Huisingh, D. Combating desertification in China: Monitoring, control, management and revegetation. J. Clean. Prod. 2018, 182, 765–775. [Google Scholar] [CrossRef]
  13. Xu, D.; Kang, X.; Zhili, L.; Zhuang, D.; Pan, J. Assessing the relative role of climate change and human activities in sandy desertification of Ordos region. China Sci. China Ser. D Earth Sci. 2009, 39, 516–528. [Google Scholar]
  14. Zhou, W.; Gang, C.; Zhou, F.; Li, J.; Dong, X.; Zhao, C. Quantitative assessment of the individual contribution of climate and human factors to desertification in northwest China using net primary productivity as an indicator. Ecol. Indic. 2015, 48, 560–569. [Google Scholar]
  15. Xu, D.; Song, A.; Tong, H.; Ren, H.; Hu, Y.; Shao, Q. A spatial system dynamic model for regional desertification simulation—A case study of Ordos, China. Environ. Model. Softw. 2016, 83, 179–192. [Google Scholar]
  16. Li, Q.; Zhang, C.; Shen, Y.; Jia, W.; Li, J. Quantitative assessment of the relative roles of climate change and human activities in desertification processes on the Qinghai-Tibet Plateau based on net primary productivity. Catena 2016, 147, 789–796. [Google Scholar]
  17. Xu, D.Y.; Kang, X.W.; Zhuang, D.F.; Pan, J.J. Multi-scale quantitative assessment of the relative roles of climate change and human activities in desertification—A case study of the Ordos Plateau, China. J. Arid Environ. 2010, 74, 498–507. [Google Scholar]
  18. Wessels, K.J.; Prince, S.D.; Frost, P.E.; Van Zyl, D. Assessing the effects of human-induced land degradation in the former homelands of northern South Africa with a 1 km AVHRR NDVI time-series. Remote Sens. Environ. 2004, 91, 47–67. [Google Scholar]
  19. Zhai, X.; Yan, C.; Xing, X.; Jia, H.; Wei, X.; Feng, K. Spatial-temporal changes and driving forces of aeolian desertification of grassland in the Sanjiangyuan region from 1975 to 2015 based on the analysis of Landsat images. Environ. Monit. Assess. 2020, 193, 2. [Google Scholar] [CrossRef]
  20. Herzschuh, U.; Tarasov, P.; Wünnemann, B.; Hartmann, K. Holocene vegetation and climate of the Alashan Plateau, NW China, reconstructed from pollen data. Palaeogeogr. Palaeoclimatol. Palaeoecol. 2004, 211, 1–17. [Google Scholar] [CrossRef]
  21. Feng, Q.; Tian, Y.; Yu, T.; Yin, Z.; Cao, S. Combating desertification through economic development in northwestern China. Land Degrad. Dev. 2019, 30, 910–917. [Google Scholar] [CrossRef]
  22. Liu, Q.; Liu, G.; Huang, C.; Li, H. Remote Sensing Monitoring of Surface Characteristics in the Badain Jaran, Tengger, and Ulan Buh Deserts of China. Chin. Geogr. Sci. 2019, 29, 151–165. [Google Scholar] [CrossRef]
  23. Lu, Z.; Feng, Q.; Xiao, S.; Xie, J.; Zou, S.; Yang, Q.; Si, J. The impacts of the ecological water diversion project on the ecology-hydrology-economy nexus in the lower reaches in an inland river basin. Resour. Conserv. Recycl. 2021, 164, 105154. [Google Scholar] [CrossRef]
  24. Lu, Z.; Feng, Q.; Xie, J.; Yin, Z.; Zhu, M.; Xu, M. The reallocation of water and ecosystem service values in arid ecosystems with the implementation of an ecological water diversion project. Appl. Water Sci. 2023, 13, 93. [Google Scholar] [CrossRef]
  25. Zhou, J.; Gu, Y.; Da, L.; Liu, Z. Monitoring of desertification and sandification status and dynamic change with remote sensing for Alashan. J. Arid Land Resour. Environ. 2014, 28, 126–130. [Google Scholar]
  26. He, L.; Ma, W.; Zhao, C. Relative roles of human activities and natural elements in the desertification process in Alxa League. J. Lanzhou Univ. Nat. Sci. 2015, 51, 344–350. [Google Scholar]
  27. He, M.; Tang, L.; Li, C.; Ren, J.; Zhang, L.; Li, X. Dynamics of soil organic carbon and nitrogen and their relations to hydrothermal variability in dryland. J. Environ. Manag. 2022, 319, 115751. [Google Scholar] [CrossRef]
  28. Guan, Q.; Guan, W.; Yang, J.; Zhao, S.; Pan, B.; Wang, L.; Song, N.; Lu, M.; Li, F. Spatial and temporal changes in desertification in the southern region of the Tengger Desert from 1973 to 2009. Theor. Appl. Climatol. 2017, 129, 487–502. [Google Scholar] [CrossRef]
  29. Xie, J.; Lu, Z.; Xiao, S.; Yan, C. Driving Force and Ecosystem Service Values Estimation in the Extreme Arid Region from 1975 to 2015: A Case Study of Alxa League, China. Chin. Geogr. Sci. 2021, 31, 1097–1107. [Google Scholar] [CrossRef]
  30. Hu, X.; Lu, L.; Li, X.; Wang, J.; Lu, X. Ejin oasis land use and vegetation change between 2000 and 2011: The role of the Ecological Water Diversion Project. Energies 2015, 8, 7040–7057. [Google Scholar] [CrossRef]
  31. Duan, H.; Yan, C.; Tsunekawa, A.; Song, X.; Li, S.; Xie, J. Assessing vegetation dynamics in the Three-North Shelter Forest region of China using AVHRR NDVI data. Environ. Earth Sci. 2011, 64, 1011–1020. [Google Scholar]
  32. Wang, Y.; Yue, X.; Xie, J.; Liu, Z.; Ma, Y.; Wang, Y.; Gong, Y. Desertification evolution in the sandy region to the east of the Yellow River in Ningxia from 2000 to 2020. J. Desert Res. 2023, 43, 31–40. [Google Scholar]
  33. Song, X.; Yan, C. Land cover change detection using segment similarity of spectrum vector based on knowledge base. Acta Ecol. Sin. 2014, 34, 7180–7275. [Google Scholar]
  34. Ma, W.; He, L.; Zhao, C. Desertification dynamics in Alxa League over the period of 2000–2012. J. Lanzhou Univ. Nat. Sci. 2015, 51, 55–61. [Google Scholar]
  35. Pan, X.; Gao, Y.; Wang, J. The Inversion Research of Land Desertification in Alxa Banner Based on Normalized Difference Vegetation Index. Chin. J. Soil Sci. 2018, 49, 1024–1033. [Google Scholar]
  36. Xiao, S.; Chen, X.; Ding, A. Study peocess of climate changes, environment evolution and its driving mechansm in the last two centuries in the Alxa desert. J. Desert Res. 2017, 37, 1102–1110. [Google Scholar]
  37. Guo, B.; Liu, Y.; Fan, J.; Lu, M.; Zang, W.; Liu, C.; Wang, B.; Huang, X.; Lai, J.; Wu, H. The salinization process and its response to the combined processes of climate change–human activity in the Yellow River Delta between 1984 and 2022. Catena 2023, 231, 107301. [Google Scholar] [CrossRef]
  38. Guo, B.; Lu, M.; Fan, Y.; Wu, H.; Yang, Y.; Wang, C. A novel remote sensing monitoring index of salinization based on three-dimensional feature space model and its application in the Yellow River Delta of China. Geomat. Nat. Hazards Risk 2023, 14, 95–116. [Google Scholar] [CrossRef]
Figure 1. The study area with monitoring stations.
Remotesensing 15 04867 g001
Figure 2. Flow chart of the desertification information extraction.
Remotesensing 15 04867 g002
Figure 3. Spatial distribution pattern of desertification land in 2020 in Alxa League.
Remotesensing 15 04867 g003
Figure 4. Desertification land transfer matrix in Alxa League from 2000 to 2020.
Remotesensing 15 04867 g004
Figure 5. The migration of barycenters of different types of desertification land in different periods.
Remotesensing 15 04867 g005
Figure 6. Spatial distribution of the relative roles of climate, human activities, and the combination of these two factors on the exacerbation and mitigation of desertification.
Remotesensing 15 04867 g006
Figure 7. The climatic changes from 2000 to 2020 in Alxa League, Inner Mongolia Autonomous Region, China: (a) annual precipitation; (b) annual mean temperature.
Remotesensing 15 04867 g007
Table 1. Details of the remote sensing images in the Alxa League from 2000 to 2020.
Name of DataTimeLine Number
Landsat ETM+2000LE7130032_20010824,        LE7130033_20010824,        LE7130034_20010824,        LE7131031_20000711,
LE7131032_19990725,        LE7131033_19990826,        LE7131034_19990810,        LE7132031_20000920,
LE7132032_20000920,        LE7132033_20000920,        LE7133031_20000709,        LE7133031_20000802,
LE7133032_20000810,        LE7133033_20000810,        LE7134030_20010820,        LE7134031_20010820,
LE7134032_19990730,        LE7135031_20000707,        LE7135032_20000707,        LE7136030_20000628,
LE7136031_20000831
Landsat TM2010LT5130032_20100825,        LT5130033_20100910,        LT5130034_20100910,        LT5131031_20100715,
LT5131032_20100715,        LT5131033_20100715,        LT5131034_20100715,        LT5131034_20090813,
LT5132031_20100722,        LT5132032_20100722,        LT5132033_20100823,        LT5133031_20100814,
LT5133032_20100814,        LT5133033_20100814,        LT5134030_20100821,        LT5134031_20100720,
LT5134032_20100821,        LT5135031_20100727,        LT5135032_20100727,        LT5136030_20100819,
LT5136031_20100819
Landsat OLI2020LC8130032_20200719,        LC8130032_20200820,       LC8130033_20200719,       LC8130033_20200820,
LC8130034_20200820,        LC8131031_20200726,       LC8131032_20200726,       LC8131033_20200710,
LC8131034_20200710,        LC8132031_20200802,       LC8132032_20200818,       LC8132033_20200818,
LC8133031_20200809,        LC8133032_20200825,       LC8133033_20200809,       LC8133033_20200825,
LC8134030_20200731,        LC8134031_20200901,       LC8134032_20200901,       LC8134032_20200731,
LC8135031_20200823,        LC8135031_20200604,       LC8135032_20200823,       LC8135032_20200604,
LC8136030_20200729,        LC8136031_20200729
Table 2. Classification system of aeolian desertification.
Degree of Aeolian DesertificationPercentage of Shifting Dunes (%)Landscape Characteristics
Slight<5There are wind erosion pits on the windward slope of the fixed dune; shifting dunes are distributed in spots; and there are shifting dunes deposits under the shrubbery, and various sand spits are formed. Vegetation coverage: 60–70%
Moderate5–25The land surface is dominated by flake wind erosion; the dune has an obvious distribution of wind erosion slope and sand fall slope; the shrubbery cannot cover the whole sand pile at the stage of leaves; there are shifting dunes in the windward side of the shrub sand pile; and the cultivated land has obvious small pieces of shifting dunes. Vegetation coverage: 30–60%
Severe25–50Sand dunes are in a half-shifting state and a large number of sand pioneers’ plants appear. Vegetation coverage: 10–30%
Serious>50Sand dunes are in a shifting state. Vegetation coverage: <10%
Table 3. Classification system of aeolian desertification dynamic and the evaluation basis for their driving factors.
Desertification DirectionDynamic CategoriesSlope (NDVICC)Slope (NDVIHA)Cause
Desertification development
Slope (NDVIobs) < 0
Appeared aeolian desertification land or more severe degree of aeolian desertification land<0<0Human activities and climate change
>0<0 Human activities
<0>0Climate change
Desertification reversal
Slope (NDVIobs) > 0
Disappeared aeolian desertification land or lighter degree of aeolian desertification land<0>0 Human activities
>0>0Human activities and climate change
>0<0Climate change
Disclaimer/Publisher’s Note: The statements, opinions and data contained in all publications are solely those of the individual author(s) and contributor(s) and not of MDPI and/or the editor(s). MDPI and/or the editor(s) disclaim responsibility for any injury to people or property resulting from any ideas, methods, instructions or products referred to in the content.

