
Mine Subsidence Monitoring Integrating DS-InSAR with UAV Photogrammetry Products: Case Studies on Hebei and Inner Mongolia

Abstract
:
1. Introduction
2. Research Areas and Data Introduction
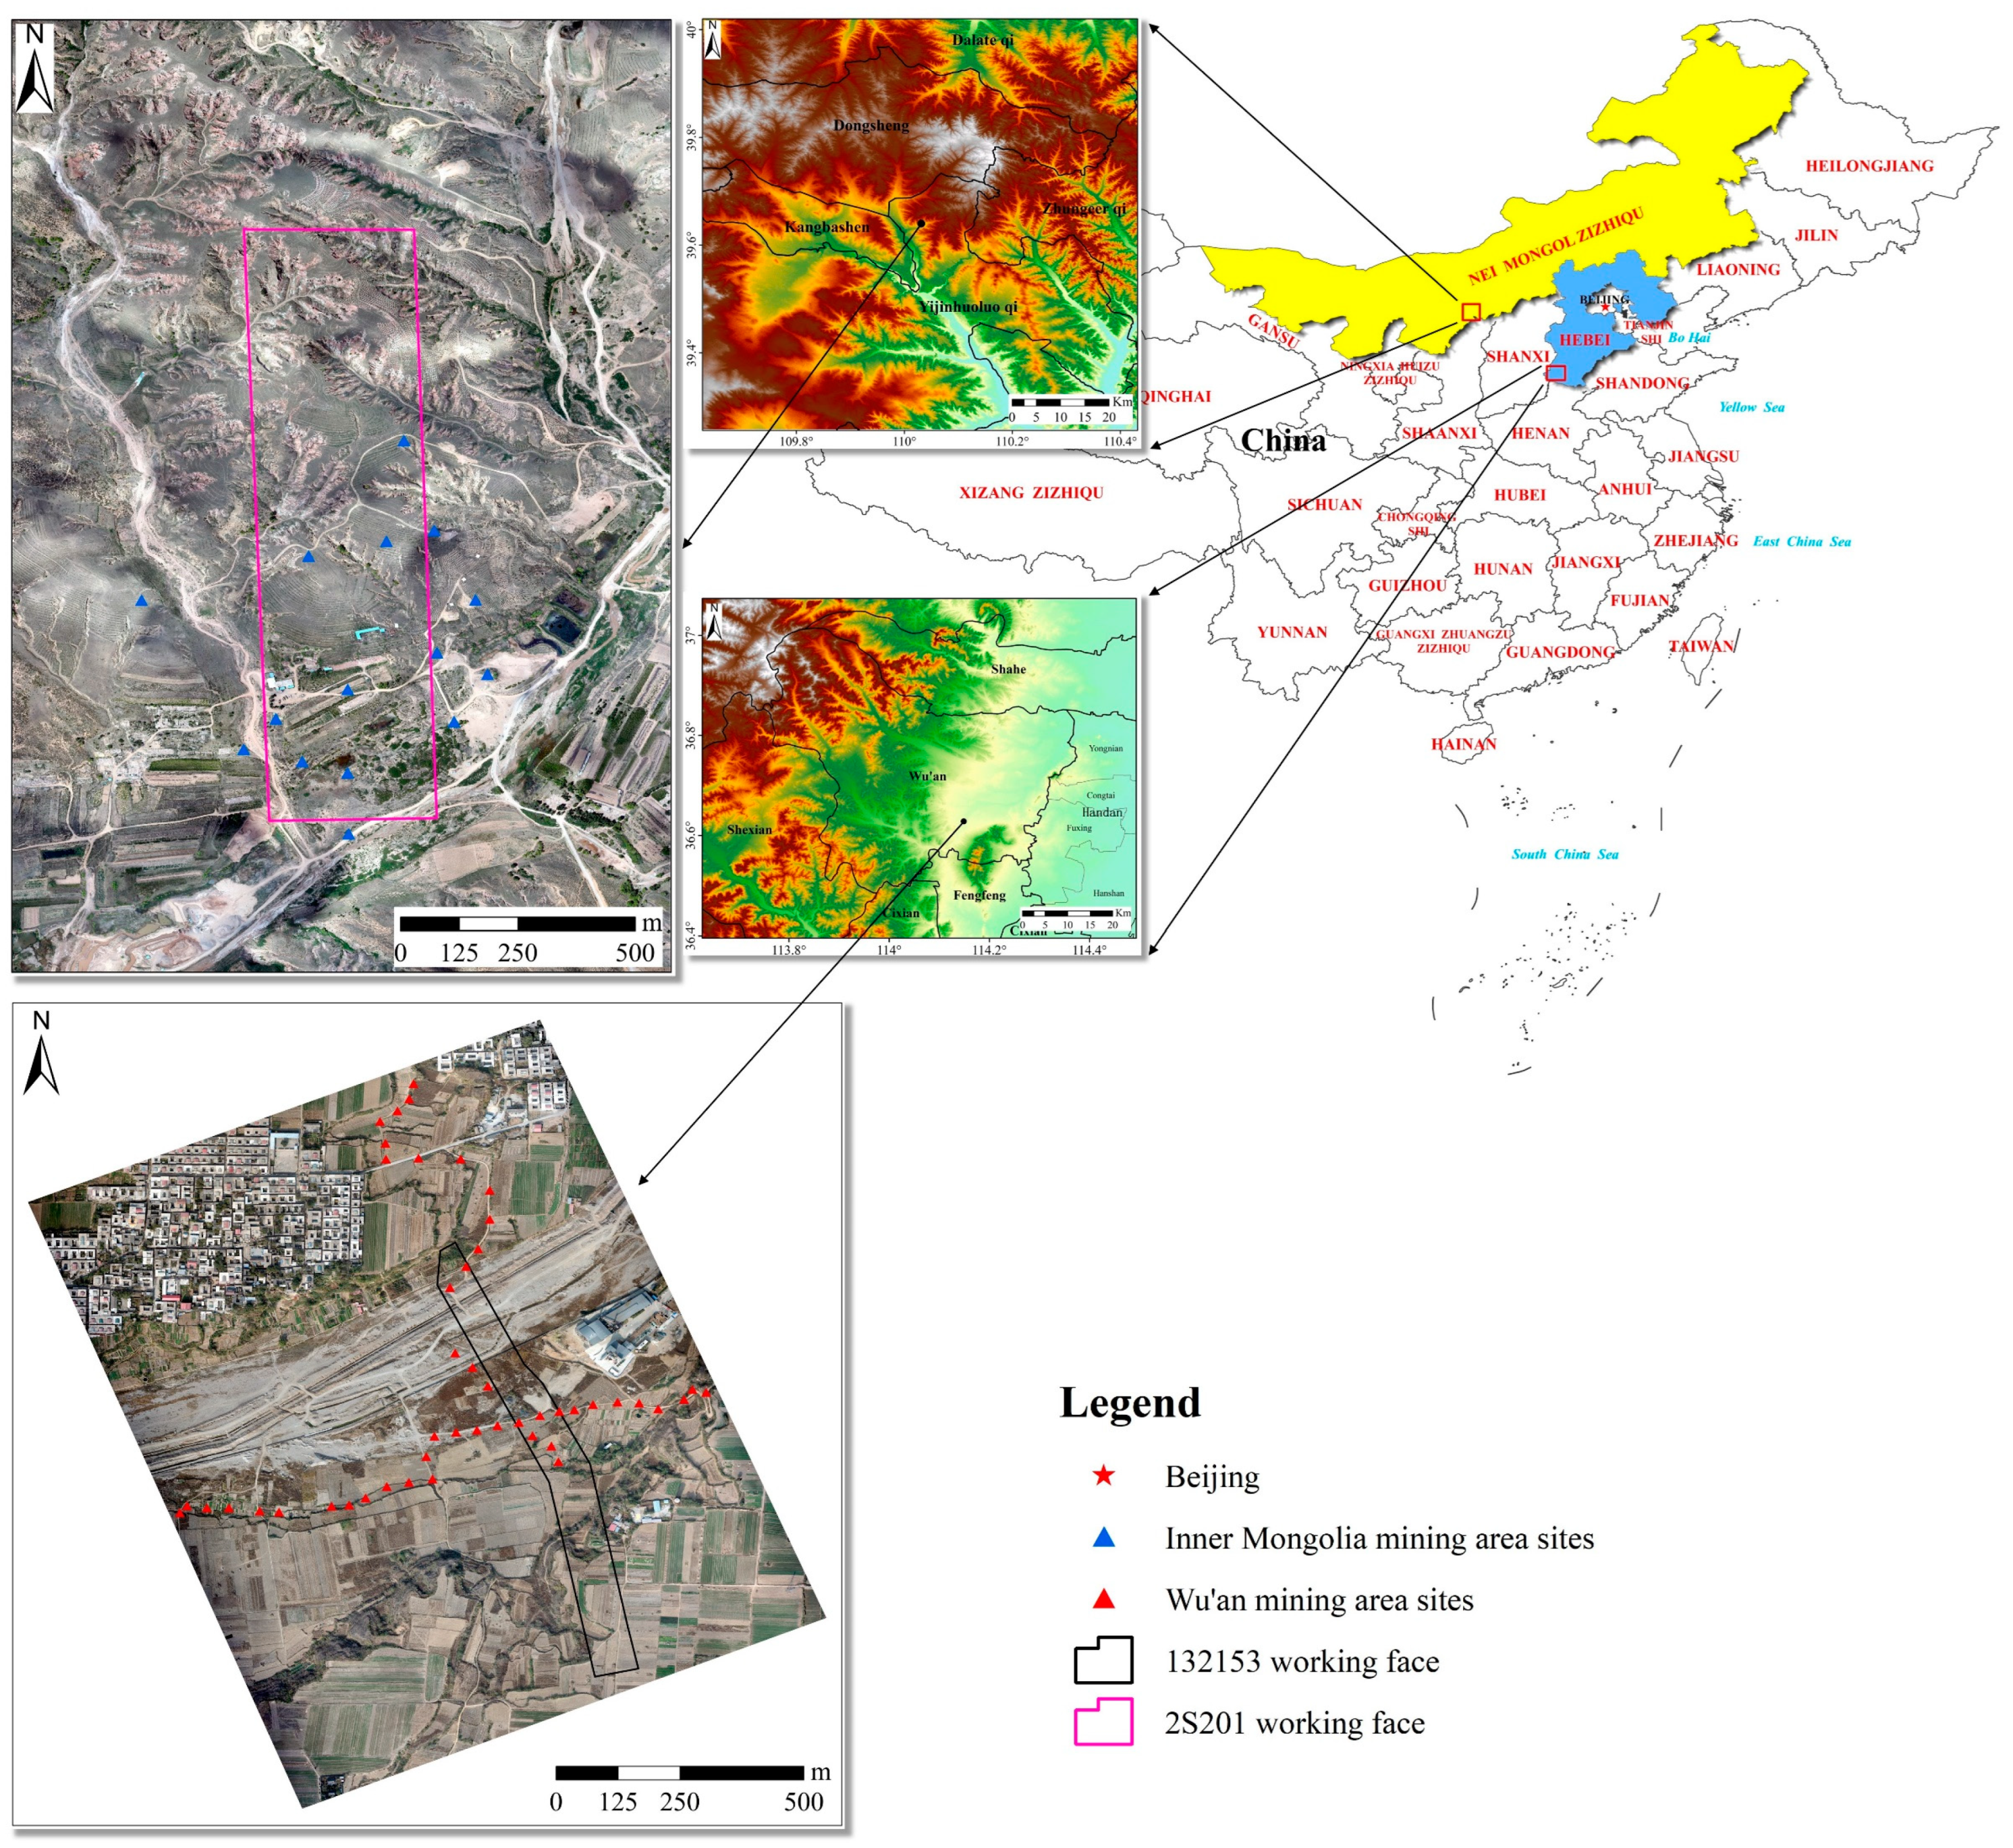
2.1. Overview of Research Areas
2.2. Introduction of Data Set
2.2.1. SAR Data Sets
2.2.2. UAV Photography
2.2.3. Other Data Sets
2.2.4. Related Software and Codes
3. Research Methods
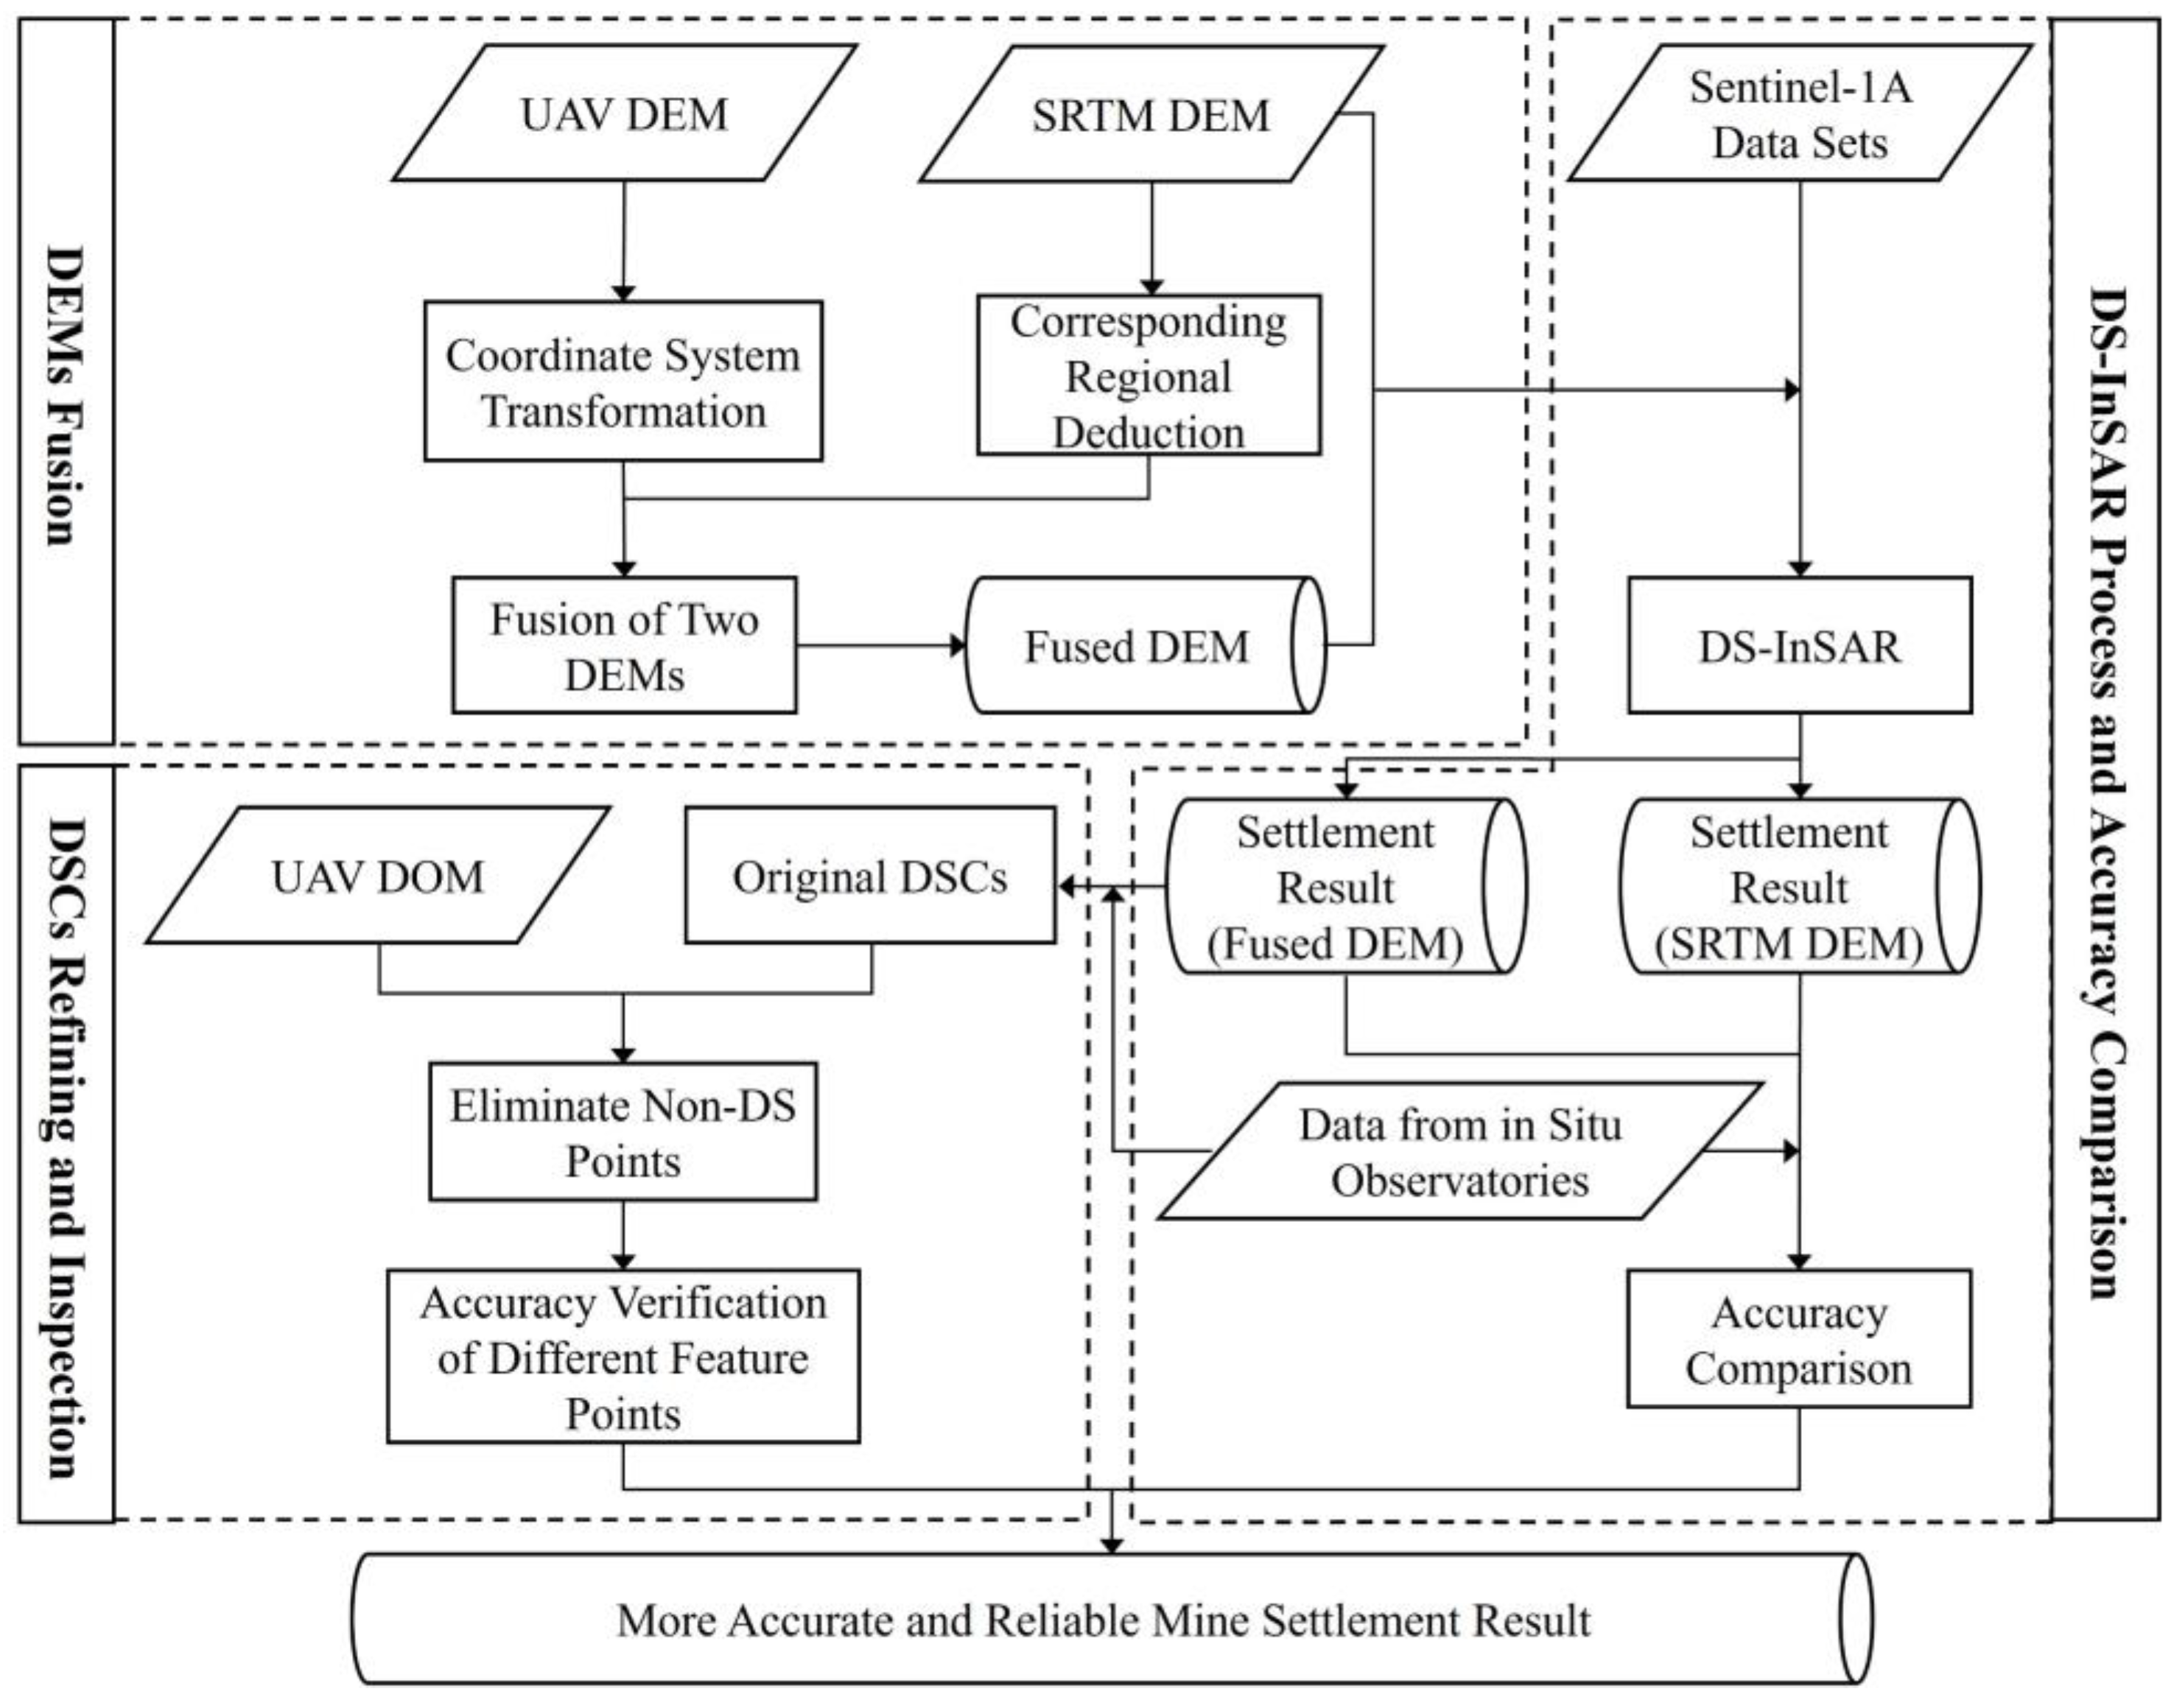
3.1. Generation of InSAR Reference DEM Fused with UAV DEM
3.2. DS-InSAR Integrated with UAV DOM
3.2.1. Selection of DSs
3.2.2. DS-InSAR Principle and Process
3.3. Accuracy Evaluation
4. Results
4.1. The Fused DEM
4.2. DS-InSAR Results Based on Fused DEMs
4.3. Refinement of DSCs
5. Analysis
5.1. Analysis of Accuracy
5.1.1. Accuracy Verification of DS-InSAR Results Based on the Fused DEM
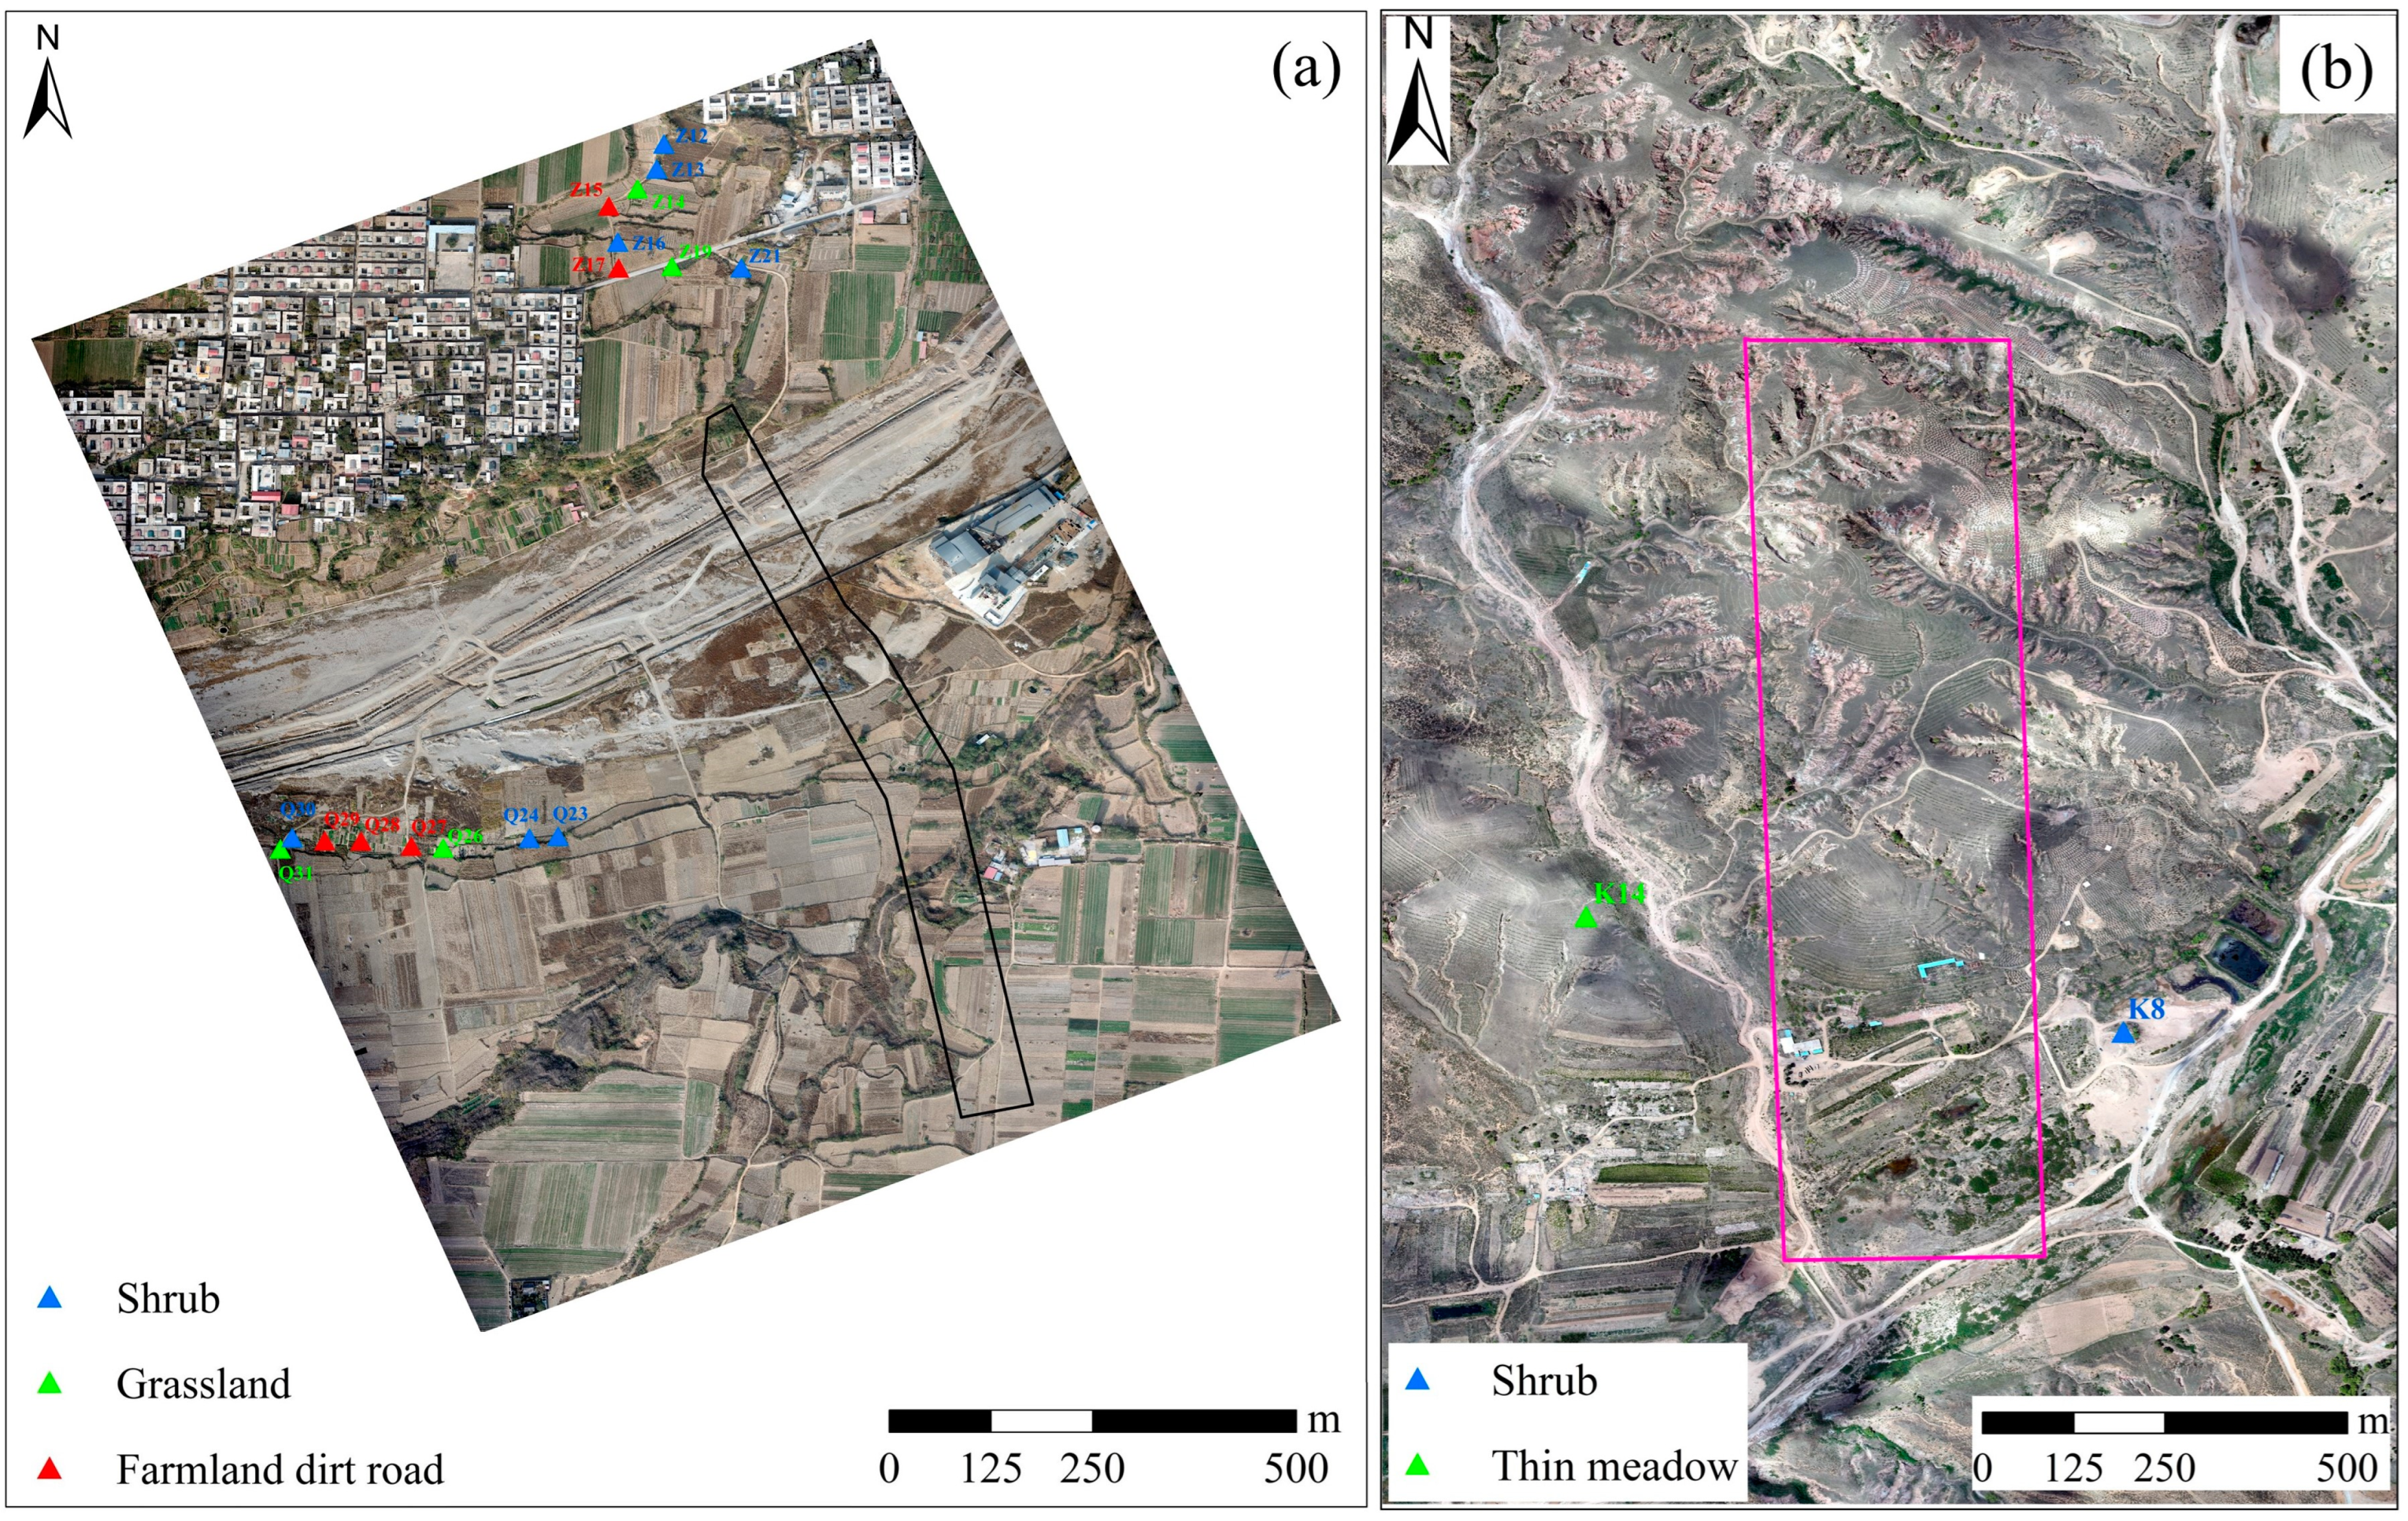
5.1.2. Accuracy Comparison between Different Ground Object Points
5.2. Advantage Analysis of DS Selection Integrated with UAV DOM
5.3. Deformation Rate Analysis of DS-InSAR Results after Refinement
6. Discussion
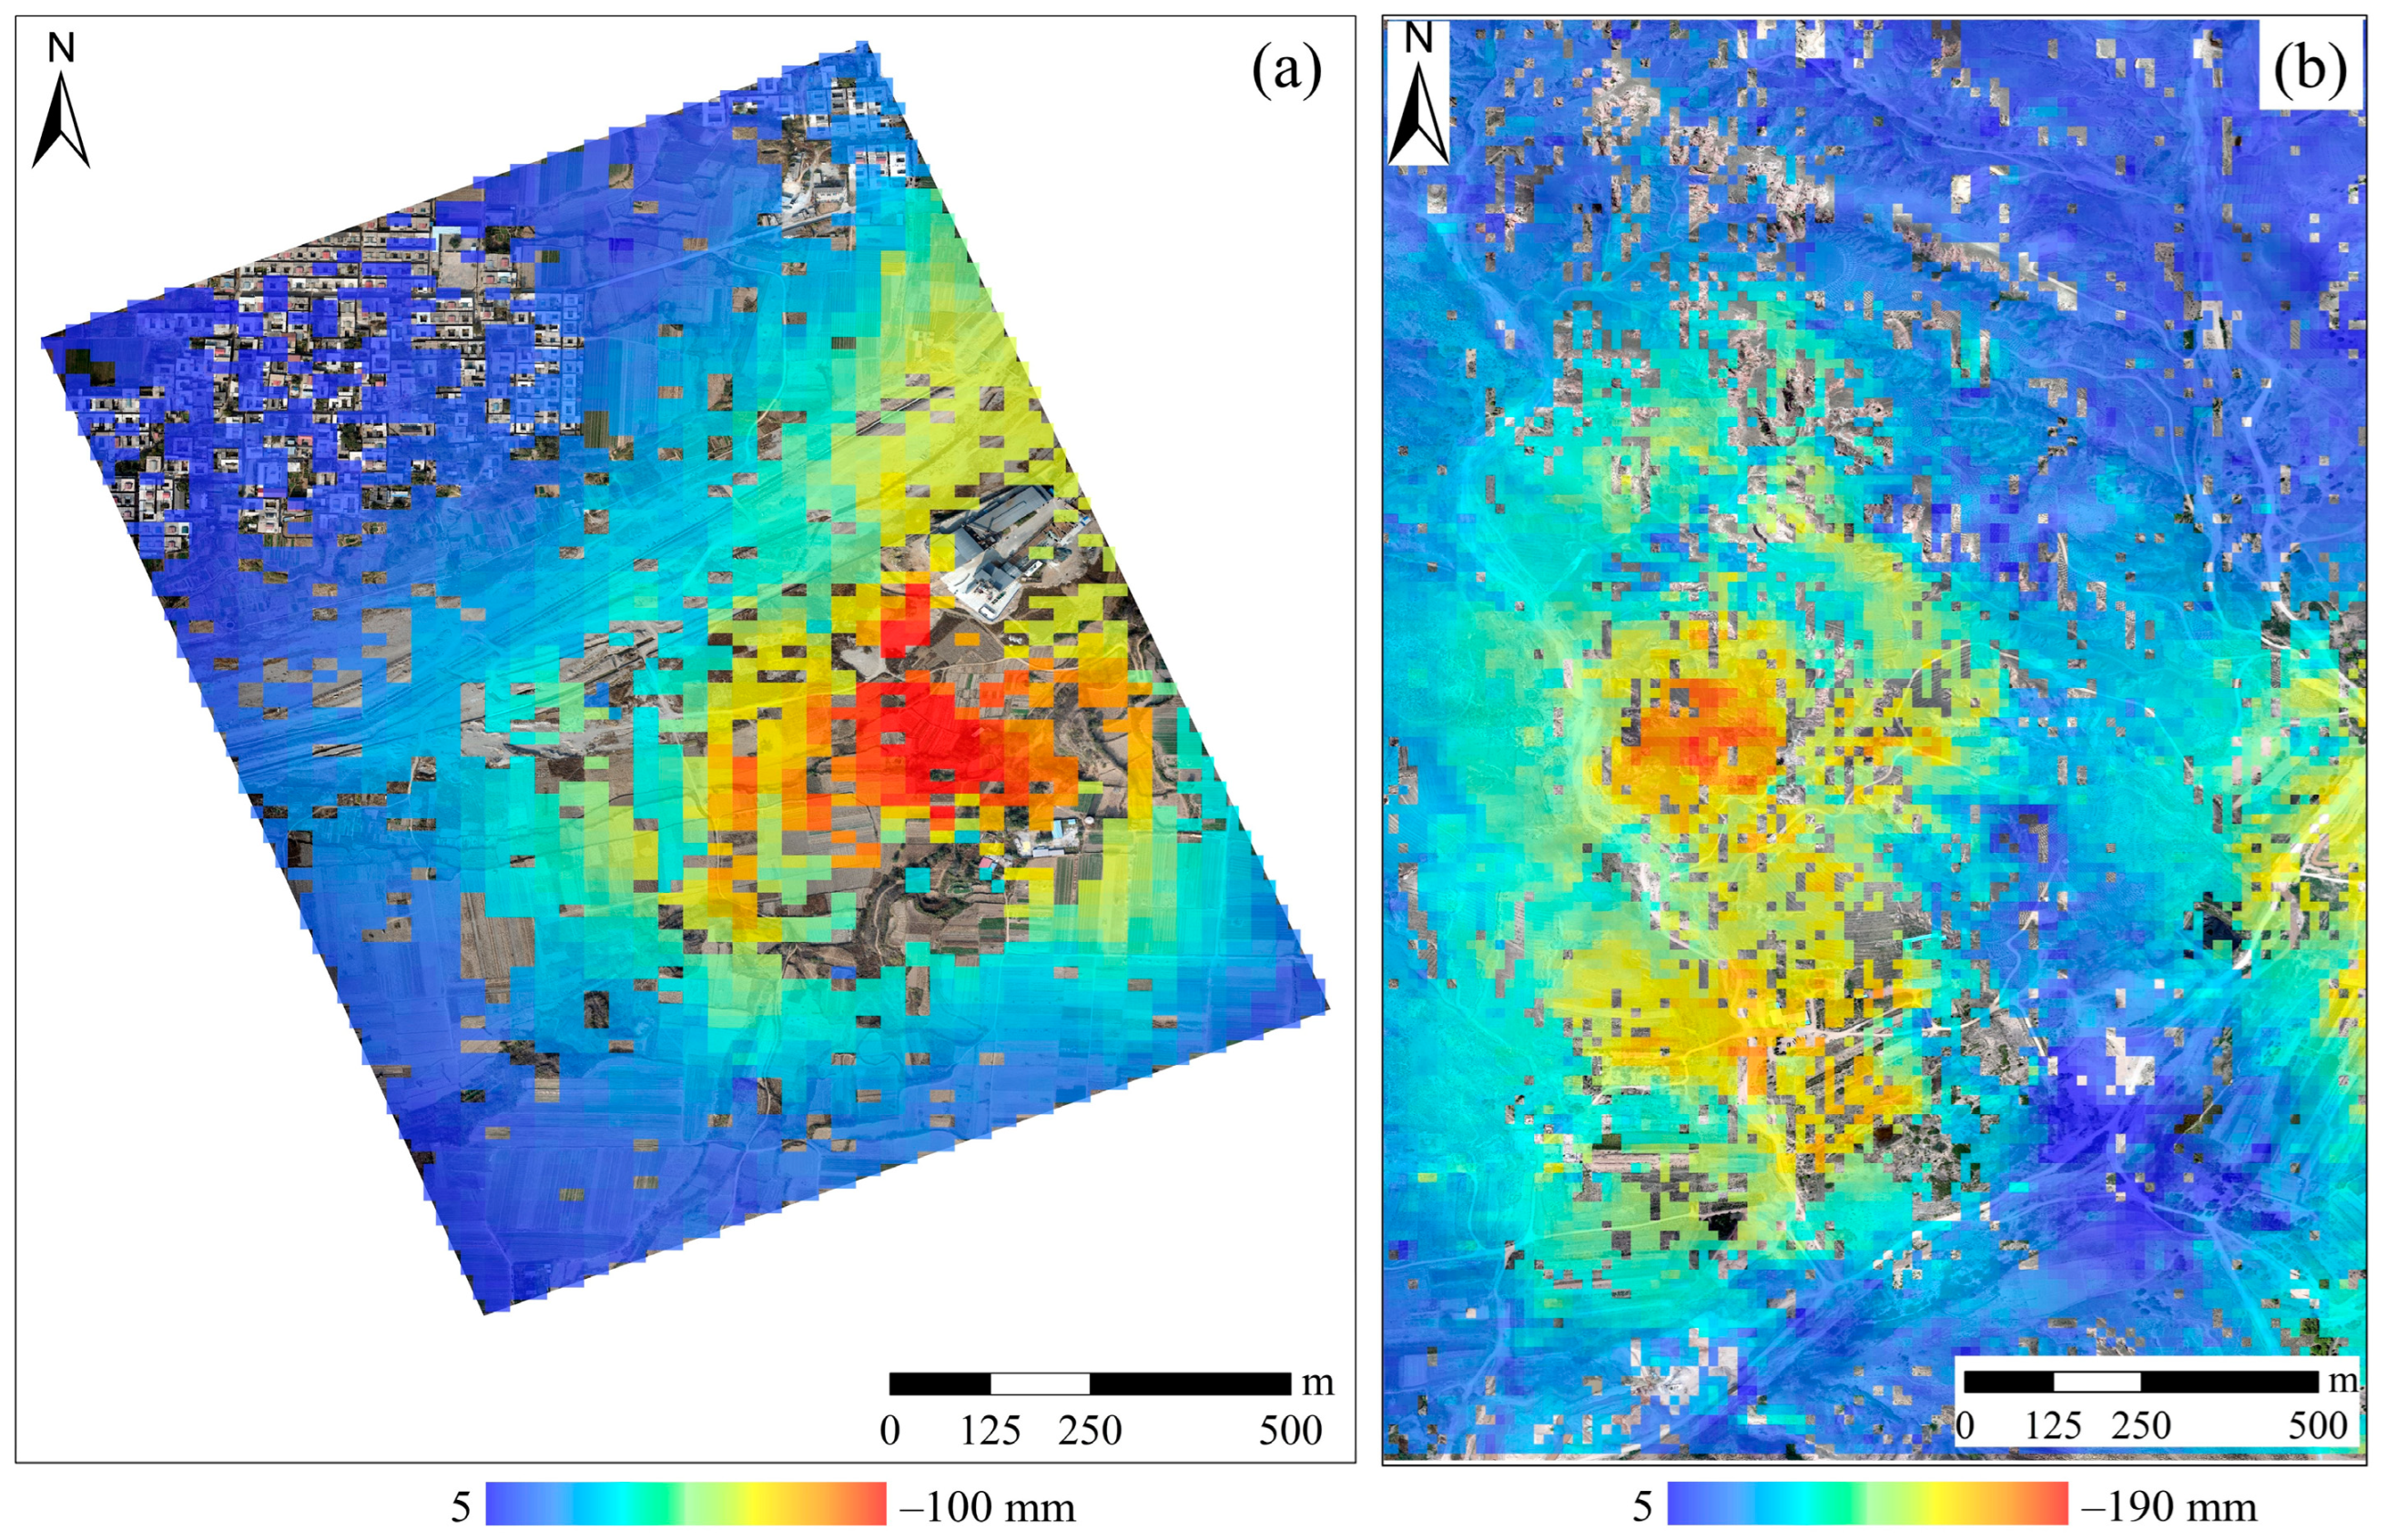
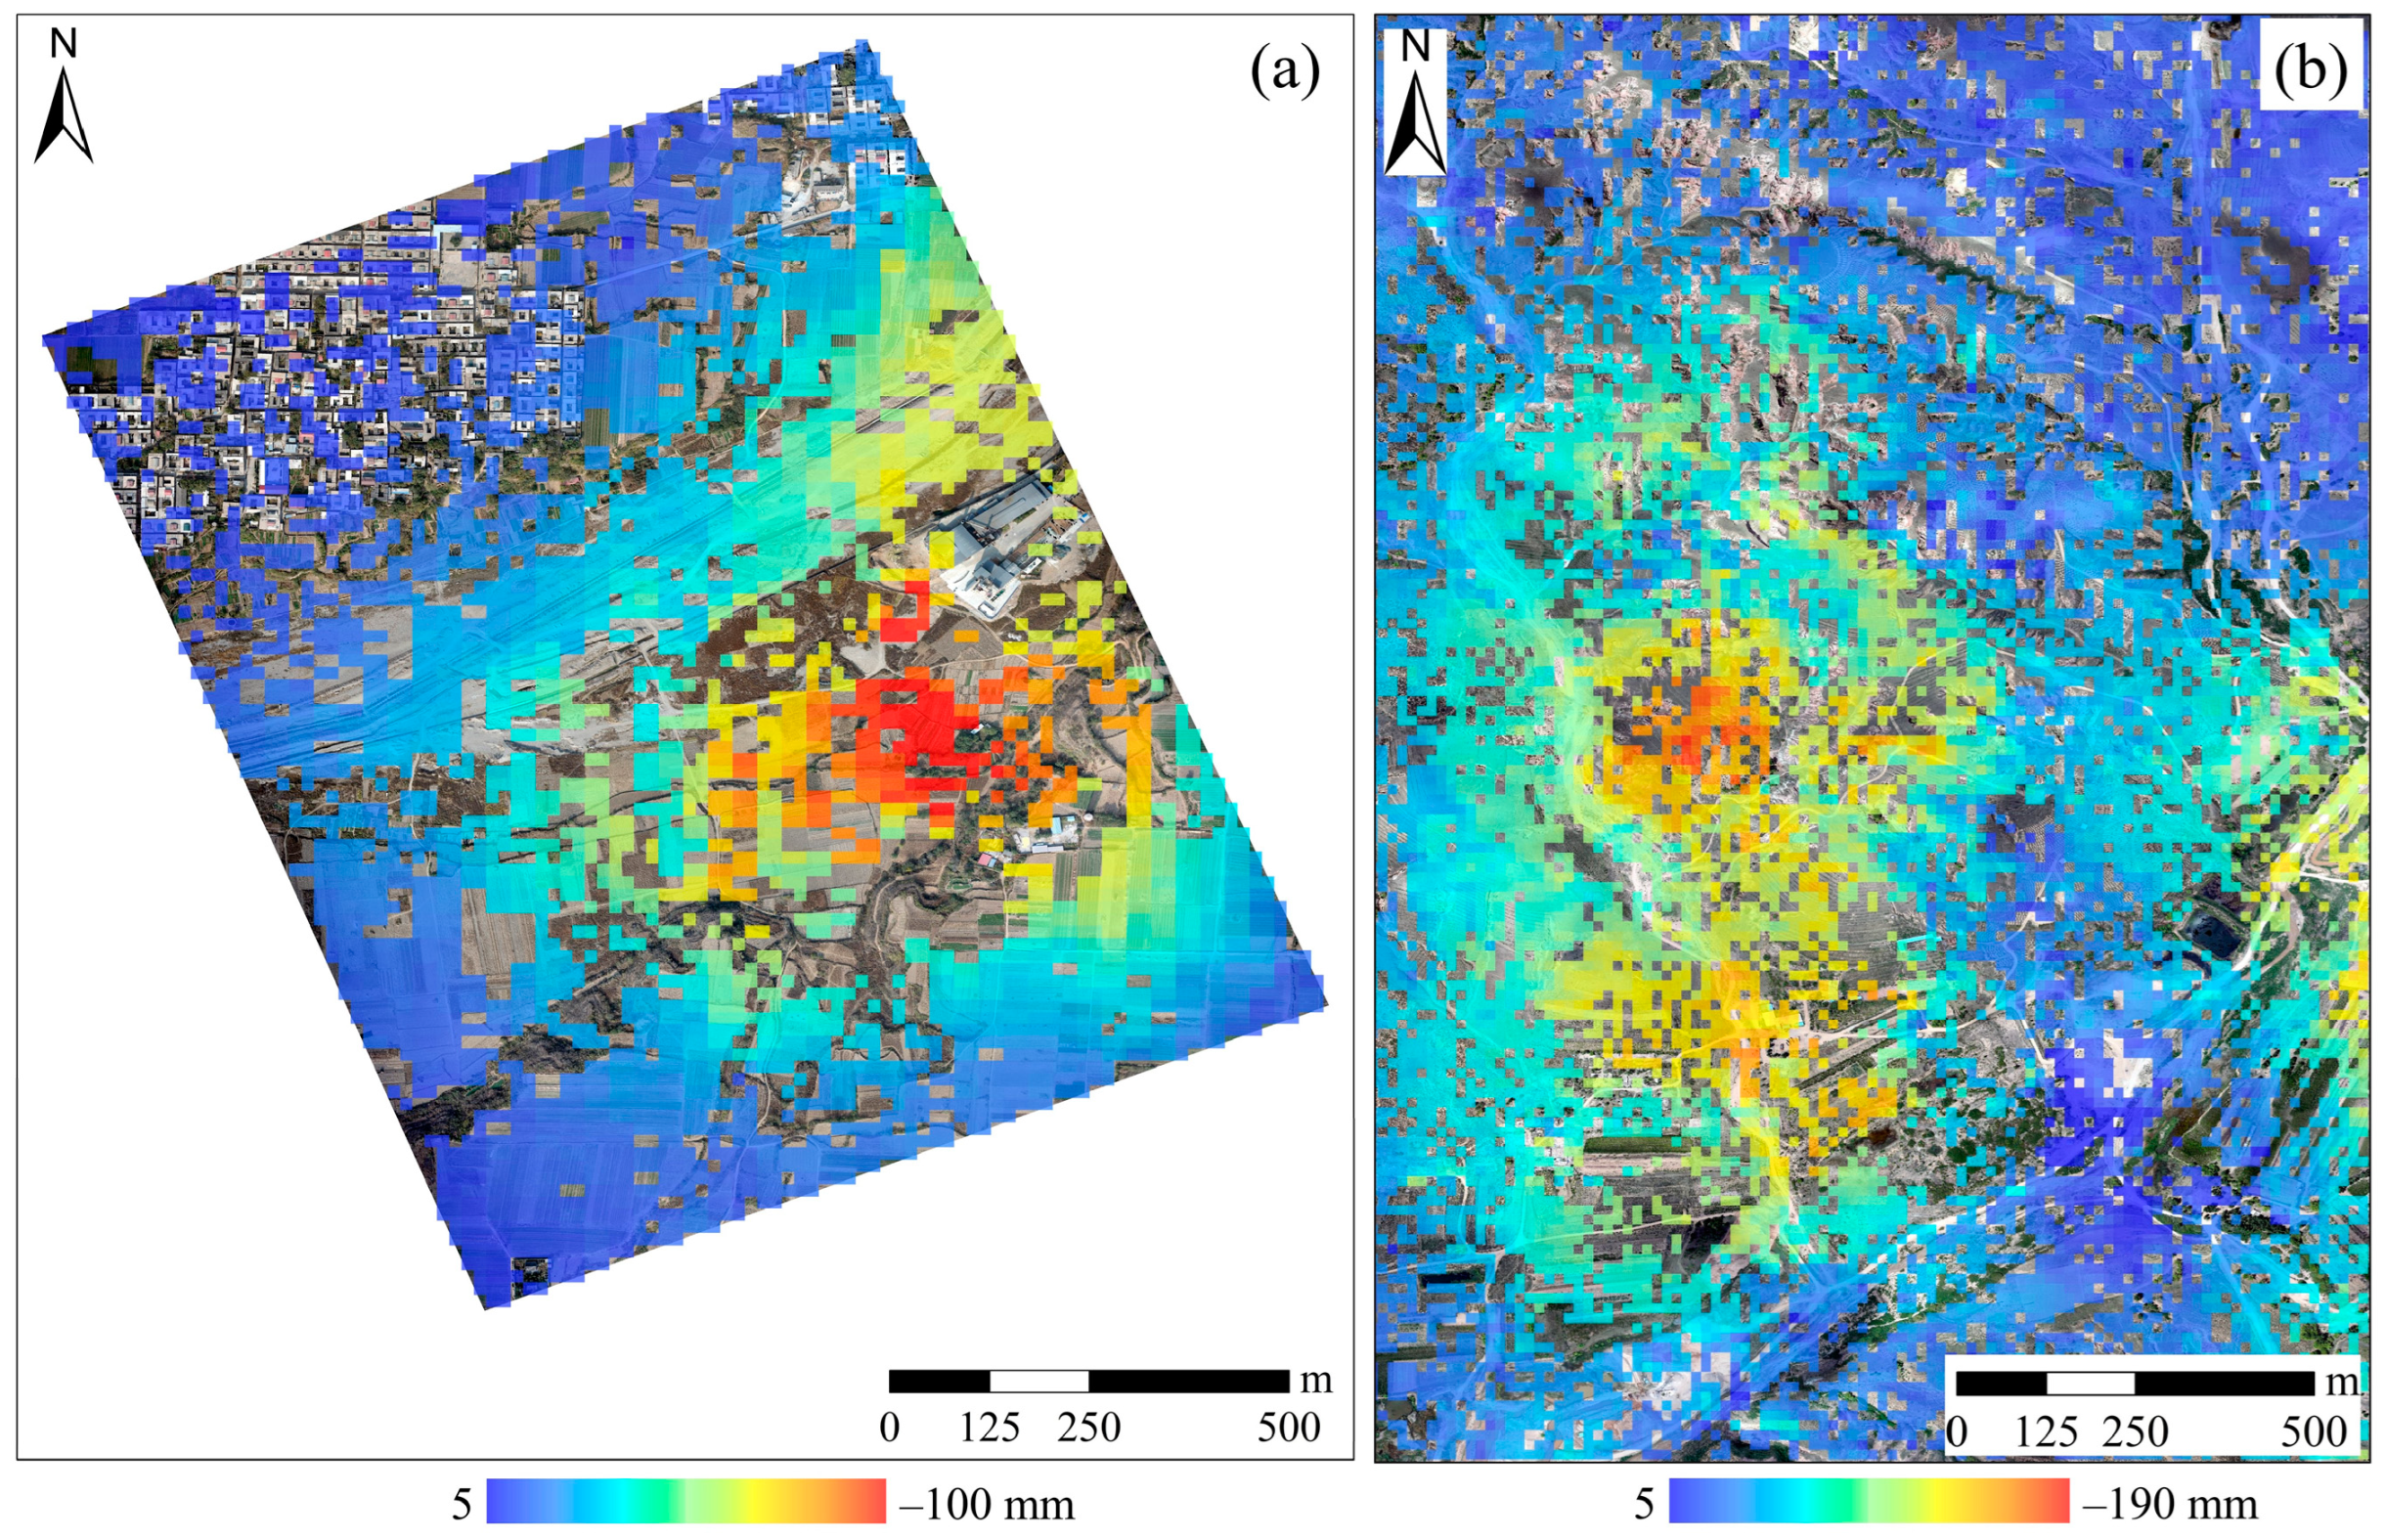
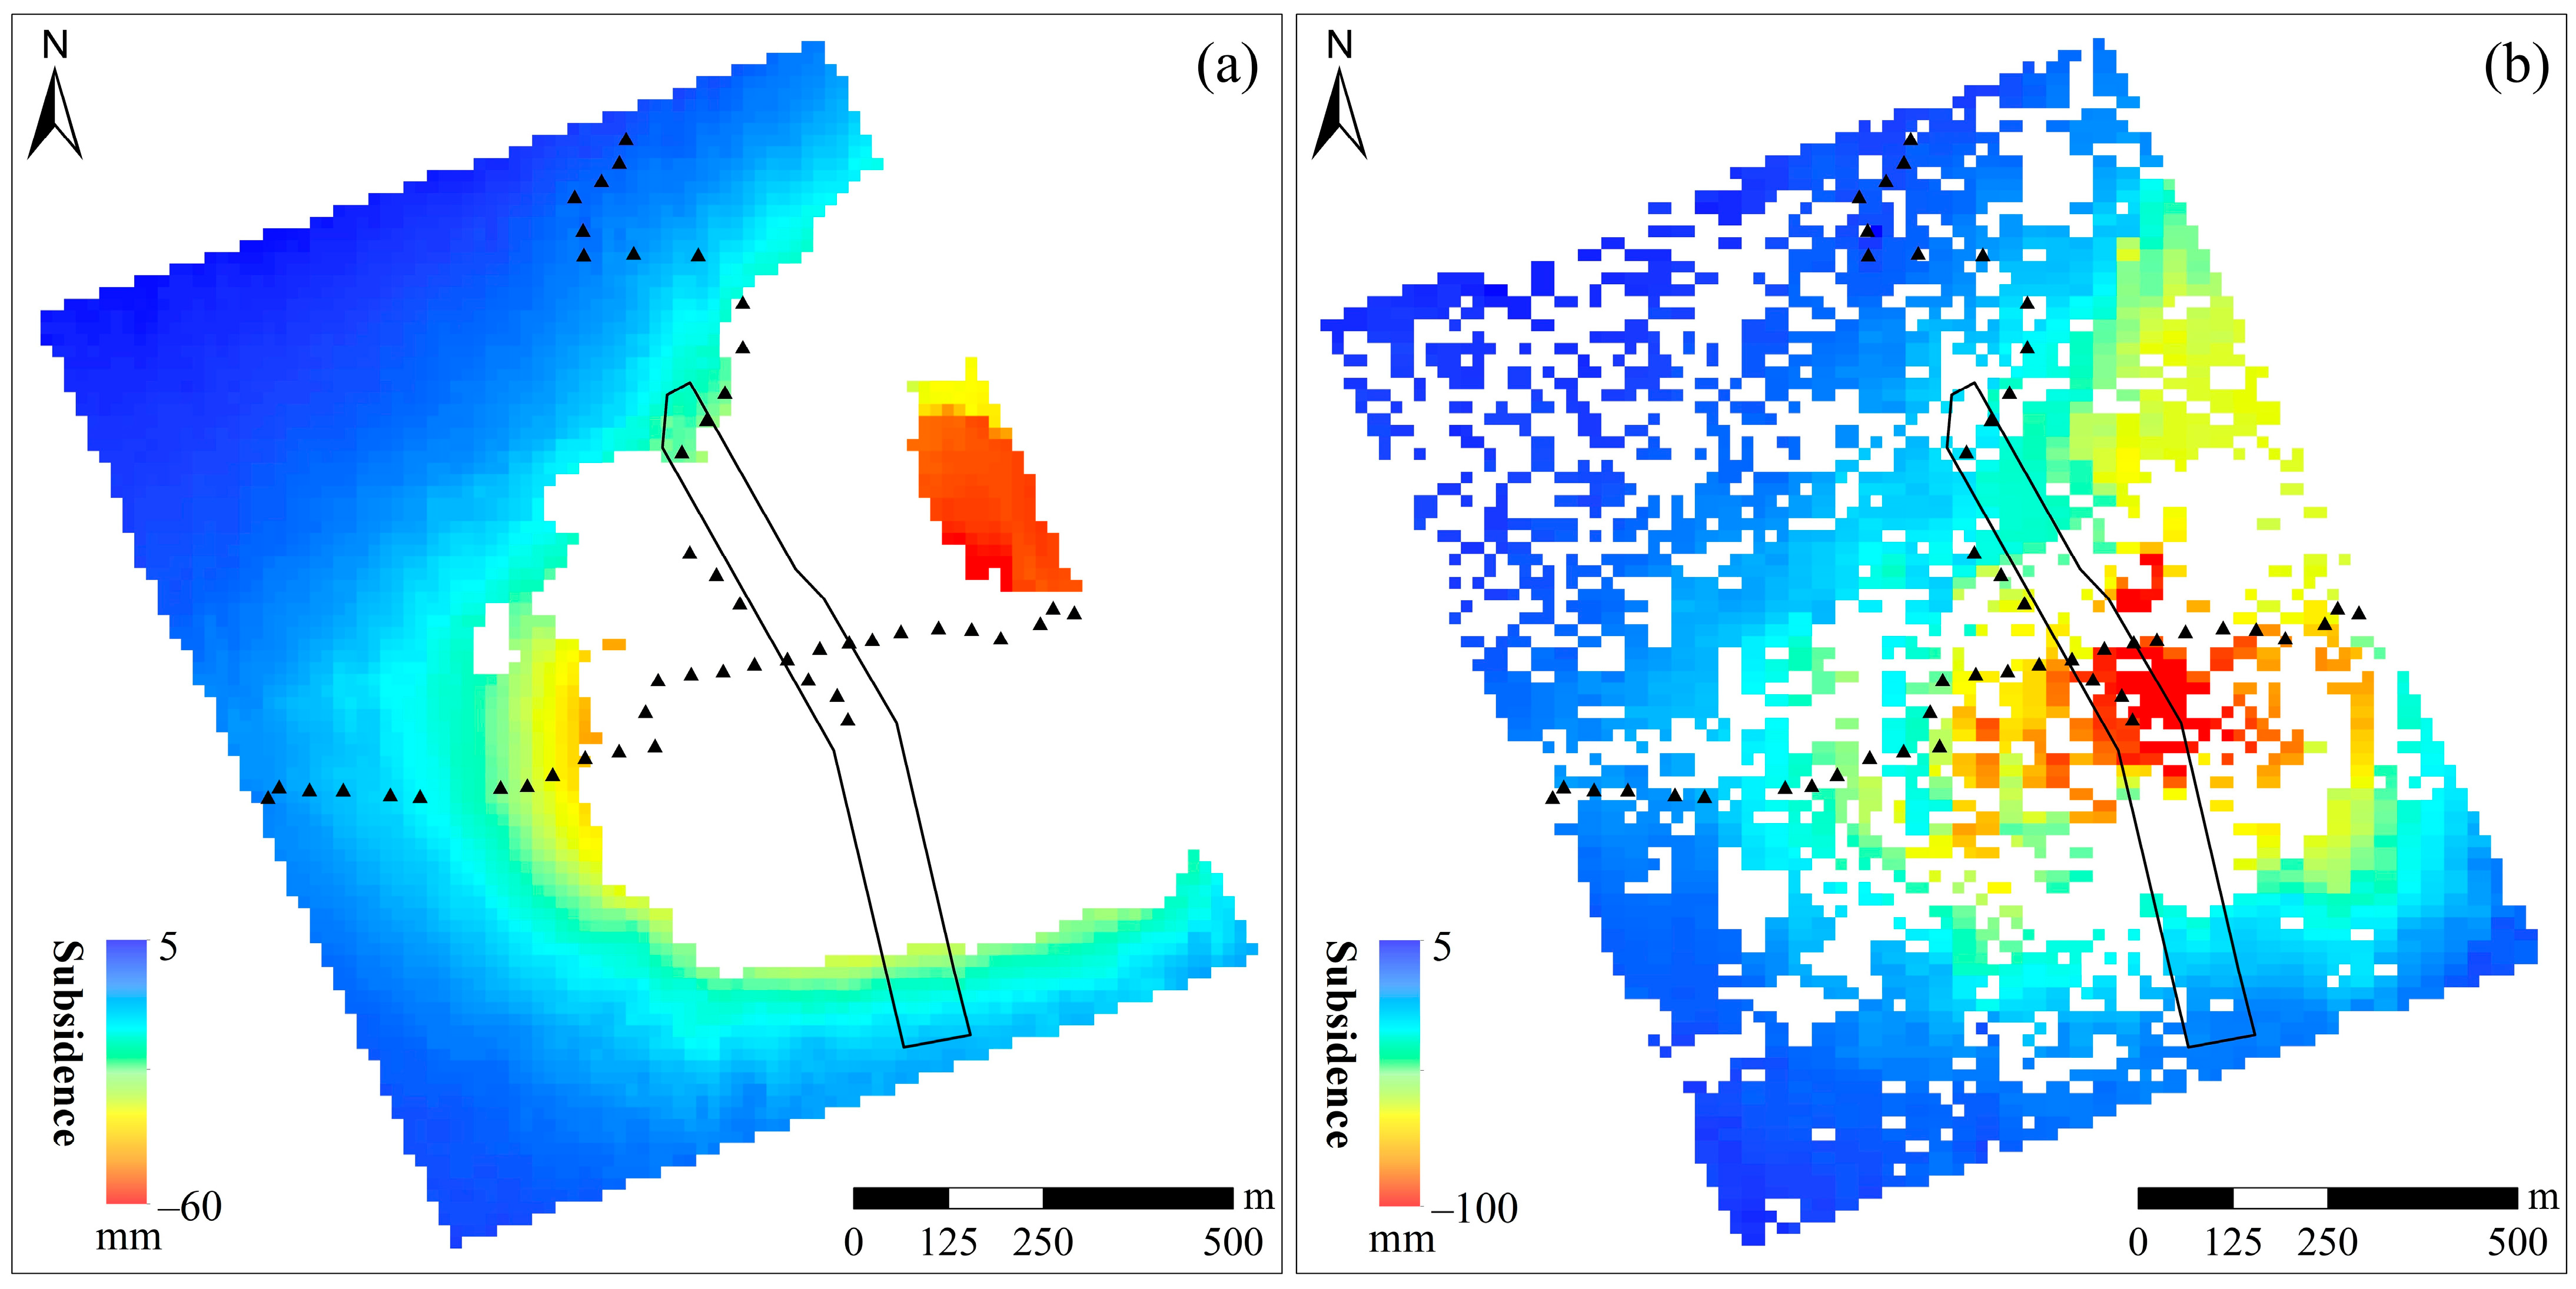
- The impact of mining depthIn the comparison of monitoring accuracy between the two mining areas, the monitoring error in the Wu’an mining area is considerably smaller than that in the Inner Mongolia mining area (Table 3). Based on established knowledge, with similar mining thicknesses, shallower mining depths tend to result in greater deformation but within a narrower range. Conversely, deeper mining depths lead to less deformation but over a broader area. In the cases of the experiments of two mining areas, the coal seam thickness in the Inner Mongolia mining area (3.3 m) is thinner compared to that in the Wu’an mining area (5 m), and the mining depth (200 m) is shallower than in the Wu’an mining area (550 m). As demonstrated through the subsidence results depicted in Figure 14b and Figure 15b, it is evident that the deformation in the Inner Mongolia mining area is generally more pronounced than that in the Wu’an mining area. Another scholar has previously posited a correlation between coal seam depth and subsidence. In 2014, Farhad Howladar et al. [45] found that under different coal seam burial depths (200–440 m), maximum subsidence occurs in coal seams with a burial depth of less than 200 m, and minimum subsidence occurs in coal seams with a burial depth of greater than 440 m. To sum up, when the difference in coal seam thickness is not large, a shallower mining depth could cause greater deformation, and greater deformation will limit the monitoring effect of InSAR, leading to larger errors.
- 2.
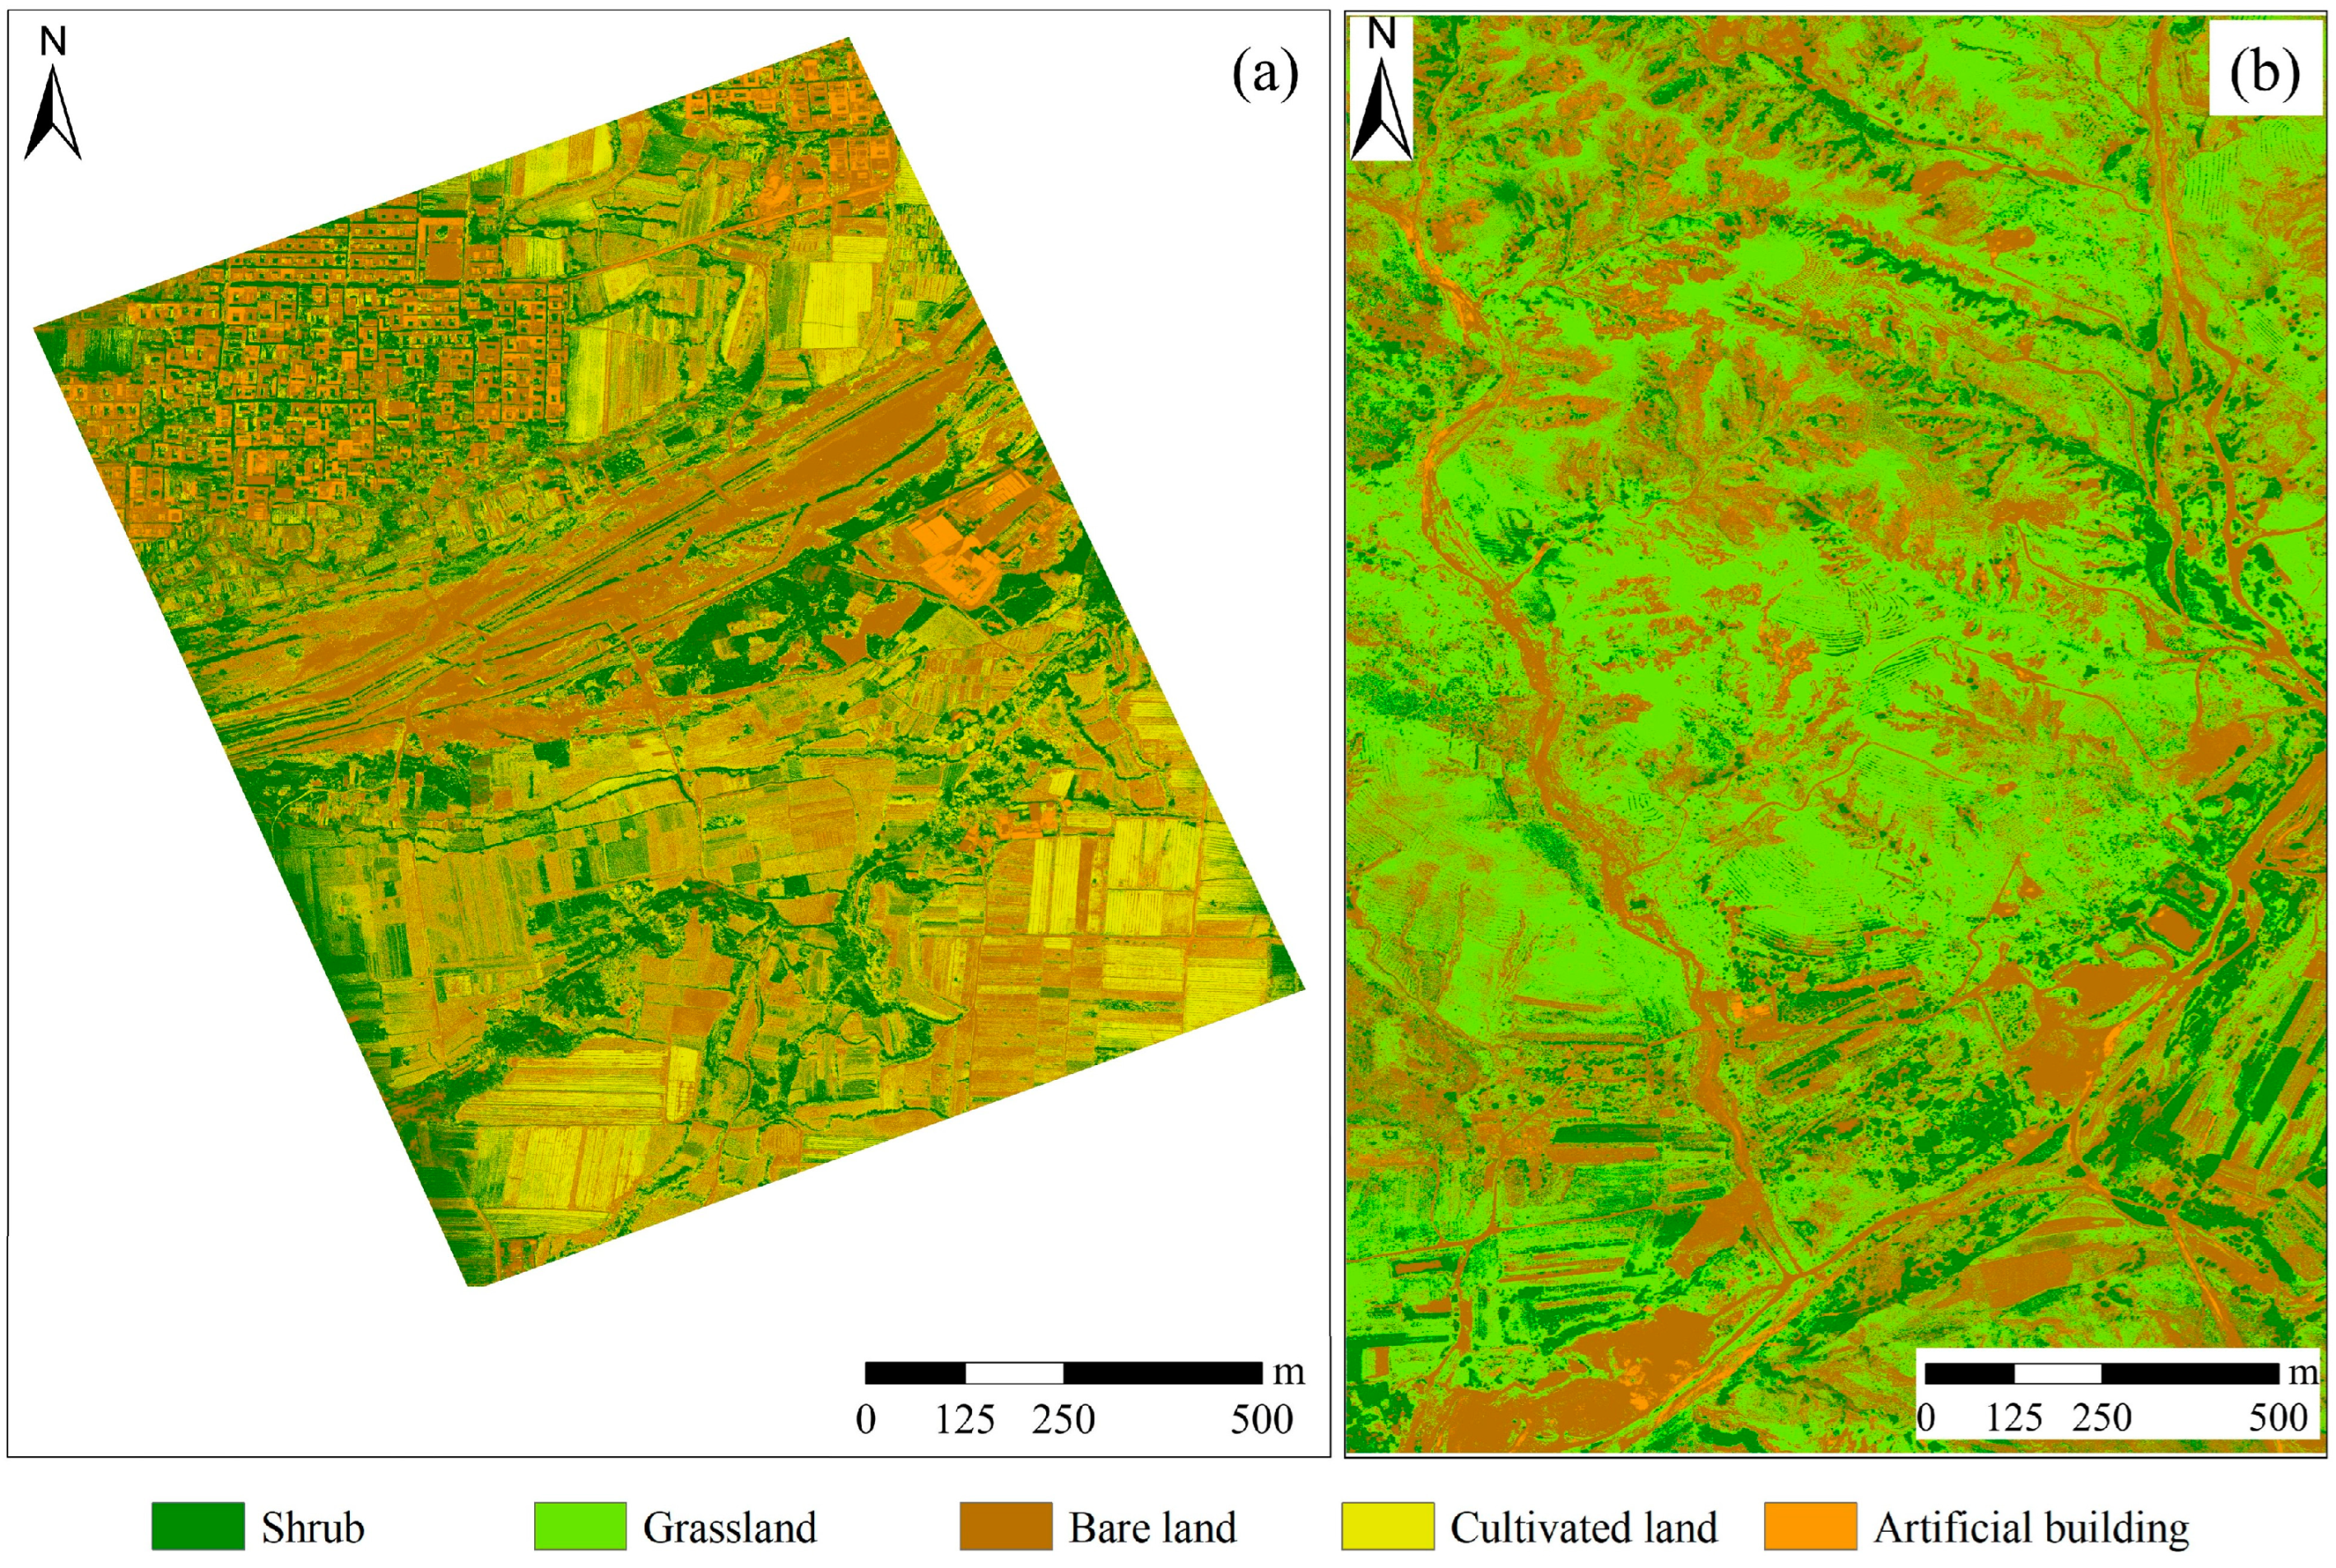
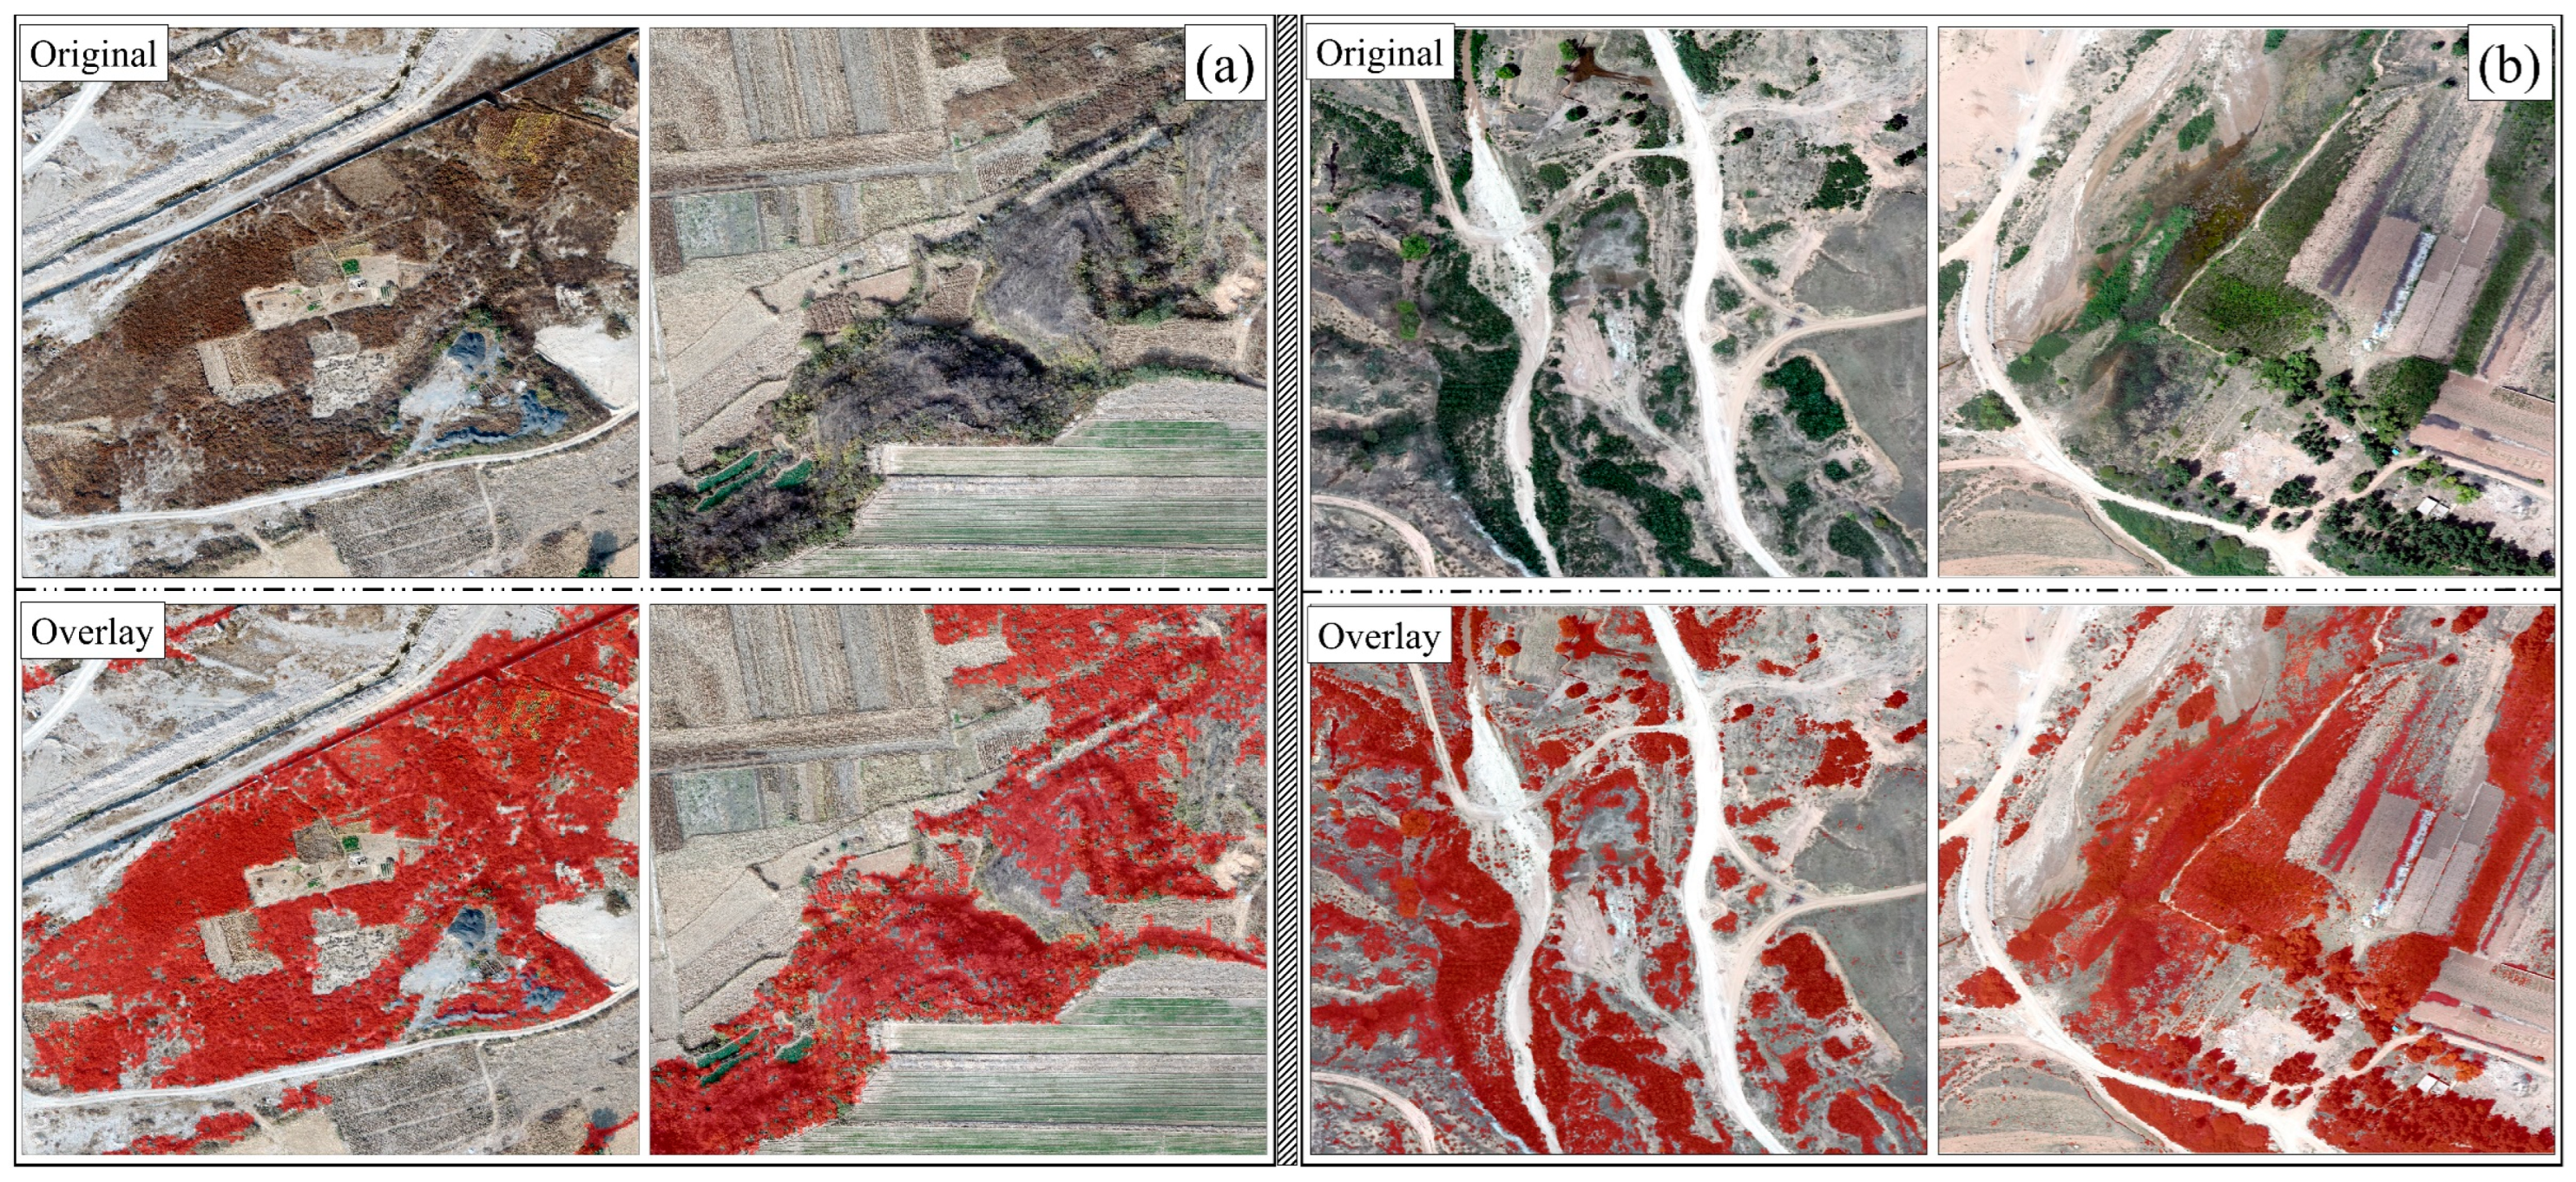
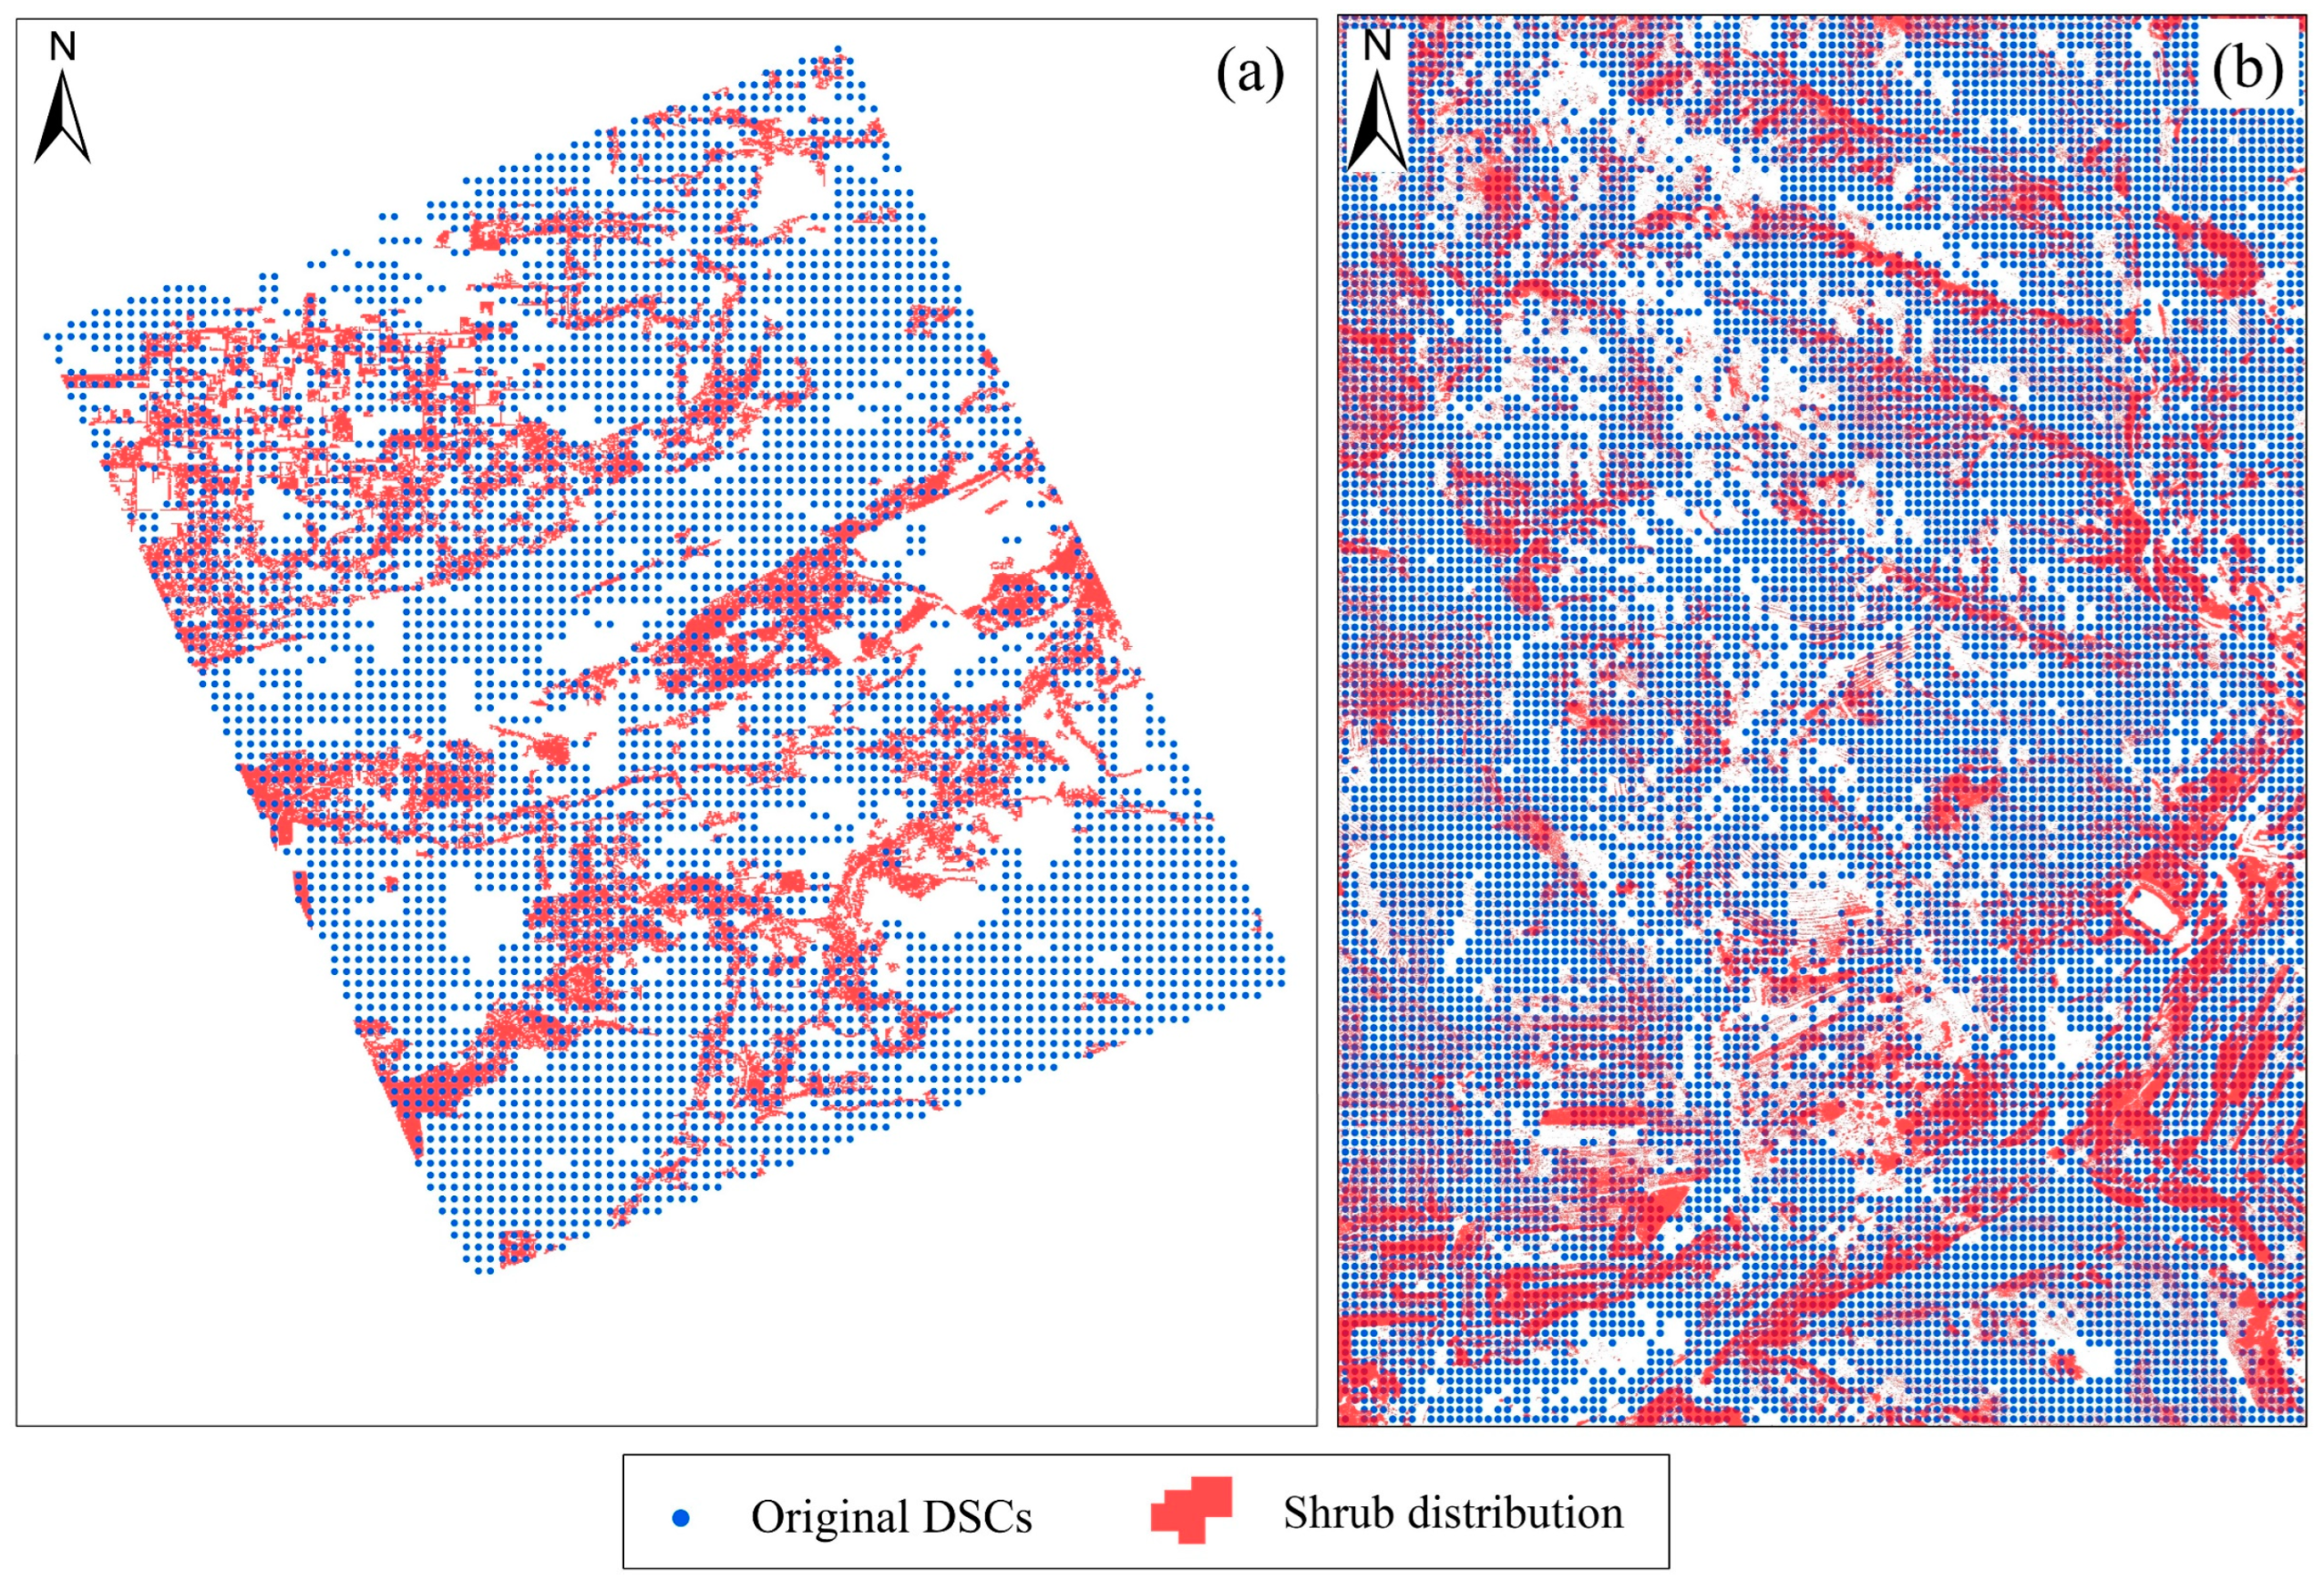
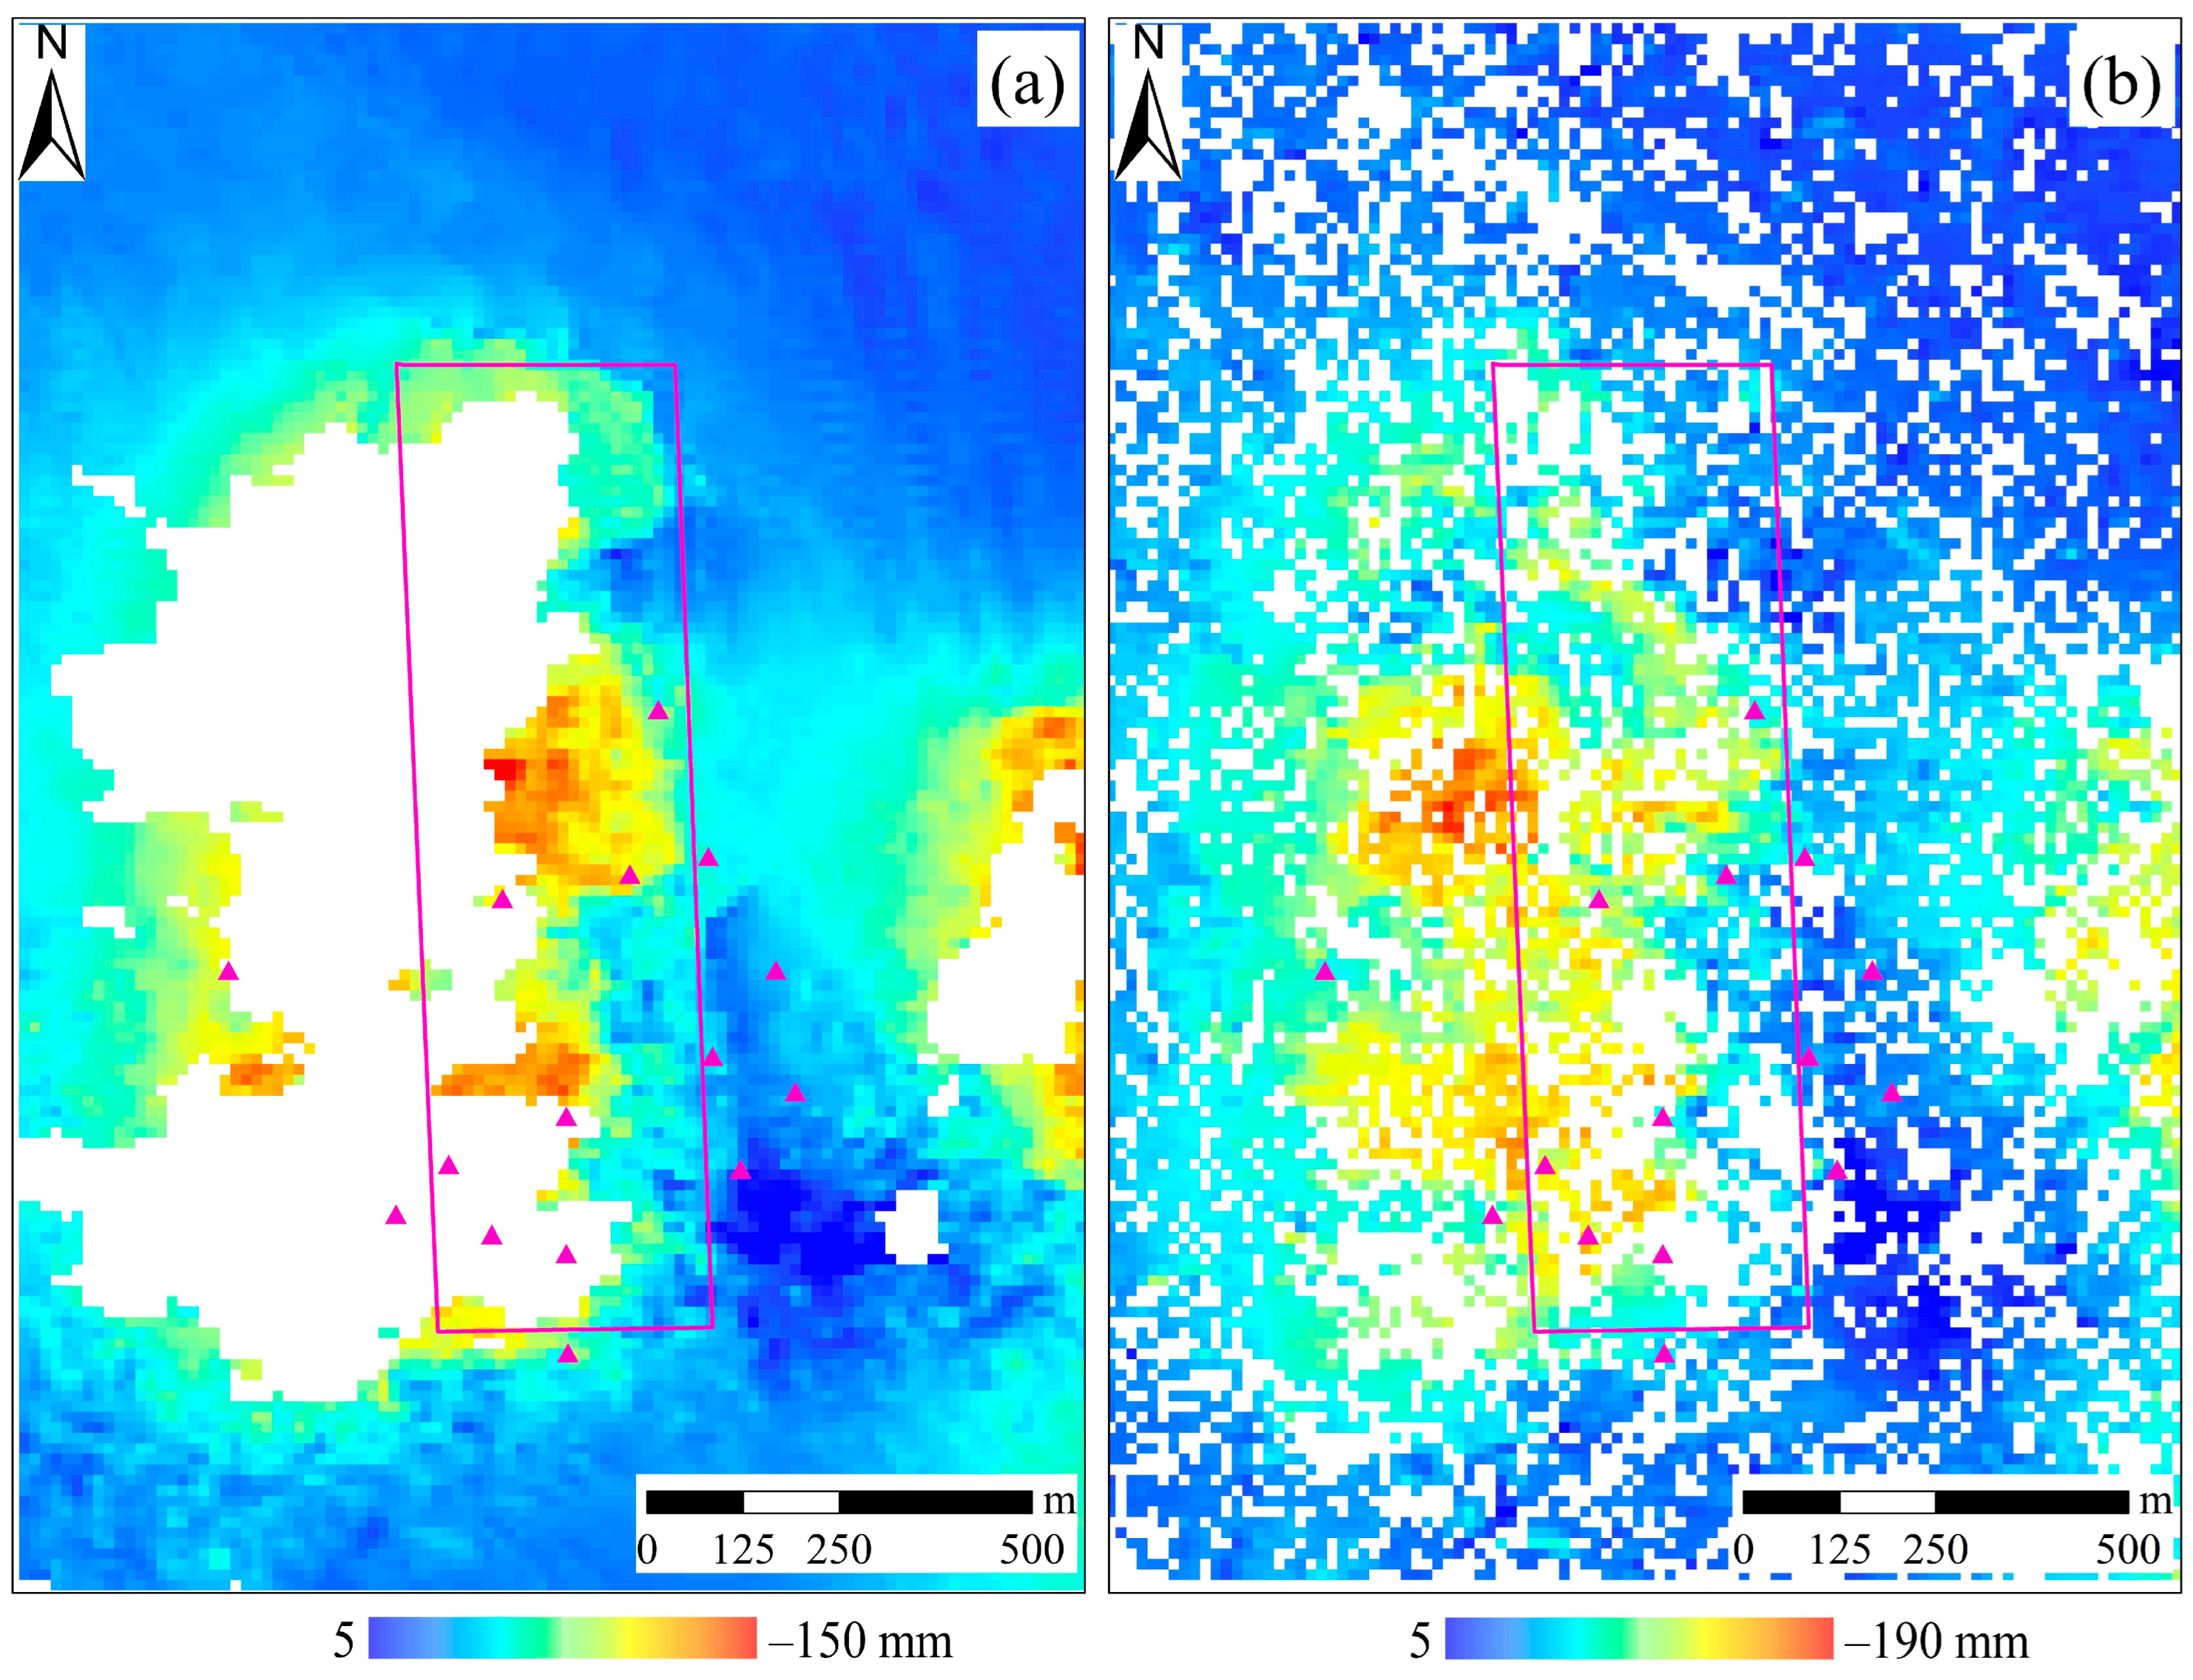
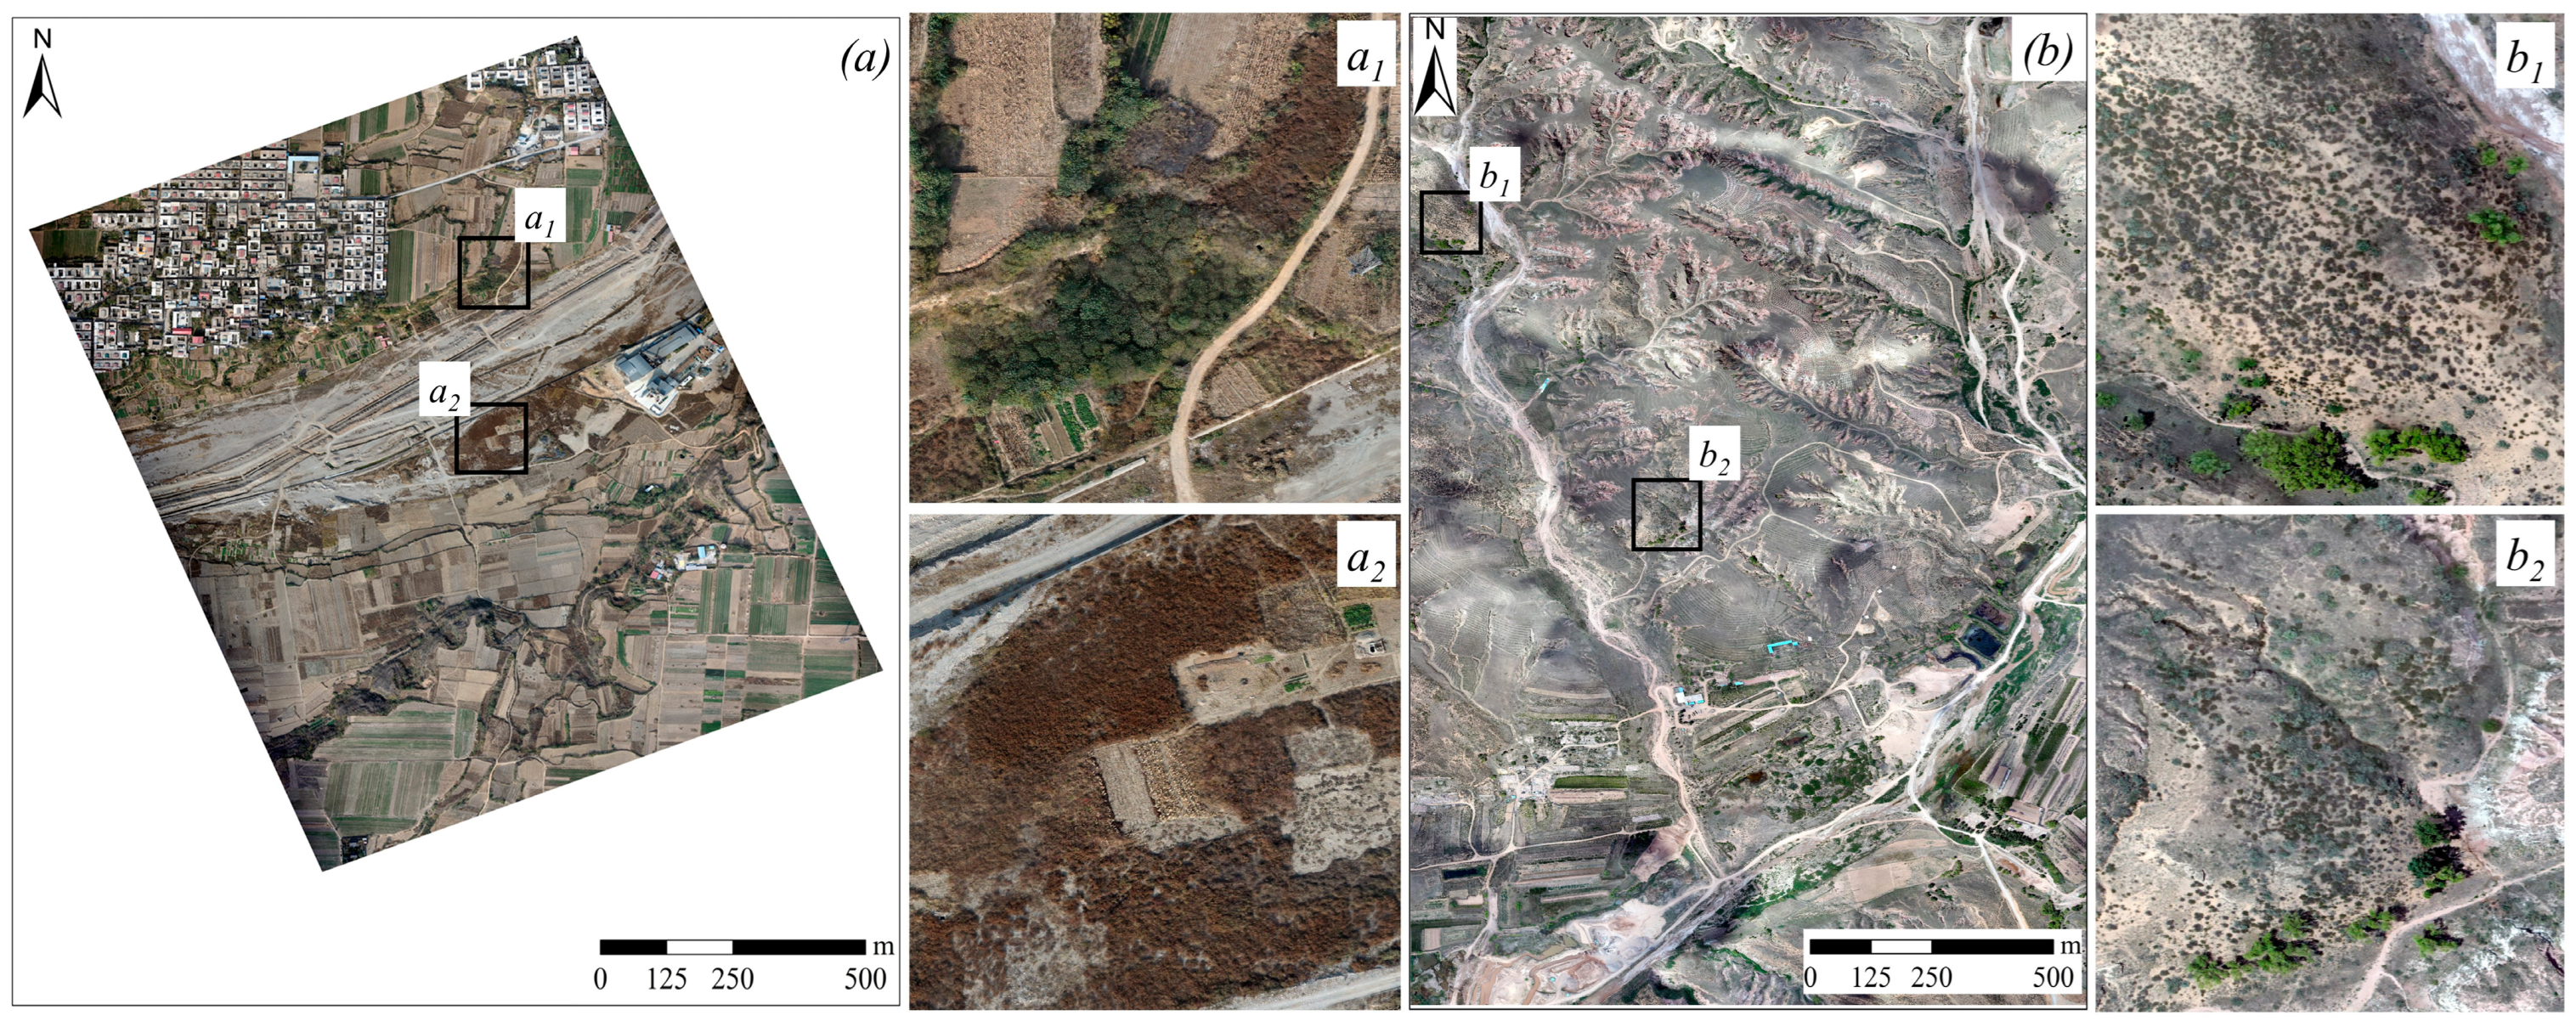
- The impact of land coverIn the process of refining the original DSCs of the two mining areas, the distribution of shrubs in the Wu’an mining area was relatively concentrated (see a1 and a2 in Figure 18a), while the distribution of shrubs in the Inner Mongolia mining area was chaotic and scattered (see b1 and b2 in Figure 18b), which made it more difficult to extract the shrub distribution area in the Inner Mongolia mining area, while it was less difficult to extract the shrub distribution area in the Wu’an mining area. Therefore, different land cover types and distribution conditions could affect the degree of difficulty in the proposed point selection method.
- 3.
- The influence of topographyThe DS-InSAR results between the Wu’an and Inner Mongolia mining areas indicated distinct terrain characteristics. Wu’an exhibited a relatively flat topography, with deformation trends emanating from the center of the working face towards the surroundings. The farther one of these moved from the center, the less the deformation (Figure 14b). Conversely, Inner Mongolia’s terrain was predominantly characterized by valleys, with higher elevations in the east and lower elevations in the west. The coal seam had an inclination angle of 2°, an influence that could be largely disregarded. Consequently, deformations on the east side of the working surface were less pronounced than those on the west side, leading to an irregular subsidence boundary (Figure 15b), which is related to the topography and terrain. Of course, this phenomenon may also be caused by factors such as the geological and structural background of the mining area [45], but due to different professions and the lack of data, it is hard to further investigate.
7. Conclusions and Outlook
7.1. Conclusions
- Although the mining depth could limit the monitoring effect of DS-InSAR, DS-InSAR technology uses a fused DEM as an external reference DEM, reducing monitoring errors better than the original DEM does and improving monitoring accuracy by 2 mm when it monitors mining areas under different mining depth conditions.
- Based on the DS-InSAR monitoring results of two mining areas obtained via a fused external reference DEM, we compared monitoring accuracy results based on the points of different ground types. We found that both mining areas showed the highest error for points with shrub ground types, indicating that non-DS points corresponding to the ground type (shrubs in this paper) cause poor monitoring accuracy.
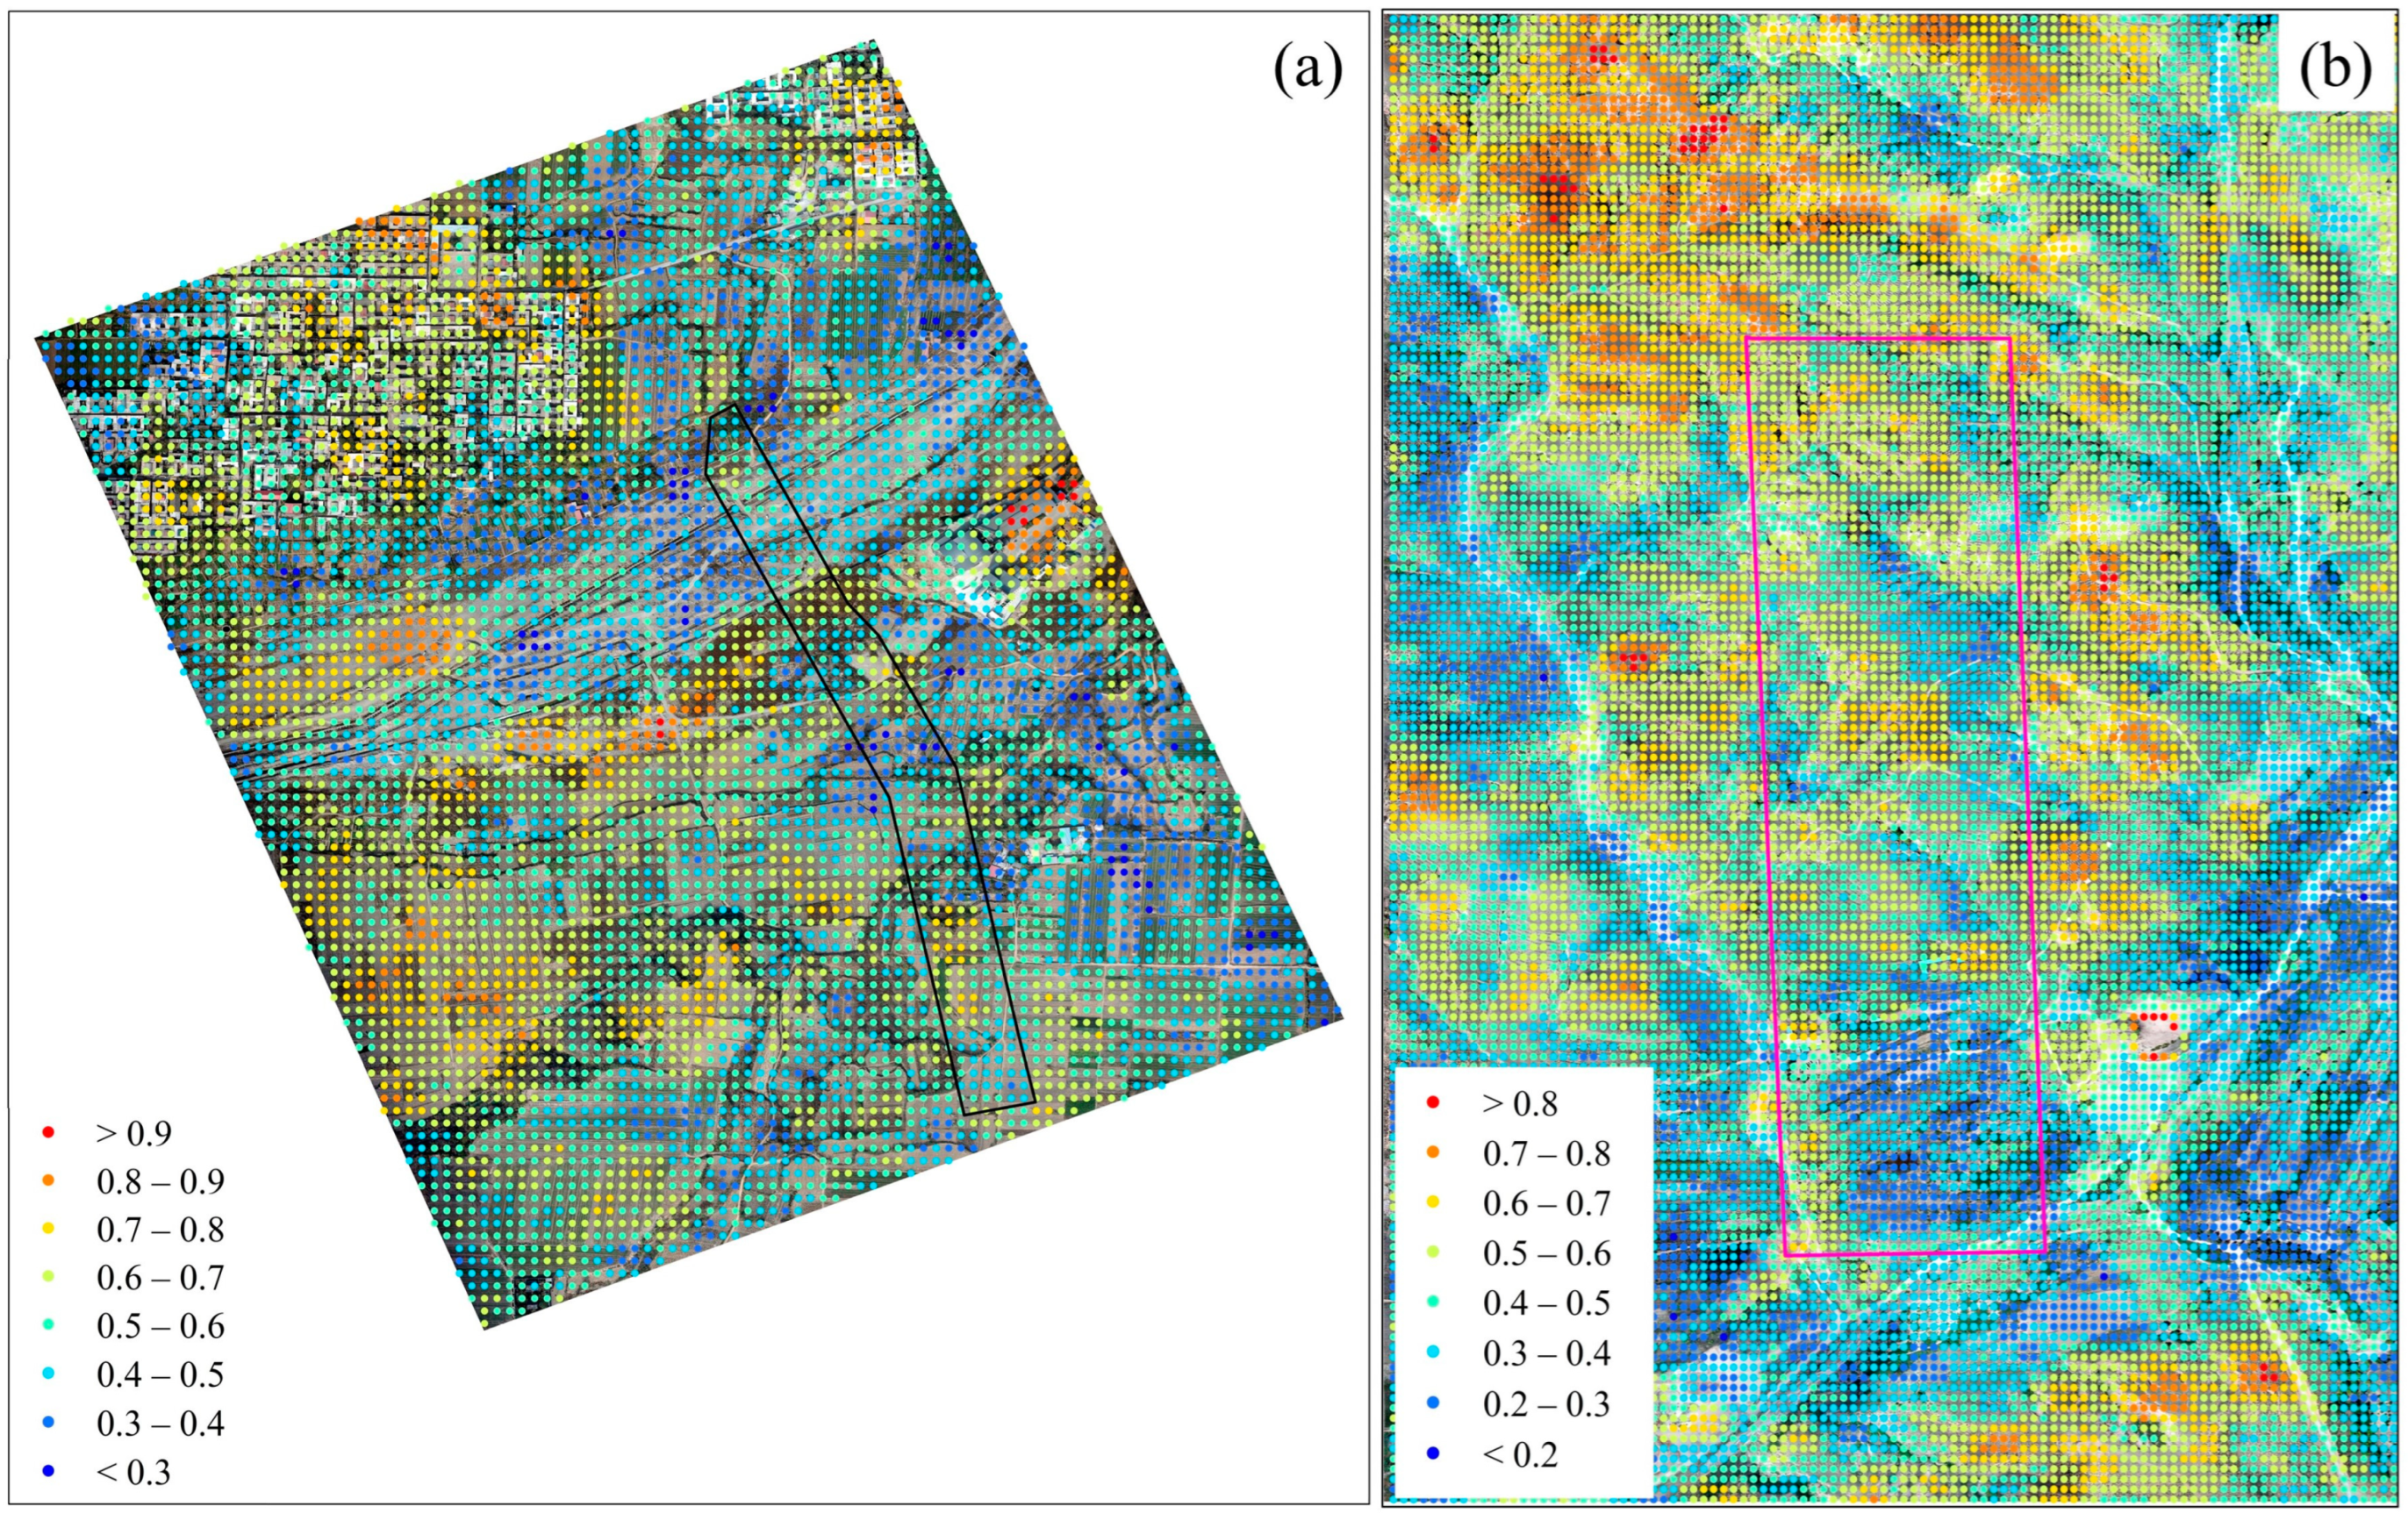
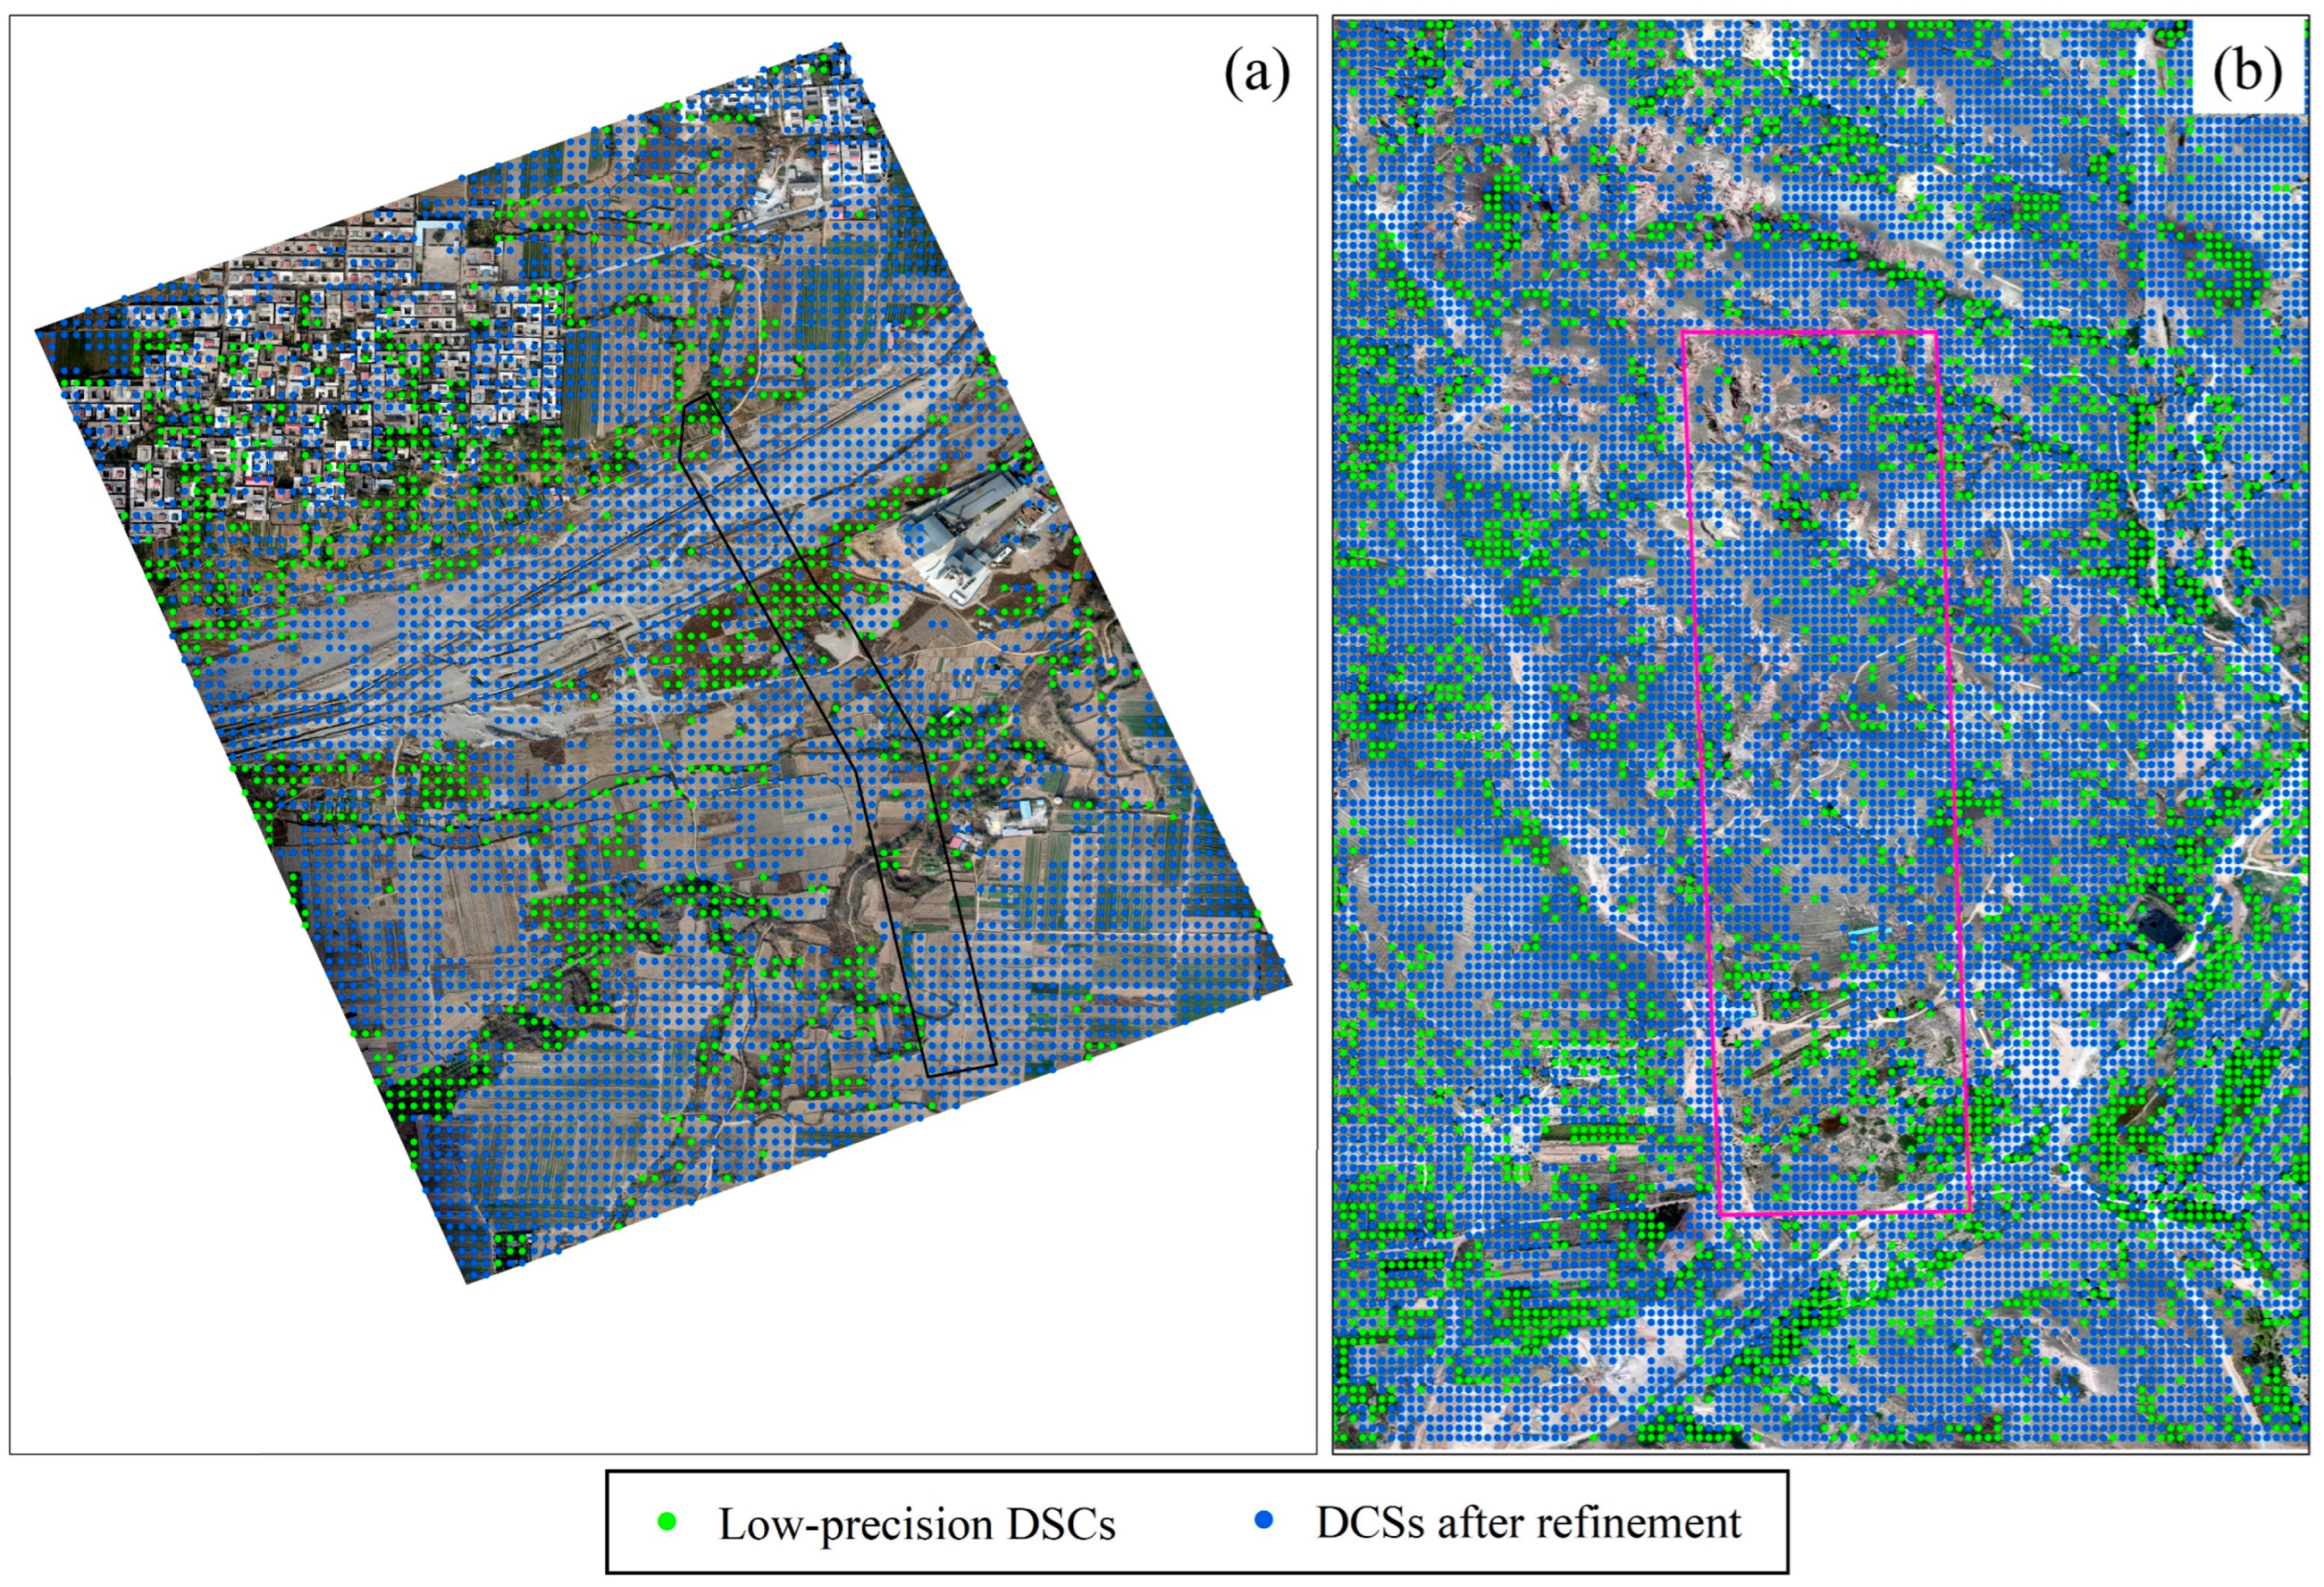
- The proposed DS selection method that integrates the high-resolution UAV DOM improved the number and density of points compared to those under traditional coherence threshold point selection. It did not exhibit low coherence due to the influence of the surface coverage type and large gradient deformation. Compared to conventional DS selection, it could eliminate non-DS points with low monitoring accuracy and increase the accuracy of point selection. Our method’s application in the Wu’an and Inner Mongolia mining areas demonstrated a good point selection effect, indicating its strong applicability in mining environments of different surface types. However, difficulty in point selection depends on the surface coverage type and distribution of different mining areas.
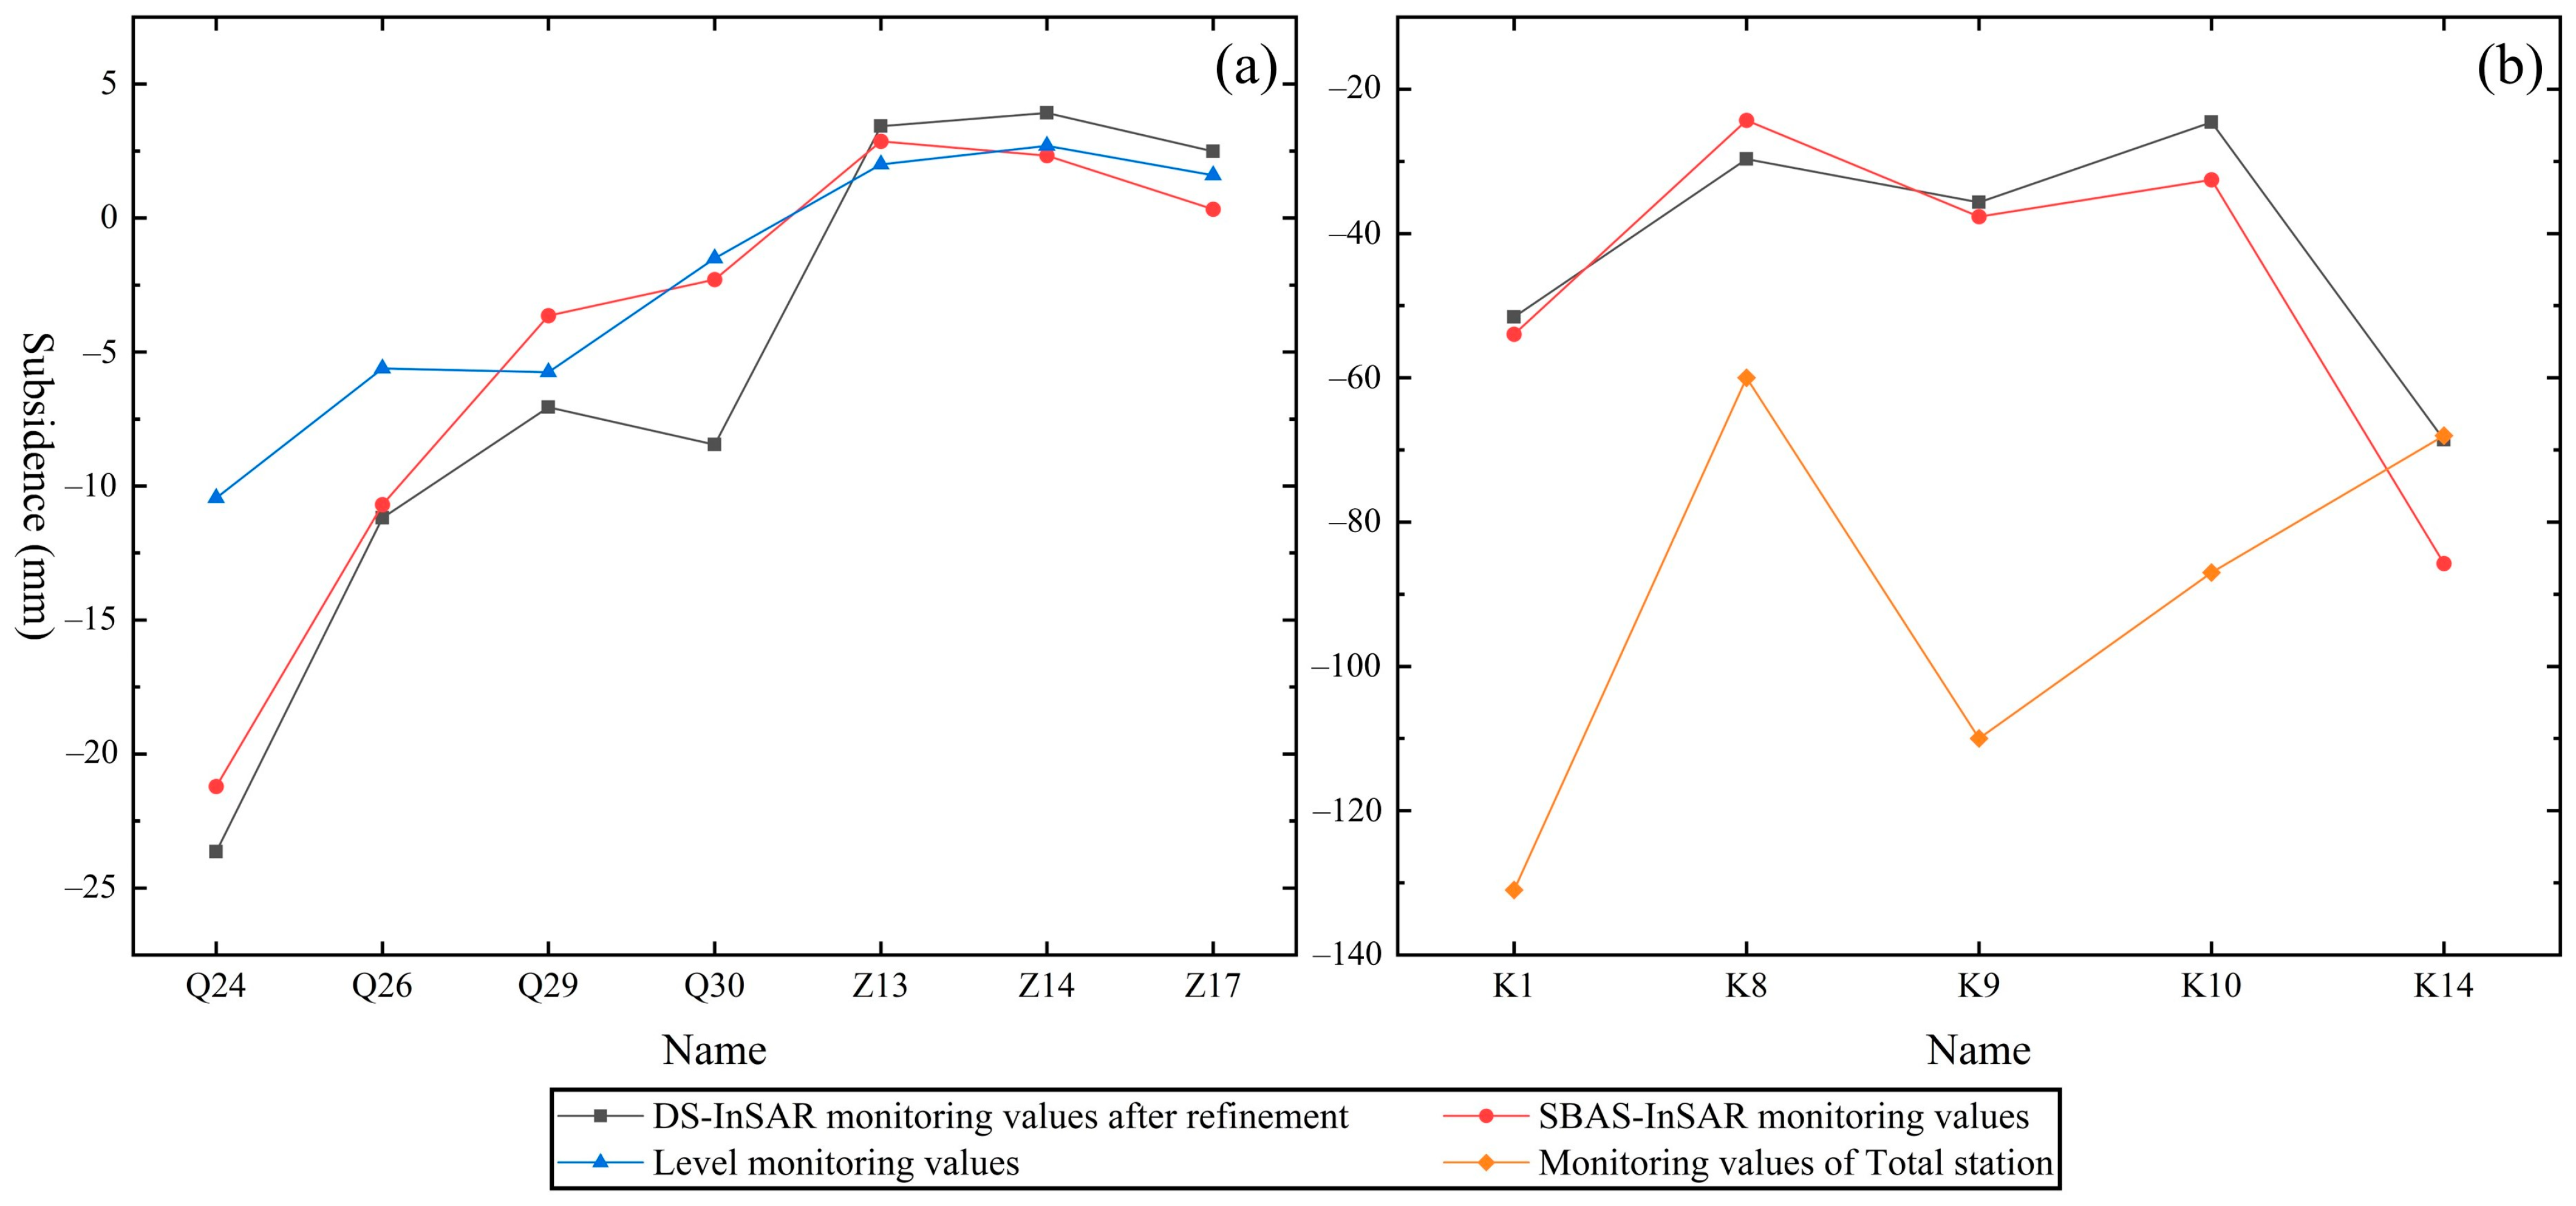
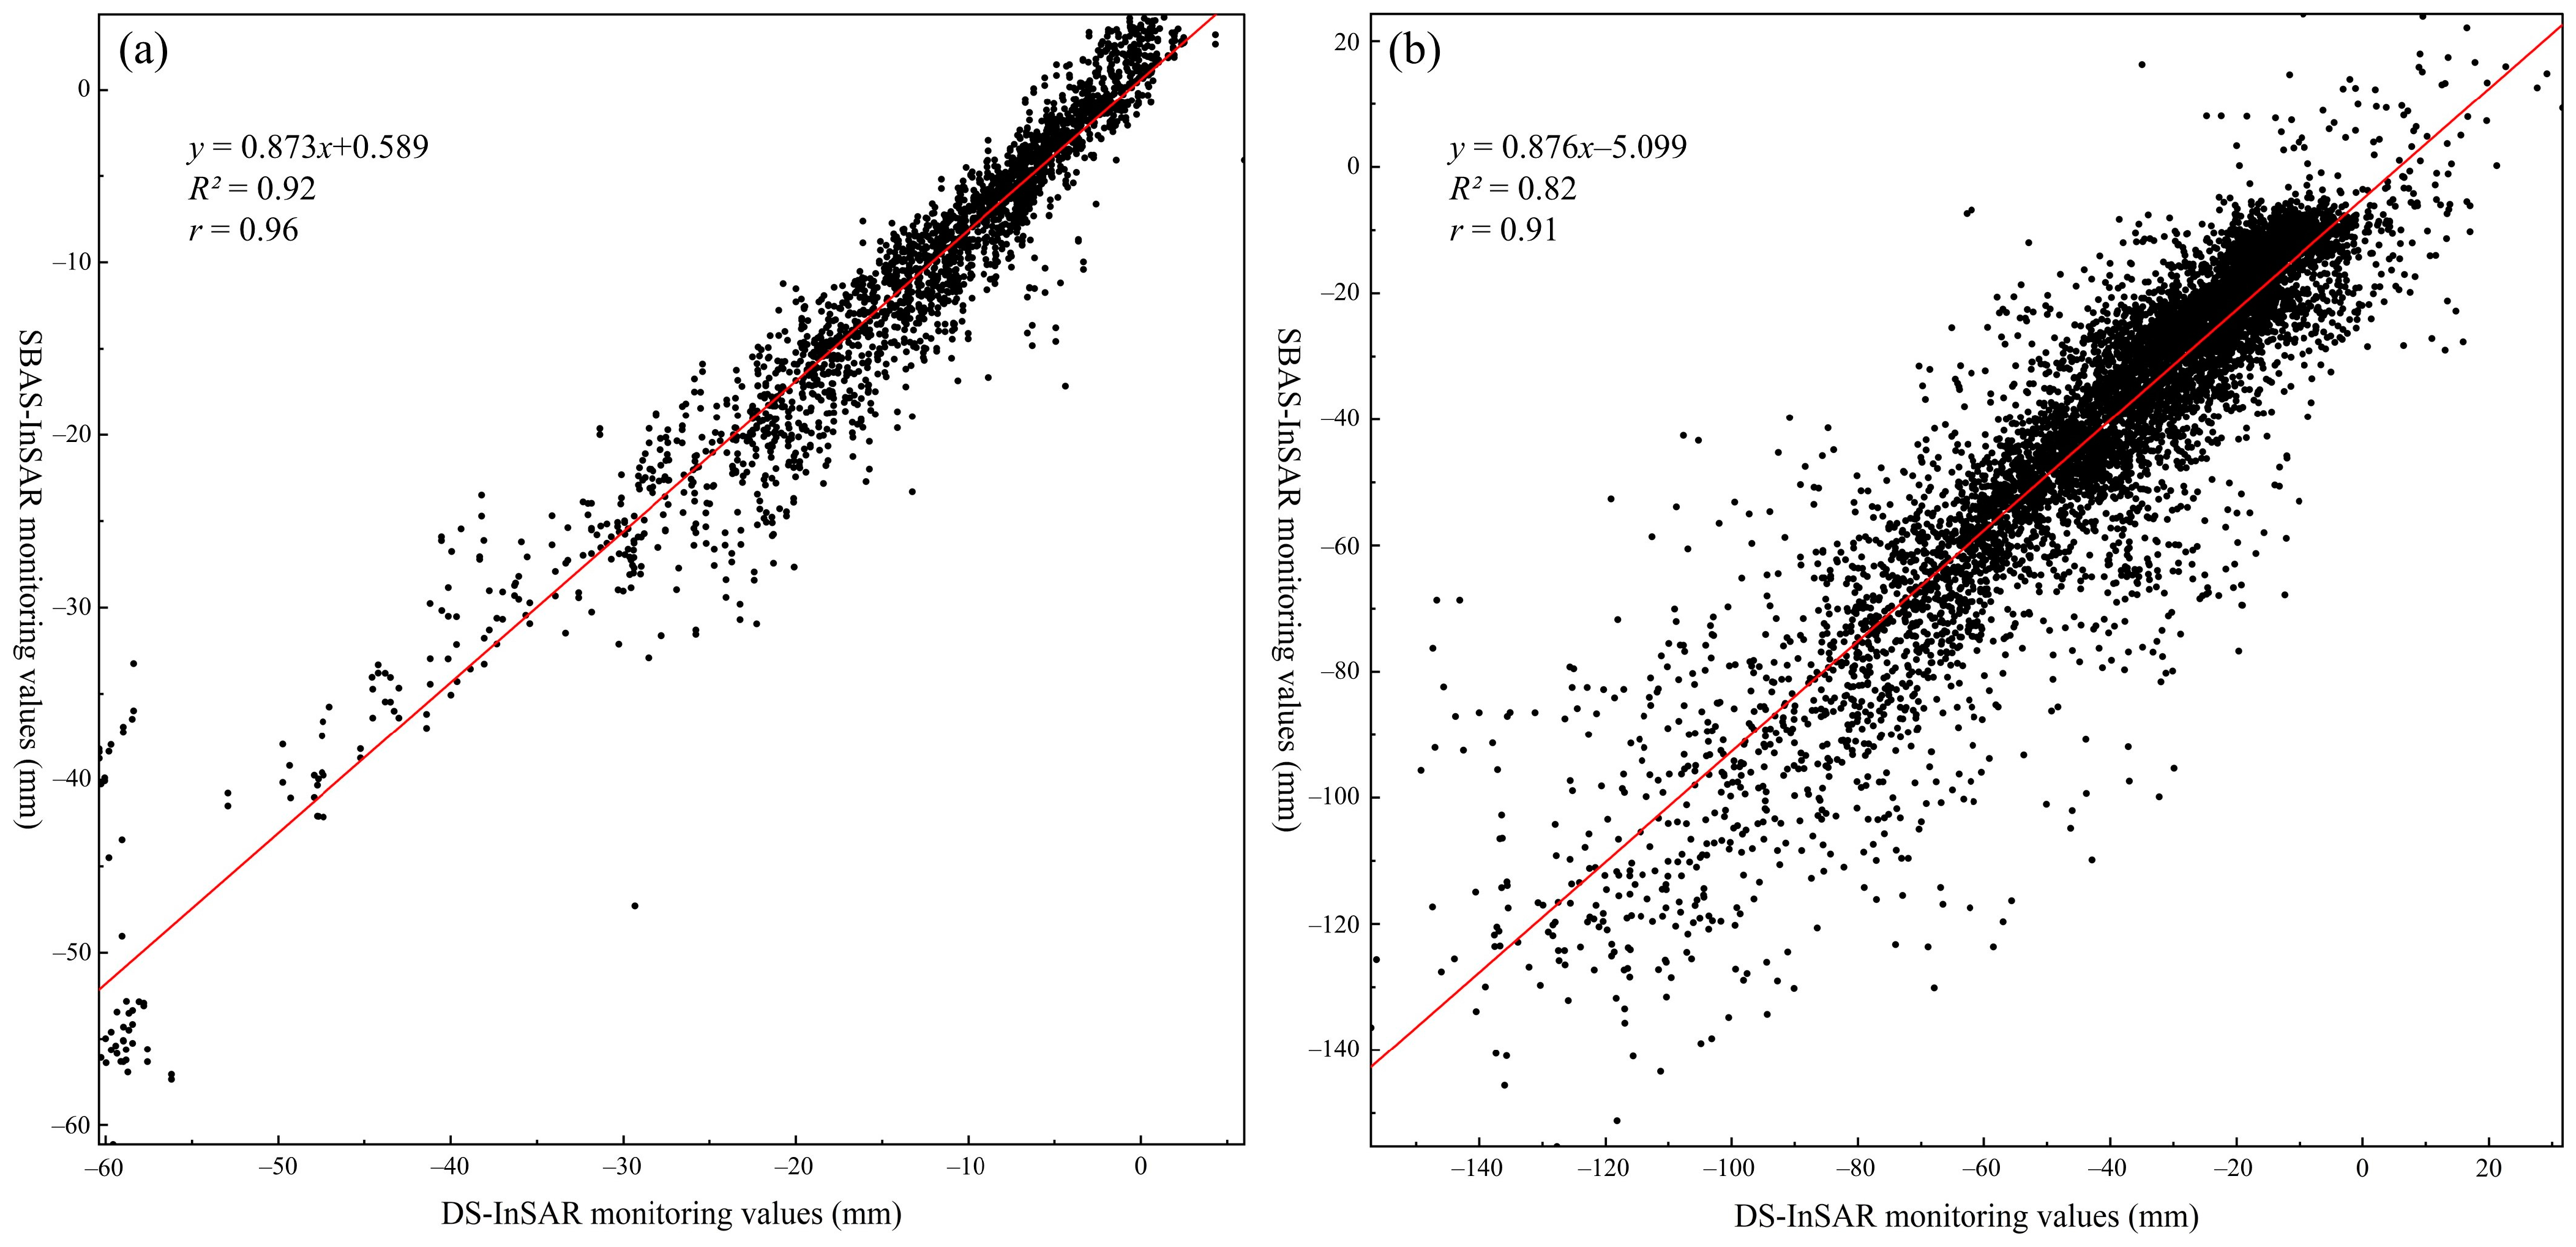
- Having compared the SBAS-InSAR and refined DS-InSAR results for the two mining areas, the monitoring accuracy of the latter’s points is nearly the same as that of the former, but the latter has a higher number of points and a more uniform distribution. Therefore, it reflects the subsidence law of the mining area more comprehensively than does the former. After comparing the refined subsidence results for the mining areas in Wu’an and Inner Mongolia, we found that the topography could affect the mining area’s deformation direction.
7.2. Shortcomings and Prospects
- We will select a new experimental area in which to collect SAR data from various orbits, aiming to obtain more accurate vertical deformation to validate the reliability of the method proposed in this paper.
- In order to compensate for the shortcomings of InSAR in large-gradient monitoring, the other technologies, such as UAV technology, fusion technology, DS-InSAR, etc., will be used to achieve high-precision monitoring in large-gradient-deformation areas.
- We will select SAR data from the same period and process them separately using SBAS-InSAR and our proposed method, and compare the temporal subsidence feature changes of the two results, highlighting the advantages of the results obtained via the proposed method in temporal subsidence feature analysis.
Author Contributions
Funding
Data Availability Statement
Acknowledgments
Conflicts of Interest
References
- Wang, L.; Deng, K.; Zheng, M. Research on ground deformation monitoring method in mining areas using the probability integral model fusion D-InSAR, sub-band InSAR and offset-tracking. Int. J. Appl. Earth Obs. Geoinf. 2020, 85, 101981. [Google Scholar] [CrossRef]
- Yang, Z.; Li, Z.; Zhu, J.; Yi, H.; Feng, G.; Hu, J.; Wu, L.; Preusse, A.; Wang, Y.; Papst, M. Locating and defining underground goaf caused by coal mining from space-borne SAR interferometry. ISPRS J. Photogramm. Remote Sens. 2018, 135, 112–126. [Google Scholar] [CrossRef]
- Zhang, Q.; Huang, G.; Yang, C. Precision space observation technique for geological hazard monitoring and early warning. Acta Geod. Cartogr. Sin. 2017, 46, 1300–1307. [Google Scholar]
- Malinowska, A.A.; Witkowski, W.T.; Guzy, A.; Hejmanowski, R. Mapping ground movements caused by mining-induced earthquakes applying satellite radar interferometry. Eng. Geol. 2018, 246, 402–411. [Google Scholar] [CrossRef]
- Zhang, S.; Zhang, Y.; Yu, J.; Fan, Q.; Si, J.; Zhu, W.; Song, M. Interpretation of the spatiotemporal evolution characteristics of land deformation in beijing during 2003–2020 using sentinel, ENVISAT, and Landsat data. Remote Sens. 2022, 14, 2242. [Google Scholar] [CrossRef]
- Zhang, B.; Wu, S.; Ding, X.; Wang, C.; Zhu, J.; Li, Q. Use of multiplatform SAR imagery in mining deformation monitoring with dense vegetation coverage: A case study in the Fengfeng Mining area, China. Remote Sens. 2021, 13, 3091. [Google Scholar] [CrossRef]
- Carlà, T.; Intrieri, E.; Raspini, F.; Bardi, F.; Farina, P.; Ferretti, A.; Colombo, D.; Novali, F.; Casagli, N. Perspectives on the prediction of catastrophic slope failures from satellite InSAR. Sci. Rep. 2019, 9, 14137. [Google Scholar] [CrossRef] [PubMed]
- Liu, G. Principles and Applications of InSAR; Science Press: Beijing, China, 2019. [Google Scholar]
- Tao, W.; Jia, H.; Kang, M.; Liu, Y. Application of PS-InSAR method based on time series combination in surface deformation monitoring of Xiongxian county and its surrounding areas. Bull. Surv. Mapp. 2023, 1, 101–106. [Google Scholar]
- Yang, C.; Zhang, D.; Zhao, C.; Han, B.; Sun, R.; Du, J.; Chen, L. Ground deformation revealed by Sentinel-1 MSBAS-InSAR time-series over Karamay Oilfield, China. Remote Sens. 2019, 11, 2027. [Google Scholar] [CrossRef]
- Chaussard, E.; Wdowinski, S.; Cabral-Cano, E.; Amelung, F. Land subsidence in central Mexico detected by ALOS InSAR time-series. Remote Sens. Environ. 2014, 140, 94–106. [Google Scholar] [CrossRef]
- Zhu, J.; Li, Z.; Hu, J. Research progress and methods of InSAR for deformation monitoring. Met. Mine 2017, 46, 1717–1733. [Google Scholar]
- Wang, B.; Tan, Z.; Deng, K. Time series monitoring and analysis of surface subsidence in western mining areas based on DS-InSAR. Met. Mine 2022, 5, 160–169. [Google Scholar]
- Liu, Y.; Yang, H.; Fan, J.; Han, J.; Lu, Z. NL-MMSE: A Hybrid Phase Optimization Method in Multimaster Interferogram Stack for DS-InSAR Applications. IEEE J. Sel. Top. Appl. Earth Obs. Remote Sens. 2022, 15, 8332–8345. [Google Scholar] [CrossRef]
- Li, M.; Zhang, S.; Gao, Y. Optimized DS-InSAR technology for time series deformation monitoring in open-pit mines. Met. Mine 2023, 1, 110–118. [Google Scholar]
- Chen, Y.; Li, J.; Li, H.; Gao, Y.; Li, S.; Chen, S.; Guo, G.; Wang, F.; Zhao, D.; Zhang, K. Revealing Land Surface Deformation over the Yineng Backfilling Mining Area, China, by Integrating Distributed Scatterer SAR Interferometry (DS InSAR) and a Mining Subsidence Model. IEEE J. Sel. Top. Appl. Earth Obs. Remote Sens. 2023, 16, 3611–3634. [Google Scholar] [CrossRef]
- Jiang, J.; Du, Y.; Chen, Y.; Liu, G.; Yan, S. Monitoring and analysis of surface deformation in Peibei mining region based on DS-InSAR technique. Bull. Surv. Mapp. 2021, 2, 117. [Google Scholar]
- Li, Y.; Jiang, J.; Du, Y.; Li, Z.; Yan, S. Surface subsidence monitoring by time series InSAR integrating with distributed targets in mining region. J. China Univ. Min. Technol. 2020, 49, 1199–1206. [Google Scholar]
- Zhao, L. Research on Surface Deformation Monitoring Method in Mining Areas Based on DS-InSAR. Master’s Thesis, China University of Mining and Technology, Xuzhou, China, 2022. [Google Scholar]
- Tan, H. Research on the Law of Large Gradient Deformation in Mining Areas Based on the Fusion of Monitoring Data from the Space-Sky-Earth Platform. Doctoral Thesis, Anhui University of Science and Technology, Huainan, China, 2021. [Google Scholar]
- Zhou, D.; An, S.; Wu, K.; Hu, Z.; Diao, X. Key technology and application of InSAR/UAV fusion monitoring for coal mining damages. Coal Sci. Technol. 2022, 50, 121–134. [Google Scholar]
- Gao, Y.; Zhou, D.; An, S.; Wang, L.; Zhang, D.; Zhan, S. Study on surface subsidence in coal mining by UAV-photogrammetry monitoring technology. Coal Sci. Technol. 2022, 50, 57–65. [Google Scholar]
- Di, M.; Zhang, L.; He, Y.; Xu, N.; Qiao, L.; Li, X. Deformation monitoring and analysis of Wu’an subsidence area based on SBAS-InSAR technology. Geogr. Geogr. Inf. Sci. 2021, 37, 52–56. [Google Scholar]
- Li, W. Research on Land Subsidence Monitoring in Handan Mining Area Based on InSAR Technology. Master’s Thesis, Shandong University of Science and Technology, Qingdao, China, 2019. [Google Scholar]
- Yan, D. Application Research on Monitoring Mining Subsidence in Yunjialing Coal Mine Area Based on D-InSAR Technology. Doctoral Thesis, China University of Geosciences Beijing, Beijing, China, 2011. [Google Scholar]
- Yadav, S.K.; Borana, S.L. Monitoring and temporal study of mining area of Jodhpur City using remote sensing and GIS. Int. Res. J. Eng. Technol. 2017, 4, 1732–1736. [Google Scholar]
- Zhang, X. Research on Mining Area Subsidence Monitoring Method Based on UAV Photogrammetry Technology. Master’s Thesis, Hebei University of Engineering, Handan, China, 2019. [Google Scholar]
- Wang, R. Research on Multi-Source Data Fusion Technology and Application for Mining Subsidence Monitoring. Doctoral Thesis, China University of Mining and Technology, Xuzhou, China, 2022. [Google Scholar]
- Zhou, L.; Li, Q.; Quan, F.; Wei, L.; Liao, J. 3D model and accuracy evaluation of tilt photogrammetry based on UAV. Water Power 2020, 46, 41–45+50. [Google Scholar]
- Chen, Q.; Yuan, Y.; Fu, X.; Zhang, W.; Dong, X. Application of UAV photogrammetry technology in emergency investigation of Aniangzhai landslide. Bull. Surv. Mapp. 2023, 1, 77–83+119. [Google Scholar]
- Du, Y.; Yan, S.; Yang, H.; Jiang, J.; Zhao, F. Investigation of deformation patterns by DS-InSAR in a coal resource-exhausted region with Spaceborne SAR imagery. J. Asian Earth Sci. X 2021, 5, 100049. [Google Scholar] [CrossRef]
- DSIpro. Available online: http://mijiang.org.cn/index.php/software/ (accessed on 9 October 2023).
- Peng, K. Research on DS-InSAR Surface Deformation Monitoring in Fukang Coalfield Fire Area, Xinjiang. Master’s Thessis, China University of Mining and Technology, Xuzhou, China, 2021. [Google Scholar]
- Lu, L. Research on DS-InSAR Method for Monitoring Surface Time Series Subsidence in Mining Areas. Master’s Thesis, China University of Mining and Technology, Xuzhou, China, 2020. [Google Scholar]
- Liu, Y. Research on Surface Subsidence Monitoring Method for Filling Mining Area Based on DS-InSAR. Master’s Thesis, China University of Mining and Technology, Xuzhou, China, 2021. [Google Scholar]
- Zhu, J.; Hu, J.; Li, Z.; Sun, Q.; Zheng, W. Recent progress in landslide monitoring with InSAR. Acta Geod. Cartogr. Sin. 2022, 51, 2001–2019. [Google Scholar]
- Wu, H.; Fan, H.; Zheng, C.; Liu, J. Deformation monitoring and analysis of Tailings Dam based on DS-InSAR: A case study of Brumadinho Mine in Brazil. Met. Mine 2023, 3, 169–176. [Google Scholar]
- Liu, Y.; Fan, H.; Wang, L.; Zhuang, H. Monitoring of surface deformation in a low coherence area using distributed scatterers InSAR: Case study in the Xiaolangdi Basin of the Yellow River, China. Bull. Eng. Geol. Environ. 2021, 80, 25–39. [Google Scholar] [CrossRef]
- Wu, S.; Wu, W.; Long, S.; Zhang, T. Application of distributed targets in deformation monitoring of Hongqinghe Coal Mine. J. Geod. Geodyn. 2019, 39, 1261–1264. [Google Scholar]
- Li, Z.; Zhu, W.; Yu, C.; Zhang, Q.; Zhang, C.; Liu, Z.; Zhang, X.; Chen, B.; Du, J.; Song, C. Interferometric synthetic aperture radar for deformation mapping: Opportunities, challenges and the outlook. Acta Geod. Cartogr. Sin. 2022, 51, 1485–1519. [Google Scholar]
- Ferretti, A.; Fumagalli, A.; Novali, F.; Prati, C.; Rocca, F.; Rucci, A. A new algorithm for processing interferometric data-stacks: SqueeSAR. IEEE Trans. Geosci. Remote Sens. 2011, 49, 3460–3470. [Google Scholar] [CrossRef]
- Li, P. A Study on the Interseismic Strain Accumulation in the Western Section of the Altyn Tagh Fault Zone Observed by Wideband InSAR. Doctoral Thesis, Wuhan University, Wuhan, China, 2013. [Google Scholar]
- Wang, Y.; Wang, L.; Li, J.; Jiang, K.; Li, S.; Yang, K.; Liu, H. Full-scale gradient surface deformation monitoring in mining area based on LEV-InSAR model. Met. Mine 2023, 1, 134–141. [Google Scholar] [CrossRef]
- Li, Z.; Song, C.; Yu, C.; Xiao, R.; Chen, L.; Luo, H.; Dai, K.; Ge, D.; Ding, Y.; Zhang, Y. The application of satellite radar remote sensing in landslide disaster detection and monitoring: Challenges and countermeasures. Geomat. Inf. Sci. Wuhan Univ. 2019, 44, 967–979. [Google Scholar]
- Howladar, M.F.; Hasan, K. A study on the development of subsidence due to the extraction of 1203 slice with its associated factors around Barapukuria underground coal mining industrial area, Dinajpur, Bangladesh. Environ. Earth Sci. 2014, 72, 3699–3713. [Google Scholar] [CrossRef]


| Region | Sensor | Wavelength (cm) | Numbers | Orbit Directions | Start Date | End Date |
|---|---|---|---|---|---|---|
| Wu’an | Sentinel-1A | 5.56 | 11 | Ascending | 4 November 2018 | 4 March 2019 |
| Inner Mongolia | Sentinel-1A | 5.56 | 12 | Ascending | 11 June 2018 | 21 October 2018 |
| Region | UAV | Camera | Forward Overlap (%) | Side Overlap (%) | Flight Altitude | Acquisition Date |
|---|---|---|---|---|---|---|
| Wu’an | Trimble UX5 | CCD | 80 | 80 | 150 | 28 April 2018 |
| Inner Mongolia | Trimble UX5 | SONY A5100 | 80 | 80 | 230 | 9 June 2018 |
| Type of Error | Wu’an | Inner Mongolia | ||
|---|---|---|---|---|
| SRTM DEM | Fused DEM | SRTM DEM | Fused DEM | |
| RMSE (mm) | 8.8 | 6.8 | 69.7 | 68.2 |
| MAE (mm) | 6.3 | 4.6 | 60.5 | 58.8 |
| Type of Error | Ground Object Type | ||
|---|---|---|---|
| Shrub | Grassland | Farmland with Dirt Roads | |
| RMSE (mm) | 3.5 | 2.9 | 2.4 |
| MAE (mm) | 2.8 | 2.2 | 2.0 |
| Wu’an | Inner Mongolia | |
|---|---|---|
| Maximum | 0.94 | 0.89 |
| Minimum | 0.25 | 0.19 |
| Average | 0.54 | 0.49 |
Disclaimer/Publisher’s Note: The statements, opinions and data contained in all publications are solely those of the individual author(s) and contributor(s) and not of MDPI and/or the editor(s). MDPI and/or the editor(s) disclaim responsibility for any injury to people or property resulting from any ideas, methods, instructions or products referred to in the content. |
© 2023 by the authors. Licensee MDPI, Basel, Switzerland. This article is an open access article distributed under the terms and conditions of the Creative Commons Attribution (CC BY) license (https://creativecommons.org/licenses/by/4.0/).
Share and Cite
Zhao, J.; Yang, X.; Zhang, Z.; Niu, Y.; Zhao, Z. Mine Subsidence Monitoring Integrating DS-InSAR with UAV Photogrammetry Products: Case Studies on Hebei and Inner Mongolia. Remote Sens. 2023, 15, 4998. https://doi.org/10.3390/rs15204998
Zhao J, Yang X, Zhang Z, Niu Y, Zhao Z. Mine Subsidence Monitoring Integrating DS-InSAR with UAV Photogrammetry Products: Case Studies on Hebei and Inner Mongolia. Remote Sensing. 2023; 15(20):4998. https://doi.org/10.3390/rs15204998
Chicago/Turabian StyleZhao, Jinqi, Xuhai Yang, Zhaojiang Zhang, Yufen Niu, and Zheng Zhao. 2023. "Mine Subsidence Monitoring Integrating DS-InSAR with UAV Photogrammetry Products: Case Studies on Hebei and Inner Mongolia" Remote Sensing 15, no. 20: 4998. https://doi.org/10.3390/rs15204998