Article

A Novel Method for Monitoring Tropical Cyclones’ Movement Using GNSS Zenith Tropospheric Delay

1
School of Geography Science and Geomatics Engineering, Suzhou University of Science and Technology, Suzhou 215009, China
2
Research Center of Beidou Navigation and Environmental Remote Sensing, Suzhou University of Science and Technology, Suzhou 215009, China
3
School of Environment Science and Spatial Informatics, China University of Mining and Technology, Xuzhou 221116, China
4
SPACE Research Centre, School of Science, RMIT University, Melbourne, VIC 3000, Australia
5
Bei-Stars Geospatial Information Innovation Institute, No. 1 Xinbei Road Pukou District, Nanjing 211899, China
6
School of Resources and Architectural Engineering, Gannan University of Science and Technology, Ganzhou 341001, China
7
Suzhou Industrial Park, Surveying and Mapping Geographic Information Co., Ltd., Suzhou 215027, China
8
Guangzhou Urban Planning and Design Survey Research Institute, Guangzhou 510060, China
*
Author to whom correspondence should be addressed.
Remote Sens. 2023, 15(13), 3247; https://doi.org/10.3390/rs15133247
Submission received: 23 May 2023 / Revised: 20 June 2023 / Accepted: 21 June 2023 / Published: 23 June 2023
(This article belongs to the Special Issue Beidou/GNSS Precise Positioning and Atmospheric Modeling II)

Abstract

:
Precipitable water vapor (PWV) is an important meteorological factor for predicting extreme weather events such as tropical cyclones, which can be obtained from zenith tropospheric delay (ZTD) by using a conversion. A time difference of ZTD arrival (TDOZA) model was proposed to monitor the movement of tropical cyclones, and the fifth-generation reanalysis dataset of the European Centre for Medium-range Weather Forecasting (ERA5)-derived ZTD (ERA5-ZTD) was used to estimate the movement of tropical cyclones based on the model. The global navigation satellite system-derived ZTD and radiosonde data-derived PWV (RS-PWV) were used to test the accuracy of the ERA5-ZTD and analyze the correlation between ZTD and PWV, respectively. The statistics showed that the mean Bias, RMS and STD of the ERA5-ZTD were 6.4 mm, 17.1 mm and 16.5 mm, respectively, and the mean correlation coefficient of the ERA5-ZTD and RS-PWV was 0.951, which indicates that the ZTD can be used to predict weather events instead of PWV. Then, spatiao-temporal characteristics of ZTD during the four tropical cyclone (i.e., Merbok, ROKE, Neast and Hato) periods in 2017 were analyzed, and the result showed that the moving directions of ZTD and the tropical cyclones were consistent. Thus, the ZTD time series over the ERA5 grids around the tropical cyclones’ paths were used to estimate the velocity of the tropical cyclones based on the TDOZA model, when the tropical cyclones are approaching or leaving. Compared with the result from the China Meteorological Administration, the mean absolute and relative deviations of the TDOZA model-derived velocity were 2.55 km/h and 10.0%, respectively. These results suggest that ZTD can be used as a new supplementary meteorological parameter for monitoring tropical cyclone events.

1. Introduction

A tropical cyclone is an intense, rotating storm system that frequently occurs each summer near the North Pacific, Indian and North Atlantic Oceans, and tends to cause strong winds, high humidity and storm surges [1]. Tropical cyclones are formed when seawater evaporates into the atmosphere due to the heat of the sun’s radiation in summer, creating a center of low pressure [2]. Because tropical cyclones carry large amounts of energy and water vapor, storm surges and heavy rainfall events usually occur around the path of the tropical cyclones, which can threaten the safety, economy and property of people [3]. Therefore, the movement characteristics of tropical cyclones can be further analyzed by sensing the water vapor changes before and after the entry of the tropical cyclones.
Precipitable water vapor (PWV) is the total amount of water vapor contained in a nominal column of air, which can be used to reflect water vapor content [4]. PWV is an important meteorological factor for forecasting several extreme weather and climate events such as heavy rainfall, tropical cyclone, drought and the El Nino warm current [5,6,7,8,9,10]. Traditional techniques for detecting PWV, such as infrared satellite remote sensing, radiosondes (RS) and microwave radiometers [11,12,13], have the disadvantages of insufficient temporal resolution, high cost and susceptibility to prevailing weather conditions, making it difficult to study the characteristics of rapid water vapor changes under short-term extreme weather events. Since Bevis et al. proposed the ground-based global navigation satellite system (GNSS) meteorology technique [14], the technique has gradually become one of the most important methods for the retrieval of water vapor with high accuracy and high temporal and spatial resolution under all weather conditions. Numerous previous studies have demonstrated that the accuracy of GNSS-derived PWV (GNSS-PWV) and ZTD (GNSS-ZTD) are about 1–2 mm and 5–15 mm [15,16,17], respectively, compared with the RS, microwave radiometer and very long baseline interferometry, which can be used to establish the monitoring and forecasting models of extreme weather events (e.g., typhoon, heavy precipitation and heat wave) [18,19,20].
Previous studies have shown that the variation of GNSS-PWV time series is significantly correlated with a tropical cyclone’s landing, and it can be summarized as follows: when a tropical cyclone was approaching a GNSS station, the GNSS-PWV would suddenly increase; when tropical cyclones began to move away from the station, the GNSS-PWV would suddenly decrease [21,22,23]. Then, Tang et al. [24] and He et al. [25] analyzed the relationship between the GNSS-PWV time series and a typhoon’s position, and found that the PWV content during a typhoon’s period could reflect the life cycle of the typhoon. Nykiel et al. [18] used the GNSS-PWV, the rate of the GNSS-PWV and the tropospheric gradients maps to monitor the derecho event, which can be applied to both the direction and speed of the phenomena as well as the time and place of the occurrence of the main phase of the derecho. Won and Kim [26] analyzed the fluctuating pattern of the normalized GNSS-PWV and the moving speed of the PWV in the Korean peninsula during typhoon Ewiniar’s period, and the result indicated that the moving speed of the PWV was similar to the average moving speed of the typhoon. Zhao et al. [27] proposed a new typhoon-monitoring method using PWV, and then the method was improved by using real-time GNSS-PWV [28,29]. Kang and Park [30] proposed the concept of the predicted location of a typhoon to predict a typhoon’s location by using GNSS-PWV, and the result showed that it can be used as supplementary information for the current typhoon forecast. These experiments [26,27,28,29,30] showed that the accuracy of estimated tropical cyclones’ velocity by using PWV data is about 2–4 km/h.
The above studies using PWV time series have verified the availability of forecasting and monitoring a tropical cyclone. The PWV can be converted by ZTD, and the conversion between the ZTD and PWV requires meteorological observations. However, many GNSS stations are either not equipped with meteorological sensors or the surrounding meteorological stations are relatively far away, which will reduce the conversion acracy of PWV. Zhao et al. [31] pointed out that the ZTD time series can replace the PWV time series for forecasting weather events, when the variation trends of the ZTD and PWV time series are similar. Some researchers [32,33,34] have proven that the ZTD can be used to detect heavy rainfall events, and the correct detection and false rate are about 85% and 66%. Zhao et al. [35] proposed a new drought monitoring model to accurately calculate potential evapotranspiration by ZTD and temperature, and the results highlight the excellent performance of the proposed HDM model under different month scales. The above results using ZTD are almost consistent with those obtained using PWV.
Thus, to verify the availability of monitoring a tropical cyclone by using ZTD, a novel method for monitoring tropical cyclones was proposed in this paper. The fifth-generation reanalysis dataset of the European Centre for Medium-range Weather Forecasting (ERA5) derived ZTD (ERA5-ZTD) dataset was used to study the spatio-temporal characteristics of tropical cyclones and estimate the movement of the tropical cyclones, and the results were validated based on references provided from the China Meteorological Administration (CMA). The following part of this paper consists of three parts: Section 2 introduces the principles of estimating GNSS-ZTD, ERA5-ZTD and PWV derived from RS (RS-PWV), the theory of estimating tropical cyclones’ movement using ZTD datasets, the data source and the processing strategy. Section 3 shows the results of testing the accuracy of the ERA5-ZTD time series compared with the ZTD time series provided by the International GNSS Service (IGS-ZTD), analyzing the correlation between ERA5-ZTD and RS-PWV time series, analyzing the spatiao-temporal distribution of the ZTD during tropical cyclones’ periods and testing the accuracy of the tropical cyclones’ movement using ZTD based on the novel method. Section 4 and Section 5 are the discussion and conclusion of this paper, respectively.

2. Materials and Methods

2.1. Estimation of ZTD Derived from GNSS and ERA5 Dataset

Satellite radio signals are delayed by atmospheric interference during the transmission path. The influence in the ionosphere can be eliminated by using the ionospheric-free model [36], while the delay in the troposphere is related to the atmospheric refractive index. The delay can be expressed as:
l = n d s l = n 1 d s + s l
where Δl is the tropospheric delay (unit: m); n is the atmospheric refractive index; s and l are the signal transmission distance (unit: m) and geometric distance (unit: m) between the satellite and receiver, respectively. The (sl) is the signal refraction error, which is small and usually can be ignored [37]. Thus, Equation (1) can be expressed as:
l n 1 d s = 10 6 N d s
where N is the refractivity. The N can be estimated by using the model proposed by Thayer et al. [38], which can be expressed as:
N = k 1 P e T + k 2 e T + k 3 e T 2
where k1, k2 and k3 are constant, and their value can be found in [14,38,39,40]; P, Pe and e are the total pressure (unit: hPa), the partial pressure of dry air (unit: hPa) and water vapor (unit: hPa), respectively; T is the temperature (unit: K). When the signal path s is vertical, the delay Δl is called ZTD and can be expressed as:
Z T D = 10 6 h 0 h t r o N d h
where h0 and htro are the height of the ground (unit: m) and troposphere (unit: m), respectively. For the GNSS observations, the ZTD was set to an unknown parameter and can be estimated by using GNSS processing software such as Bernese and GAMIT/GLOBK [41,42]. For the ERA5 dataset, the ZTD can be estimated by using the pressure-level layered reanalysis data. In Equation (3), the T and P can be obtained from the ERA5 dataset, and the e can be calculated based on the following formula [43]:
e = Q × P 0.622 + 0.378 × Q    
where Q is specific humidity from the ERA5 datasets. Then, the ZTD can be estimated by using the following formula:
Z T D = i = 1 m N i × h i = i = 1 m ( k 1 P i e i T i + k 2 e i T i + k 3 e i T i 2 ) h i
where i is the index of layers; m is the total number of layers; Ni, Pi, ei and Ti are the refractivity, pressure (hPa), partial pressure (hPa) of water vapor and temperature (K) of the ith layer; Δhi is the height difference of adjacent layers.
Due to the difference between the geopotential height of ERA5 grids and the ellipsoid height of GNSS stations, a height conversion between geopotential and ellipsoid systems needs to be performed. The WGS-84 ellipsoid height can be converted to a geoid height by using the Earth Gravitational Model 2008 [44], and the geoid height can be converted to a geopotential height by using the conversion model in reference [45]. In addition, the positions of an ERA5 grid and a GNSS station are usually different. Thus, the cubic spline interpolation was used to obtain meteorological parameters for the height of the GNSS station, and the inverse distance weighted method was further used to obtain the interpolated parameters for the horizontal position of the GNSS station.

2.2. Estimation of PWV from Radiosonde Datasets

The radiosonde is a technique of sounding the upper atmospheric parameters with high accuracy, and the radiosonde datasets generally include the profiles of meteorological parameters (i.e., pressure, temperature, dew point temperature, relative humidity, etc.) over the radiosonde station. The meteorological parameters can be used to calculate PWV by using the following formula:
P W V = 0 P s Q d P g i = 2 n P i P i 1 Q i + Q i 1 2 g
where PS is the ground pressure (hPa); g is the local gravitational acceleration (m/s2); Pi and Pi−1 are pressure (hPa) of the ith and (i−1)th layer, respectively; Qi and Qi−1 are specific humidity of the ith and (i − 1)th layers, respectively.
When the Q is unavailable and relative humidity is available in radiosondes datasets, the Q can be calculated by:
Q = 0.622 e P 0.378 e e = r h × 6.11 × 10 7.5 T 237.3 + T
where rh is relative humidity.
The radiosonde-derived PWV (RS-PWV) time series of accuracy is usually better than 1.5 mm, but the time resolution of the RS-PWV time series is relatively low, and usually two or three times a day (i.e., UTC0, UTC12 or UTC0, UTC8, UTC16). Thus, the RS-PWV time series are usually used to test the accuracy of PWV derived from the GNSS and satellite remote sensing.

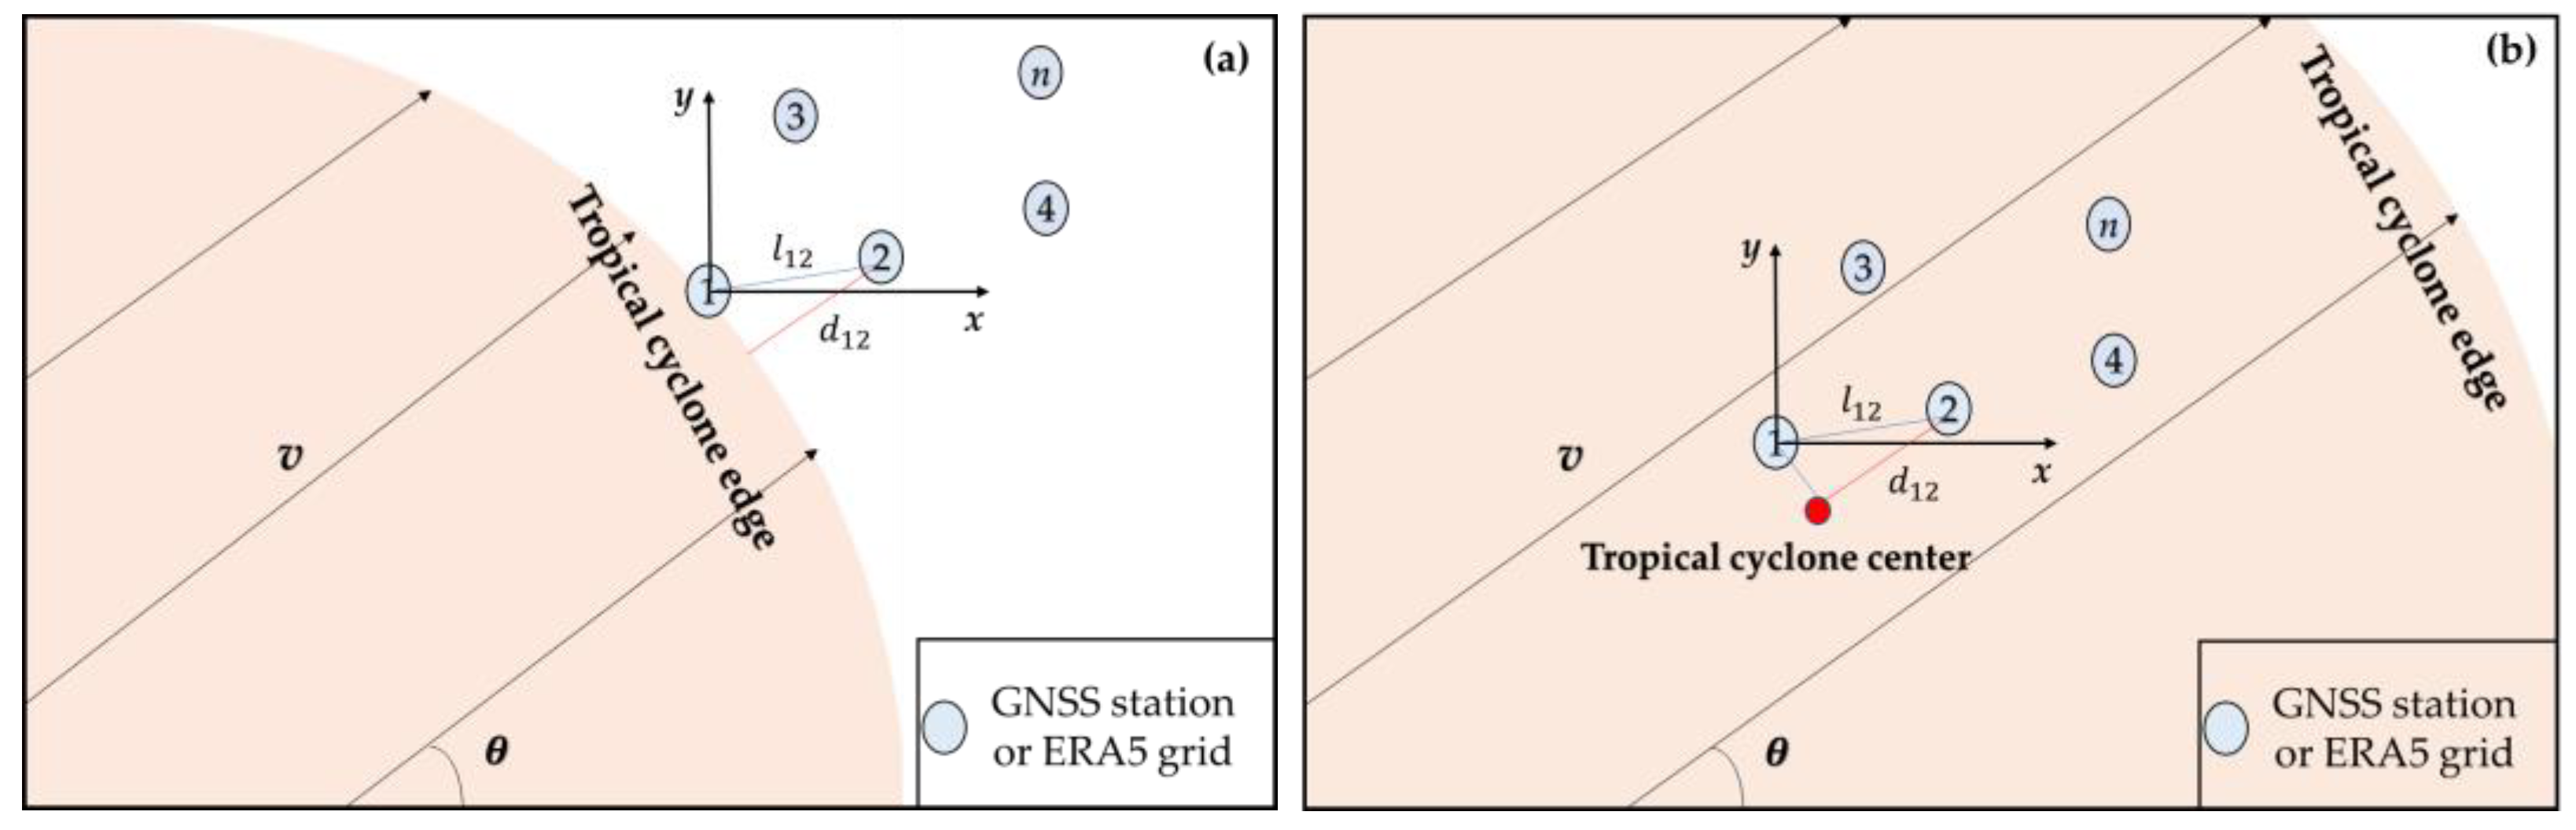
2.3. Estimation of Tropical Cyclones’ Movement Using ZTD Datasets

Since tropical cyclones carry a lot of water vapor, the moving trend of tropical cyclones can be predicted by monitoring the moving path of PWV. Previous studies [6,46] have shown that spatial and temporal variations of the PWV time series and the ZTD time series were similar, and there is a high correlation between the two time series under extreme weather (e.g., tropical cyclones and heavy rainfalls). Therefore, we can consider using ZTD instead of PWV to forecast the movement of tropical cyclones.
Many studies [27,28,29,30] have shown that when a tropical cyclone approaches a GNSS station, the PWV and ZTD over the station will significantly increase, and when it begins to move from the station, the PWV and ZTD will reach their maximum and begin to significantly decrease. Thus, the time of the sudden increase and decrease in ZTD time series over several stations can be used to estimate a tropical cyclone’s movement. Figure 1 shows the geometric relationship between a tropical cyclone and sites (i.e., GNSS stations or ERA5 grids).
In Figure 1a,b, the edge and center of a tropical cyclone move or are closest to the first site, and this is the time t1 when the ZTD begins to suddenly increase or decrease over the first site, respectively. With the movement of the tropical cyclone, there is a time difference in ZTD arrival (TDOZA) between any two sites due to the different geometric positions of the sites. When the tropical cyclone moves from the first site to the second site with velocity v and direction angle θ, the tropical cyclone advances the distance of d12 to the second site at the time t2. The l12 is the distance between the first site and the second site and approximately d12 when the azimuth (θij) of l12 is approximately θ or θ ± 180°. For the ith site on the edge of the tropical cyclone and any jth (i < j) site, the azimuth of lij can be expressed as:
θ i j = arctan y j y i x j x i
where (xi, yi) and (xj, yj) are the two-dimensional coordinates of the ith site and the jth site, respectively. When the difference between θij and θ is very small, the tropical cyclone advances and the distance of dij can be calculated by the following formula.
d i j = l i j × cos θ θ i j = cos θ θ i j   x i x j 2 + y i y j 2
The Δtij is the TDOZA between the ith site and the jth site; two models of a tropical cyclone’s movement were considered:
(1)
The v is constant
The tropical cyclone keeps a uniform and straight motion along the direction of angle θ, and the dij in Equation (10) can be calculated from:
d i j = v t i j = l i j × cos θ θ i j
In Equation (11), v and θ are both unknown parameters to be estimated, and let Δtij = tk, θij = θk, lij = lk. Thus, the kth observation equation can be expressed as:
L k v , θ = v × t k cos θ θ k ,   k = 1 , 2 , 3 n
where n is the number of observations used in Equation (10), and the residual rk can be expressed as:
r k = l k L k v , θ
Equation (12) is linearized using the first-order Taylor formula:
l k L k v 0 m , θ 0 m + L m v , θ v | v = v 0 m , θ = θ 0 m v v 0 m + L m v , θ θ | v = v 0 m , θ = θ 0 m θ θ 0 m
where vm0 and θm0 are the values of the mth iteration of v and θ, respectively. Then, Equation (13) can be expressed by using a matrix form:
r = A b
where A is the Jacobian matrix of L(v, θ). For the mth iteration, Am and bm can be expressed as:
A m = t 1 cos ( θ 0 m θ 1 ) sin ( θ 0 m θ 1 ) v 0 m t 1 cos 2 ( θ 0 m θ 1 ) t 2 cos ( θ 0 m θ 2 ) sin ( θ 0 m θ 2 ) v 0 m t 2 cos 2 ( θ 0 m θ 2 ) t n cos ( θ 0 m θ n ) sin ( θ 0 m θ n ) v 0 m t n cos 2 ( θ 0 m θ n ) b m = v v 0 m θ θ 0 m
In Equation (16), there are two parameters to be estimated, and it can be solved by using the least squares method when the number of observations exceeds 2:
q = A T A 1 A T r
Let qm be the estimated result from the mth iteration, and the θ and v of the (m + 1)th iteration are updated:
v 0 m + 1 θ 0 m + 1 = v 0 m θ 0 m + q
The results of the new values are substituted into Equation (14), and the process is repeated when the value of q is under a pre-defined threshold or rkrk−1 can be neglectable.
(2)
The v is changeable
The tropical cyclones move in a straight line with an acceleration a, and the dij in Equation (10) can be calculated from:
d i j = v i t i j + 1 2 a t i j 2 = v 0 + a t i 1 t i j + 1 2 a t i j 2 = l i j · cos θ θ i j
where, v, θ and a are all unknown parameters to be estimated, and let Δtij = tk1, Δti1 = tk2,θij = θk, lij = lk. Then, Equation (12) is corrected as:
L k v , θ , a = v t k 1 + a 1 2 t k 1 2 + t k 1 t k 2 cos θ θ k ,   k = 1 , 2 , 3 n
the residual rk can be expressed as:
r k = l k L k v , θ , a
Equation (20) is linearized using the first-order Taylor formula:
l k L k v 0 m , θ 0 m , a 0 m + L m v , θ , a v | v = v 0 m , θ = θ 0 m , a = a 0 m v v 0 m + L m v , θ , a θ | v = v 0 m , θ = θ 0 m , a = a 0 m θ θ 0 m + L m v , θ , a a | v = v 0 m , θ = θ 0 m , a = a 0 m a a 0 m
where am0 is the value of the mth iteration of a, respectively. Similarly, in Equation (15), Am and bm can be expressed as:
A m = t 11 cos ( θ 0 m θ 1 ) sin θ 0 m θ 1 [ v 0 m t 11 + a 0 m ( t 11 2 2 + t 11 t 12 ) ] cos 2 ( θ 0 m θ 1 ) t 11 2 2 + t 11 t 12 cos ( θ 0 m θ 1 ) t 21 cos ( θ 0 m θ 2 ) sin θ 0 m θ 2 [ v 0 m t 21 + a 0 m ( t 21 2 2 + t 21 t 22 ) ] cos 2 ( θ 0 m θ 2 ) t 21 2 2 + t 21 t 22 cos ( θ 0 m θ 2 ) t n 1 cos ( θ 0 m θ n ) sin θ 0 m θ n [ v 0 m t n 1 + a 0 m ( t n 1 2 2 + t n 1 t n 2 ) ] cos 2 ( θ 0 m θ n ) t n 1 2 2 + t n 1 t n 2 cos ( θ 0 m θ n ) b m = v v 0 m θ θ 0 m a a 0 m
In Equation (23), there are three parameters to be estimated, and it can be solved by using the least squares method when the number of observations exceeds 3. Plugging Am and rm into Equation (17), the θ, v and a of the (m + 1)th iteration are updated:
v 0 m + 1 θ 0 m + 1 a 0 m + 1 = v 0 m θ 0 m a 0 m + q
The results of the new values are substituted into Equation (22), and the process is repeated when the value of q is under a pre-defined threshold or rkrk−1 can be neglectable.

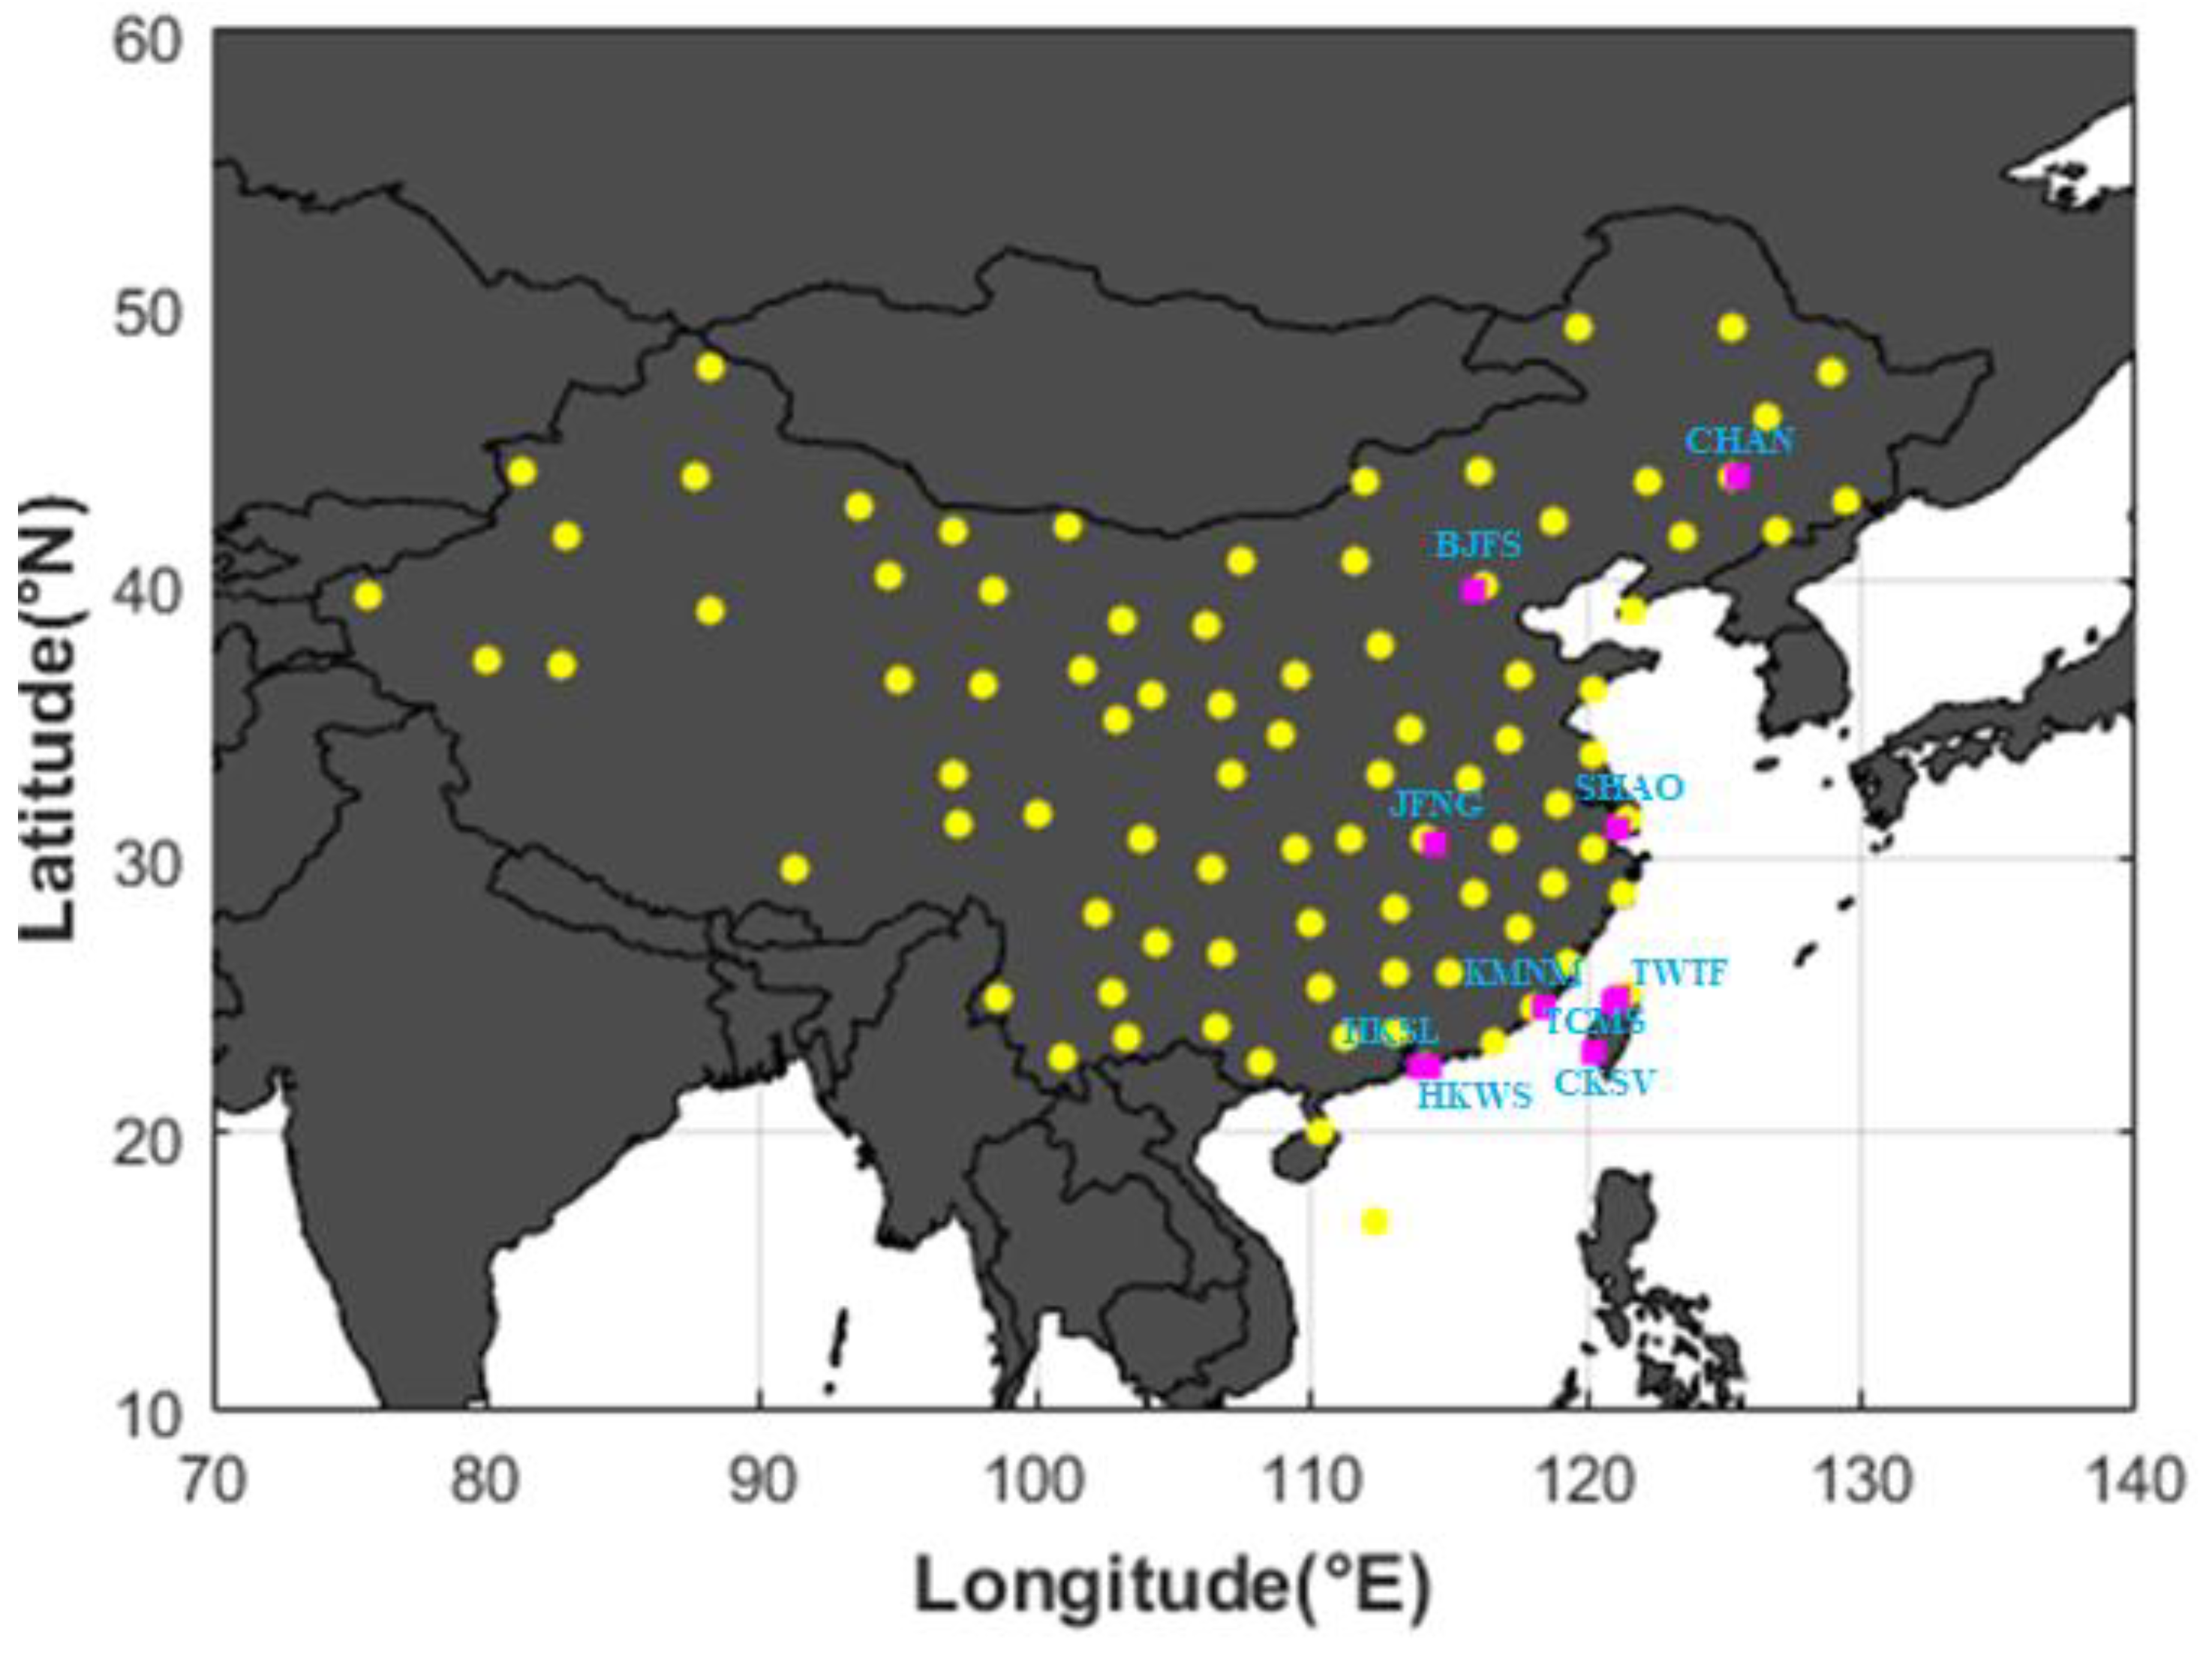
2.4. Data Source and Date Processing

China is located in the northern half of the Eastern Hemisphere, the eastern part of Eurasia and the west coast of the Pacific Ocean. The southeast coastal area of China is invaded by tropical cyclones every year, which is one of the areas where tropical cyclone events most frequently occur in the world. Several cases of tropical cyclones in China were selected to test the availability of calculating tropical cyclone movement using ZTD data based on the proposed TDOZA model in this experiment. Apart from the ZTD data from ERA5 reanalysis products, a variety of other data were used for the case studies of tropical cyclones in 2017. The data used in the study mainly included:
(1)
ERA5 pressure, temperature and specific humidity grids with a spatial resolution of 0.25° × 0.25° and a temporal resolution of an hour at 37 height levels in 2017 (https://cds.climate.copernicus.eu/#!/home, accessed on 22 May 2023);
(2)
Post-processed ZTD time series with a temporal resolution of 5 min over GNSS stations from the International GNSS Service (IGS) in 2017 (https://cddis.nasa.gov/archive/gnss/products/troposphere/zpd, accessed on 22 May 2023);
(3)
RS data with a time resolution of 12 h from the University of Wyoming’s department of atmospheric sciences in 2017 (http://weather.uwyo.edu/upperair/sounding.html, accessed on 22 May 2023);
(4)
The track and intensity analyses from the Tropical Cyclone Best Track (TCBT) dataset [47,48] provided by CMA in 2017 (http://tcdata.typhoon.org.cn, accessed on 22 May 2023);
Dataset (1) was used to obtain ZTD (i.e., ERA5-ZTD) datasets by using Equation (6), and then the ZTD datasets were used to study the characteristics and movements of tropical cyclones based on the proposed TDOZA model. Dataset (2) includes the ZTD time series over 11 GNSS stations used to test the accuracy of the ERA5-ZTD datasets, and the geodetic coordinates and elevations (i.e., WGS-84 ellipsoid height) of the 10 GNSS stations are listed in Table 1. Dataset (3) includes RS profiles over 89 stations, which were used to obtain PWV (RS-PWV) datasets by using Equation (7), and then the RS-PWV datasets were used to study the correlation relationship between ERA5-ZTD and RS-PWV. Figure 2 shows the geographical distribution of the GNSS stations (purple squares) and the RS stations (yellow circles). Dataset (4) includes the track and intensity information of 4 selected tropical cyclones (i.e., the Severe Tropical Storm Merbok, Tropical Storm Roke, Typhoon Nesat and Super Typhoon Hato), and was used to obtain the tropical cyclones’ movement as the reference for testing the accuracy of the TDOZA model.

3. Results

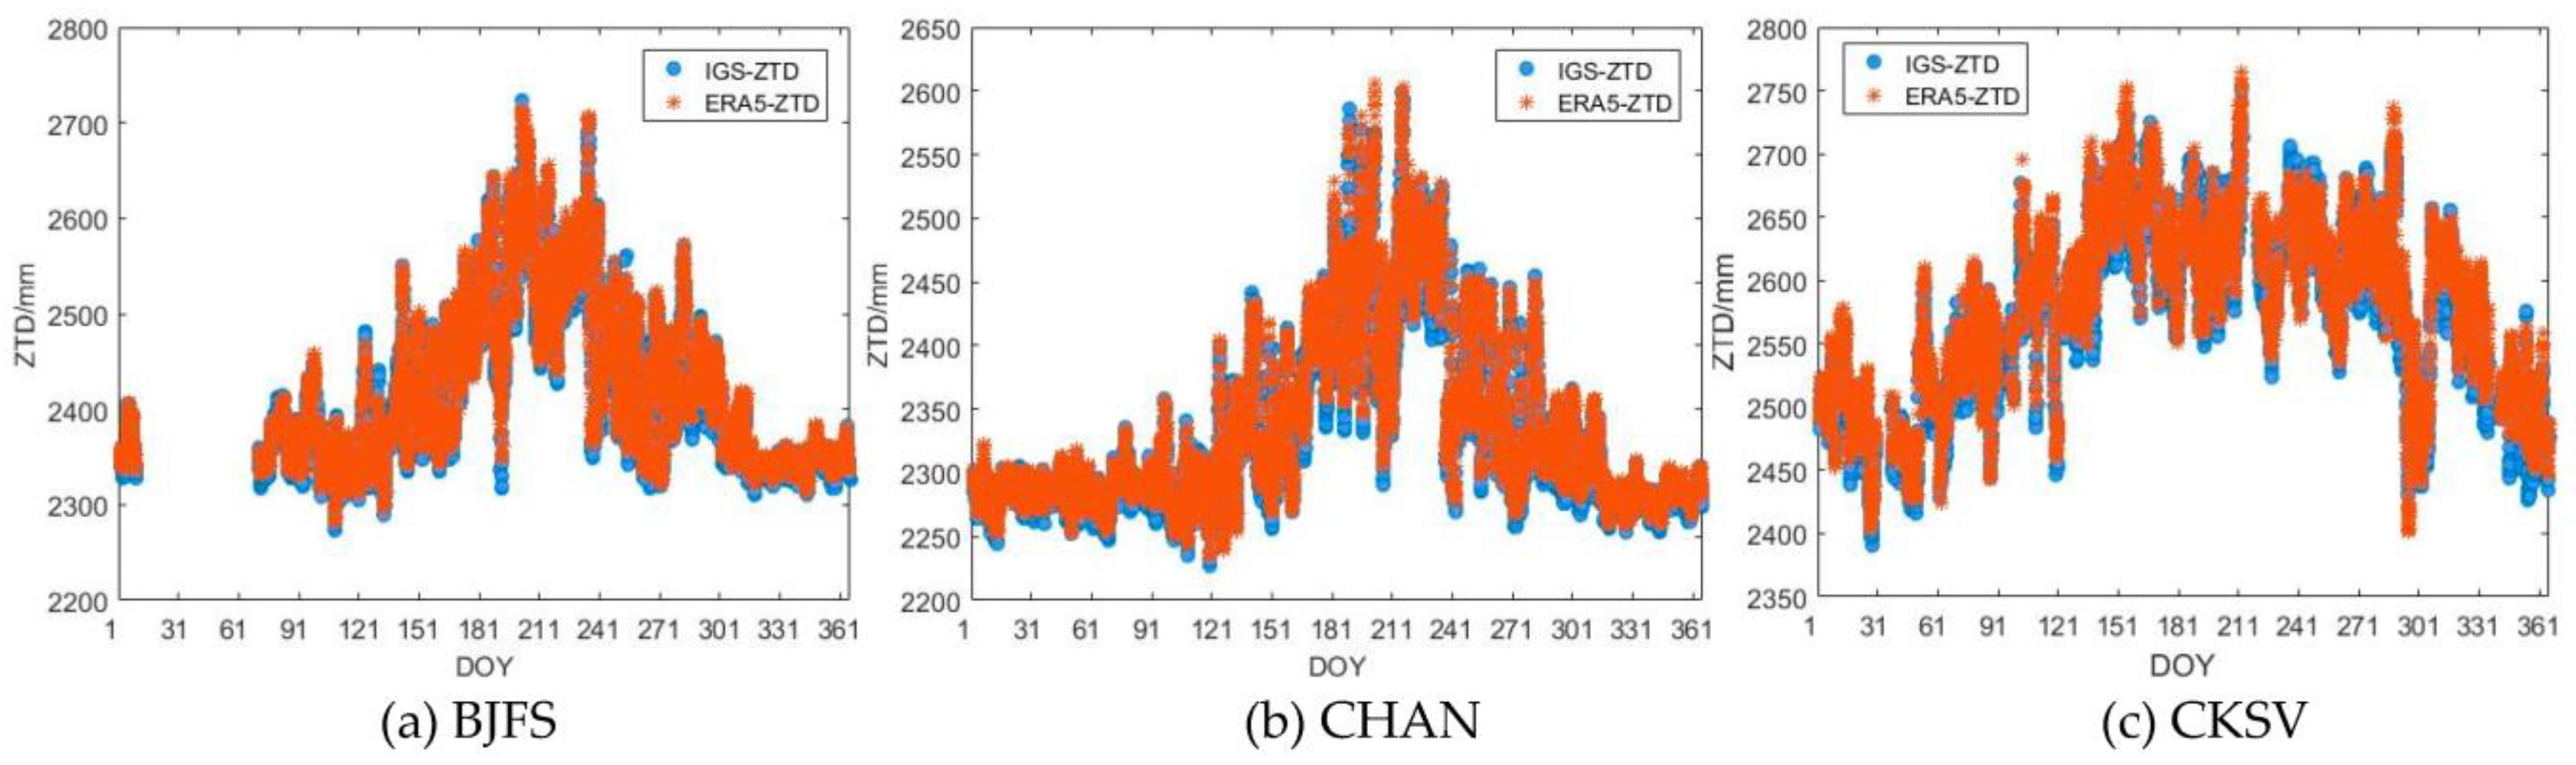
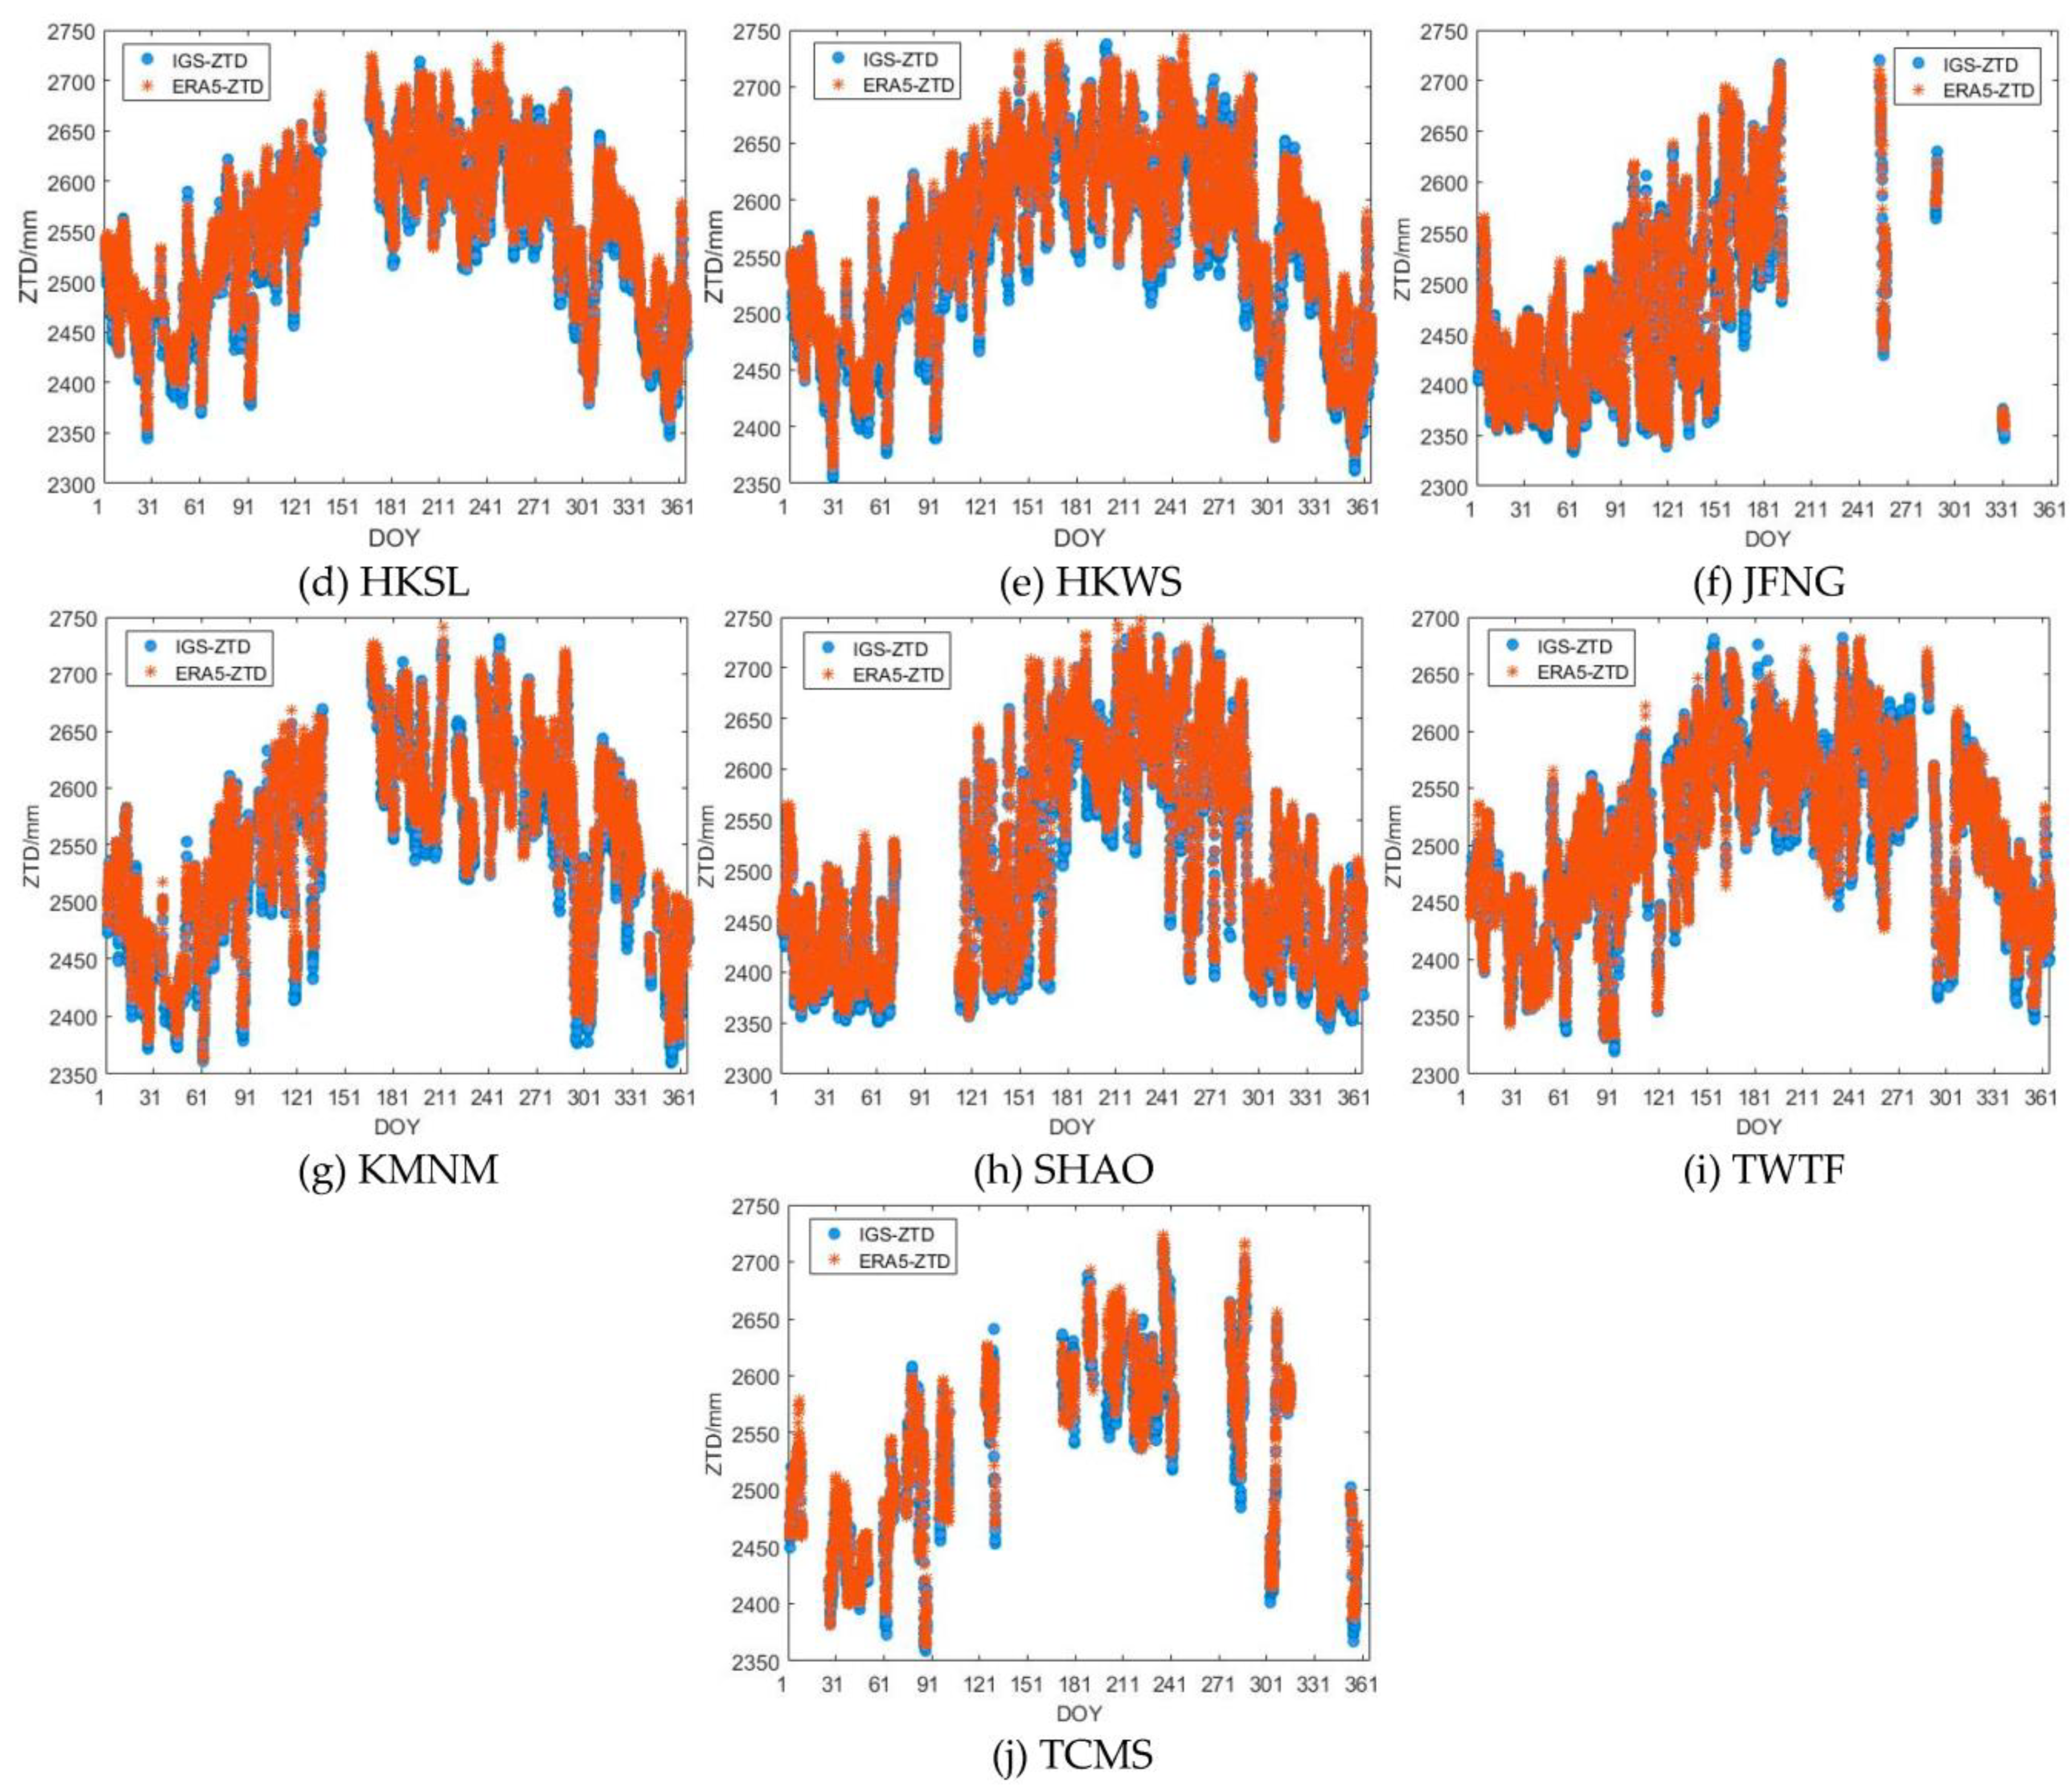
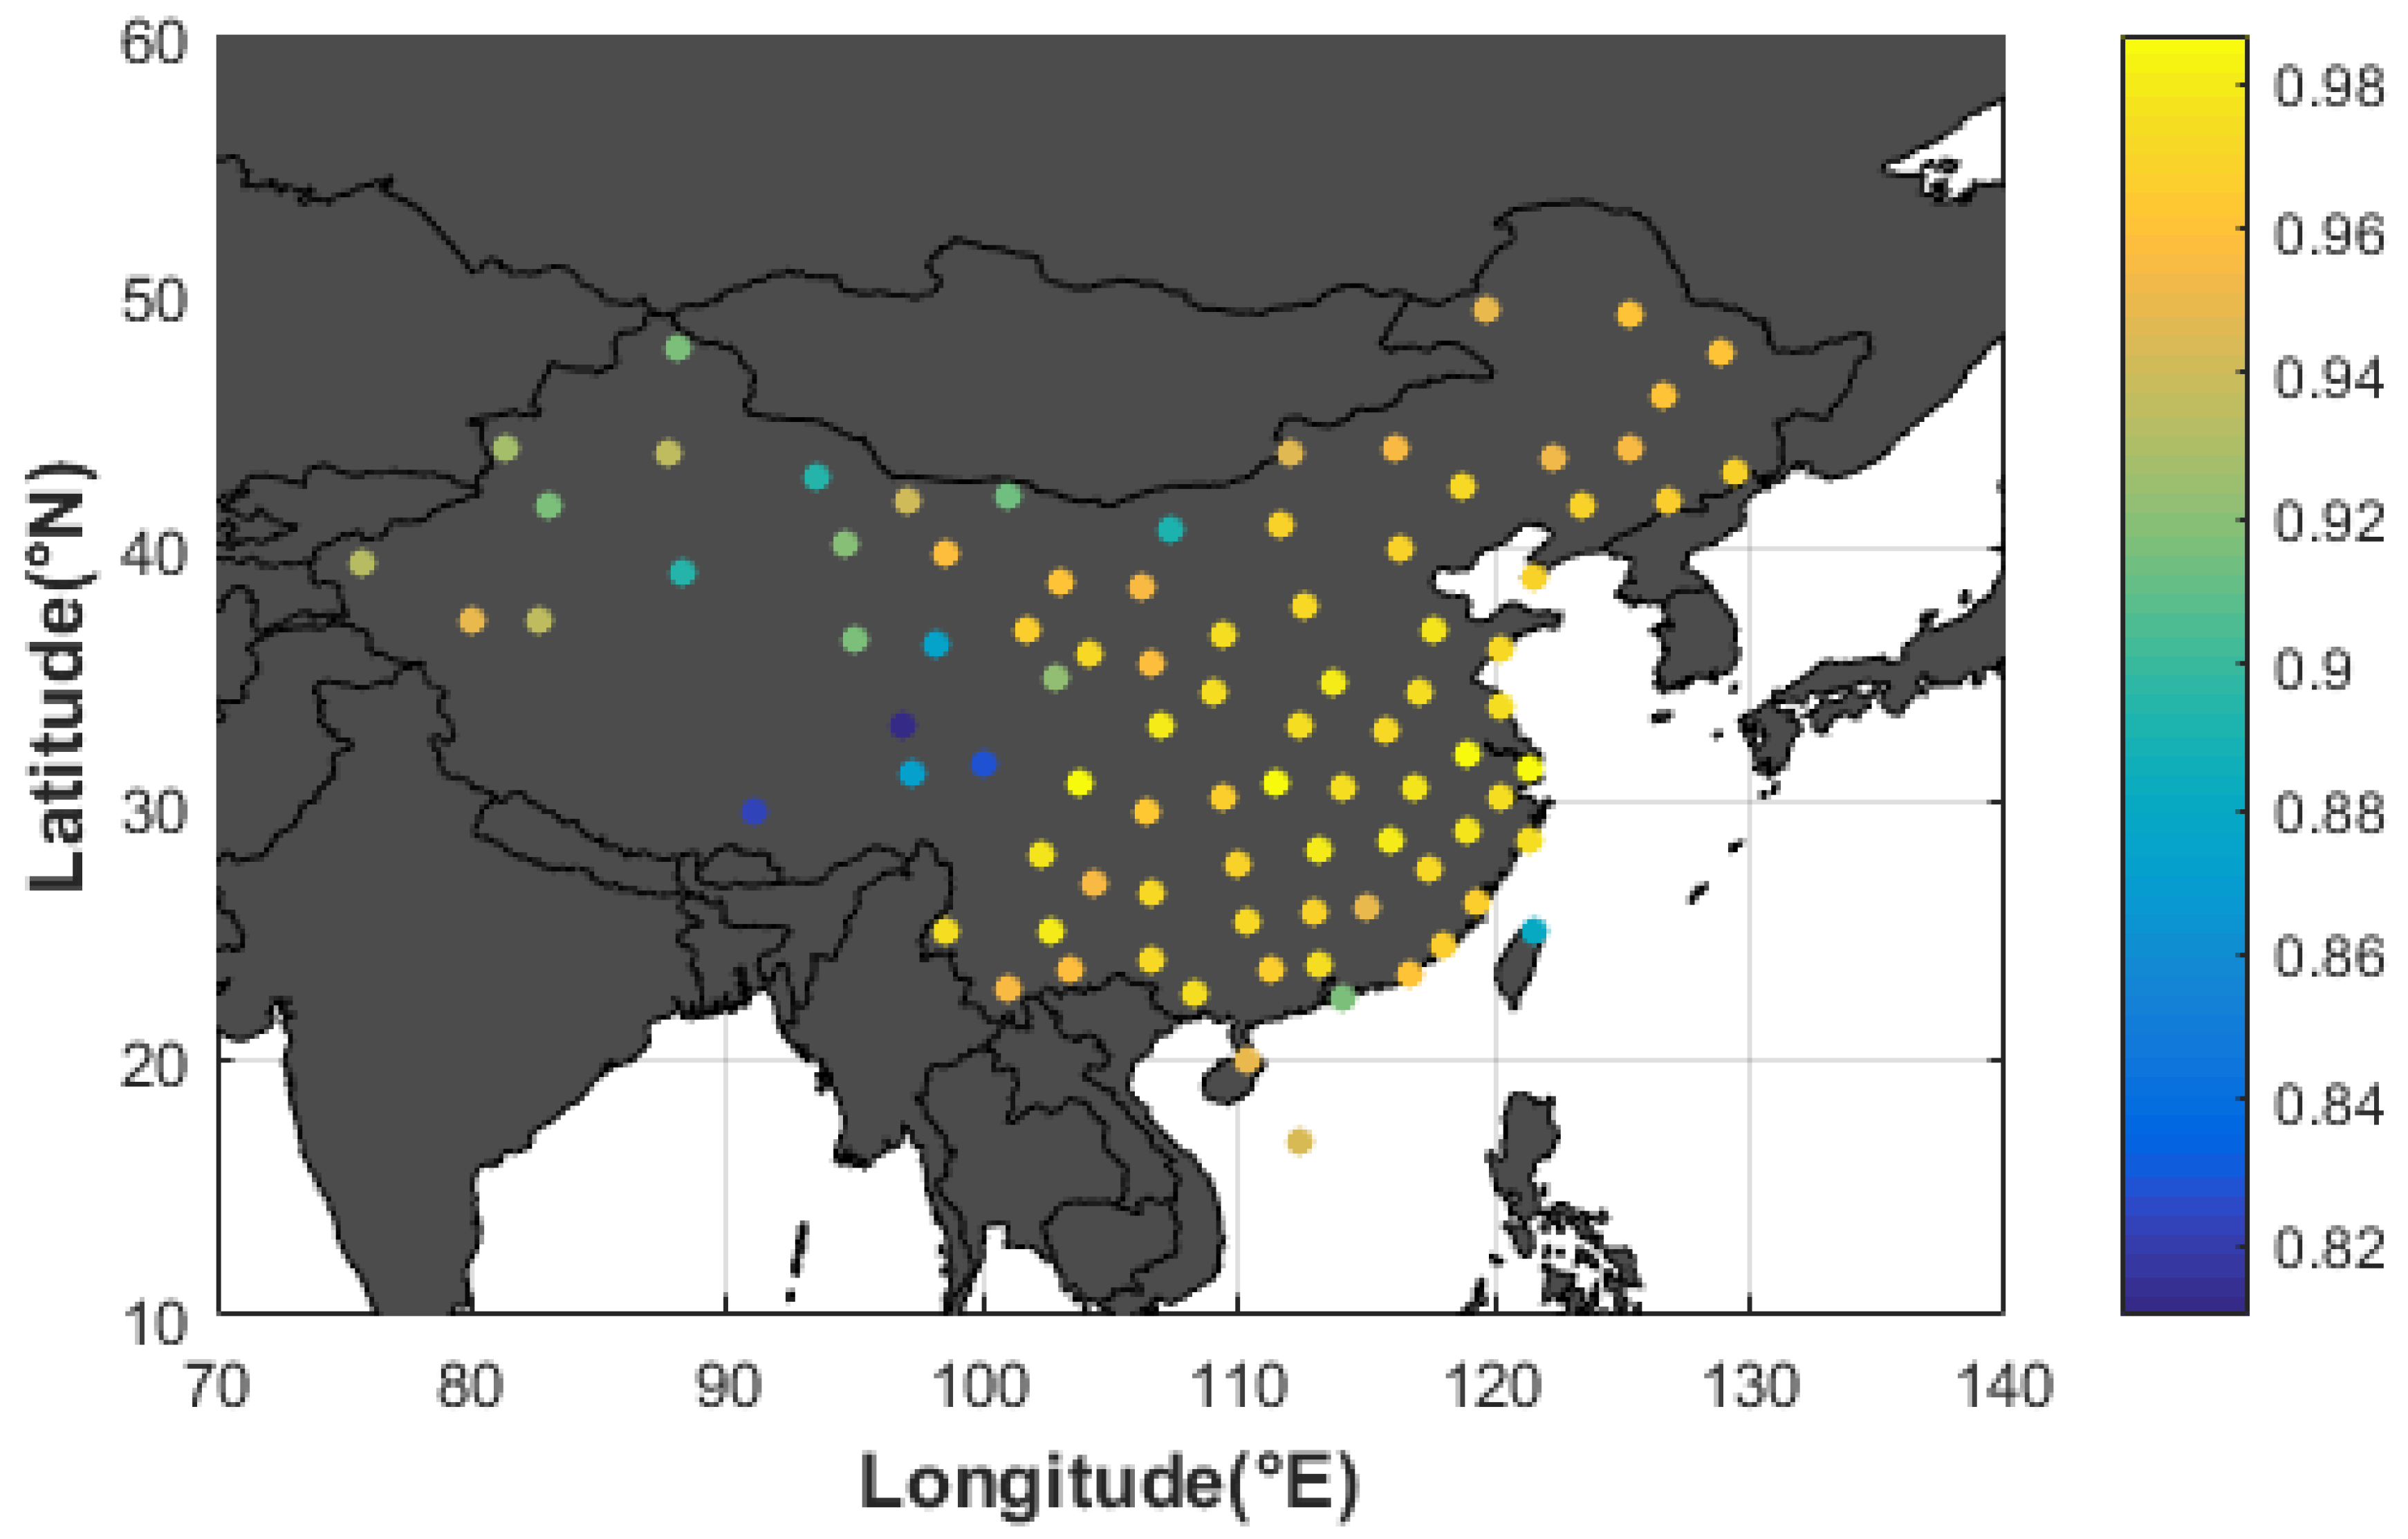
3.1. Comparison of ERA5-ZTD and IGS-ZTD Variations

The ERA5-ZTD datasets were used to estimate a tropical cyclone’s movement, and the accuracy of the ERA5-ZTD was verified for assessing the reliability of the proposed TDOZA model. The IGS adopted the final satellite orbit and clock solutions, and could provide the post-processed ZTD products (IGS-ZTD) with a time resolution of 5 min and an accuracy of better than 5 mm [49,50] using Bernese GPS Software. Thus, the IGS-ZTD datasets could be used as a reference for testing the accuracy of the ERA5-ZTD datasets. The 10 IGS stations near the ocean area are shown in Figure 2, and Figure 3 shows the ERA5-ZTD and IGS-ZTD times series with an hour time resolution over the 10 stations.
From Figure 3, it can be seen that the variations in the ERA5-ZTD and IGS-ZTD time series are almost the same, and the value of ZTD is highest in summer (DOY 151–241). The possible reason for this is the increase in the zenith wet delay (ZWD) caused by the increase in water vapor in summer, due to the large amount of water vapor transported by the southeast monsoon in China, and then the frequent movement of water vapor causes the changes to be more pronounced.
To further analyze the accuracy of the ERA5-ZTD time series over each station, the Bias, RMS and STD of the ERA5-ZTD time series compared with the IGS-ZTD time series are listed in Table 2. The mean bias values of the 10 stations means that the ERA5-ZTD time series is systematically around 6.4 mm, and the mean RMS and STD are 17.1 mm and 16.5 mm.

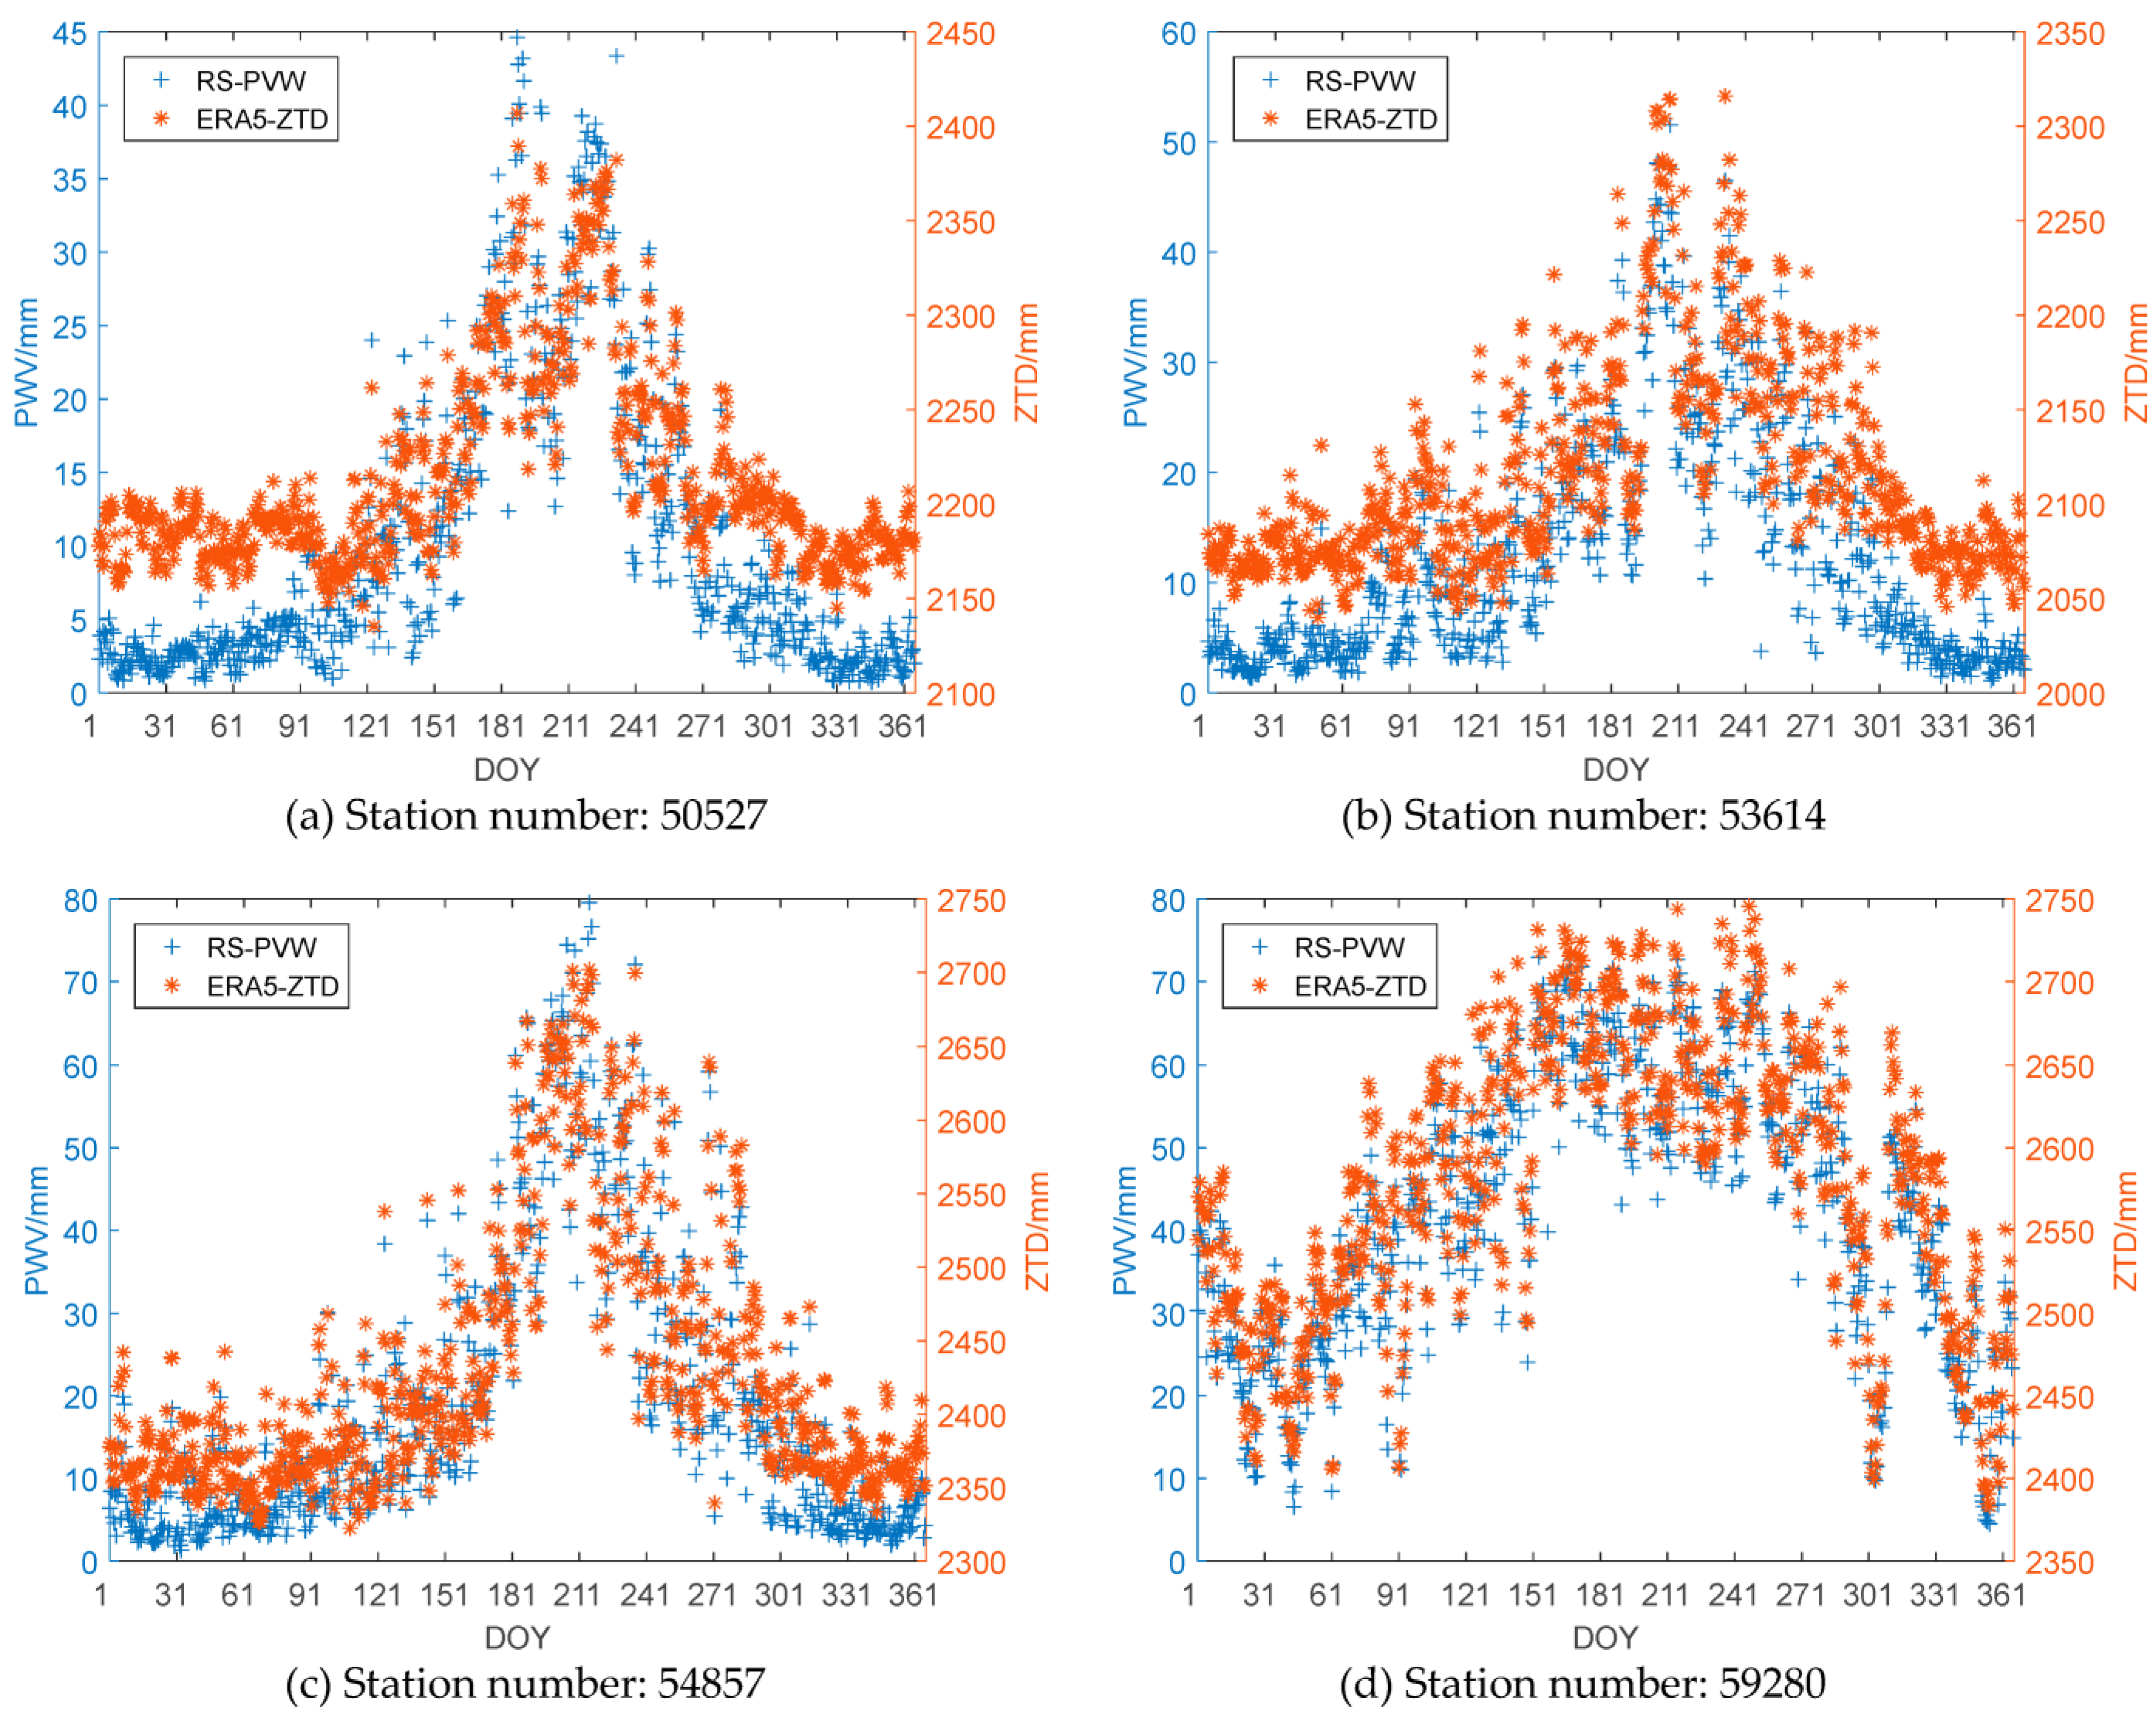
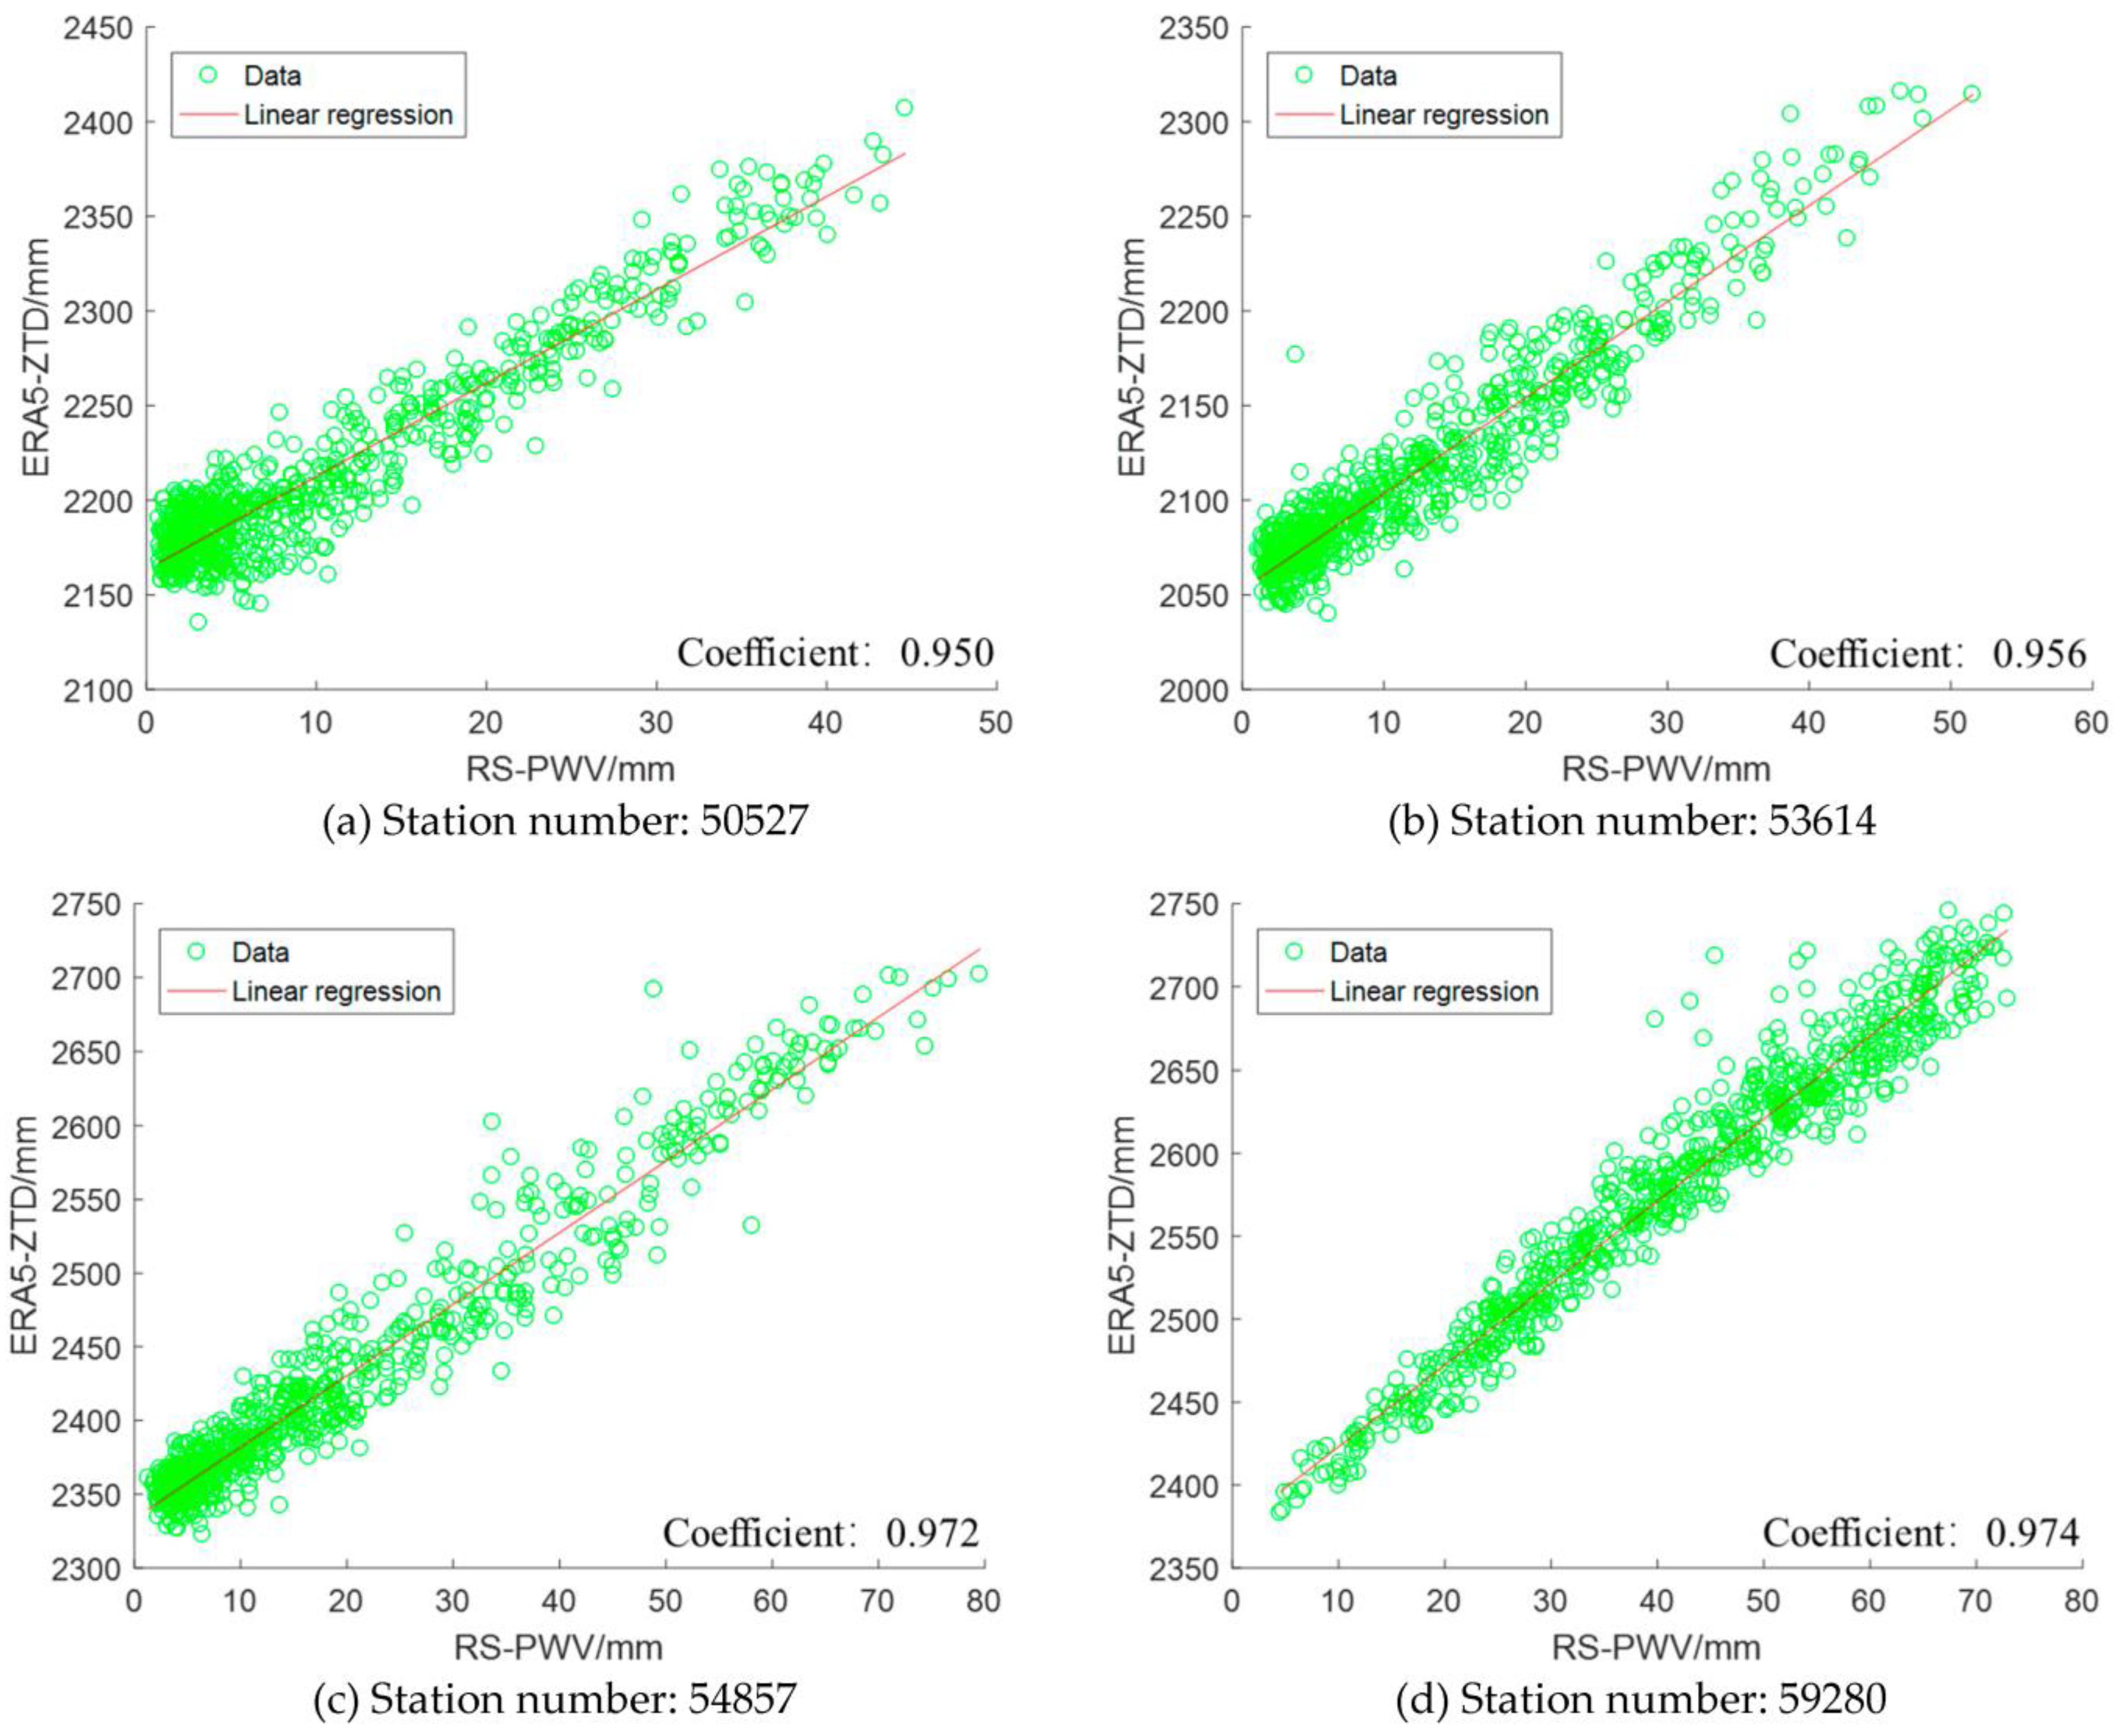
3.2. Comparison of ERA5-ZTD and RS-PWV Variations

Many previous studies on the characterizations of tropical cyclones have mainly been based on PWV, because water vapor is an important part of a tropical cyclone, which can reflect the life cycle and movement of a tropical cyclone [27,28,29]. Since PWV can be converted from ZTD, when both time series have similar variations trends, it is possible to use ZTD instead of PWV to forecast weather events. The RS datasets can provide accurate PWV data, and can be used to analyze the variation trends between ZTD and PWV. Table 3 shows the number, geodetic coordinates and elevations of the four randomly selected RS stations, and Figure 4 shows the times series with 12-h ERA5-ZTD and RS-ZTD over the four stations.
From Figure 4, it can be seen that the variation trend in the RS-PWV time series is the same as that of the ERA5-ZTD time series; the linear regression analysis of the RS-PWV and ERA5-ZTD time series was then carried out. The correlation coefficients between the two time series were calculated, and the linear regression analysis results of the RS-PWV and ERA5-ZTD time series are shown in Figure 5.
In Figure 5, there is a strong linear correlation between the RS-PWV and ERA5-ZTD time series, and the correlation coefficient of the two time series over the four stations is 0.950, 0.956, 0.972 and 0.974. For the other RS stations, Figure 6 shows the correlation coefficients of the RS-PWV and ERA5-ZTD time series over 89 RS stations.
In Figure 6, it can be seen that the correlation coefficient in the eastern region is higher than that in the western region. The minimum, maximum and mean values of the coefficients are 0.810, 0.987 and 0.951, respectively, and the proportion of the stations with a correlation coefficient over 0.9 is about 89.8%. When the correlation coefficient of the two parameters is more than 0.8, it can be considered that the two parameters are excellently related [51]. The above results confirm that most of the variations of ZTD are caused by the variations in ZWD composition (i.e., the change of water vapor), especially in the coastal areas with high water vapor content. As a result, there is a strong correlation coefficient between ZTD and PWV in terms of time domain, and ZTD could replace PWV as a predictor to study a tropical cyclone event.

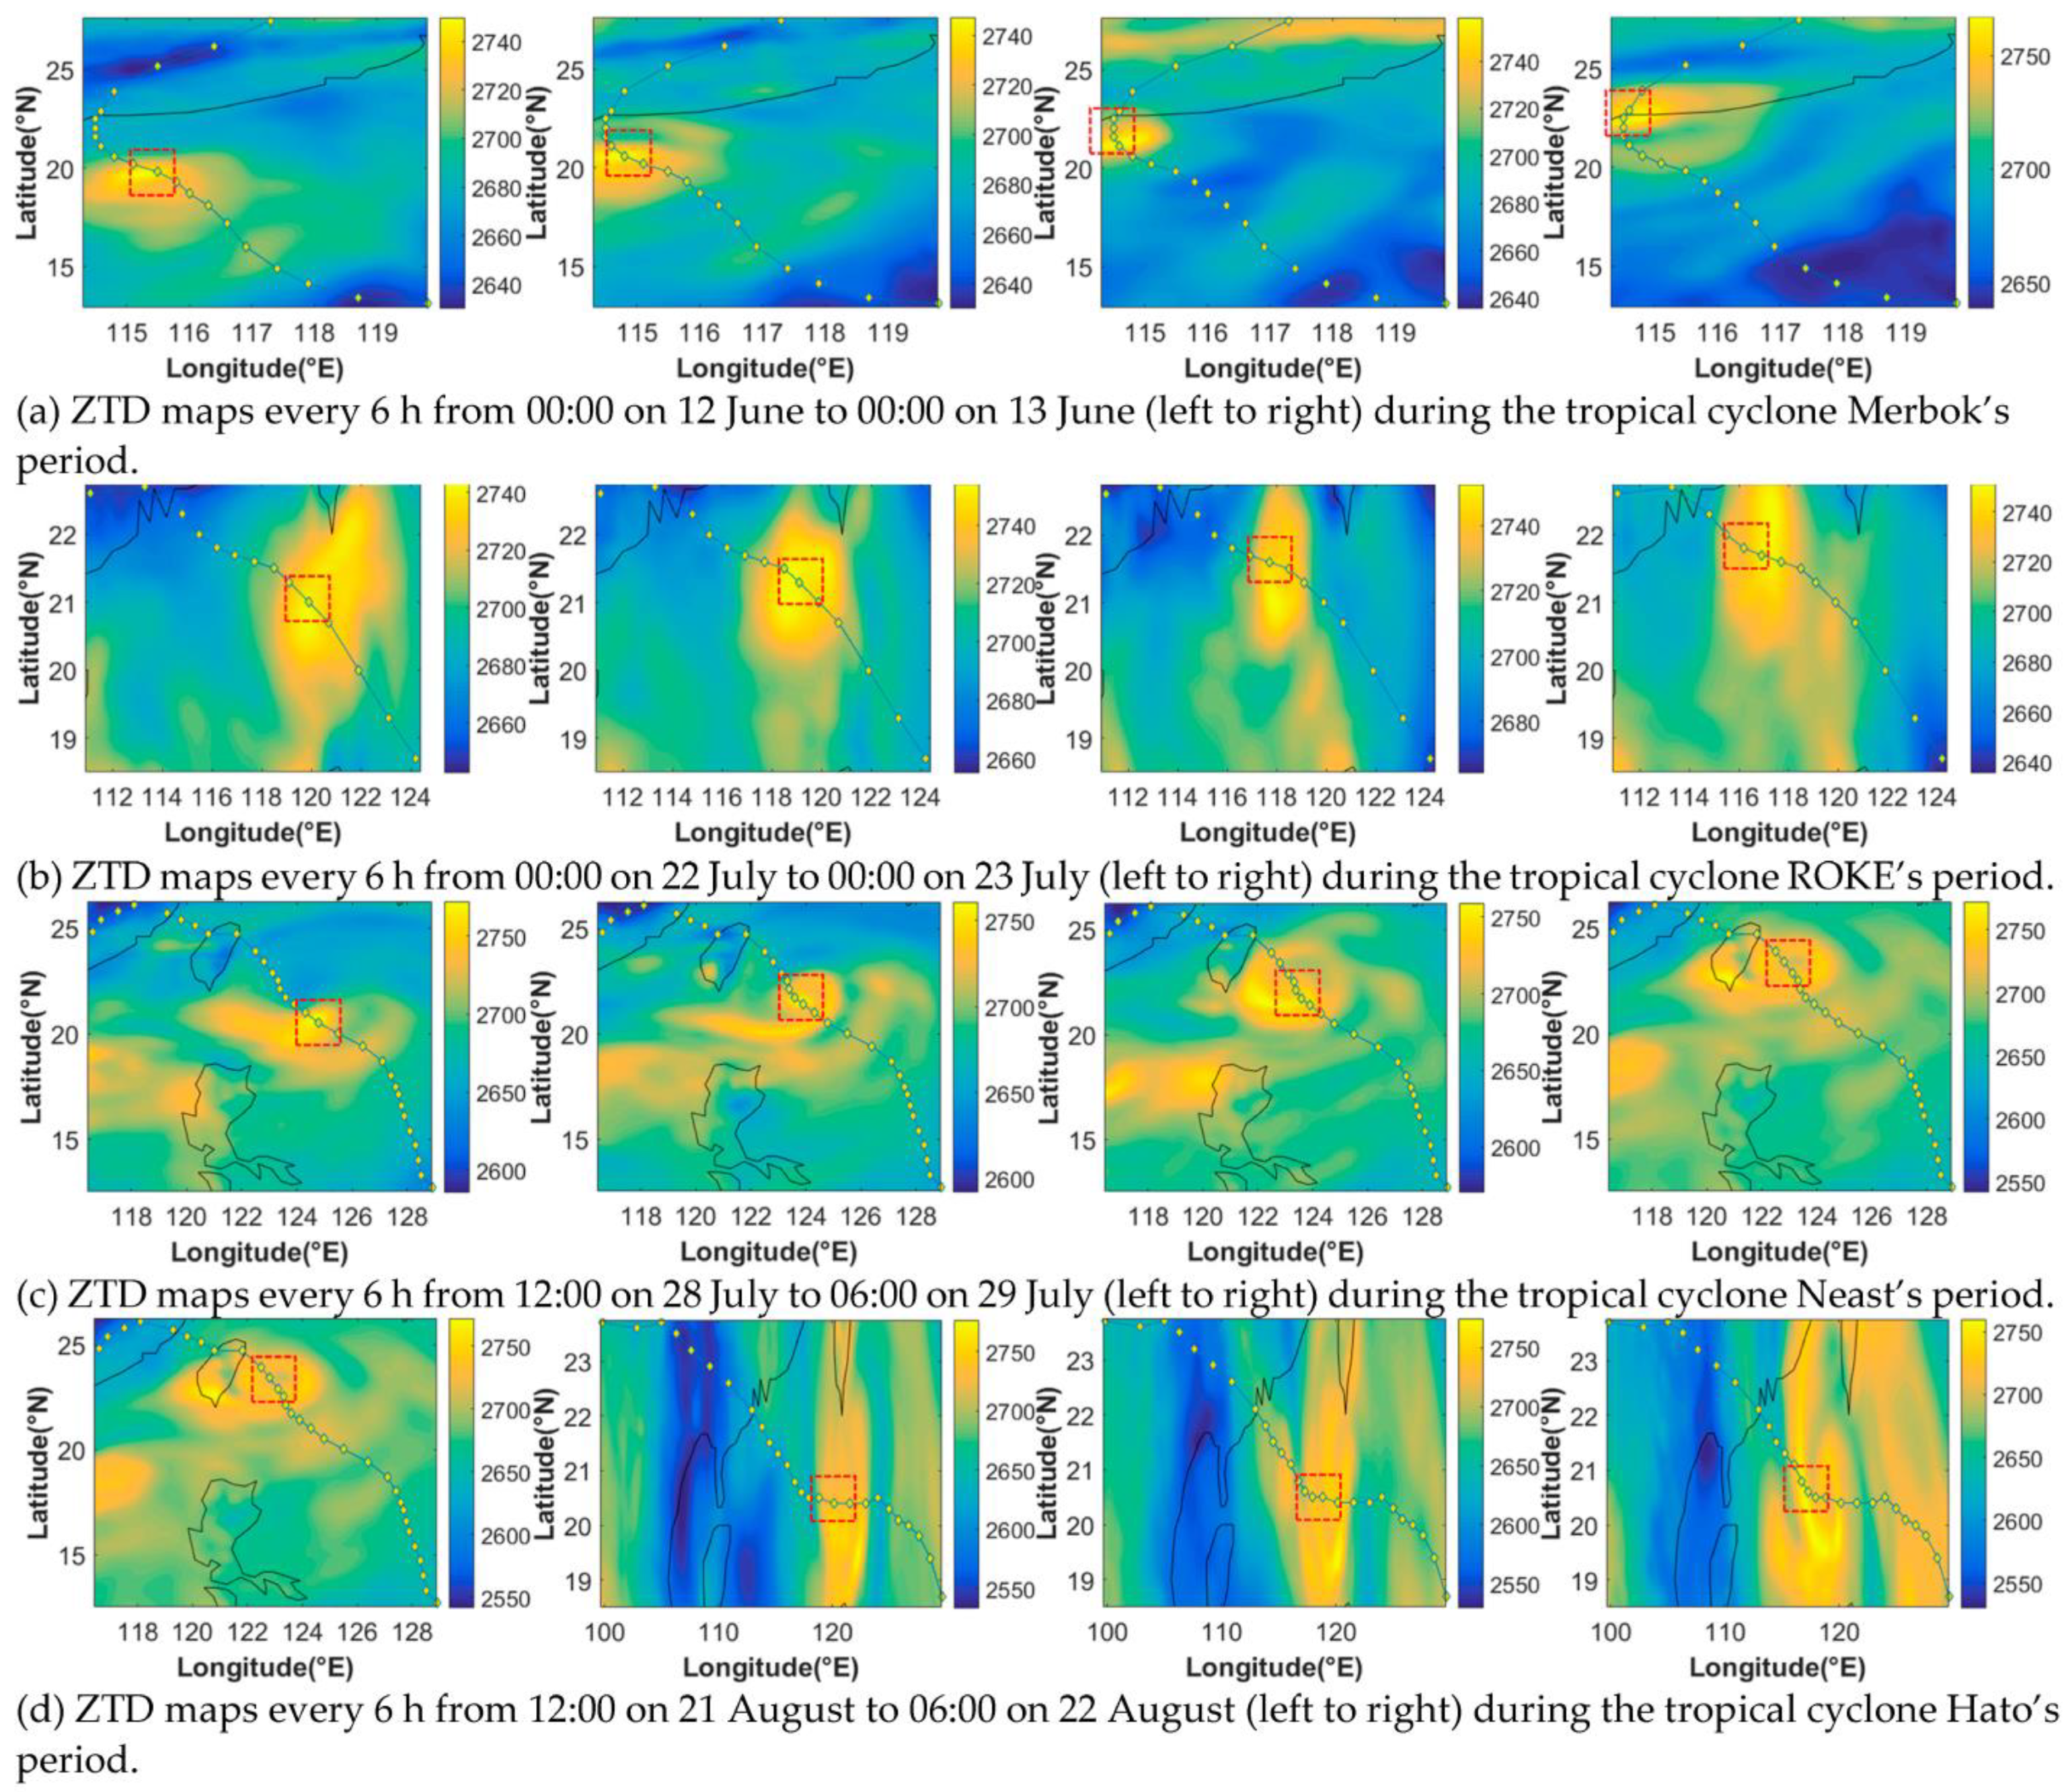
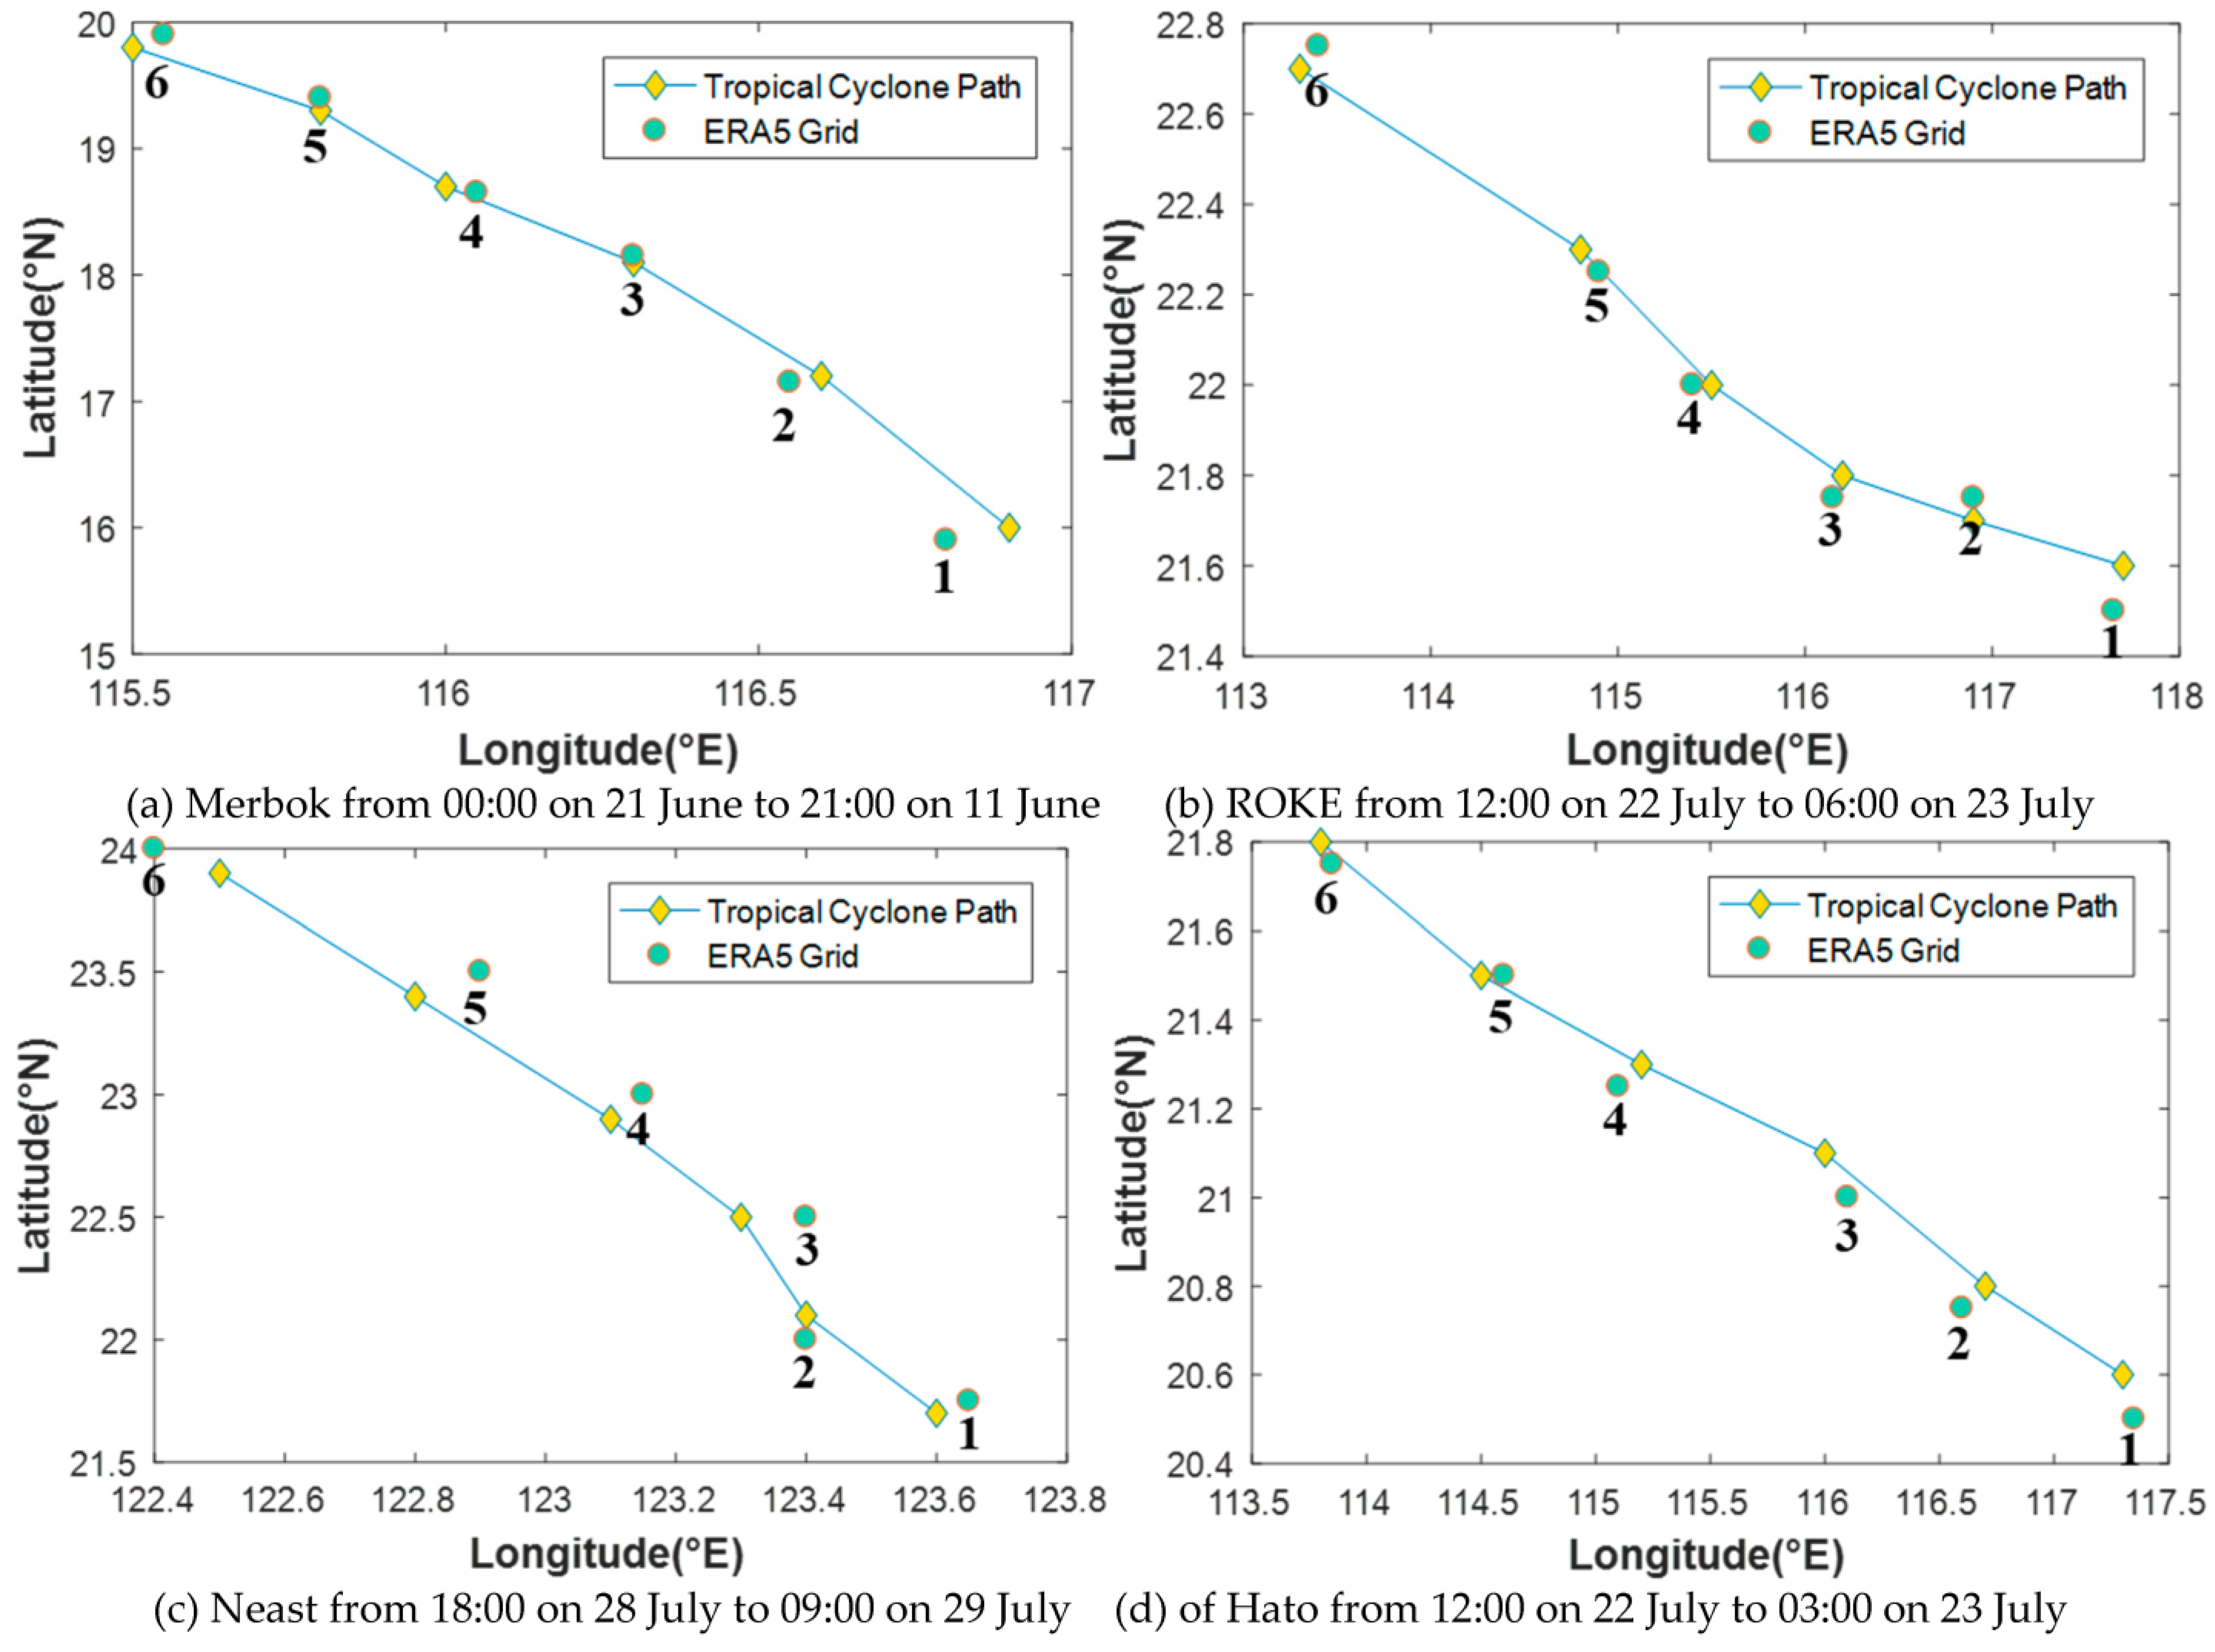
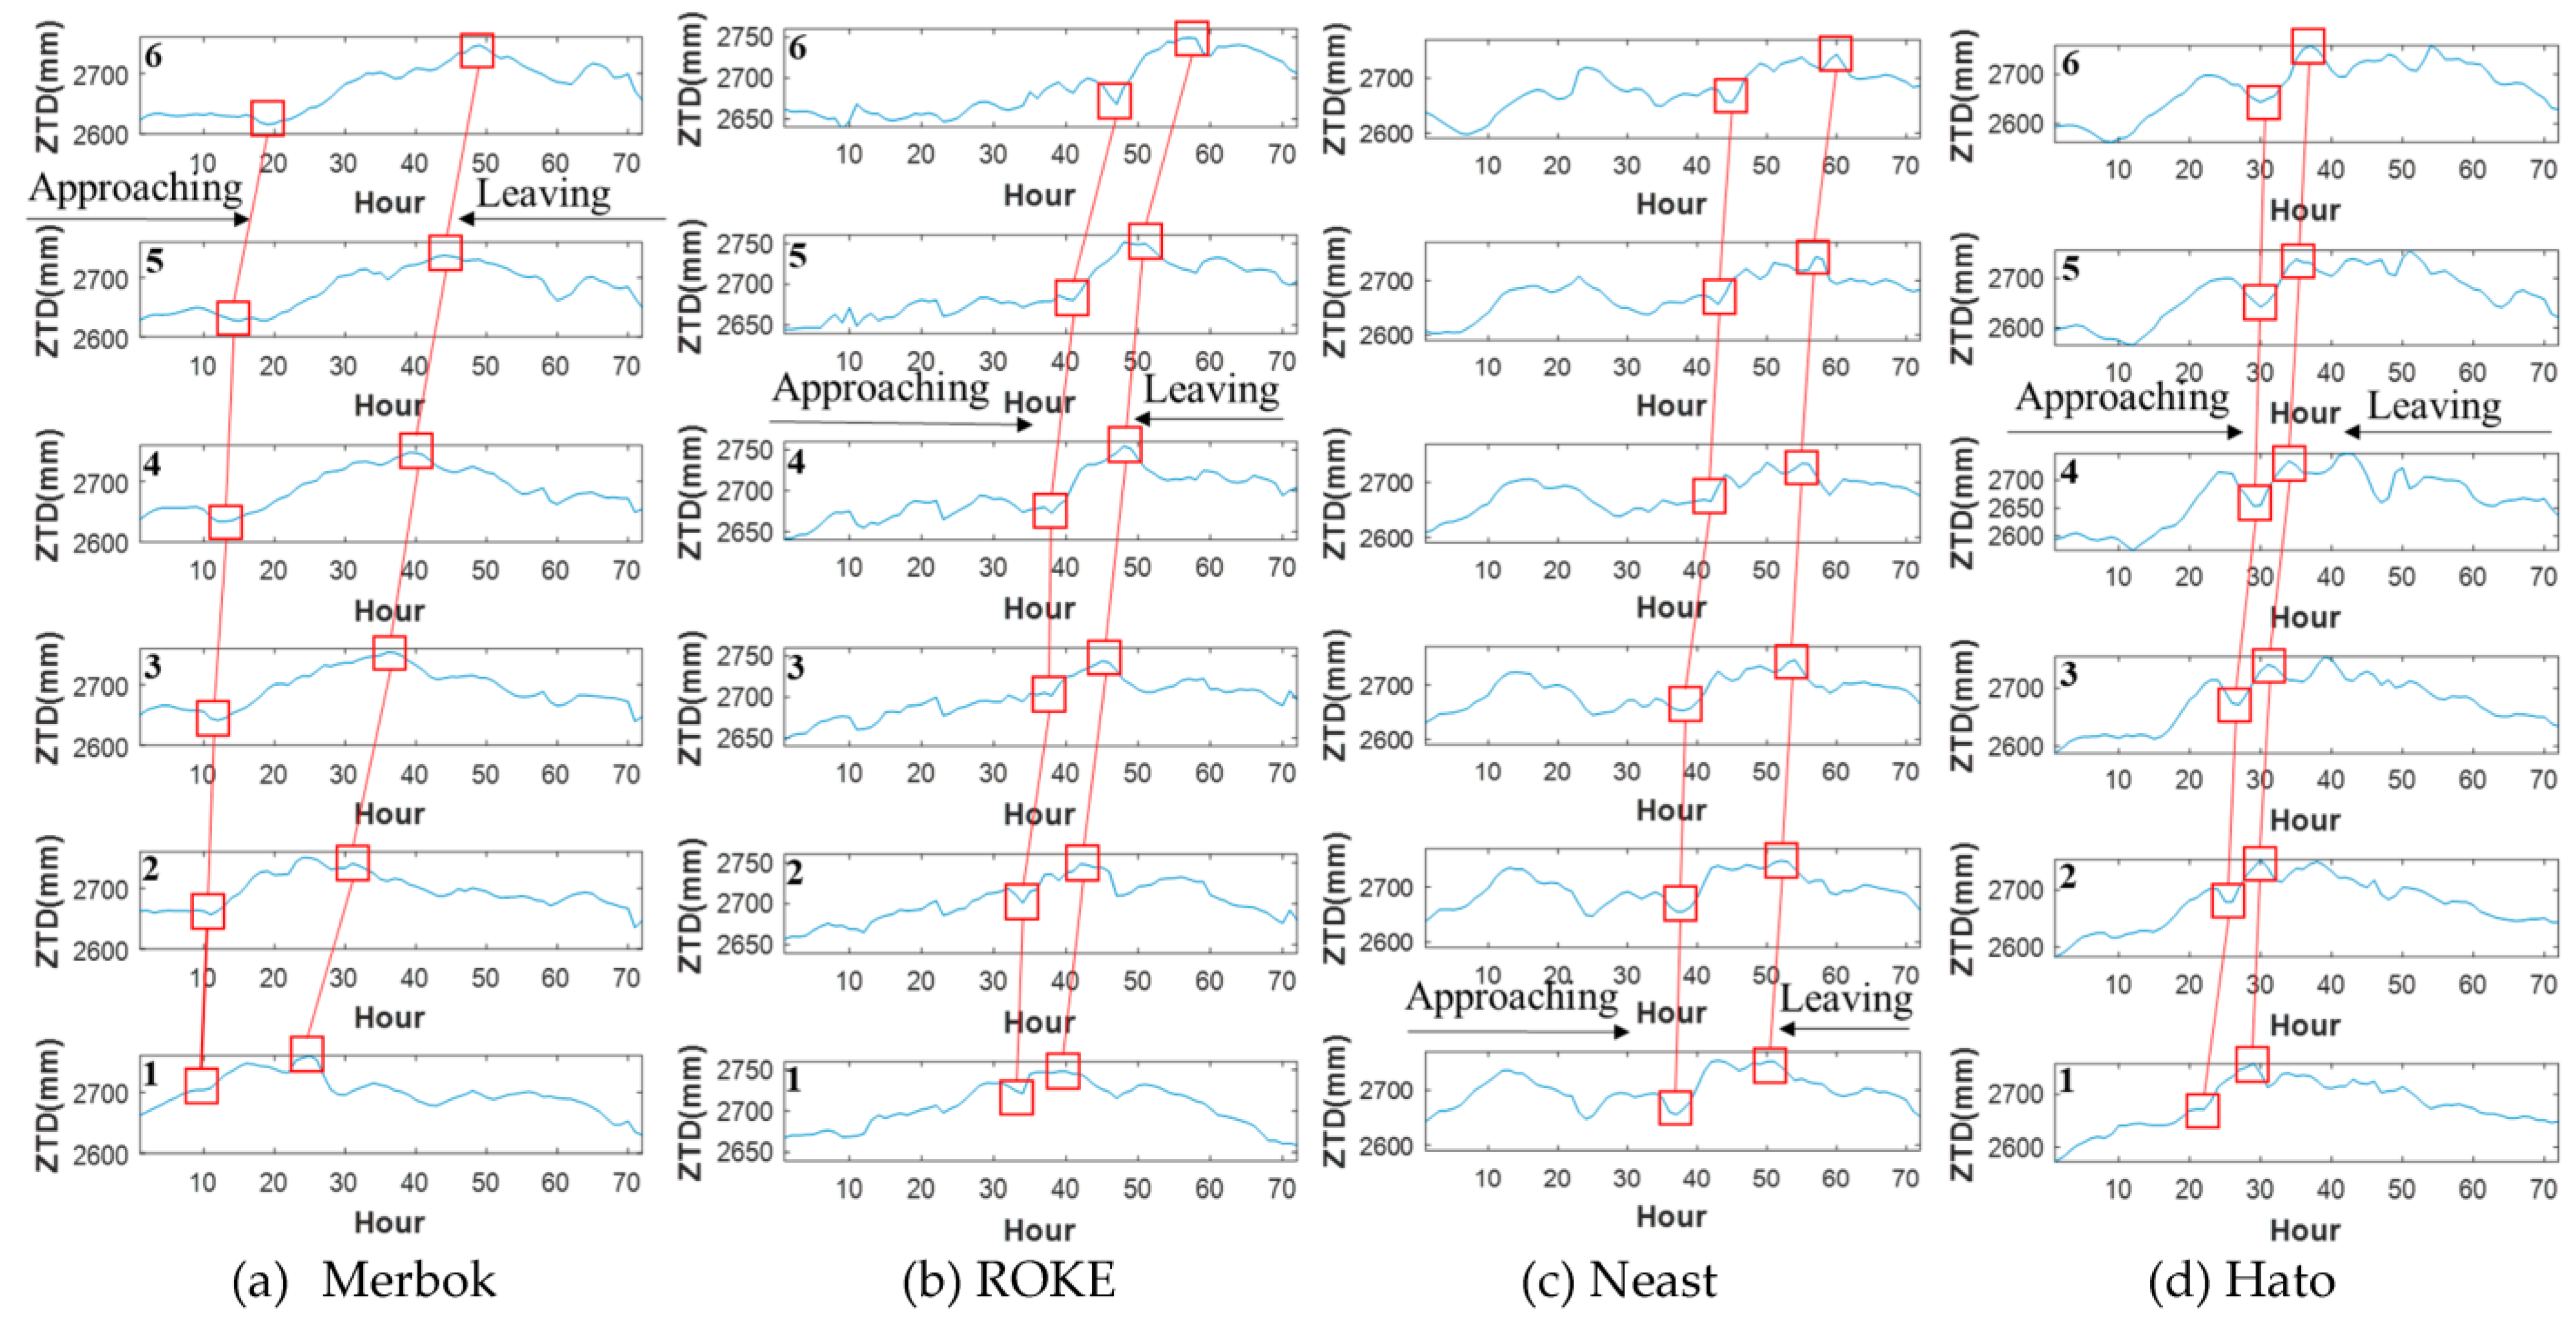
3.3. Relationship between the Spatio-Temporal Distribution of ZTD and the Movement of Tropical Cyclones

Previous studies [25,26] have proven that the spatio-temporal distribution of PWV can characterize the movement trend of a tropical cyclone, and it is possible that ZTD could replace PWV to characterize the movement trend of a tropical cyclone. Thus, to verify the availability of monitoring a tropical cyclone by using ZTD data, the ERA5-ZTD datasets during four tropical cyclone periods were obtained to analyze the relationship between the spatio-temporal distributions of ZTD and the movement of tropical cyclones. In this study, the ERA5-ZTD time series over the region covered by the four tropical cyclones were used as the sample data to obtain the interpolated spatial distribution maps of ZTD. Figure 7 shows the spatial distributions of ZTD in the route of four tropical cyclones during tropical cyclone periods.
In Figure 7, the red dotted frame indicates the central area of the tropical cyclones, and the ZTD near the central area (red dotted frame) of the tropical cyclones is higher than the regions away from the central area. It also can be seen from Figure 7a–d that the moving direction of a yellow circle is the same as that of a tropical cyclone. The main reason is that due to a large amount of water vapor (an increase of ZWD) carried by a tropical cyclone, the ZTD over a region starts to increase and decrease when the tropical cyclone is approaching and leaving the region, respectively. As a result, a tropical cyclone has a yellow circle filled with ZTD along the route. The above results indicate that ZTD can be used to characterize the direction of a tropical cyclone’s movement, which is consistent with the previous results obtained by analyzing the path of a tropical cyclone’s movement by using PWV [27,28,29].

3.4. Estimation of Tropical Cyclone’s Movement Using ZTD

In Section 3.3, the relationship between the spatial-temporal distribution of ZTD and the movement of a tropical cyclone was analyzed, and it was identified that the moving directions of ZTD and the tropical cyclone were consistent. Thus, it may be possible to try to estimate the movement of a tropical cyclone using the ZTD time series over several sites around the route of the tropical cyclone. In Section 2.3, the TDOZA model for estimating the movement of a tropical cyclone was proposed when the tropical cyclone is approaching or leaving, as shown in Figure 1. To test the accuracy of the TDOZA model, the ZTD time series over the six ERA5 grids around the four tropical cyclones’ paths were used to estimate the movements of the tropical cyclones. Figure 8 shows the paths of Merbok, ROKE, Neast and Hato, and the selected ERA5 grids around the path during the tropical cyclone’s period.
In Figure 8, 1 to 6 are the numbers of the ERA5 grids, and indicate the sequence in which the tropical cyclone passes. Then, the ZTD time series over the six ERA5 grids were obtained by using ERA5 datasets during the tropical cyclones’ periods. Figure 9 shows the time series with 1-h ZTD over the six ERA5 girds in Figure 8 during the four tropical cyclones’ periods.
From Figure 9a–d, it can be seen that the variations in the ZTD time series over the ERA5 grids numbered 1–6 are very similar, but there is a certain time shift among them. There are obvious increasing and decreasing trends (red squares) in the ZTD time series, when the tropical cyclones are approaching and leaving, respectively. From Section 2.3, the movement of a tropical cyclone can be estimated by using the TDOZA model when a tropical cyclone is approaching or leaving a site. The TCBT dataset from CMA was used to calculate the mean velocity of a tropical cyclone, which can be used as a reference to test the accuracy of the TDOZA model. Table 4 shows the comparisons between movement velocity estimated from the TDOZA model and the reference for the four tropical cyclones.
In Table 4, it was assumed that tropical cyclones keep a uniform motion and a uniform acceleration motion for models #1 and #2, respectively. For model #1, the mean absolute and relative deviations of the estimated velocity are 3.89 km/h and 15.2%, respectively. The mean absolute and relative deviations of the estimated approaching velocity and leaving velocity are 3.89 km/h and 3.90 km/h, and 15.8% and 14.5%, respectively. For model #2, the mean absolute and relative deviations of the estimated velocity are 2.55 km/h and 10.0%, respectively. The mean absolute and relative deviations of the estimated approaching velocity and leaving velocity are 2.71 km/h and 2.38 km/h, and 11.2% and 8.8%, respectively. The results show that the accuracy of model #2 (considering the variation of velocity) is higher than that of model #1 (not considering the variation of velocity), and also indicates the variable characteristics of the tropical cyclones’ motions.

4. Discussion

Previous studies [26,27,28,29,30] have confirmed that PWV can be used to monitor the movement of tropical cyclones, and ZTD time series can replace PWV time series for forecasting weather events, such as precipitation events, when the variation trends of the ZTD and PWV time series are similar [31,32,33,34]. To prove the feasibility of monitoring the movement of tropical cyclones using ZTD, the TDOZA model was proposed to estimate the velocity of a tropical cyclone.
From the experiments, including testing the accuracy of ERA5-ZTD datasets, analyzing the correlation between ERA5-ZTD and RS-PWV and studying the spatio-temporal distributions of ERA5-ZTD during tropical cyclones, it was determined that there is a strong correlation coefficient between ZTD and PWV in a time domain, and ZTD can be used to characterize the direction of a tropical cyclone’s movement. Finally, the ZTD time series over the grids around the four tropical cyclones’ paths were used to estimate the velocity of the tropical cyclones based on the TDOZA model, and the accuracy of the estimated velocity was about 2–4 km/h, which is close to the result of a tropical cyclone estimated using PWV.
However, the proposed model also ignores some factors such as the changes in the direction and structure of tropical cyclones. Due to these factors, additional errors will be introduced into the results, and the TDOZA mode should be further improved. It is promising that a refined model considering these factors will be applied in monitoring tropical cyclones at an advanced level.

5. Conclusions

A novel method for monitoring tropical cyclones using ZTD was proposed in this paper. To evaluate the availability of the ERA5-ZTD time series, the GNSS-ZTD time series over the 10 IGS stations were used to test the accuracy of the ERA5-ZTD time series, and the results showed that the mean Bias, RMS and STD of the ERA5-ZTD time series are 6.4 mm, 17.1 mm and 16.5 mm, respectively. To verify that ZTD can replace PWV for monitoring tropical cyclones, the correlation between the RS-PWV and ERA5-ZTD time series was analyzed. The results show the minimum, maximum and mean values of the correlation coefficients between the RS-PWV and ERA5-ZTD time series over the 89 RS stations were 0.810, 0.987 and 0.951, respectively, and the correlation coefficients over 90% of the RS stations were greater than 0.9. These results suggest that ZTD can replace PWV to study the characteristics of weather events. Then, the spatio-temporal characteristics of ZTD during the four tropical cyclone periods in 2017 were analyzed, and we found that ZTD moved in the same direction as the tropical cyclones. In the ZTD time series over the ERA5 girds around the path of the tropical cyclones, the sudden increase and decrease in ZTD are highly correlated with the approach and departure of a tropical cyclone, respectively. The TDOZA model based on the difference of ZTD time series was proposed to estimate the approaching and leaving velocities of tropical cyclones. The results showed that the accuracy of model #2 (considering the variation of velocity) was higher than that of model #1 (not considering the variation of velocity), and the mean absolute and relative deviations of the estimated velocity using model #2 were 2.55 km/h and 10.0%, respectively. This suggests that the TDOZA model could be used to estimate the movement of a tropical cyclone.
It is usually difficult to obtain ZTD data with high temporal and spatial resolution, and the ZTD data used in this paper was based on the post-processing products of the ERA5 datasets. With the continuous development of the GNSS technique, the number of GNSS stations is gradually increasing, and the accuracy, frequency band and processing methods of GNSS observations are constantly improved, which provides favorable conditions for monitoring tropical cyclones. In the future, it is expected that a real-time tropical cyclone monitoring method will be developed based on GNSS-derived ZTD observations.

Author Contributions

Conceptualization, D.L. and Q.H.; methodology, D.L. and Q.H.; software, D.L. and Q.H.; validation, D.L. and Q.H.; formal analysis, D.L., Q.H. and L.L.; investigation, D.L. and Q.H.; resources, D.L. and Q.H.; data curation, Q.H.; writing—original draft preparation, D.L. and Q.H.; writing—review and editing, D.L. and Q.H.; visualization, Q.H.; supervision, D.L., L.L., K.Z., E.F., G.L., R.W., B.G. and K.S.; project administration, D.L. and Q.H; funding acquisition, D.L. All authors have read and agreed to the published version of the manuscript.

Funding

This work was funded by the National Natural Science Foundation of China (42274021, 41730109, 41874040), the Youth Fund of Natural Science Foundation of Suzhou University of Science and Technology (XKQ2021006) and the Independent Innovation Project of “Double-First Class” Construction (2022ZZCX06).

Data Availability Statement

The GNSS-ZTD data in this study can be accessed from Crustal Dynamics Data Information System (https://cddis.nasa.gov/gnss/products/ionex/, accessed on 22 May 2023). The ERA5 pressure, temperature and specific humidity data can be accessed from European Centre for Medium-Range Weather Forecasts (https://cds.climate.copernicus.eu/#!/home, accessed on 22 May 2023). The RS data can be accessed from the University of Wyoming’s department of atmospheric sciences (http://weather.uwyo.edu/upperair/sounding.html, accessed on 22 May 2023). The tropical cyclone data can be accessed from the China Meteorological Administration (http://tcdata.typhoon.org.cn, accessed on 22 May 2023).

Acknowledgments

We would like to acknowledge the support of the Jiangsu dual creative talents program projects of Jiangsu Province. The authors appreciate the International GNSS Service, European Centre for Medium-Range Weather Forecasts, University of Wyoming’s department of atmospheric sciences and China Meteorological Administration for the provision of relevant data and products.

Conflicts of Interest

The authors declare no conflict of interest.

References

  1. Sobel, A.H.; Camargo, S.J.; Hall, T.M.; Lee, C.Y.; Tippett, M.K.; Wing, A.A. Human influence on tropical cyclone intensity. Science 2016, 353, 242–246. [Google Scholar] [CrossRef] [PubMed] [Green Version]
  2. Wang, Y.; Kepert, J.D.; Holland, G.J. The effect of sea spray evaporation on tropical cyclone boundary layer structure and intensity. Mon. Weather Rev. 2001, 129, 2481–2500. [Google Scholar] [CrossRef]
  3. Wu, L.; Wang, B.; Geng, S. Growing typhoon influence on East Asia. Geophys. Res. Lett. 2005, 32, L18703. [Google Scholar] [CrossRef] [Green Version]
  4. Zhang, B.; Yao, Y.; Xin, L.; Xu, X. Precipitable water vapor fusion: An approach based on spherical cap harmonic analysis and Helmert variance component estimation. J. Geod. 2019, 93, 2605–2620. [Google Scholar] [CrossRef]
  5. Zhang, B.; Yao, Y. Precipitable water vapor fusion based on a generalized regression neural network. J. Geod. 2021, 95, 36. [Google Scholar] [CrossRef]
  6. Zhao, Q.; Yao, Y.; Yao, W. GPS-based PWV for precipitation forecasting and its application to a typhoon event. J. Atmos. Sol.-Terr. Phys. 2018, 167, 124–133. [Google Scholar] [CrossRef]
  7. Yu, S.; Liu, Z. Temporal and spatial impact of precipitable water vapor on GPS relative positioning during the tropical cyclone Hato (2017) in Hong Kong and Taiwan. Earth Space Sci. 2021, 8, e2020EA001371. [Google Scholar] [CrossRef]
  8. Zhao, Q.; Ma, X.; Yao, W.; Liu, Y.; Yao, Y. A drought monitoring method based on precipitable water vapor and precipitation. J. Clim. 2020, 33, 10727–10741. [Google Scholar] [CrossRef]
  9. Wang, X.; Zhang, K.; Wu, S.; Li, Z.; Cheng, Y.; Li, L.; Yuan, H. The correlation between GNSS-derived precipitable water vapor and sea surface temperature and its responses to El Niño–Southern Oscillation. Remote Sens. Environ. 2018, 216, 1–12. [Google Scholar] [CrossRef]
  10. Zhao, Q.; Liu, K.; Li, Z.; Liu, Y.; Yao, Y. A novel ENSO monitoring index and its potential for drought application. J. Atmos. Sol.-Terr. Phys. 2021, 225, 105762. [Google Scholar] [CrossRef]
  11. Ma, X.; Yao, Y.; Zhang, B.; Du, Z. FY-3A/MERSI precipitable water vapor reconstruction and calibration using multi-source observation data based on a generalized regression neural network. Atmos. Res. 2022, 265, 105893. [Google Scholar] [CrossRef]
  12. Tan, J.; Chen, B.; Wang, W.; Yu, W.; Dai, W. Evaluating Precipitable Water Vapor Products from Fengyun-4A Meteorological Satellite Using Radiosonde, GNSS, and ERA5 Data. IEEE Trans. Geosci. Remote Sens. 2022, 60, 1–12. [Google Scholar] [CrossRef]
  13. Gong, Y.; Liu, Z.; Foster, J.H. Evaluating the Accuracy of Satellite-Based Microwave Radiometer PWV Products Using Shipborne GNSS Observations Across the Pacific Ocean. IEEE Trans. Geosci. Remote Sens. 2021, 60, 1–10. [Google Scholar] [CrossRef]
  14. Bevis, M.; Businger, S.; Chiswell, S.; Herring, T.A.; Anthes, R.A.; Rocken, C.; Ware, R.H. GPS meteorology: Mapping zenith wet delays onto precipitable water. J. Appl. Meteorol. (1988–2005) 1994, 33, 379–386. [Google Scholar] [CrossRef]
  15. Zhang, B.; Yao, Y.; Fok, H.S.; Hu, Y.; Chen, Q. Potential seasonal terrestrial water storage monitoring from GPS vertical displacements: A case study in the lower three-rivers headwater region, China. Sensors 2016, 16, 1526. [Google Scholar] [CrossRef] [Green Version]
  16. Wang, J.; Liu, Z. Improving gnss ppp accuracy through WVR PWV augmentation. J. Geod. 2019, 93, 1685–1705. [Google Scholar] [CrossRef]
  17. Puente, V.; Azcue, E.; Gomez-Espada, Y.; Garcia-Espada, S. Comparison of common VLBI and GNSS estimates in CONT17 campaign. J. Geod. 2021, 95, 1–20. [Google Scholar] [CrossRef]
  18. Nykiel, G.; Figurski, M.; Baldysz, Z. Analysis of GNSS sensed precipitable water vapour and tropospheric gradients during the derecho event in Poland of 11th August 2017. J. Atmos. Sol. Terr. Phys. 2019, 193, 105082. [Google Scholar] [CrossRef]
  19. Li, H.; Wang, X.; Choy, S.; Jiang, C.; Wu, S.; Zhang, J.; Qiu, C.; Zhou, K.; Li, L.; Fu, E.; et al. Detecting heavy rainfall using anomaly-based percentile thresholds of predictors derived from GNSS-PWV. Atmos. Res. 2022, 265, 105912. [Google Scholar] [CrossRef]
  20. He, Q.; Li, L.; Lian, D.; Yu, H.; Chen, G.; Gao, B.; Wang, R.; Song, K.; Li, L. A new method for retrieving urban heat island intensity using GNSS-derived ZTD and atmospheric empirical model. Int. J. Remote Sens. 2022, 43, 7064–7082. [Google Scholar] [CrossRef]
  21. Liou, Y.A.; Huang, C.Y. GPS observations of PW during the passage of a typhoon. Earth Planets Space 2000, 52, 709–712. [Google Scholar] [CrossRef] [Green Version]
  22. Song, D.S.; Yun, H.S.; Lee, D.H. Verification of accuracy of precipitable water vapour from GPS during typhoon RUSA. Surv. Rev. 2008, 40, 19–28. [Google Scholar] [CrossRef]
  23. Song, D.S.; Grejner-Brzezinska, D.A. Remote sensing of atmospheric water vapor variation from GPS measurements during a severe weather event. Earth Planets Space 2009, 61, 1117–1125. [Google Scholar] [CrossRef] [Green Version]
  24. Tang, X.; Hancock, C.M.; Xiang, Z.; Kong, Y.; Ligt, H.D.; Shi, H.; Quaye-Ballard, J.A. Precipitable water vapour retrieval from GPS precise point positioning and NCEP CFSv2 dataset during typhoon events. Sensors 2018, 18, 3831. [Google Scholar] [CrossRef] [PubMed] [Green Version]
  25. He, Q.; Zhang, K.; Wu, S.; Lian, D.; Li, L.; Shen, Z.; Wan, M.; Li, L.; Wang, R.; Fu, E.; et al. An investigation of atmospheric temperature and pressure using an improved spatio-temporal Kriging model for sensing GNSS-derived precipitable water vapor. Spat. Stat. 2022, 51, 100664. [Google Scholar] [CrossRef]
  26. Won, J.; Kim, D. Analysis of temporal and spatial variation of precipitable water vapor according to path of typhoon EWINIAR using GPS permanent stations. J. Position. Navig. Timing 2015, 4, 87–95. [Google Scholar] [CrossRef] [Green Version]
  27. Zhao, Q.; Ma, X.; Yao, W.; Yao, Y. A new typhoon-monitoring method using precipitation water vapor. Remote Sens. 2019, 11, 2845. [Google Scholar] [CrossRef] [Green Version]
  28. He, Q.; Zhang, K.; Wu, S.; Zhao, Q.; Wang, X.; Shen, Z.; Li, L.; Wan, M.; Liu, X. Real-time GNSS-derived PWV for typhoon characterizations: A case study for super typhoon Mangkhut in Hong Kong. Remote Sens. 2019, 12, 104. [Google Scholar] [CrossRef] [Green Version]
  29. He, Q.; Shen, Z.; Wan, M.; Li, L. Precipitable water vapor converted from GNSS-ZTD and ERA5 datasets for the monitoring of tropical cyclones. IEEE Access 2020, 8, 87275–87290. [Google Scholar] [CrossRef]
  30. Kang, I.; Park, J. Use of GNSS-Derived PWV for Predicting the Path of Typhoon: Case Studies of Soulik and Kongrey in 2018. J. Surv. Eng. 2021, 147, 04021018. [Google Scholar] [CrossRef]
  31. Zhao, Q.; Yao, Y.; Yao, W.; Li, Z. Real-time precise point positioning-based zenith tropospheric delay for precipitation forecasting. Sci. Rep. 2018, 8, 7939. [Google Scholar] [CrossRef] [Green Version]
  32. Li, L.; Kuang, C.L.; Zhu, J.J.; Chen, W.; Chen, Y.Q.; Long, S.C.; Li, H.Y. Rainstorm nowcasting based on GPS real-time precise point positioning technology. Chin. J. Geophys. 2012, 55, 1129–1136. [Google Scholar]
  33. Li, H.; Wang, X.; Wu, S.; Zhang, K.; Chen, X.; Zhang, J.; Qiu, C.; Zhang, S.; Li, L. An improved model for detecting heavy precipitation using GNSS-derived zenith total delay measurements. IEEE J. Sel. Top. Appl. Earth Obs. Remote Sens. 2021, 14, 5392–5405. [Google Scholar] [CrossRef]
  34. Ma, Y.; Liu, T.; Xu, G.; Lu, Z. Apparent Short-Period GNSS-ZTD Disturbance Correlated with Precipitation Events. IEEE Geosci. Remote Sens. Lett. 2022, 19, 1–5. [Google Scholar] [CrossRef]
  35. Zhao, Q.; Ma, Y.; Li, Z.; Yao, Y. Retrieval of a high-precision drought monitoring index by using GNSS-derived ZTD and temperature. IEEE J. Sel. Top. Appl. Earth Obs. Remote Sens. 2021, 14, 8730–8743. [Google Scholar] [CrossRef]
  36. Paziewski, J. Multi-constellation single-frequency ionospheric-free precise point positioning with low-cost receivers. GPS Solut. 2022, 26, 23. [Google Scholar] [CrossRef]
  37. Collins, P.; Langley, R.B. Tropospheric Delay. GPS World 1999, 53, 52–58. [Google Scholar]
  38. Thayer, G.D. An improved equation for the radio refractive index of air. Radio Sci. 1974, 9, 803–807. [Google Scholar] [CrossRef]
  39. Smith, E.K.; Weintraub, S. The constants in the equation for atmospheric refractive index at radio frequencies. Proc. IRE 1953, 41, 1035–1037. [Google Scholar] [CrossRef] [Green Version]
  40. Hasegawa, S.; Stokesberry, D.P. Automatic digital microwave hygrometer. Rev. Sci. Instrum. 1975, 46, 867–873. [Google Scholar] [CrossRef]
  41. Dach, R.; Lutz, S.; Walser, P.; Fridez, P. Bernese GNSS Software; Version 5.2; Astronomical Institute, University of Bern: Bern, Switzerland, 2015; p. 884. [Google Scholar]
  42. Herring, T.A.; Floyd, M.A.; Perry, M. Gamit/globk for gnss. GNSS Data Process. Anal. GAMIT/GLOBK Track Hotel. Soluxe Bishkek Kyrg. 2018, 2, 2–7. [Google Scholar]
  43. Lagler, K.; Schindelegger, M.; Böhm, J.; Krásná, H.; Nilsson, T. GPT2: Empirical slant delay model for radio space geodetic techniques. Geo-Phys. Res. Lett. 2013, 40, 1069–1073. [Google Scholar] [CrossRef] [PubMed] [Green Version]
  44. Pavlis, N.K.; Holmes, S.A.; Kenyon, S.C.; Factor, J.K. The development and evaluation of the Earth Gravitational Model 2008 (EGM2008). J. Geophys. Res. Solid Earth 2012, 117, B04406. [Google Scholar] [CrossRef] [Green Version]
  45. Vedel, H. Conversion of WGS84 geometric heights to NWP model HIRLAM geopotential heights, Danish Meteorological Institute. DMI Sci. Rep. 2000, 2, 1–11. [Google Scholar]
  46. Bonafoni, S.; Biondi, R.; Brenot, H.; Anthes, R. Radio occultation and ground-based GNSS products for observing, understanding and predicting extreme events: A review. Atmos. Res. 2019, 230, 104624. [Google Scholar] [CrossRef]
  47. Ying, M.; Zhang, W.; Yu, H.; Lu, X.; Feng, J.; Fan, Y.; Zhu, Y.; Chen, D. An overview of the China Meteorological Administration tropical cyclone database. J. Atmos. Ocean. Technol. 2014, 31, 287–301. [Google Scholar] [CrossRef] [Green Version]
  48. Lu, X.; Yu, H.; Ying, M.; Zhao, B.; Zhang, S.; Lin, L.; Bai, L.; Wan, R. Western North Pacific tropical cyclone database created by the China Meteorological Administration. Adv. Atmos. Sci. 2021, 38, 690–699. [Google Scholar] [CrossRef]
  49. Dow, J.M.; Neilan, R.E.; Rizos, C. The international GNSS service in a changing landscape of global navigation satellite systems. J. Geod. 2009, 83, 191–198. [Google Scholar] [CrossRef]
  50. Byun, S.H.; Bar-Sever, Y.E. A new type of troposphere zenith path delay product of the international GNSS service. J. Geod. 2009, 83, 1–7. [Google Scholar] [CrossRef] [Green Version]
  51. Akoglu, H. User’s guide to correlation coefficients. Turk. J. Emerg. Med. 2018, 18, 91–93. [Google Scholar] [CrossRef]
Figure 1. Schematic diagram for the monitoring of a typical tropical cyclone’s movement: (a) The edge of the tropical cyclone reaches a site; (b) The center of the tropical cyclone is closest to the site and begins to leave.
Remotesensing 15 03247 g001
Figure 2. Geographical distribution of the GNSS stations (purple squares) and RS stations (yellow circles).
Remotesensing 15 03247 g002
Figure 3. Time series of 1-h IGS-ZTD and ERA5-ZTD over the 10 GNSS stations in Table 1.
Remotesensing 15 03247 g003aRemotesensing 15 03247 g003b
Figure 4. The time series with 12-h ERA5-ZTD and RS-ZTD over the four randomly selected RS stations.
Remotesensing 15 03247 g004
Figure 5. Linear regression analysis results of the RS-PWV and ERA5-ZTD time series over the RS stations in Figure 4.
Remotesensing 15 03247 g005
Figure 6. Correlation coefficients of the RS-PWV and ERA5-ZTD time series over the RS stations.
Remotesensing 15 03247 g006
Figure 7. Spatial distributions of ZTD on the route of four tropical cyclones Merbok (a), ROKE (b), Neast (c) and Hato (d) during the four tropical cyclones’ periods.
Remotesensing 15 03247 g007
Figure 8. The paths of Merbok, ROKE, Neast and Hato, and the selected ERA5 grids around the path during the tropical cyclone’s period.
Remotesensing 15 03247 g008
Figure 9. The time series with 1-h ZTD over the six ERA5 girds in Figure 8 during the three-day tropical cyclone periods of 10–12 June (a), 21–23 July (b), 27–29 July (c) and 21–23 August (d).
Remotesensing 15 03247 g009
Table 1. Geodetic coordinates and elevations of 10 GNSS stations.
StationEast Longitude (°)North Latitude (°)Elevation (m)
BJFS115.8939.6087.5
CHAN125.4443.79273.2
CKSV120.2222.9959.7
HKSL113.9222.3795.3
HKWS114.3322.4363.8
JFNG114.4930.5171.3
KMNM118.3824.4649.1
SHAO121.2031.0922.0
TWTF121.1624.95201.5
TCMS120.9824.7977.2
Table 2. Bias, RMS and STD of the ERA5-ZTD time series compared with the IGS-ZTD time series in Figure 3.
StationBias (mm)RMS (mm)STD (mm)
BJFS5.117.216.4
CHAN5.413.011.9
CKSV8.119.317.5
HKSL7.815.713.7
HKWS7.315.914.1
JFNG5.717.516.5
KMNM7.516.815.0
SHAO8.119.217.3
TWTF1.417.317.3
TCMS7.219.518.1
Mean6.417.115.78
Table 3. The number, geodetic coordinates and elevations of the four selected RS stations in Figure 4.
Station NumberEast Longitude (°)North Latitude (°)Elevation (m)
50527119.7049.25653.3
59280113.0823.7078.0
53614106.2038.461112.0
54857120.3336.0677.0
Table 4. Comparisons between the movement velocity estimated from the TDOZA model and the references for the four tropical cyclones.
Tropical CycloneApproaching Velocity (km/h)Leaving Velocity (km/h)
Model #1Model #2ReferenceModel #1Model #2Reference
Merbok15.3216.3522.2519.4820.5124.61
ROKE19.4722.0624.3827.3826.1226.47
Neast15.3115.1015.2236.0831.5833.67
Hato27.6128.7131.2433.7929.6426.66
Disclaimer/Publisher’s Note: The statements, opinions and data contained in all publications are solely those of the individual author(s) and contributor(s) and not of MDPI and/or the editor(s). MDPI and/or the editor(s) disclaim responsibility for any injury to people or property resulting from any ideas, methods, instructions or products referred to in the content.

