Article

Investigating the ERA5-Based PWV Products and Identifying the Monsoon Active and Break Spells with Dense GNSS Sites in Guangxi, China

1
College of Geomatics and Geoinformation, Guilin University of Technology, Guilin 541006, China
2
College of Tourism and Landscape Architecture, Guilin University of Technology, Guilin 541006, China
3
School of Resources and Environmental Science and Engineering, Hubei University of Science and Technology, Xianning 437100, China
*
Author to whom correspondence should be addressed.
Remote Sens. 2023, 15(19), 4710; https://doi.org/10.3390/rs15194710
Submission received: 15 August 2023 / Revised: 22 September 2023 / Accepted: 23 September 2023 / Published: 26 September 2023
(This article belongs to the Special Issue Beidou/GNSS Precise Positioning and Atmospheric Modeling II)

Abstract

:
Precipitable water vapor (PWV) with high precision and high temporal resolution estimated by Global Navigation Satellite System (GNSS) is widely used in atmospheric research and weather forecasting. However, most previous works are not consensual concerning the characteristics of the PWV at different time scales and the identification of active and break spells during summ er monsoon climate in Guangxi, China. Taking radiosonde (RS) observations as reference, a strong correlation (R > 0.97) exists between GNSS PWV and RS PWV with a mean root mean square error (RMSE) of 2.68 mm. The annual, seasonal, monthly, and diurnal PWV variations of three years (2017, 2018 and 2020) over Guangxi in were comprehensively investigated using 104 GNSS stations and the fifth-generation European Centre for Medium-Range Weather Forecasts (ECMWF) Atmospheric Reanalysis (ERA5). The mean annual bias and RMSE between GNSS PWV and ERA5 PWV are −1.04 mm and 2.63 mm, respectively. The monthly bias and RMSE range are −0.77 to 3.87 mm, 1.32 to 4.45 mm, and the daily range is −1.41 to 1.07 mm and 1.11 to 5.02 mm, respectively. Additionally, the adopted average standardized rainfall anomaly criteria also identified 7/7/3 active spells and 5/3/7 break spells during the summer monsoon (June–September) from 2017 to 2020, respectively. During the three-year period, the daily amplitude ranges for active spells varied from 1.41 to 2.49 mm, 0.69 to 5.4 mm, and 0.88 to 1.41 mm, while the ranges for break spells were 2.45 to 6.76 mm, 1.66 to 8.17 mm, and 1.48 to 2.99 mm, respectively. The results show a superior performance of GNSS PWV compared to ERA5 PWV in Guangxi, and the maximum, minimum and occurrence time of PWV anomaly vary slightly with the season and the topography of stations. Despite temperature primarily exhibiting a negative correlation with rainfall, acting as a dampener, a positive correlation remains evident between PWV and rainfall. Therefore, densely distributed GNSS stations exhibit excellent capabilities in quantifying atmospheric water vapor and facilitating real-time monitoring of small and medium-scale weather phenomena.

1. Introduction

Water vapor is paramount in climate change [1], the hydrological cycle, heat exchange and transfer due to spatiotemporal variability, the natural greenhouse effect and latent heat released by condensation [2]. Therefore, an accurate representation of water vapor concentration is crucial for numerical weather prediction [3], extreme weather monitoring [4] and global and regional scale climate models.
Precipitable water vapor (PWV) is a fundamental parameter for studying the upper limit of potential precipitation that can fall from any air column [5,6]. Ground-based instruments such as the radiosonde (RS), spectrometer, microwave radiometer, and sun photometer are impeded by adverse weather conditions, con-strained spatial coverage, and challenges related to data quality. Satellite-derived PWV such as Global Positioning System Radio Occultation (GPSRO) [7,8,9] is susceptible to influences such as clouds, aerosols, and other factors, necessitating intercomparison with reliable measurements to ensure its quality. PWV can be derived from the zenith total delay (ZTD) of Global Navigation Satellite Systems (GNSS) signals [10,11,12], as atmospheric water vapor predominantly contributes to tropospheric delay. GNSS-derived PWV [13] has gained recognition for its reliability, real-time availability, high temporal resolution, and exceptional accuracy (less than 3 mm) [14]. High-precision GNSS PWV plays a crucial role in monitoring and forecasting extreme weather conditions, such as heavy rainfall [15,16] and typhoons [17,18], while also contributing to the analysis and prevention of natural disasters like earthquakes [19,20] and storm surges [21,22] through the provision of reliable data support Nonetheless, as a relatively recent technique, the retrieval of PWV from GNSS still requires extensive exploration and validation across diverse global spatial and temporal scales.
This paper focuses on the characteristics of the PWV above the Guangxi Zhuang Autonomous Region (Guangxi) at low latitudes in southern China. Guangxi exhibits a highly intricate topography, featuring mountainous hilly basins with highlands in the northwest and lowlands in the southeast. It distinctly manifests the hallmark attributes of a subtropical monsoon climate with substantial precipitation and elevated temperatures, which are influenced by its topography and proximity to the ocean [23]. The intricate topography, ample rainfall, and synoptic-scale spatiotemporal circulation patterns emphasized the significance of delving into the regional climate model of Guangxi. Despite numerous studies delving into the characteristics and pivotal roles of GNSS PWV in meteorological processes across various spatiotemporal scales [24,25,26], there remains a dearth of research explicitly concentrating on the annual, seasonal, monthly, and diurnal cycles of dense GNSS PWV within Guangxi. Radiosonde and remote sensing data have been assimilated into atmospheric analysis data products, but the PWV data detected by GNSS has not yet been assimilated [27]. Therefore, to explore the coordination and applicability of different datasets in Guangxi, a comprehensive comparison is undertaken between the PWV derived from the Continuously Operating Reference Stations (CORS) [28] and the fifth-generation European Centre for Medium-Range Weather Forecasts (ECMWF) Atmospheric Reanalysis [29] (ERA5) over different time scales.
The quantity of precipitation received by a station is controlled by the amount of available water vapor, degree of saturation, and the conducive dynamic mechanism to provide required condensation and form droplets that fall to the earth’s surface. The elevated atmospheric water vapor content but the absence of rainfall in summer suggests a significant contribution of local evaporation to atmospheric water vapor when horizontal moisture transport is limited. Furthermore, existing studies indicate a strong correlation between PWV and multiple factors, such as latitude-dependent solar radiation [30] (i.e., seasons), temperature [31,32], and the geographical positioning of GNSS stations—encompassing proximity to lakes or coasts, placement within valleys, atop mountains, or on islands [33]. Therefore, this study also identified the active/break spell of the Guangxi summer monsoon by average standardized rainfall anomaly criteria and analyzed the variation of PWV and rainfall during these time periods. Moreover, the Pearson correlation coefficients between PWV, surface temperature, rainfall, and Precipitation efficiency (PE) [34] were calculated to understand the role of each meteorological factor.
The paper is structured as follows: Section 2 describes the datasets and methodology after this Introduction. The comparison and analysis between GNSS PWV and ERA5 PWV are in Section 3. The active/break spell and the interrelationships of PWV between multiple meteorological parameters are in Section 3.3. Finally, the Conclusions are in Section 4.

2. Data and Methodology
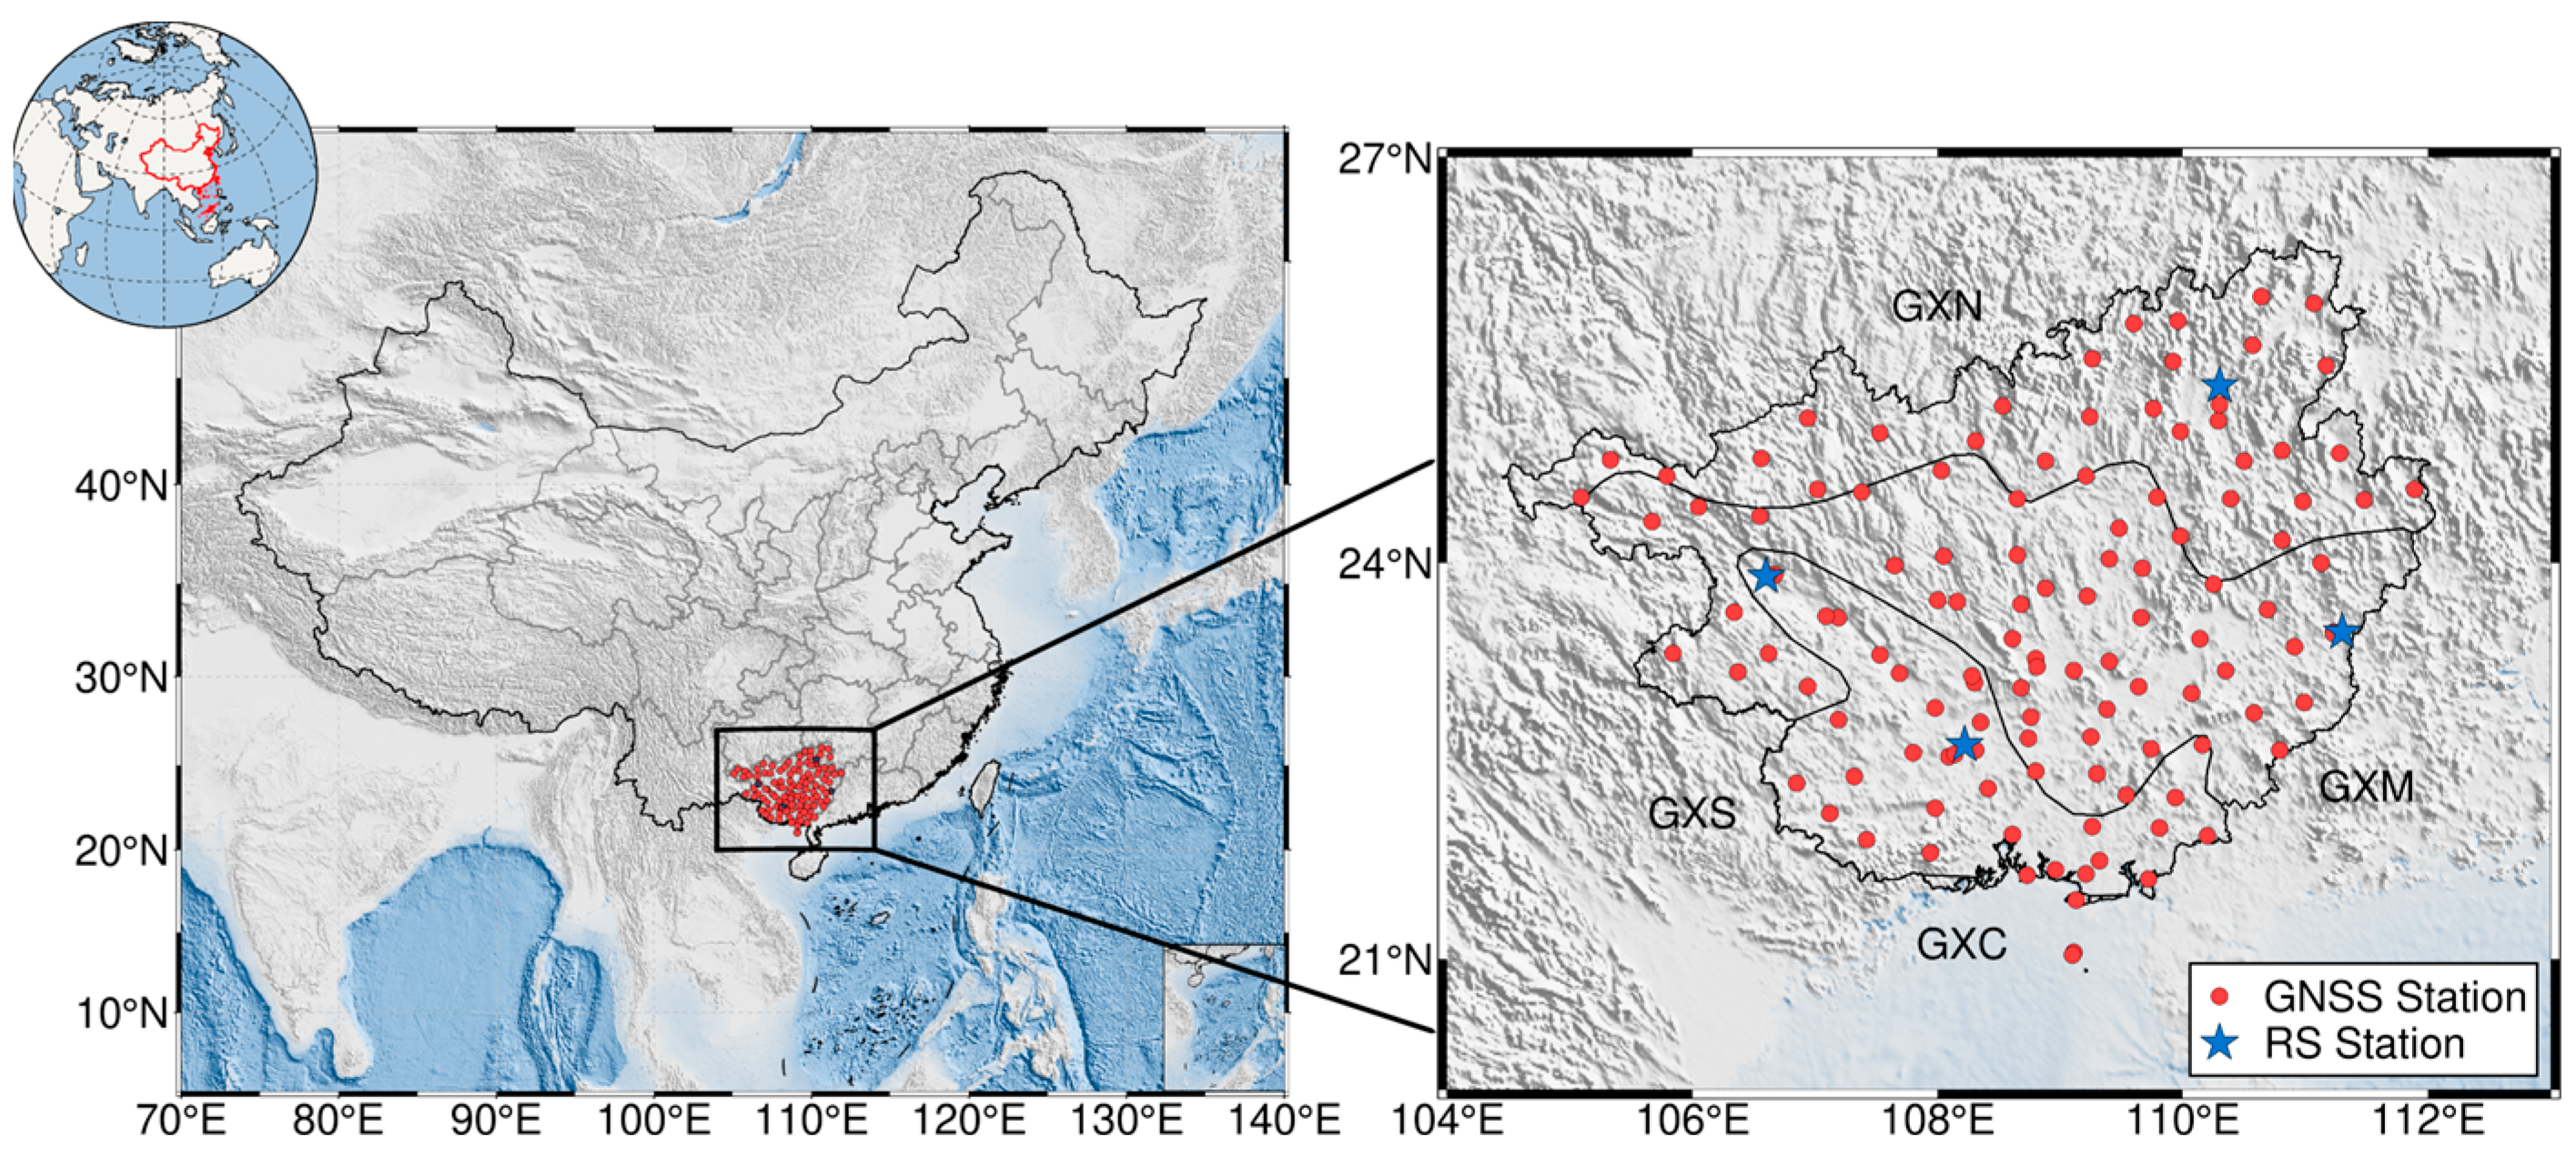
2.1. GNSS PWV

In this experiment, due to significant data gaps in the GNSS observations for the year 2019, we utilized data from the years 2017, 2018, and 2020 spanning a three-year period. The GNSS observations from 2017 to 2020 collected at 121 stations were processed using the GNSS at Massachusetts Institute of Technology (GAMIT) software, as shown in Figure 1. And the required meteorological observations and hourly rainfall data are provided by the China Meteorological Administration (CMA). We combined dense GNSS stations with co-located meteorological observations, ensuring the retrieved PWV has high spatial resolution and accuracy. This approach allows for comprehensive PWV assessment and analysis in Guangxi with complex terrain and unique meteorological conditions, despite the higher vertical resolution and broader coverage advantages of GPSRO. Notably, there are apparent observation gaps in the time series of GNSS stations and meteorological (MET) stations, so we screened stations with the annual hourly records of each station exceeded 80%. Consequently, the observations of 104 GNSS stations in Guangxi were finally selected, which still ensures the coverage of diverse geographic regions with varying climatic conditions. Given the dense distribution of GNSS stations and most lack meteorological sensors, we selected for meteorological stations within a 30 km radius of each GNSS station. The formulas are as follows [35]:
T s = T 0 β h h 0 ,
P s = P 0 1 β T 0 h h 0 g M R β ,
where T s and P s are the surface temperature (K) and surface pressure (hPa) of GNSS station, T 0 and P 0 are the surface temperature and pressure at the MET station, respectively; h and h 0 are the elevation (m) of GNSS station and MET station. M is the molar mass of dry air of 0.02896444   kg / m 3 , R is the ideal gas constant of 8.31432   J / K mol .
And gravitational coefficient g , lapse rate parameters β are expressed as follows:
g = 9.8063 1 10 7 h + h 0 2 1 0.0026373 cos ( 2 φ ) + 5.9 10 6 cos 2 ( 2 φ ) ,
β ( φ , θ , D O Y ) = δ 1 + δ 2 φ + δ 3 θ + δ 4 cos 2 π D O Y 365.25 + δ 5 sin 2 π D O Y 365.25 + δ 6 cos 4 π D O Y 365.25 + δ 7 sin 4 π D O Y 365.25 ,
where φ , θ and DOY are latitude, longitude (radian) and the day of year, respectively. δ 1 , δ 2 , δ 3 , δ 4 , δ 5 , δ 6 and δ 7 are the model coefficients.
In GNSS data processing, ZTD is estimated, and the zenith hydrostatic delay (ZHD) is modelled to access the zenith wet delay (ZWD). ZHD can be modelled by the Saastamoinen formula [36] expressed as a function of surface pressure P s , latitude φ and ellipsoid height H . The basic formula for deriving PWV from GNSS observations is as follows:
Z T D = Z H D + Z W D ,
P W V = 10 6 ρ w R v k 3 T m + k 2 Z W D ,
where ρ W is the density of liquid water of 1 × 10 3   kg / m 3 , R v is the water vapor gas constant of 461.495   J kg 1 K 1 , and k 2 , k 3 are the empirical values of atmospheric physical parameters of 22.13 ± 2.20   K / hPa and 3.739 ± 0.012   ×   10 5   K 2 / hPa , respectively. T m is the atmospheric weighted mean temperature calculated from surface temperature (K) T s , latitude (radian) φ and days of year D O Y . a 0 , a 1 , a 2 , a 3 , a 4 , a 5 and a 6 are the model coefficients.
T m ( T s , φ , D O Y ) = a 0 + a 1 T s + a 2 φ + a 3 cos 2 π D O Y 365.25 + a 4 sin 2 π D O Y 365.25 + a 5 cos 4 π D O Y 365.25 + a 6 sin 4 π D O Y 365.25 ,
The calculation accuracy of T m influences the outcome of GNSS-derived PWV [37,38,39]. While numerous classical Tm models are suitable for regional [40,41,42], we utilized the observations of four RS stations from 2013 to 2015 to establish an empirical model specific to the Guangxi region (GXTm). Taking RS observations in 2016 as a reference, the classical linear model [14] T m = 70.2 + 0.72 T s and the third-generation global pressure and temperature (GPT3) model [43,44] were introduced to validate the accuracy of GXTm. The results show that the root mean square error (RMSE) of the GXTm is reduced by 26% and 34% compared with Bevis’s model and GPT3, respectively.

2.2. RS PWV

The RS observations contain meteorological parameters of the atmospheric profile collected by radiosonde balloons with a time resolution of 12 h per day (UTC 00:00/UTC 12:00) [45]. In order to minimize the impact of distance and elevation, 12 GNSS stations were selected based on the criteria that the distance between RS stations and GNSS stations is within 30 km and the elevation difference is within 500 m. T m and PWV can be calculated from RS observations by the numerical integration method as follows:
T m = e i T i d z e i T i 2 d z ,
PWV = 1 g P i P i + 1 q   d P = 1 g P i P i + 1 q P ,
where T i and e i are the absolute temperature (K) and water vapor pressure (hPa) at the height level, respectively. g is the acceleration due to gravity, q represents specific humidity ( g / kg ), P i + 1 and P i are the pressures of upper and lower layers (hPa), respectively.

2.3. ERA5 PWV

ERA5 is generated using the 4D-Var data assimilation scheme of the CY41R2 model of the integrated forecast system (IFS) of ECMWF, which includes the latest multi-satellite sounders, imagers, and ground-based data through assimilation [46,47,48]. ERA5 provides hourly atmospheric reanalysis data at 37 pressure levels from 1000 hPa to 1 hPa with a horizontal spatial resolution of 0.25° × 0.25° (longitude × latitude) [27]. The ERA5 hourly surface gridded PWV from 2017 to 2020 was used to compare with the GNSS PWV to verify its applicability in monitoring PWV in Guangxi. Since the reanalysis gridded data of ERA5 are not strictly collocated with the GNSS stations, spatial adjustments of the reanalysis data to the stations are also required [49]. First, the ERA5 PWV of the four grid points around the station were vertically adjusted to be the same as the station height. Then, bilinear interpolation is performed on the ERA5 PWV of the four grid points after the unified height to complete the horizontal adjustment. The vertical adjustment formula is as follows.
P W V h 1 = P W V h 2 exp β h 1 h 2 ,
β ( D O Y ) = A 0 + A 1 cos D O Y 365.25 2 π + A 2 sin D O Y 365.25 2 π + A 3 cos D O Y 365.25 4 π + A 4 sin D O Y 365.25 4 π ,
where P W V h 1 and P W V h 2 represent the PWV values at heights (km) h 1 and h 2 , respectively. PWV lapse rate β (mm/km) can be calculated by days of year. A 0 , A 1 , A 2 , A 3 and A 4 are the model coefficients.
The elevation difference is one of the main reasons affecting the comparison results of different PWV datasets, so we followed the method of Wang et al. [50] to unify the height of RS PWV and ERA5 PWV into the geodetic height.

2.4. Statistical Indicators

Noted that the observations will be filtered if the bias between it and its average value exceeds three times the standard deviation (STD). Therefore, the abnormal PWV caused by long-term measurement under various conditions has been eliminated by this control principle. To calculate the daily mean values, we averaged the 24-h PWV data, and a similar procedure was used to determine the monthly, seasonal, and annual values. To analyze the diurnal cycle of PWV, the hourly PWV anomalies for each station were obtained by subtracting the daily average from the hourly PWV values.
For the analysis of differences, the correlation coefficient (R), bias, RMSE and STD are calculated by the following formulas:
R = i = 1 N X O i X O ¯ X R i X R ¯ i = 1 N X O i X O ¯ i = 1 N X R i X R ¯   ,
Bias   = 1 N i = 1 N X O i X R i   ,
RMSE   = 1 N i = 1 N X O i X R i 2 ,
S T D = 1 N 1 i = 1 N X i X i ¯ 2 .
where X O represents the evaluated value, and X R is the reference value.

3. Results and Discussion

To facilitate the discussion on spatiotemporal PWV variability, the 104 stations in Guangxi were divided into four categories, i.e., northern Guangxi (GXN), central Guangxi (GXM), southern Guangxi (GXS), and Guangxi coast (GXC). For examining PWV variability across different time scales, March to May represents the pre-monsoon season (PreM), June to September is the summer monsoon season (MonS), October to November is the post-monsoon season (PostM), and December to February is winter. Additionally, to analyze the day-night difference and daily cycle of PWV throughout Guangxi, all dataset timestamps expressed in UTC were converted to local time (LT) using an eight-hour offset.

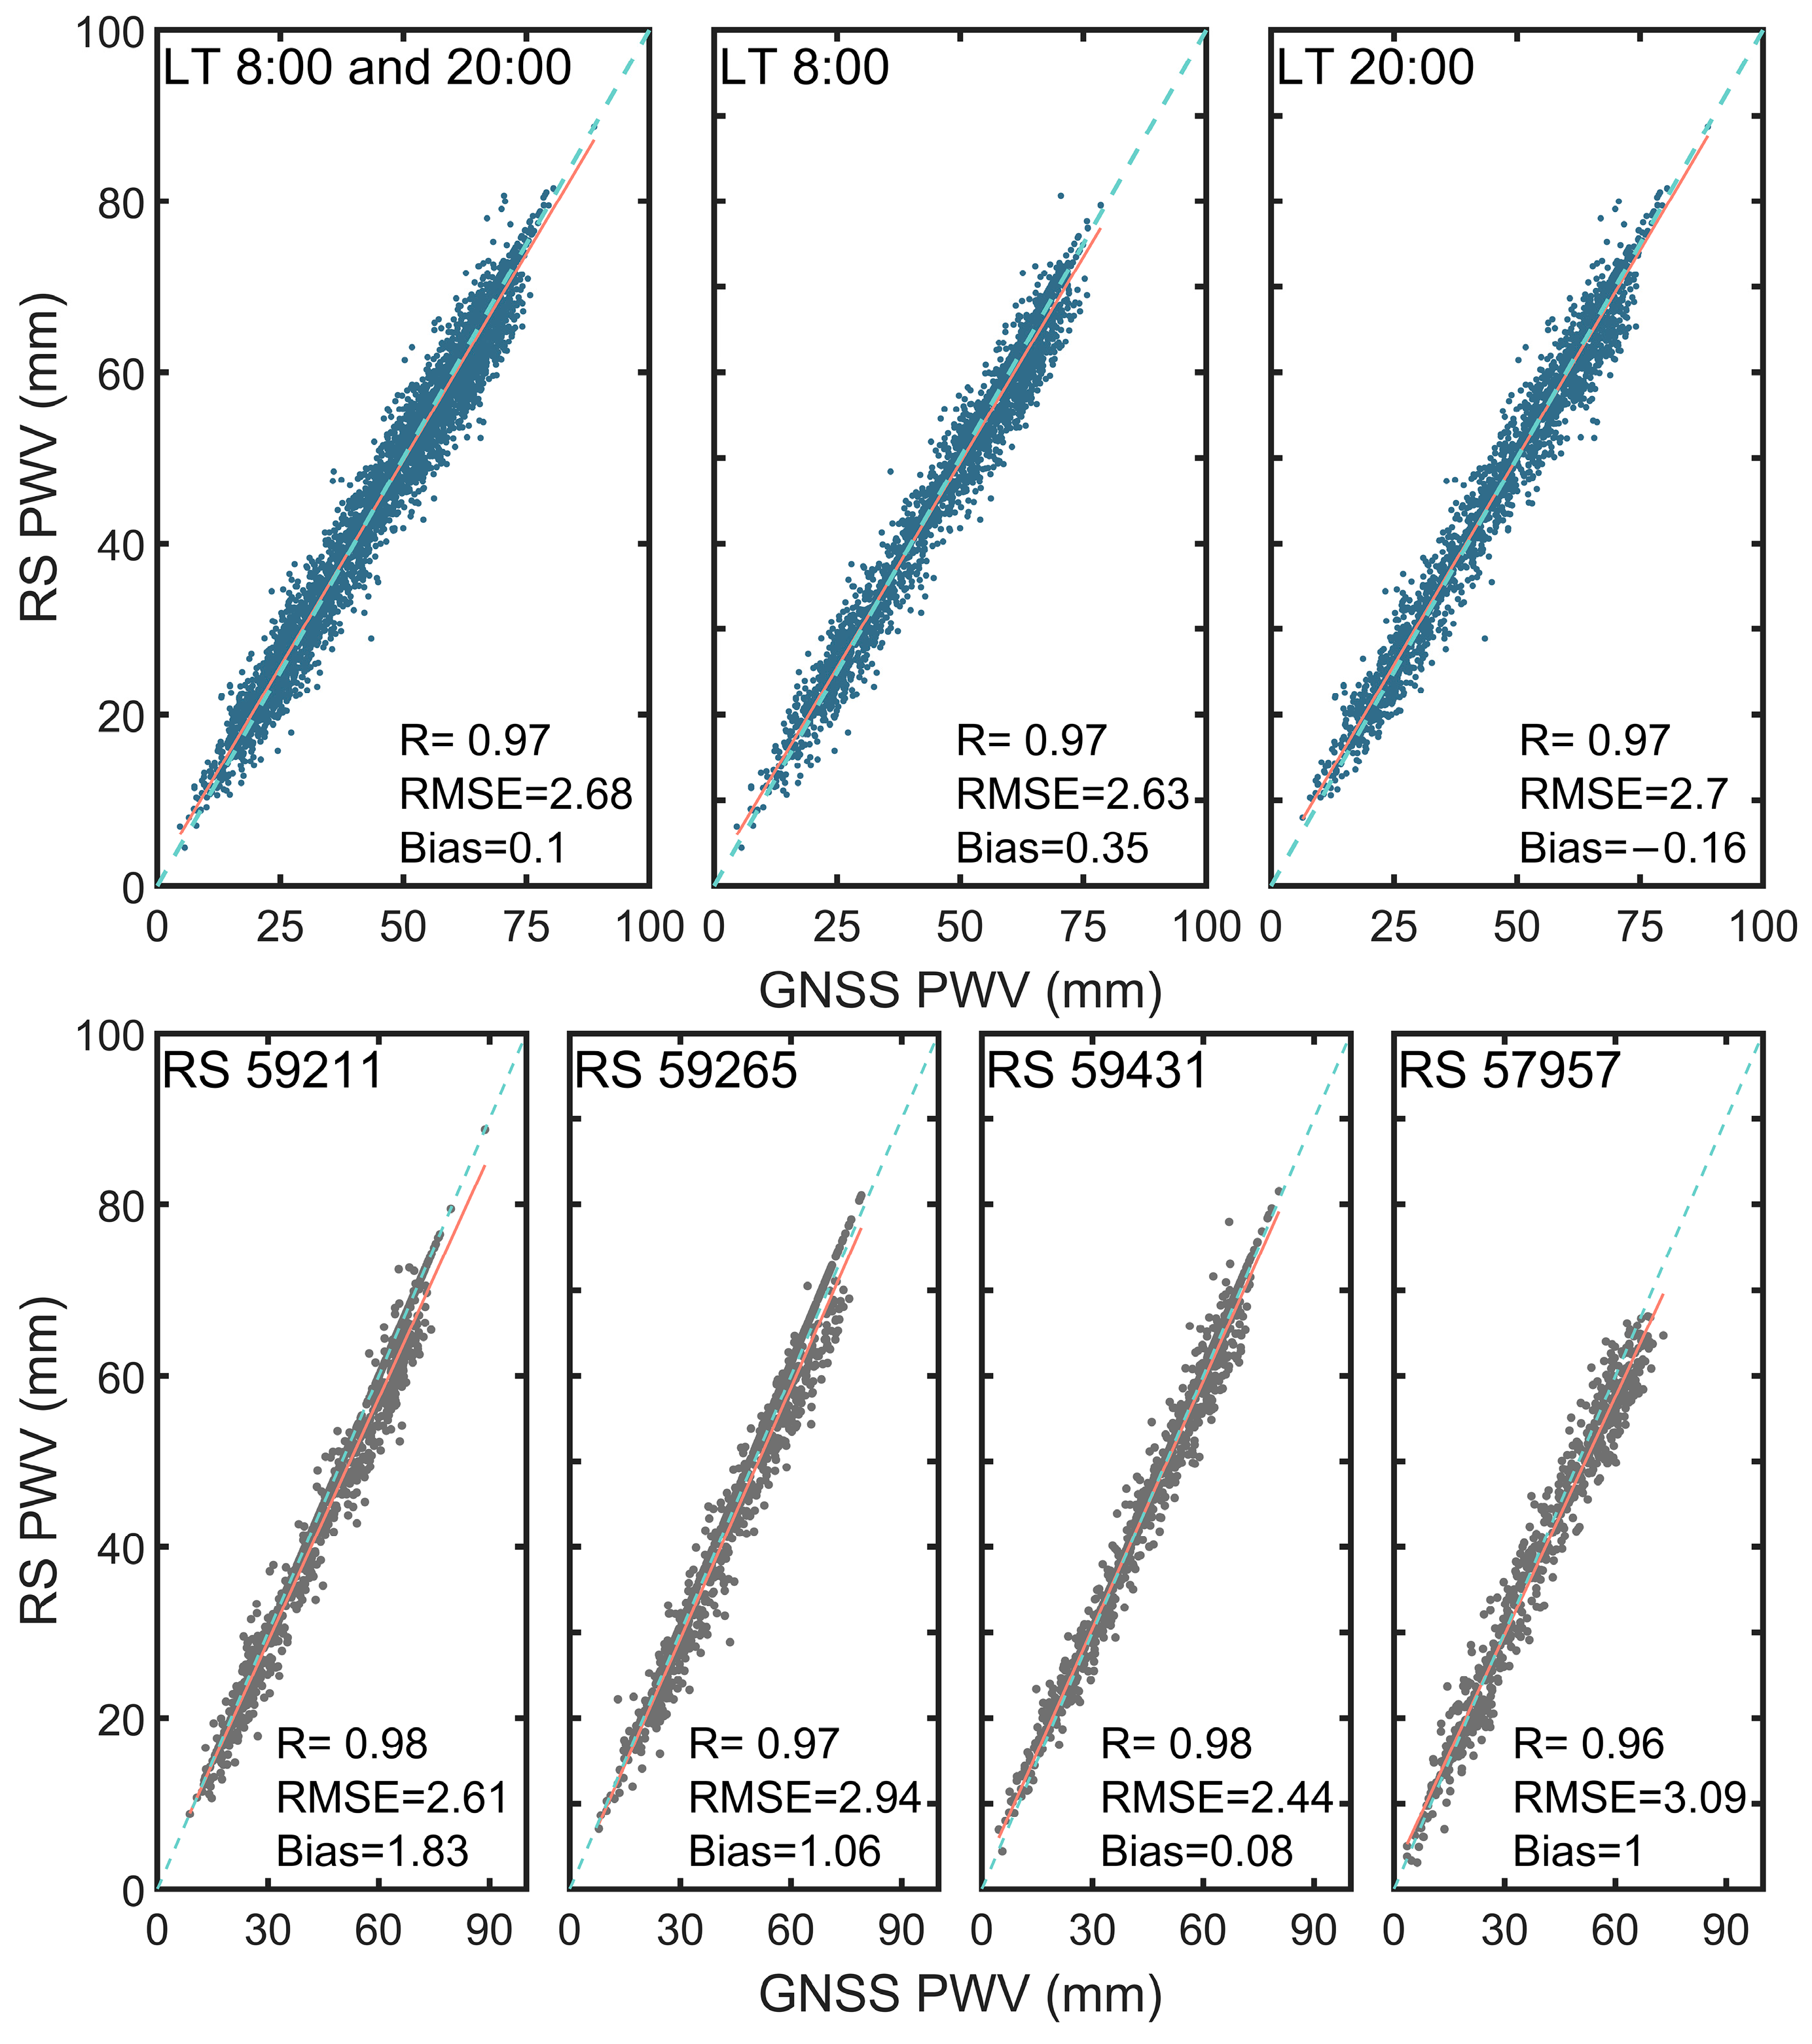
3.1. Evaluation with RS PWV

The correlation, mean bias and RMSE between GNSS PWV and RS PWV at three different times (daily, LT 8:00 and LT 20:00) from 2017 to 2020 were computed. As depicted in Figure 2, the high correlation coefficients between GNSS PWV and RS PWV are all 0.97 at three different times. The mean biases and mean RMSEs at three different times are 0.10/0.35/−0.16 mm, 2.68/2.63/2.70 mm, respectively. The mean RMSE is less at LT 8:00 than at LT 20:00, whereas the mean bias exhibits the opposite trend. The difference between daytime and nighttime observations might be attributed to the substantial solar radiation in Guangxi during daylight hours, leading to more complex variations in water vapor content compared to night. Moreover, the comparison between GNSS PWV and RS PWV might be influenced by recognized RS’s radiative dry bias in daytime humidity observations [51]. Mengistu et al. [52] have observed a parallel phenomenon while examining the relationship between GNSS PWV and co-located RS PWV. The notable correlation between GNSS PWV and RS PWV in the study might be due to the distinct GNSS processing methodologies and the utilization of the specialized GXTm model for converting ZTD to PWV.
Figure 2 illustrates the high correlation in PWV (R > 0.96) between 4 RS stations and the chosen co-located GNSS stations, and the mean RMSE of approximately 3 mm conforming to the standard of GNSS PWV applied to meteorology [35]. Most stations exhibit positive mean biases at different times are negative, suggesting that GNSS PWV is generally wetter than RS PWV within Guangxi. Zhao et al. [53] concluded that the mean RMS and bias between 52 GNSS PWV and RS PWV were 2.25 and 1.57 mm, respectively, and analyzed diurnal PWV variations in China. Huang et al. [54] discovered t that the mean bias and RMSE between GNSS PWV and RS PWV in Guilin, China, were −0.9 mm and 3.53 mm, respectively. These values indicate that in low-latitude regions, the accuracy of GNSS PWV relative to RS PWV is relatively low, emphasizing the need for further analysis. To assess the seasonal variation across the two datasets, the monthly biases and RMSEs are presented in Table 1. Monthly biases and RMSE values are consistently higher during MonS throughout the year, with a maximum of 2.24 mm and 1.58 mm in August, respectively.

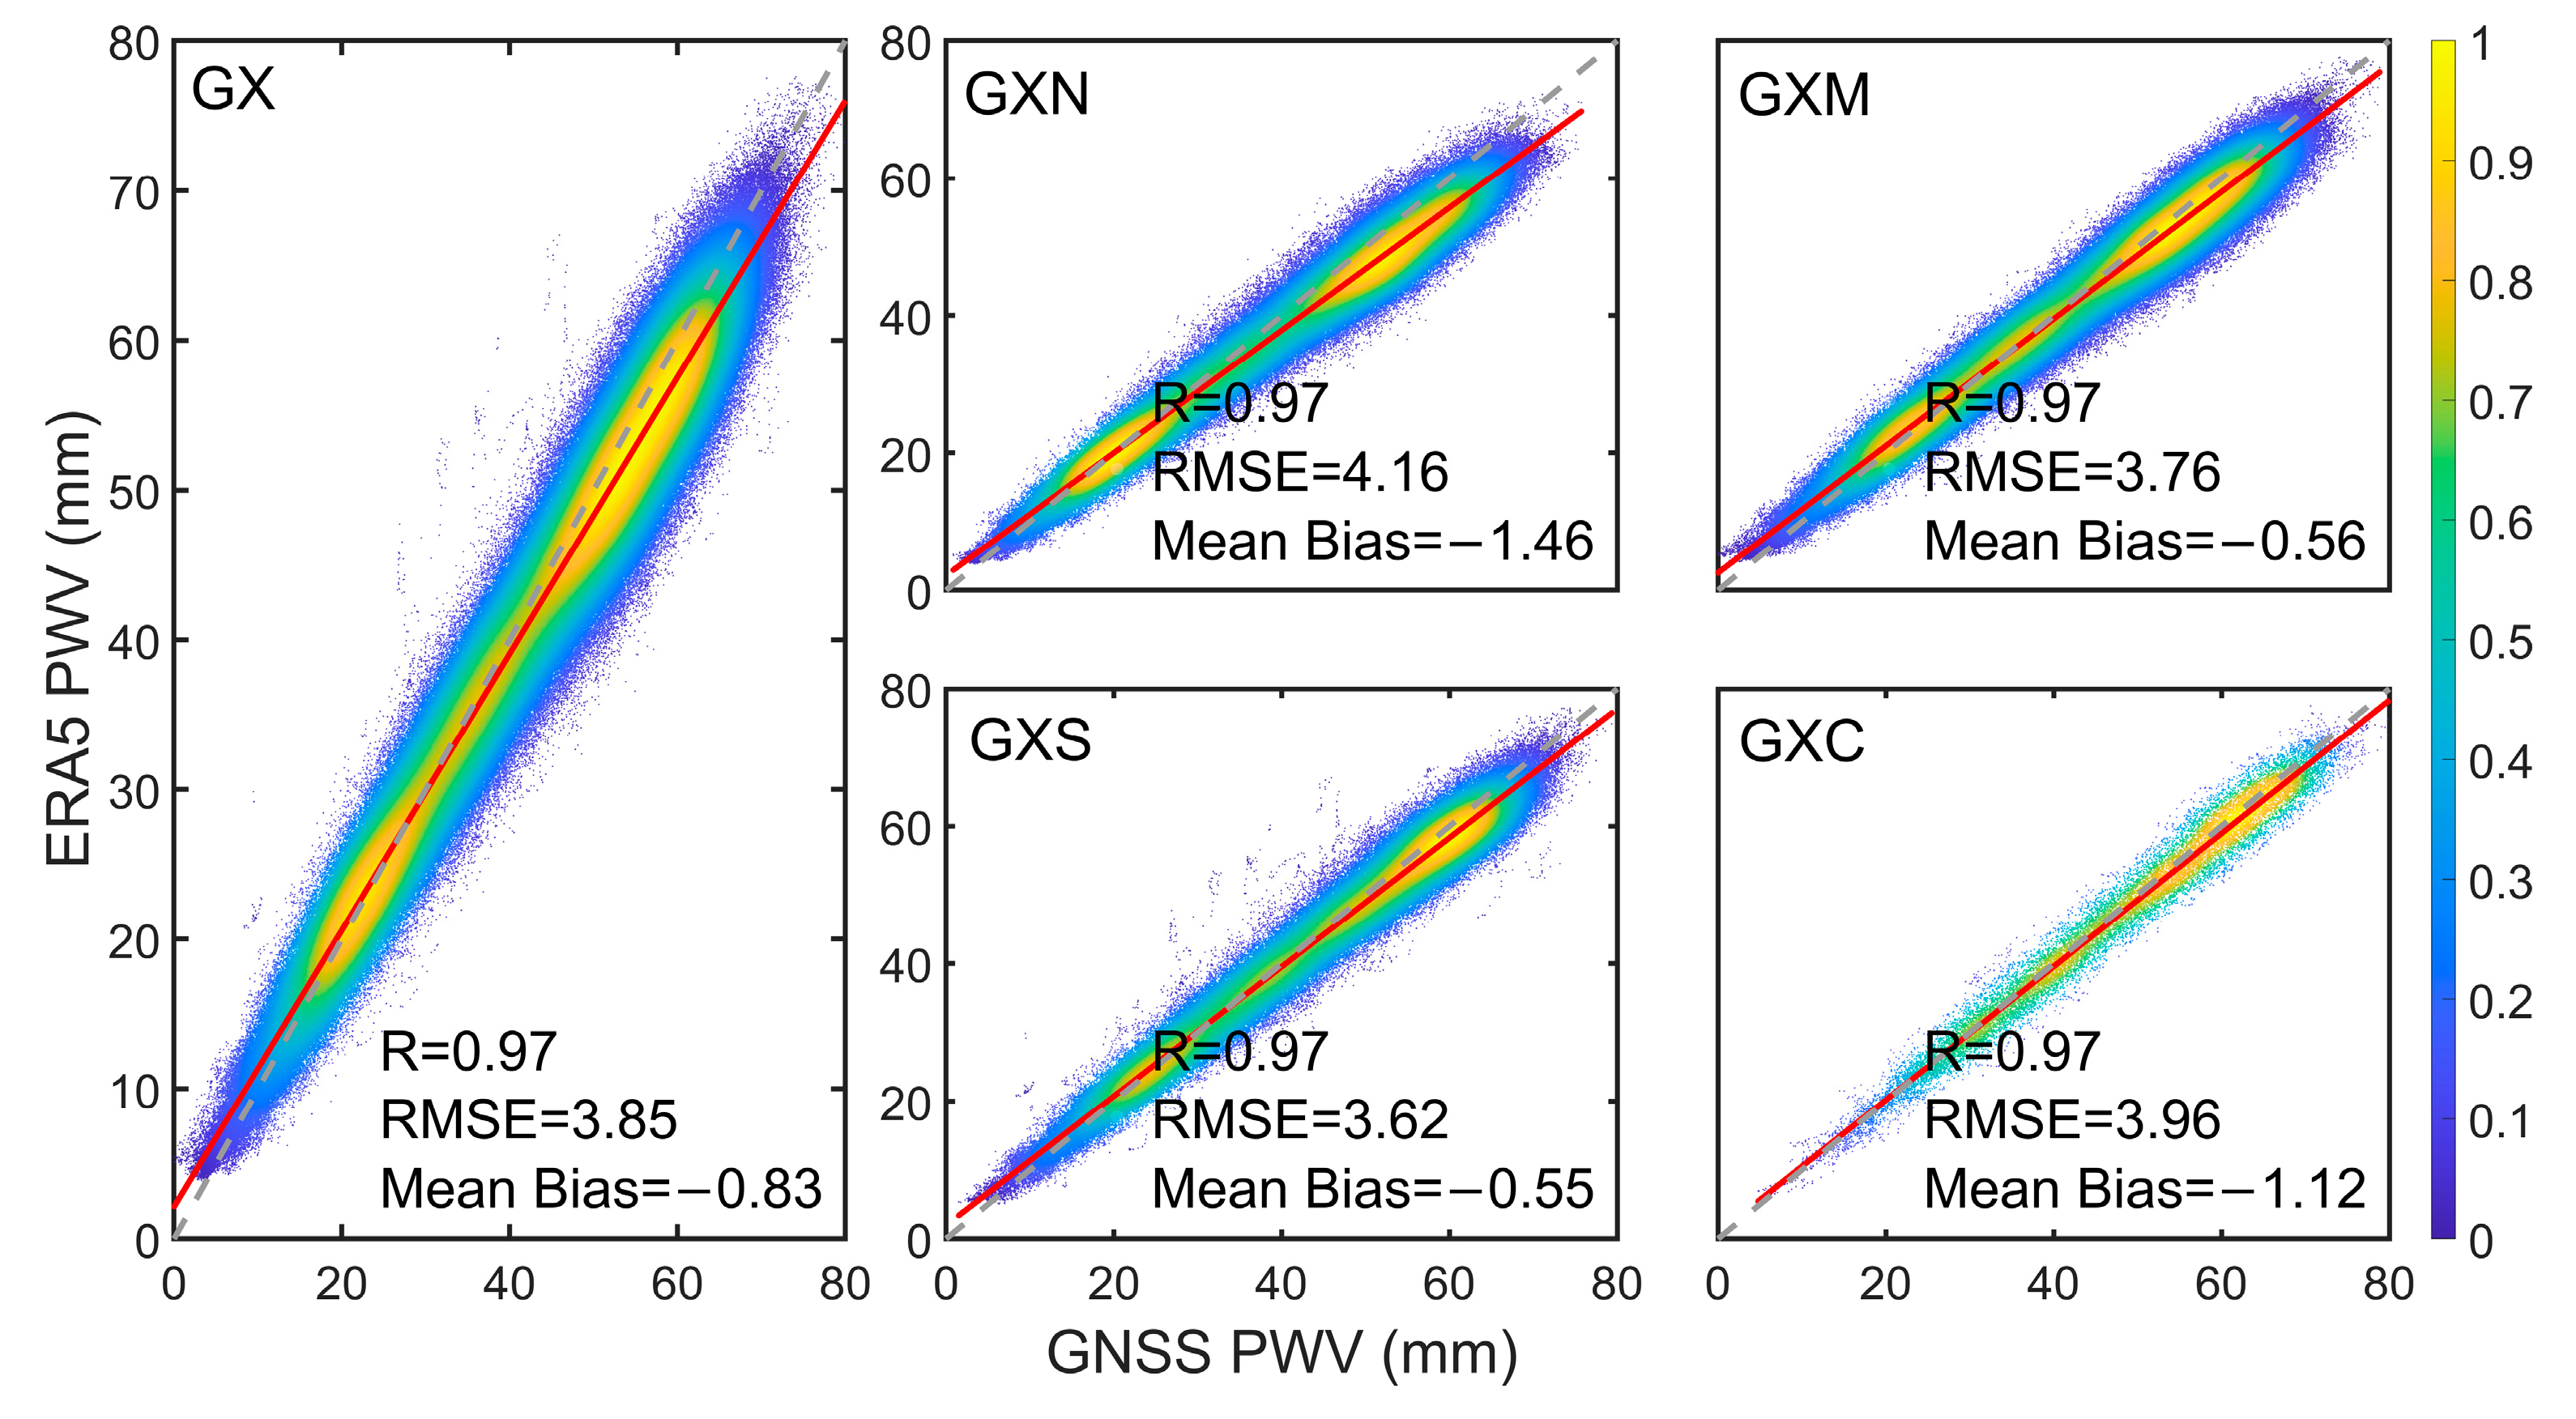
3.2. Comparison of GNSS PWV and ERA5 PWV

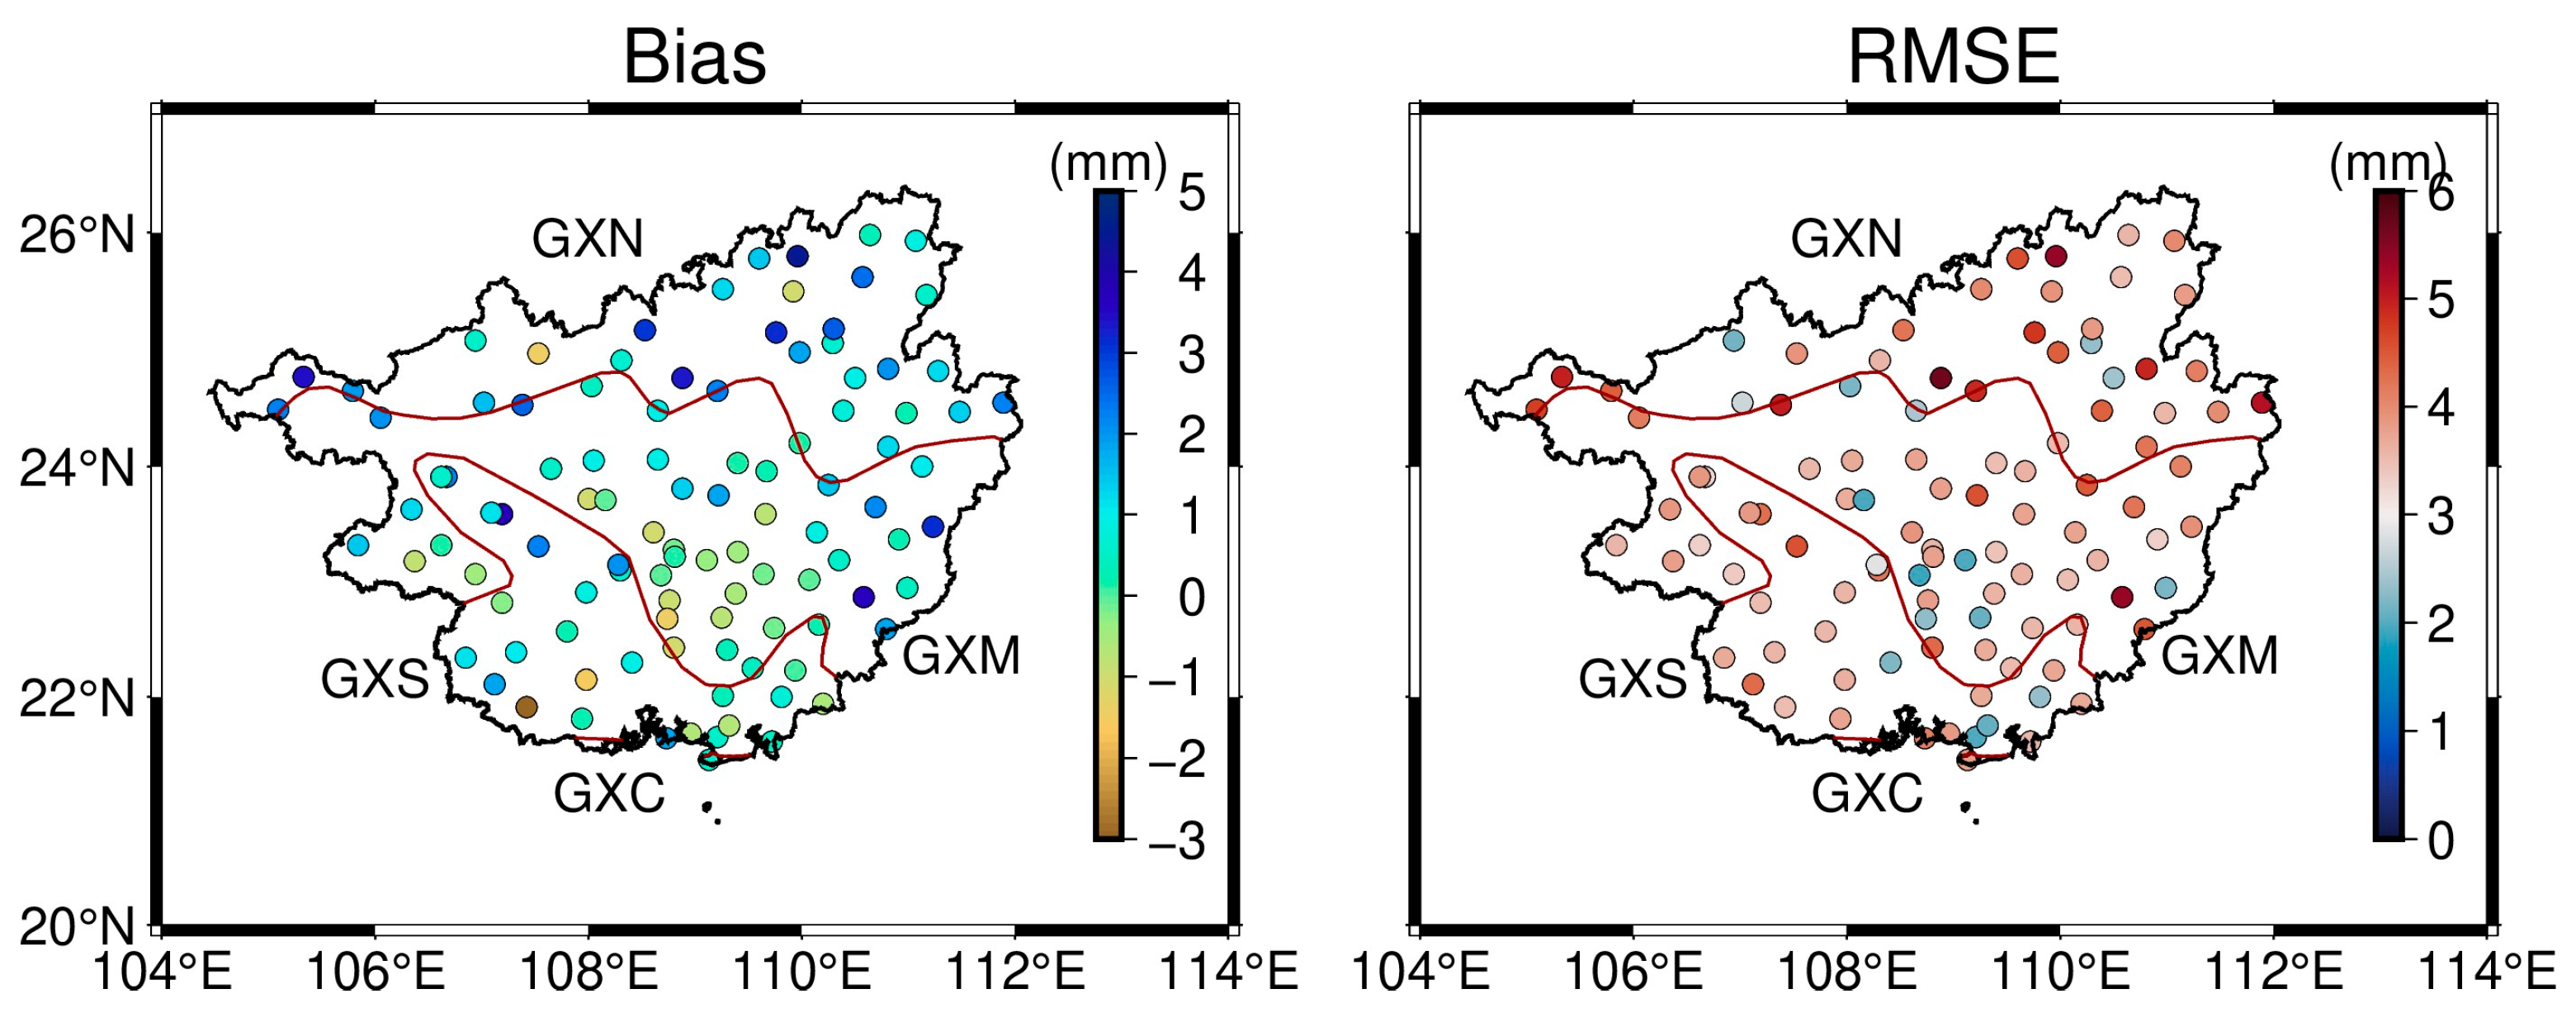
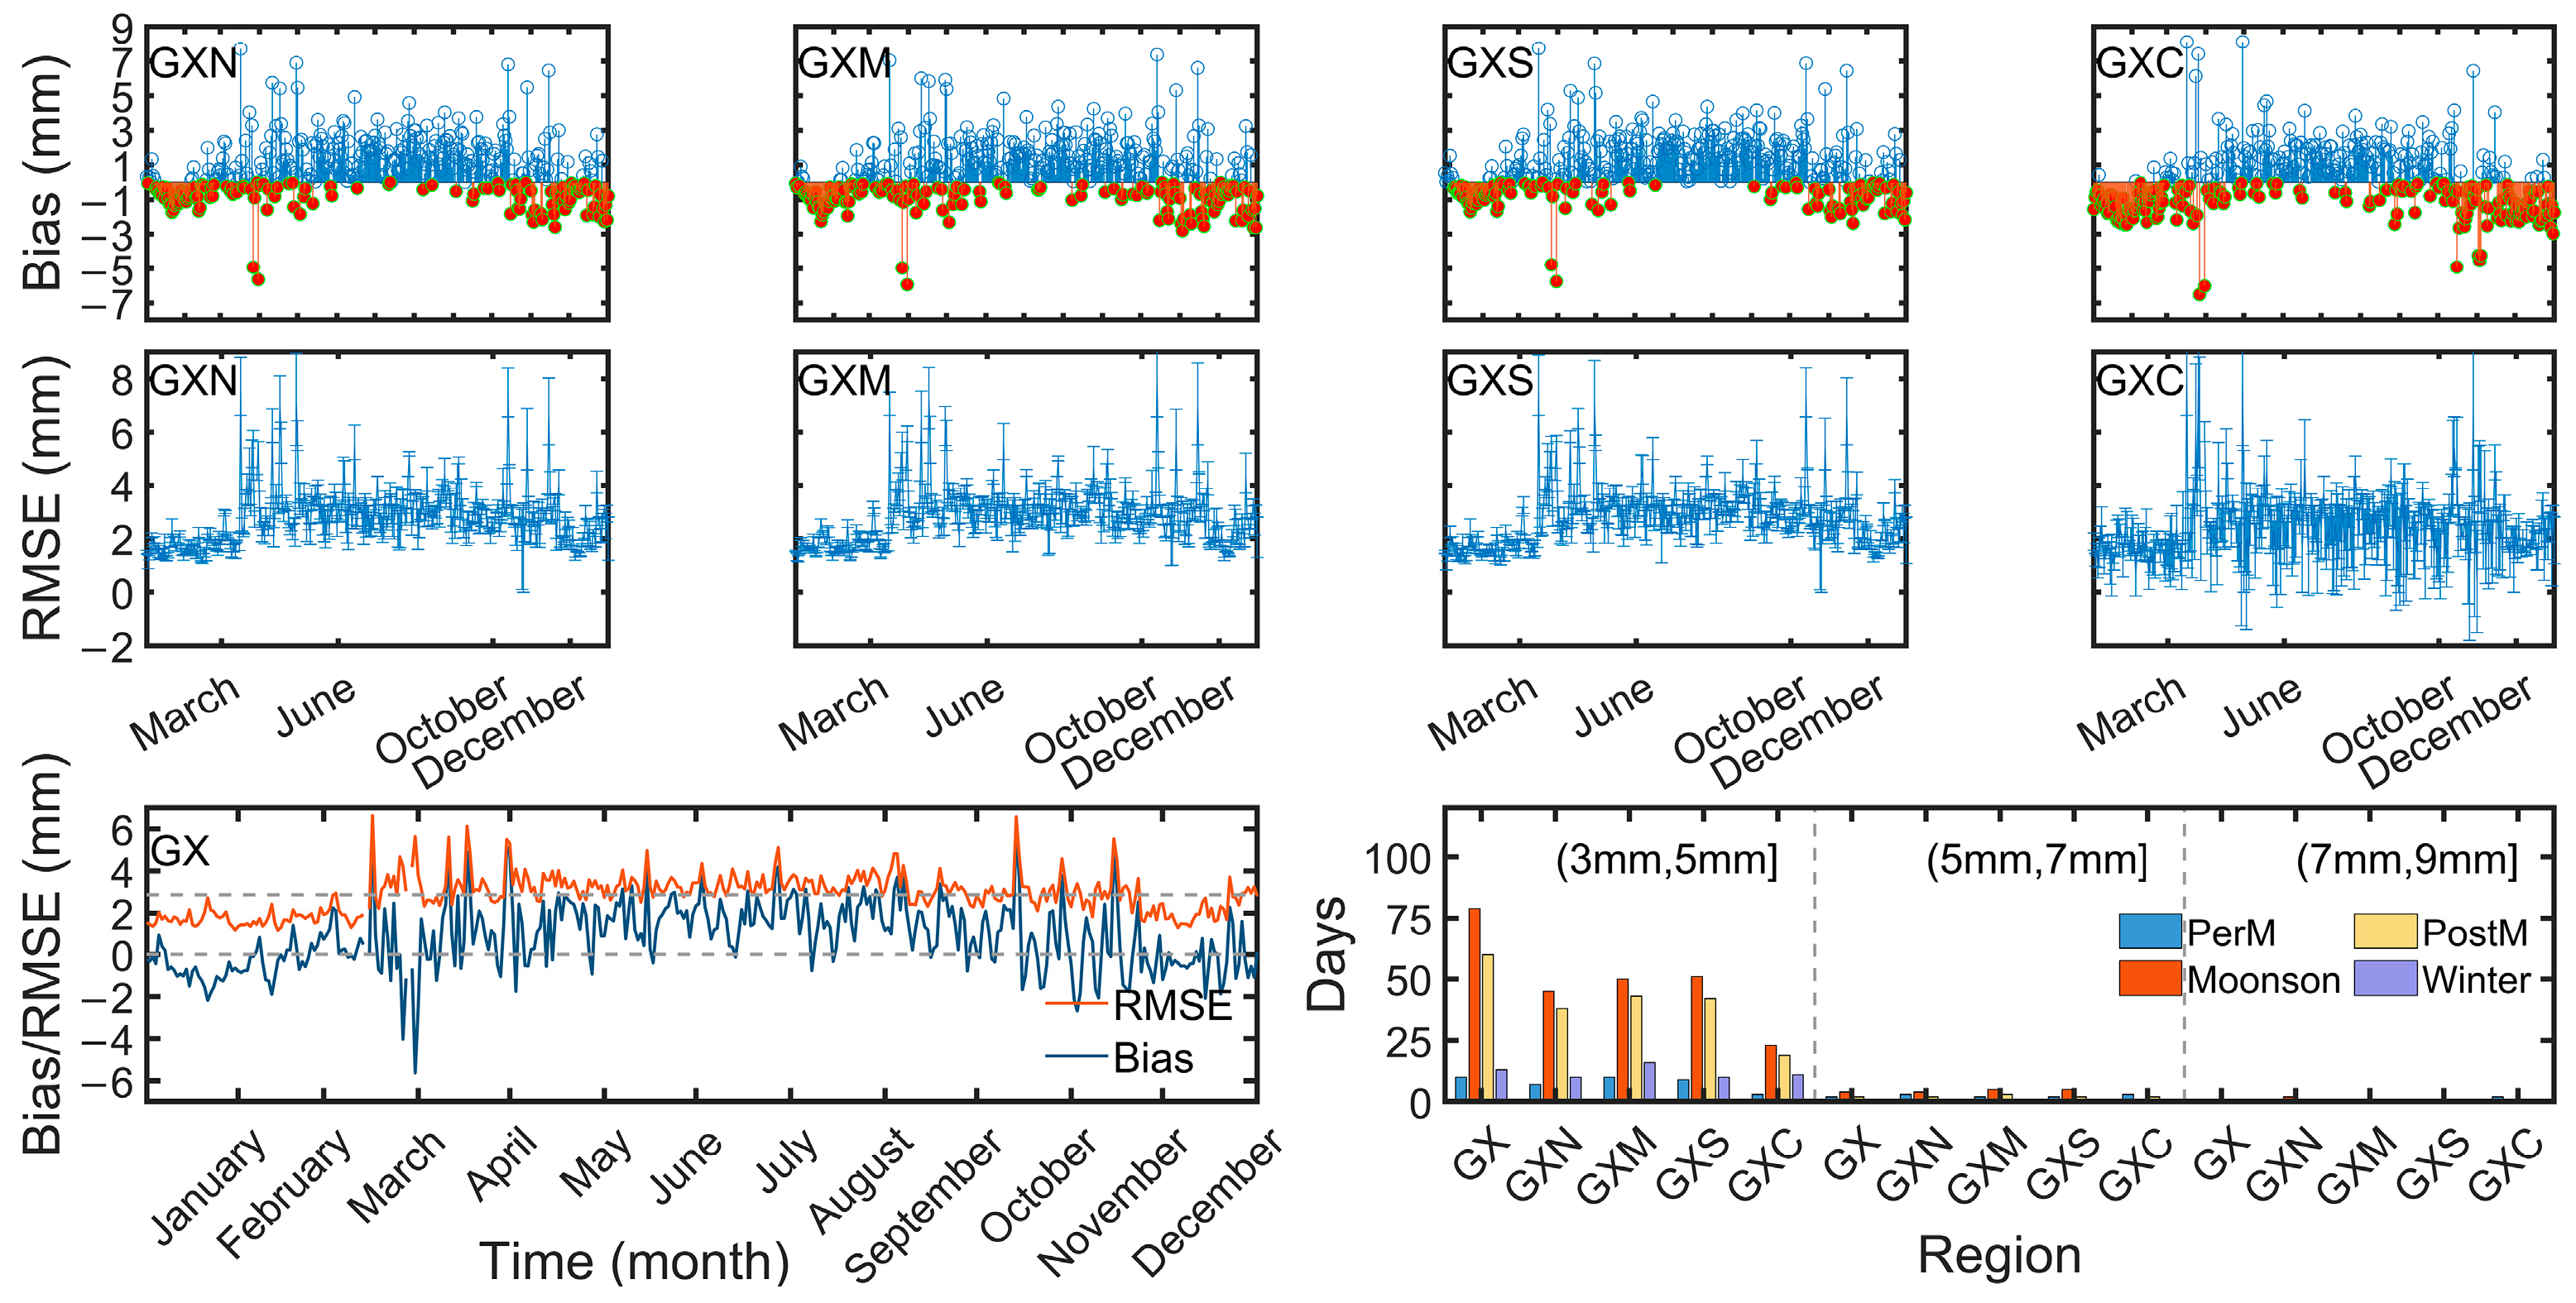
3.2.1. Spatial and Annual PWV Variability

To explore more detailed and comprehensive characteristics of PWV, we selected the ERA5 PWV covering Guangxi for comparison with the PWV of 104 GNSS stations though RS PWV evaluates the excellent performance of GNSS PWV. In Figure 3, the correlations, mean bias and RMSE between GNSS PWV and corresponding ERA5 PWV in the entire Guangxi region and four subregions from 2017 to 2020 are counted separately. The high correlation (R = 0.97) between GNSS PWV and ERA5 PWV shows the substantial influence of ground station deployment density and data quality on the consistency and evaluation accuracy between different datasets. In the whole Guangxi and the four subregions, both GNSS PWV and ERA5 PWV exhibit negative mean bias ranging from −1.46 to −0.55 mm, and RMSE falling between 3.62 to 4.16 mm. Compared to GNSS PWV, ERA5 PWV demonstrates poorer accuracy in detecting water vapor due to its larger mean bias and RMSE in specific GXN regions. The elevated terrain of the GXN region, coupled with the distribution of mountains, contributes to the intricate water vapor accumulation patterns. Moreover, the lower RMSE and the insignificant PWV amplitude are observed in the GXC region due to the relatively limited station coverage and the utilization of data from only two stations.
Figure 4 shows the distribution of mean annual bias and RMSE between the 104 GNSS PWV and ERA5 PWV from 2017 to 2020. The range of mean annual bias in the GX region is −2.93 to 4.45 mm, and RMSE is 1.91 to 5.67 mm. And positive biases are evident in 75% of the stations across Guangxi, whereas 25% are negative, predominantly concentrated in the GXM area. In GXN region, station ‘jz86’ has the largest mean annual bias (4.45 mm), station ‘jz72’ has the largest RMSE (5.68 mm), as well as stations ‘jz97’, ‘jz86’ and ‘jz43’ in GXN all have relatively large RMSE. Additionally, the higher RMSE values of the stations in the northwestern region of Guangxi, near the Yunnan-Kweichow Plateau, reflect the unstable water vapor conditions. This instability could be attributed to the water vapor accumulation obstructed by mountains and the varying warming patterns between valleys and mountains, both of which impact the accurate detection of water vapor. Stations (e.g., ‘gxrx’, ‘j103’, ‘gxwz’, and ‘j100’) located close to water bodies exhibit higher RMSE and bias values, which could potentially result in the noticeable difference between the two datasets in the eastern GXM region.

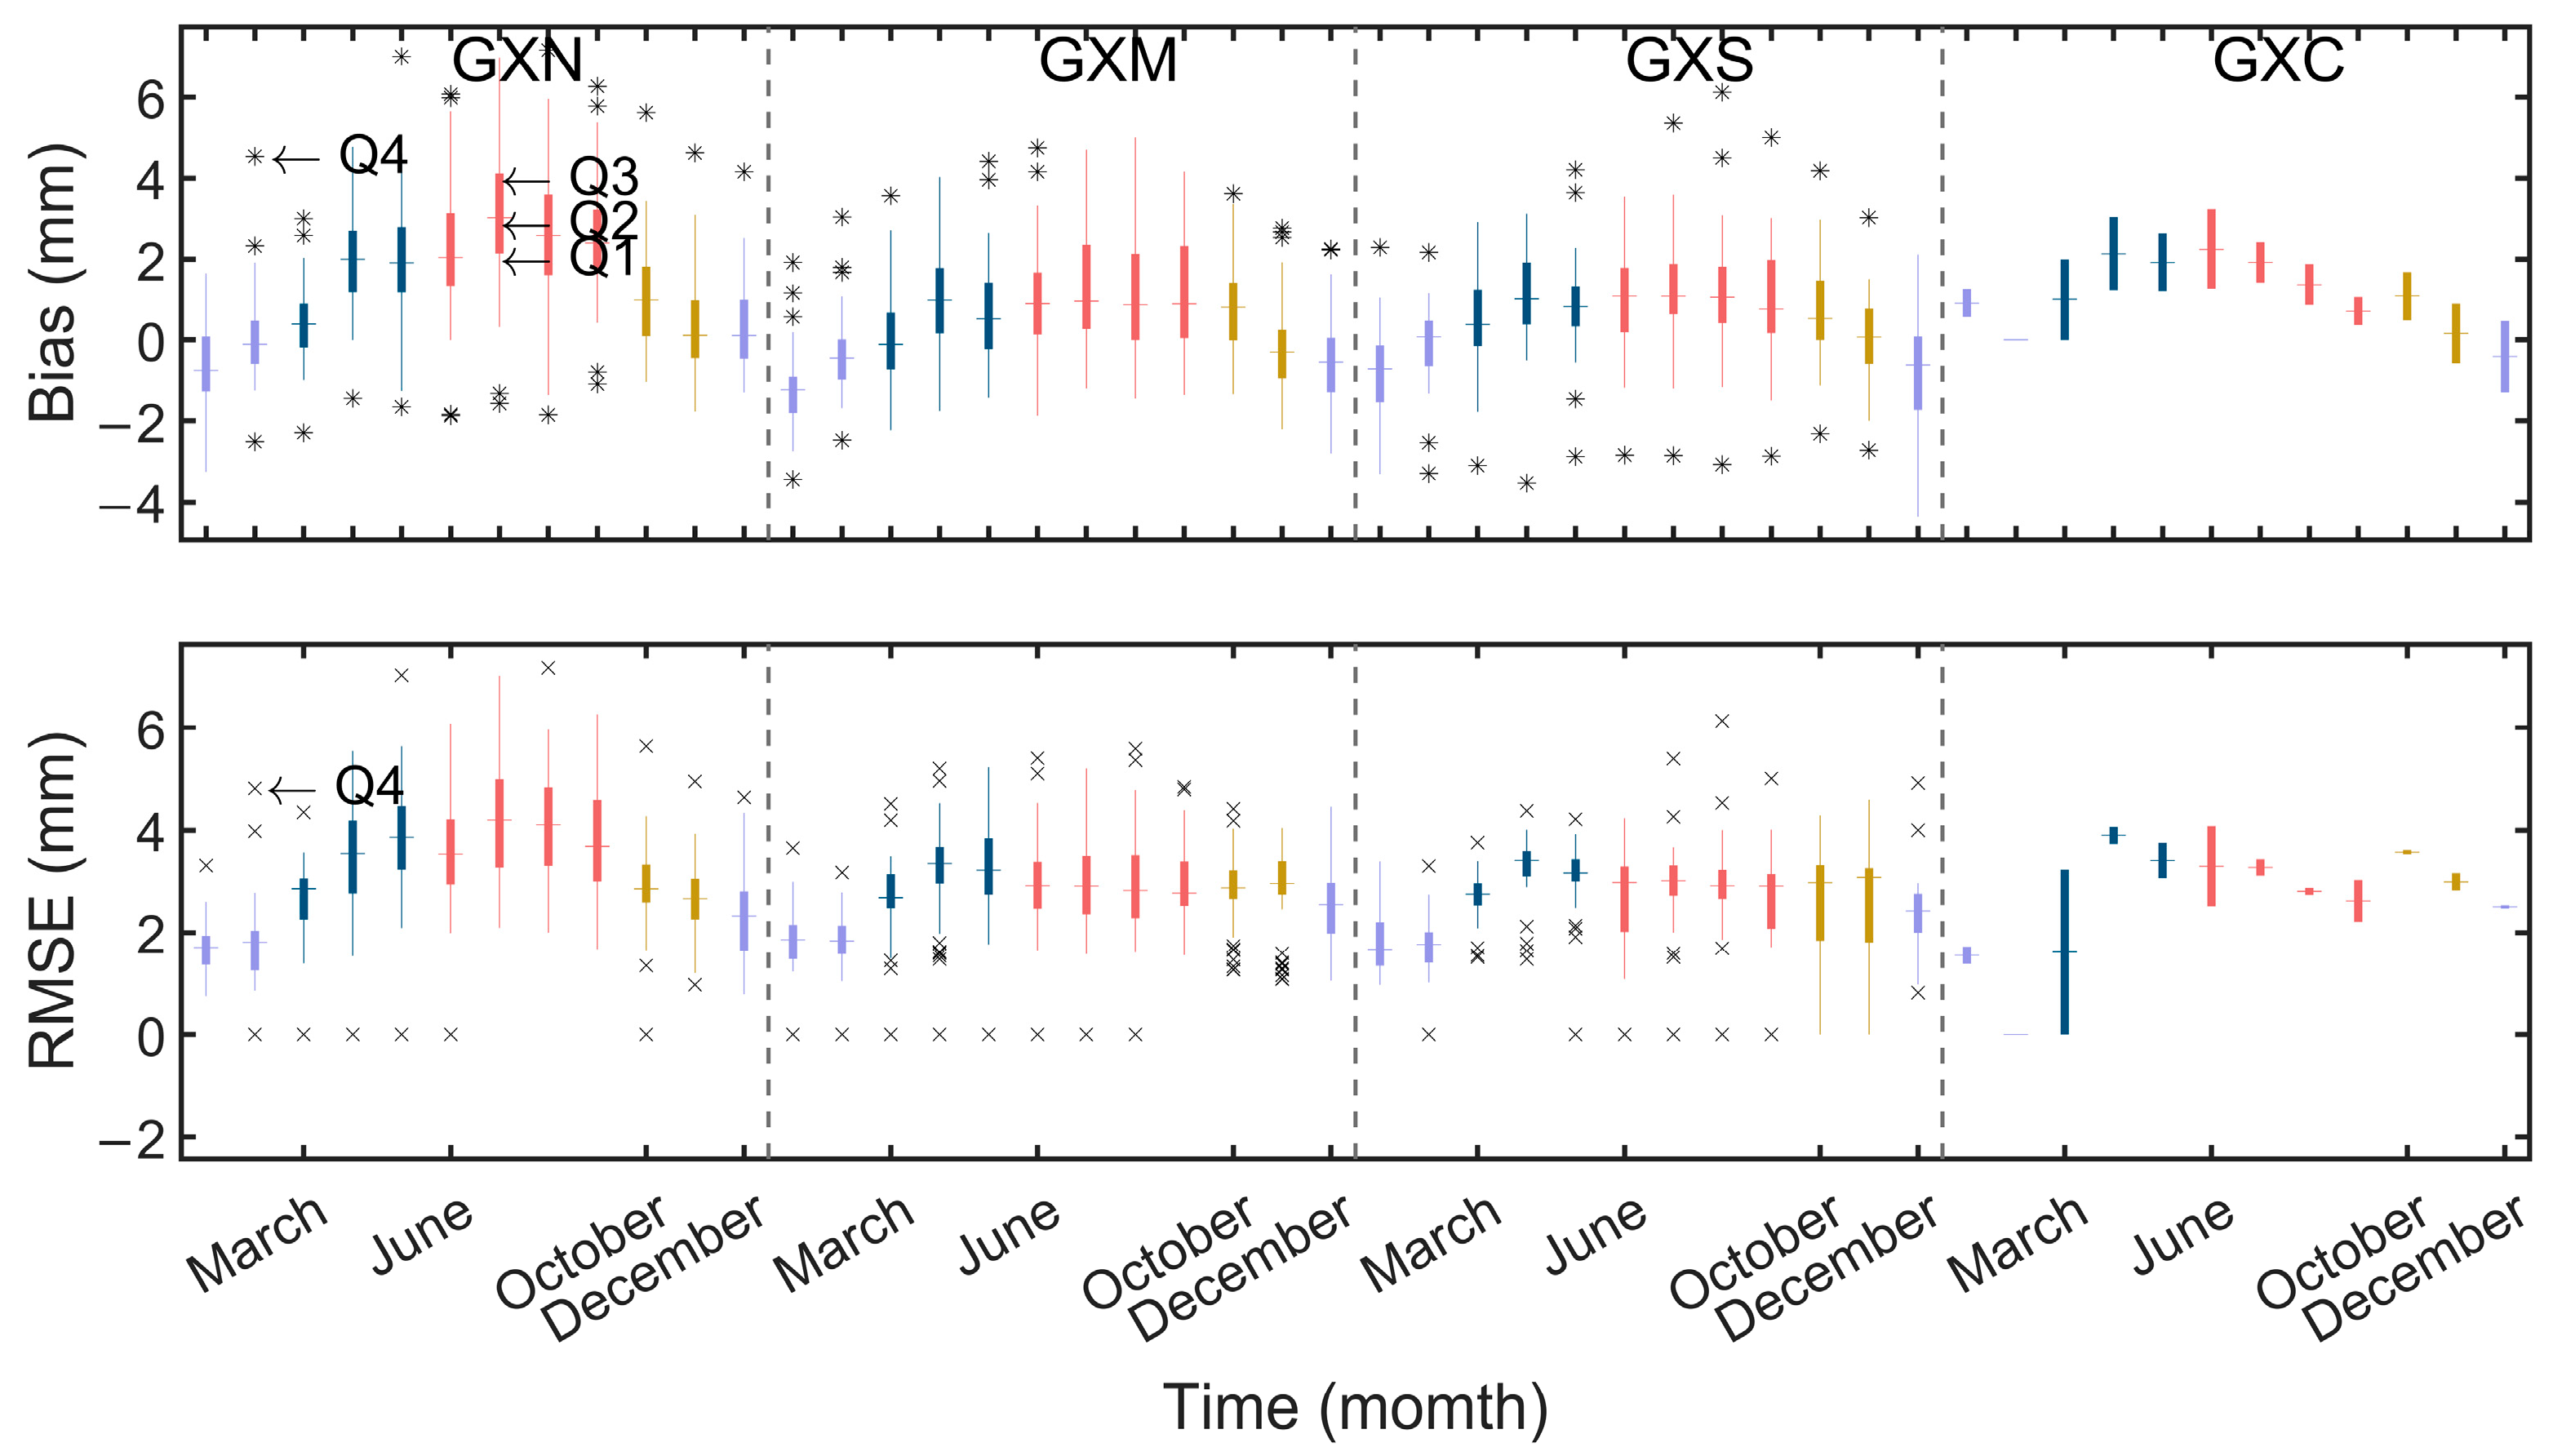
3.2.2. Spatial and Seasonal PWV Variability

To analyze the seasonal variability between the two PWV datasets in Guangxi, the mean monthly bias and RMSE in the four subregions were counted, as shown in Figure 5 in the form of boxplot. The mean monthly bias and RMSE range between GNSS PWV and ERA5 PWV is −0.91 to 1.85 mm and 1.81 to 3.48 mm, respectively. Based on the box boundary length and Q2 value, the seasonal pattern is evident with lower bias and RMSE in winter and higher values in summer. The RMSE between GNSS PWV and ERA5 PWV is 3.16 mm, 3.31 mm, 2.83 mm, and 2.04 mm for PreM, MonS, PostM, and winter, respectively. The largest mean bias and RMSE occur in July in the GXN region, whereas the smallest mean bias and RMSE are in November of GXS and January in theof GXCM and GXS regions, respectively. The variation was more pronounced for bias than RMSE, and the distribution of negative biases mainly occurred within the GXM region. For RMSE, uniform consistency was not observed across distinct seasons at various stations, but most stations exhibited the lowest values in winter throughout the year. Furthermore, large RMSE values were not consistently observed during seasons with high PWV [55].
Table 2 shows the statistics of the mean daily bias and RMSE between GNSS PWV and ERA5 PWV in the entire Guangxi region and the four subregions. The mean daily bias and RMSE for the GX region are 0.80 mm and 2.87 mm, corresponding to the range from −5.62 to 6.62 mm and 1.18 to 6.63 mm, respectively. Figure 6 illustrates the time series of the mean daily bias and RMSE between GNSS PWV and ERA5 PWV in various regions and the corresponding statistical count of days. We observed that the negative daily biases are mainly distributed during the PostM and winter periods. This indicates that ERA5 PWV underestimates the water vapor content in these two seasons in Guangxi, resulting in significantly drier conditions than GNSS PWV. In Figure 6, the most significant variation in bias and RMSE is observed in the GXC region, ranging from −6.51 to 8.12 mm and 1.14 to 8.23 mm, respectively. Negative biases are mostly present during the PostM and winter within the four subregions, with the percentage of days exhibiting a negative bias constituting 48% of the entire time series for the GXC region. Based on this, the effect of the GXC region was evaluated by excluding it from the data, which shows only a slight float of 0.01 mm for mean bias and RMSE in the entire Guangxi. The GXC region exhibits the lowest mean bias and RMSE values, accompanied by a relatively average day distribution of positive and negative bias throughout the year. This distribution could be attributed to the region’s susceptibility to marine climate influence and relatively consistent seasonal precipitation distribution.
Figure 6 illustrates the count of days within each time period for each region, where the RMSE value exceeds the mean threshold of 3 mm. The count of days in the range (3 mm, 5 mm] of each subregion is the largest. Furthermore, MonS has the highest number of days across all ranges compared to the other periods, indicating that the variable water vapor content in MonS is the potential factor affecting the PWV assessment accuracy in Guangxi.

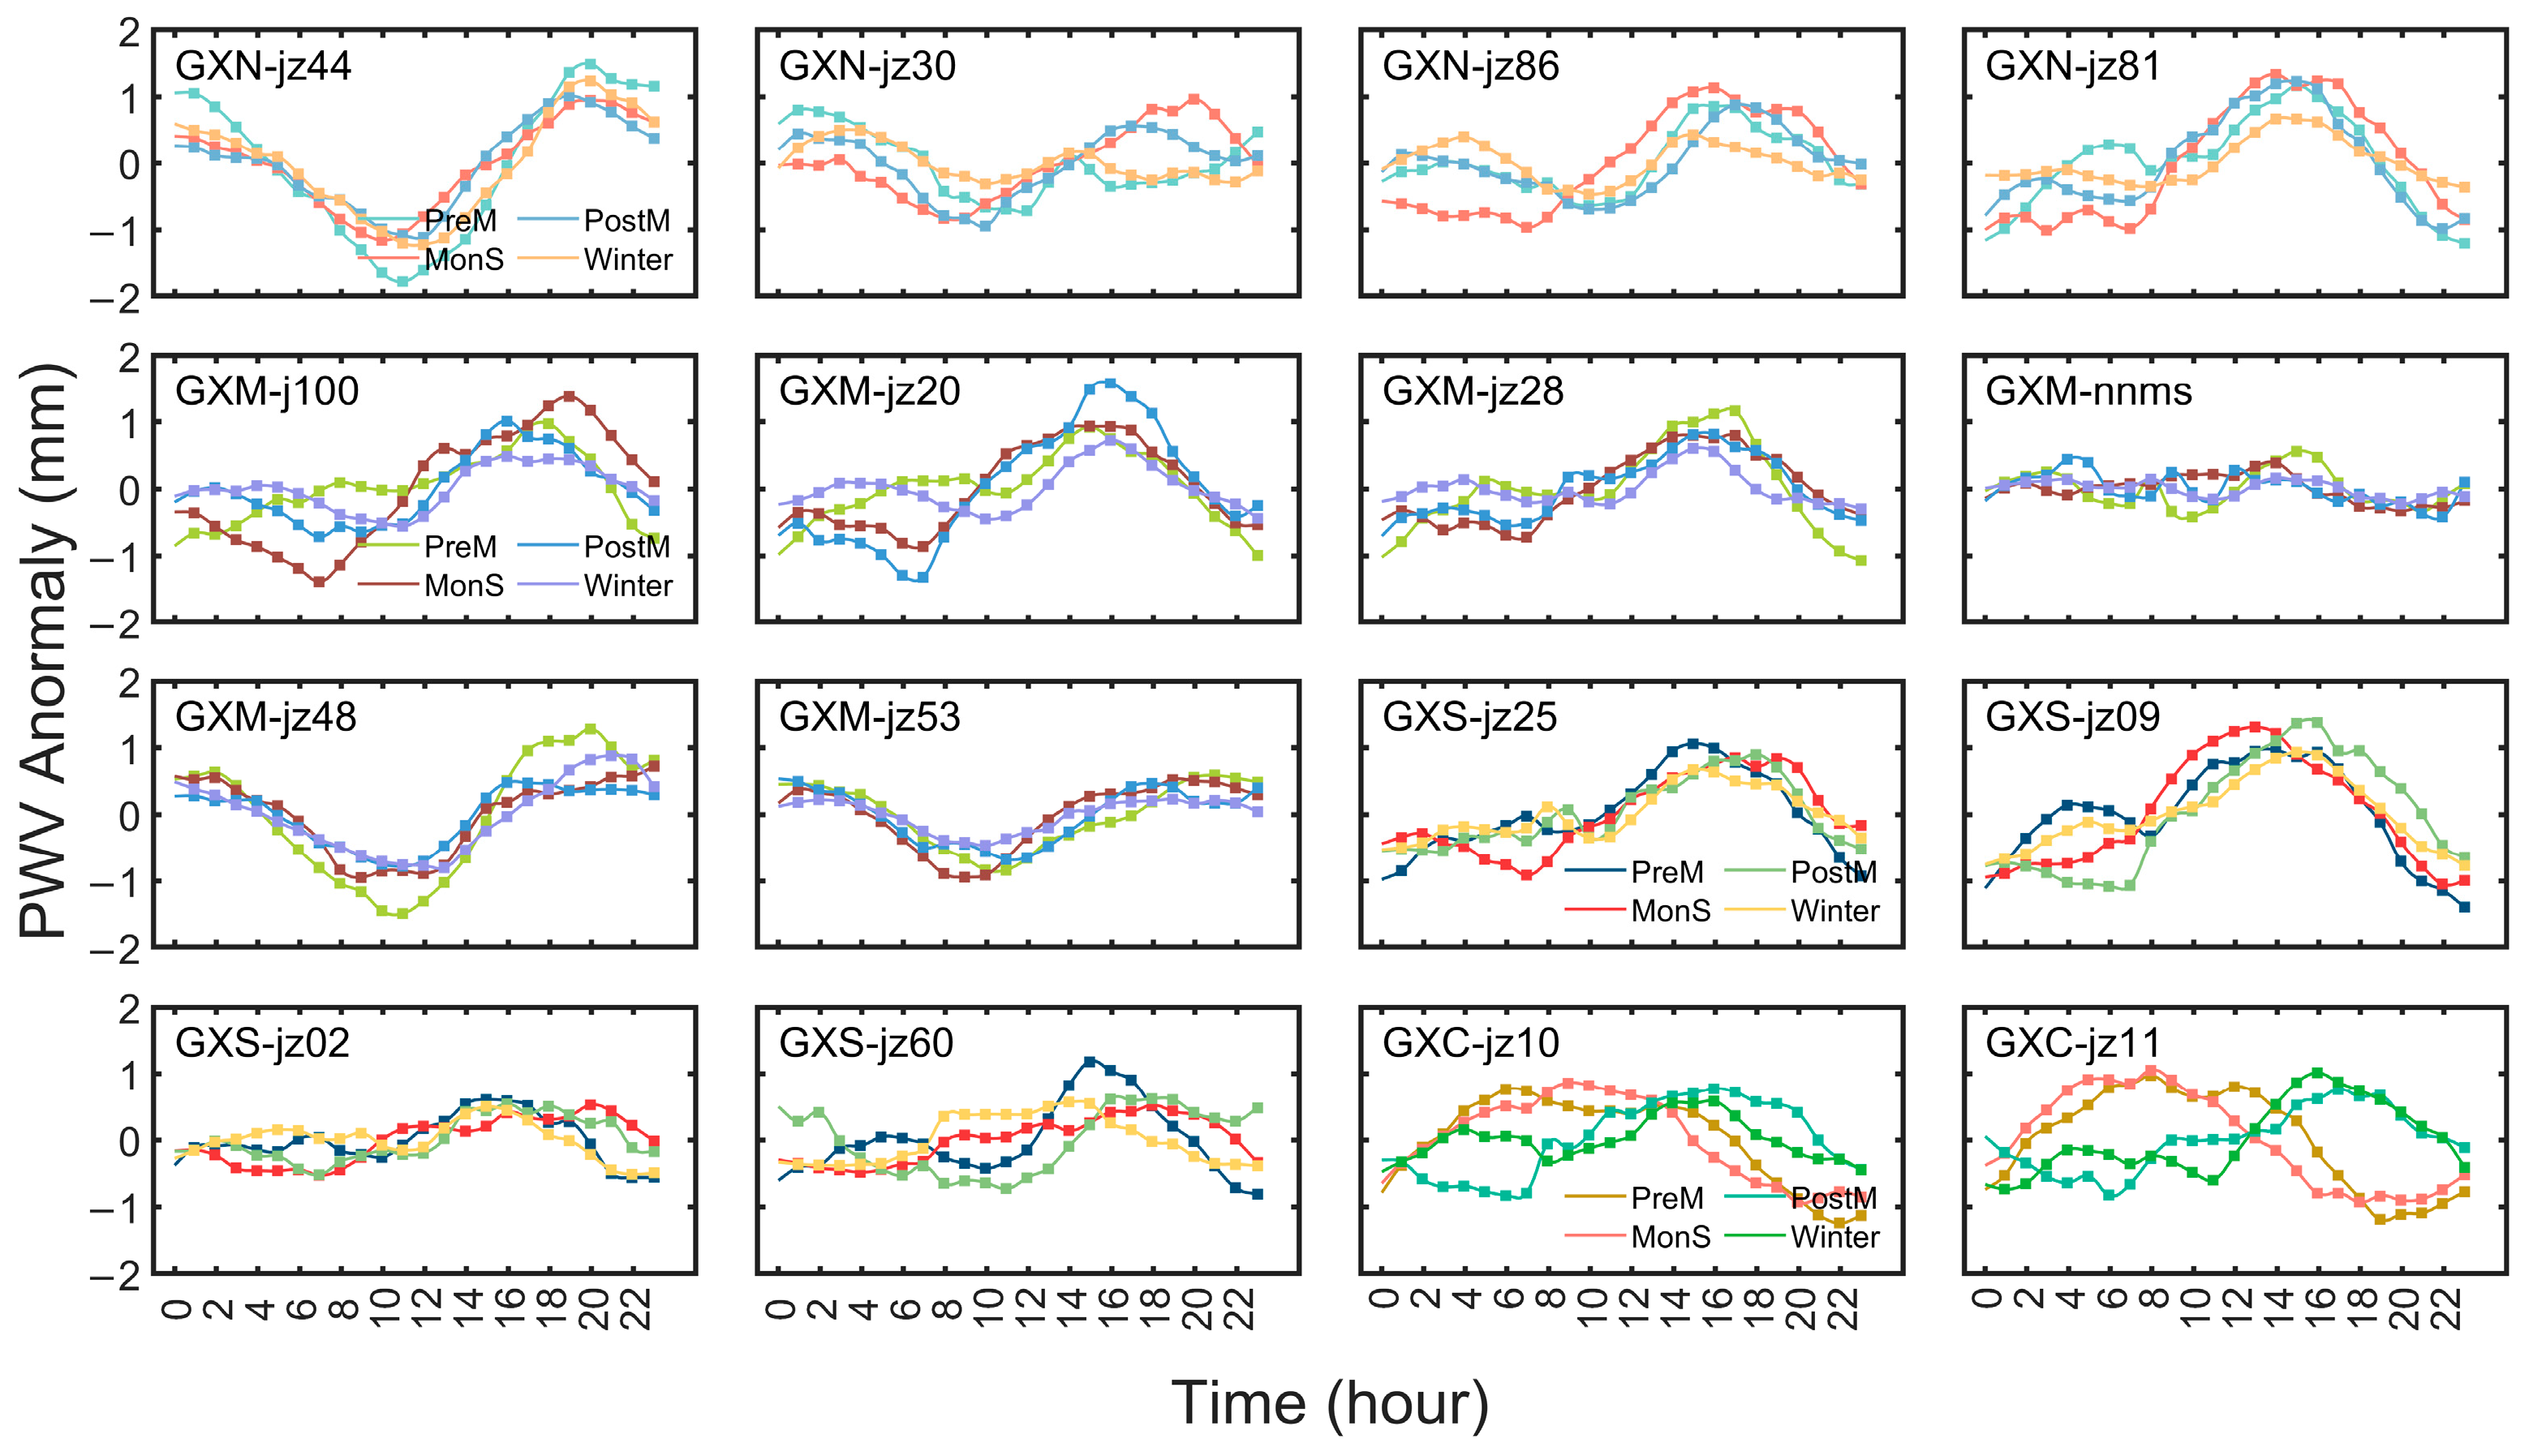
3.2.3. Diurnal Variation in PWV

Regional diurnal variations are governed by the global pattern, but they are also modulated by local features like orography and land-sea interactions, along with transient events such as the passage of weather systems [56]. Figure 7 shows the diurnal variation of the PWV anomaly for the selected stations in four subregions during different periods. Diurnal PWV anomaly values at stations in the entire Guangxi range from 0.91 to 1.32 mm. Stations in the southeastern regions of GXN and GXM, primarily positioned near water bodies and at lower elevations, display a pronounced amplitude of PWV anomaly variation during PreM, ranging from 3.63 to 5.89 mm. The abovementioned area features various topography and altitudes, encompassing diverse endemic climates and microclimate types. Several stations in the southeast of GXM and the northwest of GXS exhibit a minor amplitude of PWV anomaly variation after Mons, ranging from 0 mm to 0.98 mm. The peaks, minimums, and occurrence times of PWV anomaly shift slightly with the changing seasons for each station. Furthermore, compared with the more pronounced and distinct cycle in MonS, the diurnal variation of PWV anomaly is generally slight at most stations during winter, with a similar diurnal cycle observed at each station. However, several stations within the GXN and GXM exhibit significant PWV anomalies during the winter, particularly in the daytime. Except for the GXC stations, a few stations in other subregions of PreM and PostM exhibit a stronger diurnal variation of PWV compared to other seasons, reaching up to 5.89 mm.
The mean annual daily cycle shape, obtained by averaging data from all stations, resembles an asymmetric sinusoid characterized by a longer and more pronounced descending branch compared to the ascending one after LT16:00. To understand the distribution of PWV anomalies in different seasons of different regions, the maximum, minimum and corresponding local times were counted in Table 3. Throughout the daylight hours, the PWV anomaly descends to a minimum of −0.36 mm at LT7:00, then peaks at a maximum of 0.56 mm by LT 16:00. Subsequently, the PWV anomaly decreases gradually until it reaches its second minimum of −0.26 mm at LT 20:00, followed by a quicker increase to the nightly maximum of −0.10 mm at LT 3:00. Additionally, we observed that the diurnal cycle trends in winter and PostM are relatively similar, and PreM and MonS are relatively similar. Across different seasons, variations in the diurnal cycle phases reveal that the phases of MonS and PreM at the same station generally occur earlier, whereas those of PostM and winter tend to occur later. Furthermore, the phase is affected by the station’s geographical location and the evolving atmospheric circulation [33]. Differential warming between land and large water bodies or mountainous areas and valleys results in the transport of moisture onshore or upslope during daytime and offshore or downhill at night, primarily due to faster cooling of land surfaces or mountains [57]. As illustrated in Figure 7 and Table 3, the phase point progresses from the coastal regions towards the inland areas, suggesting the phase tends to occur earlier within and nearby the GXC stations while later in the GXN stations.

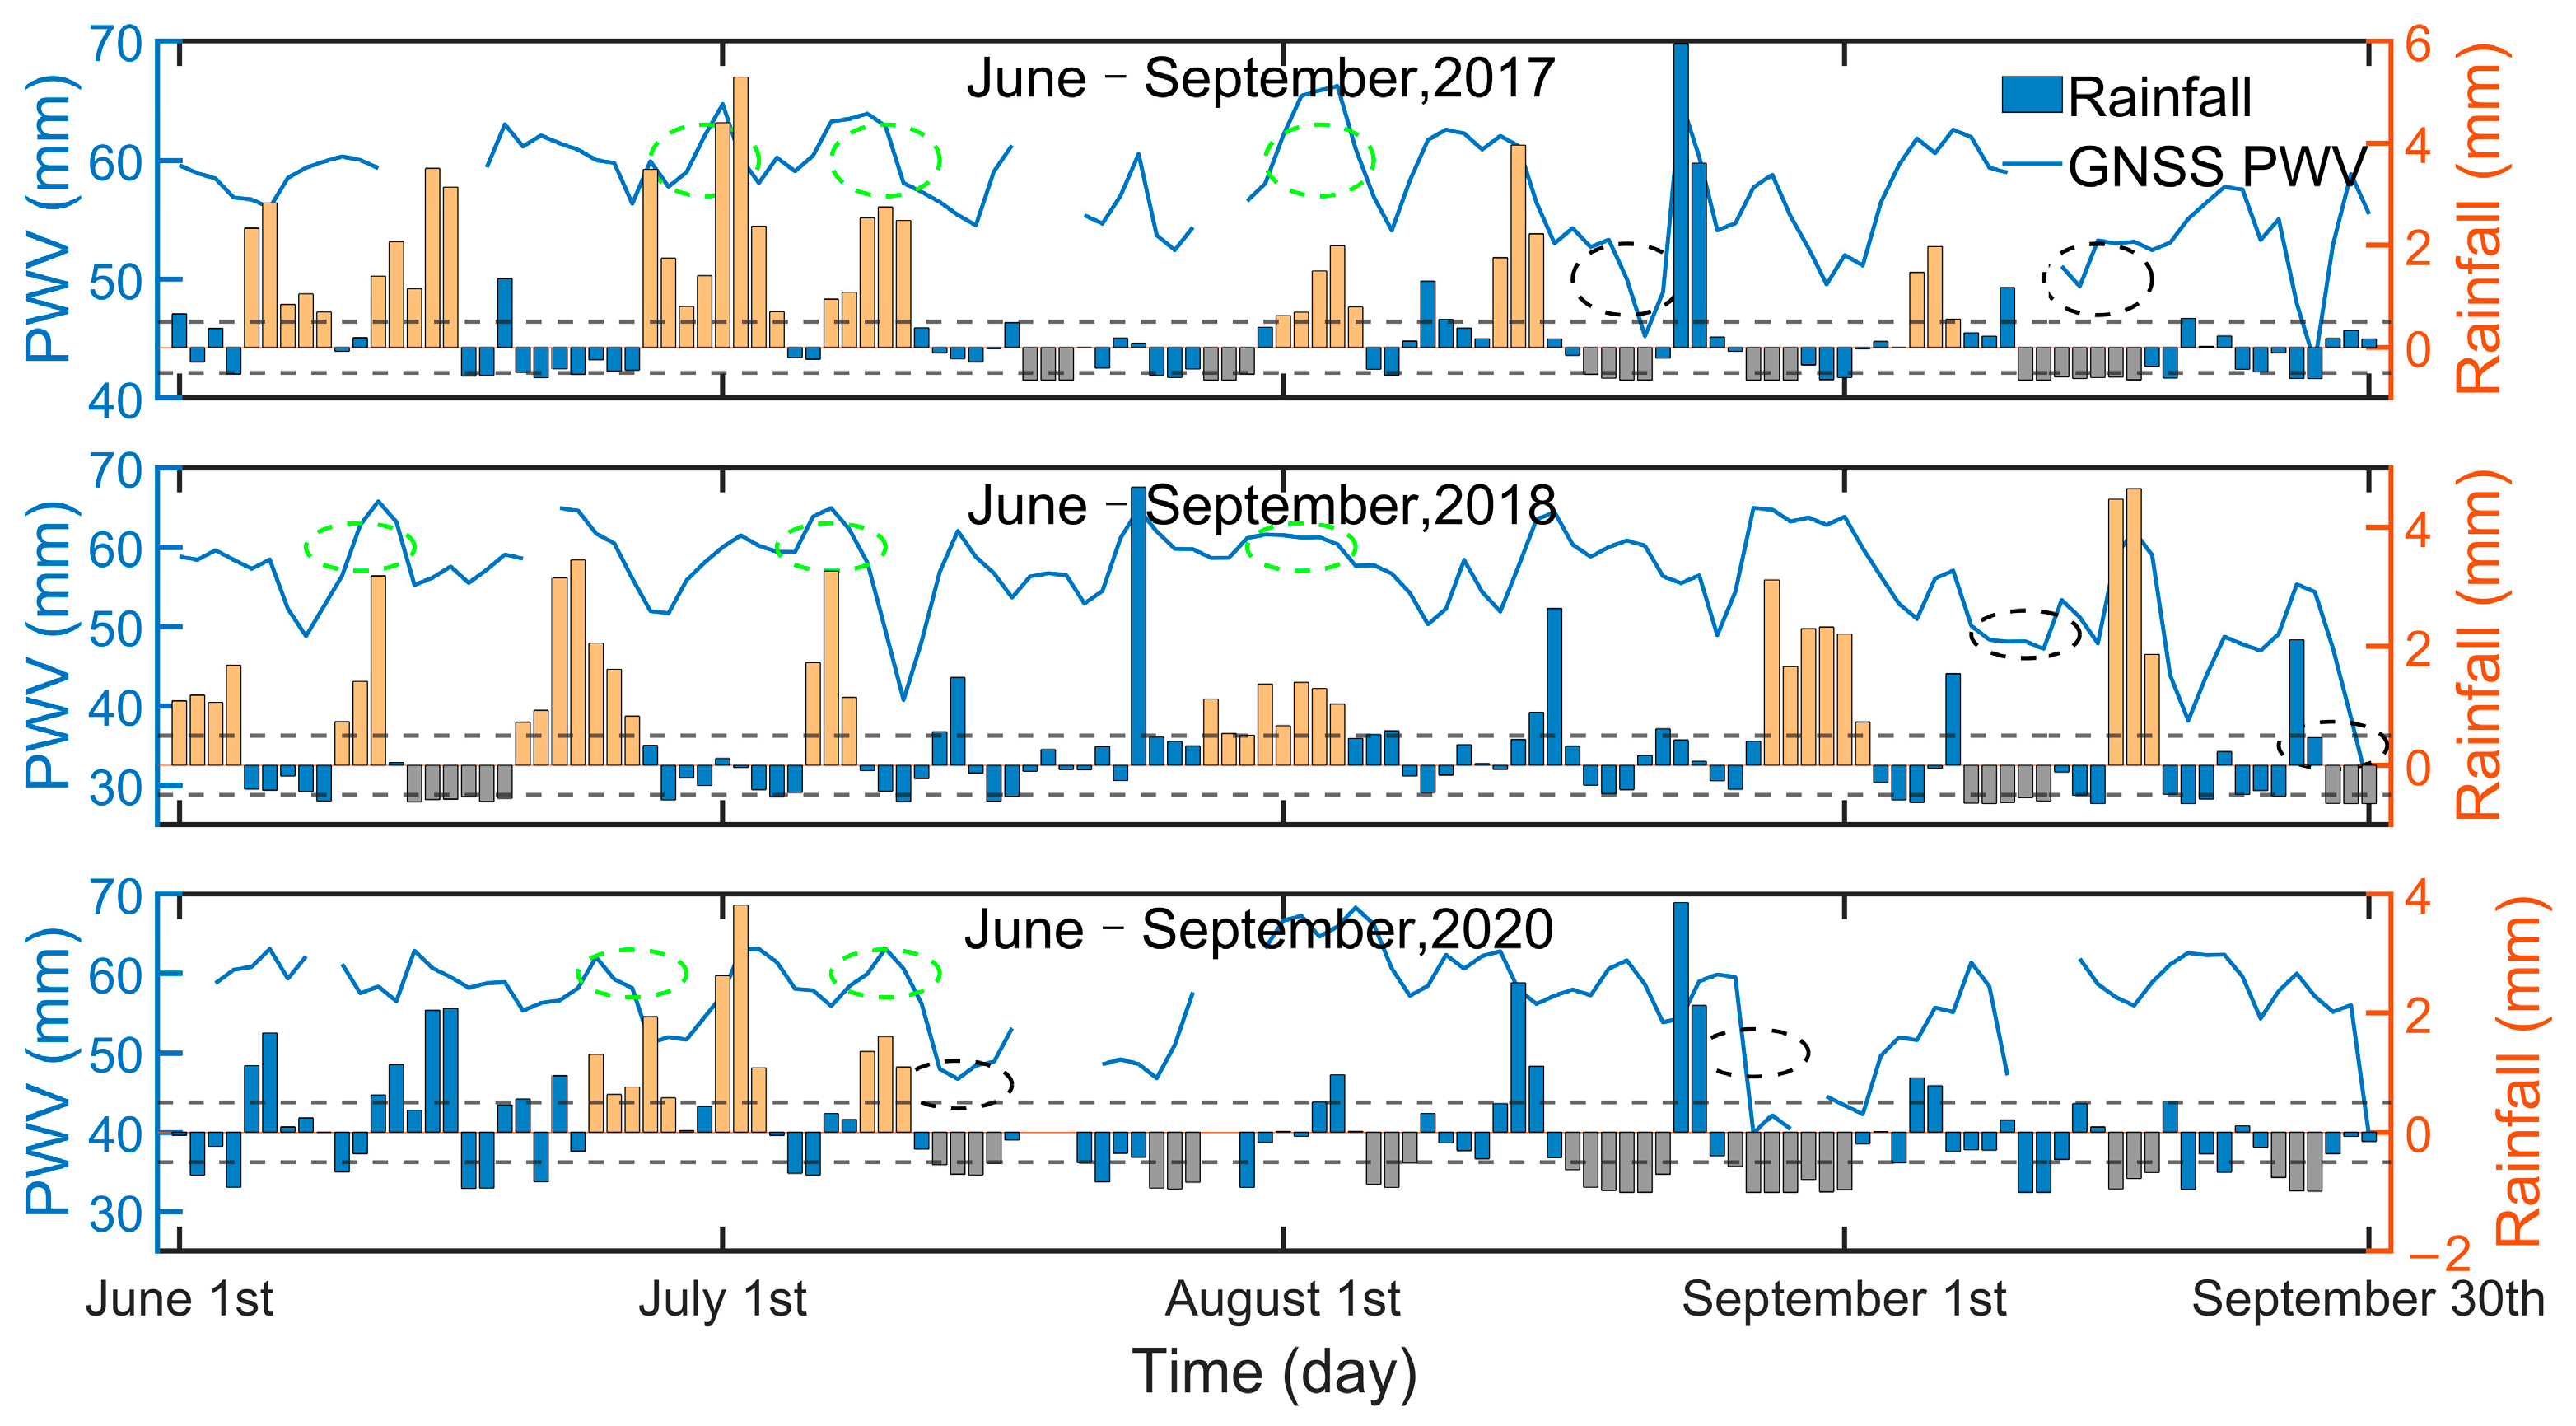
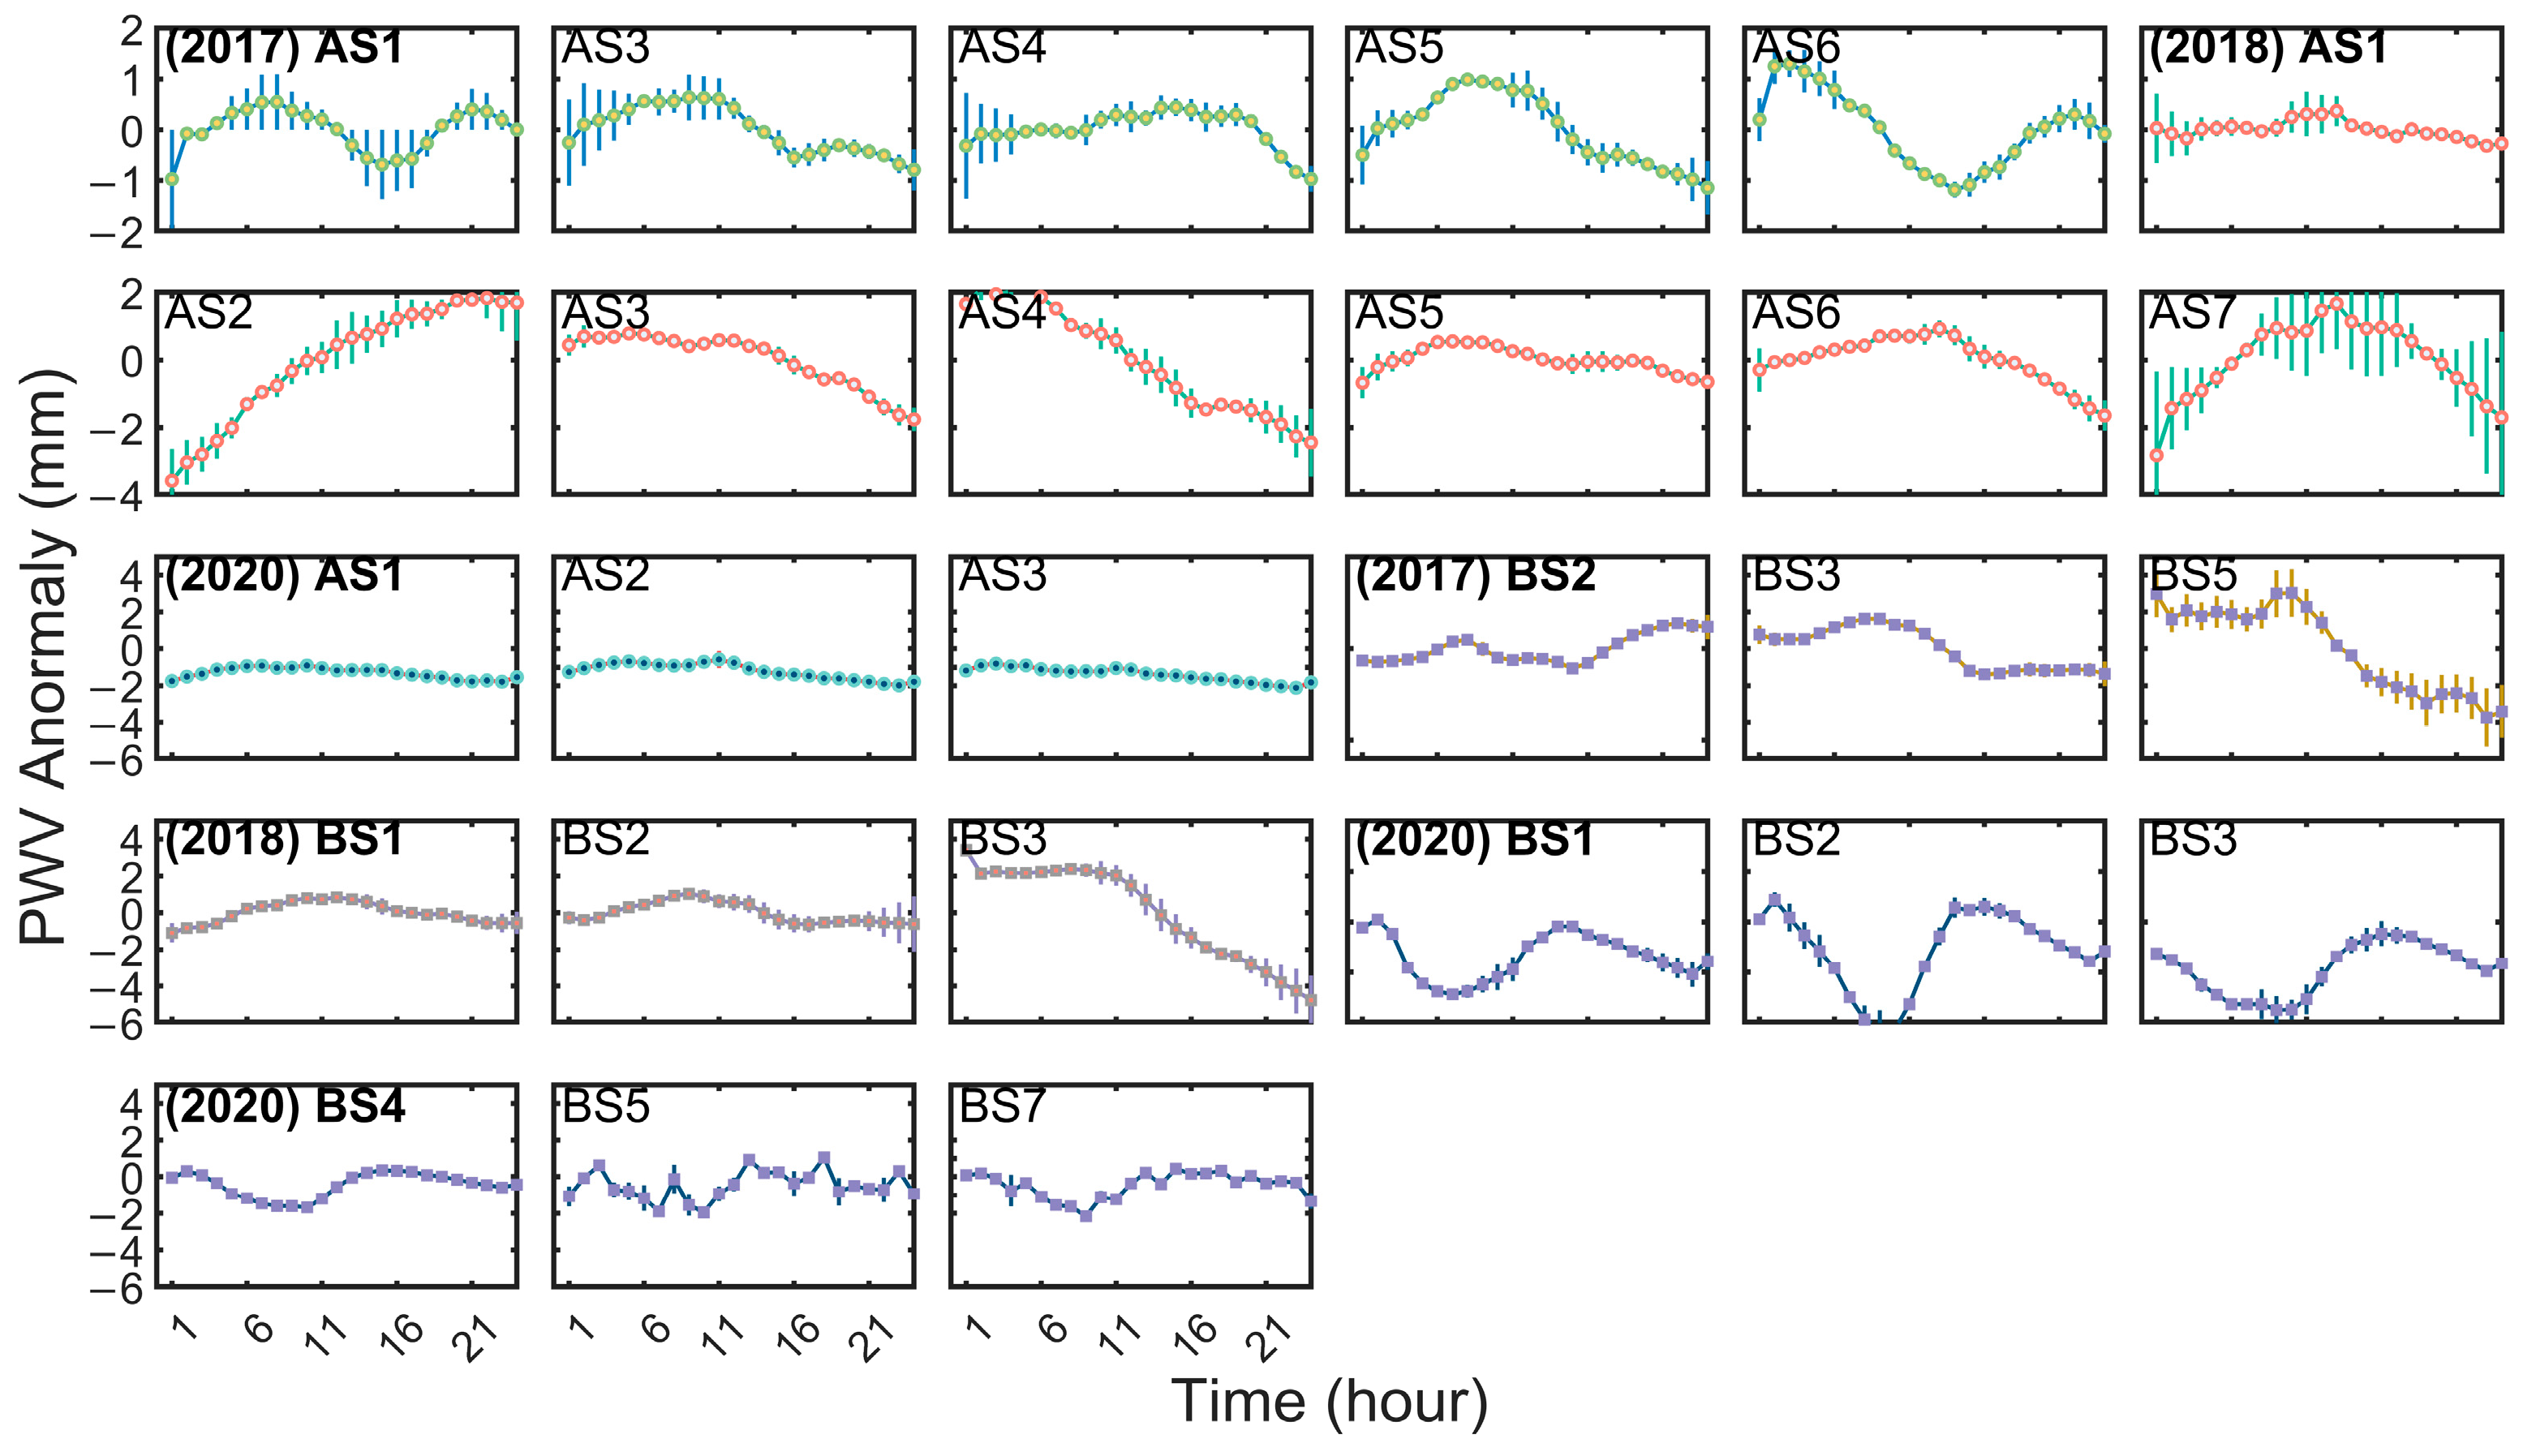
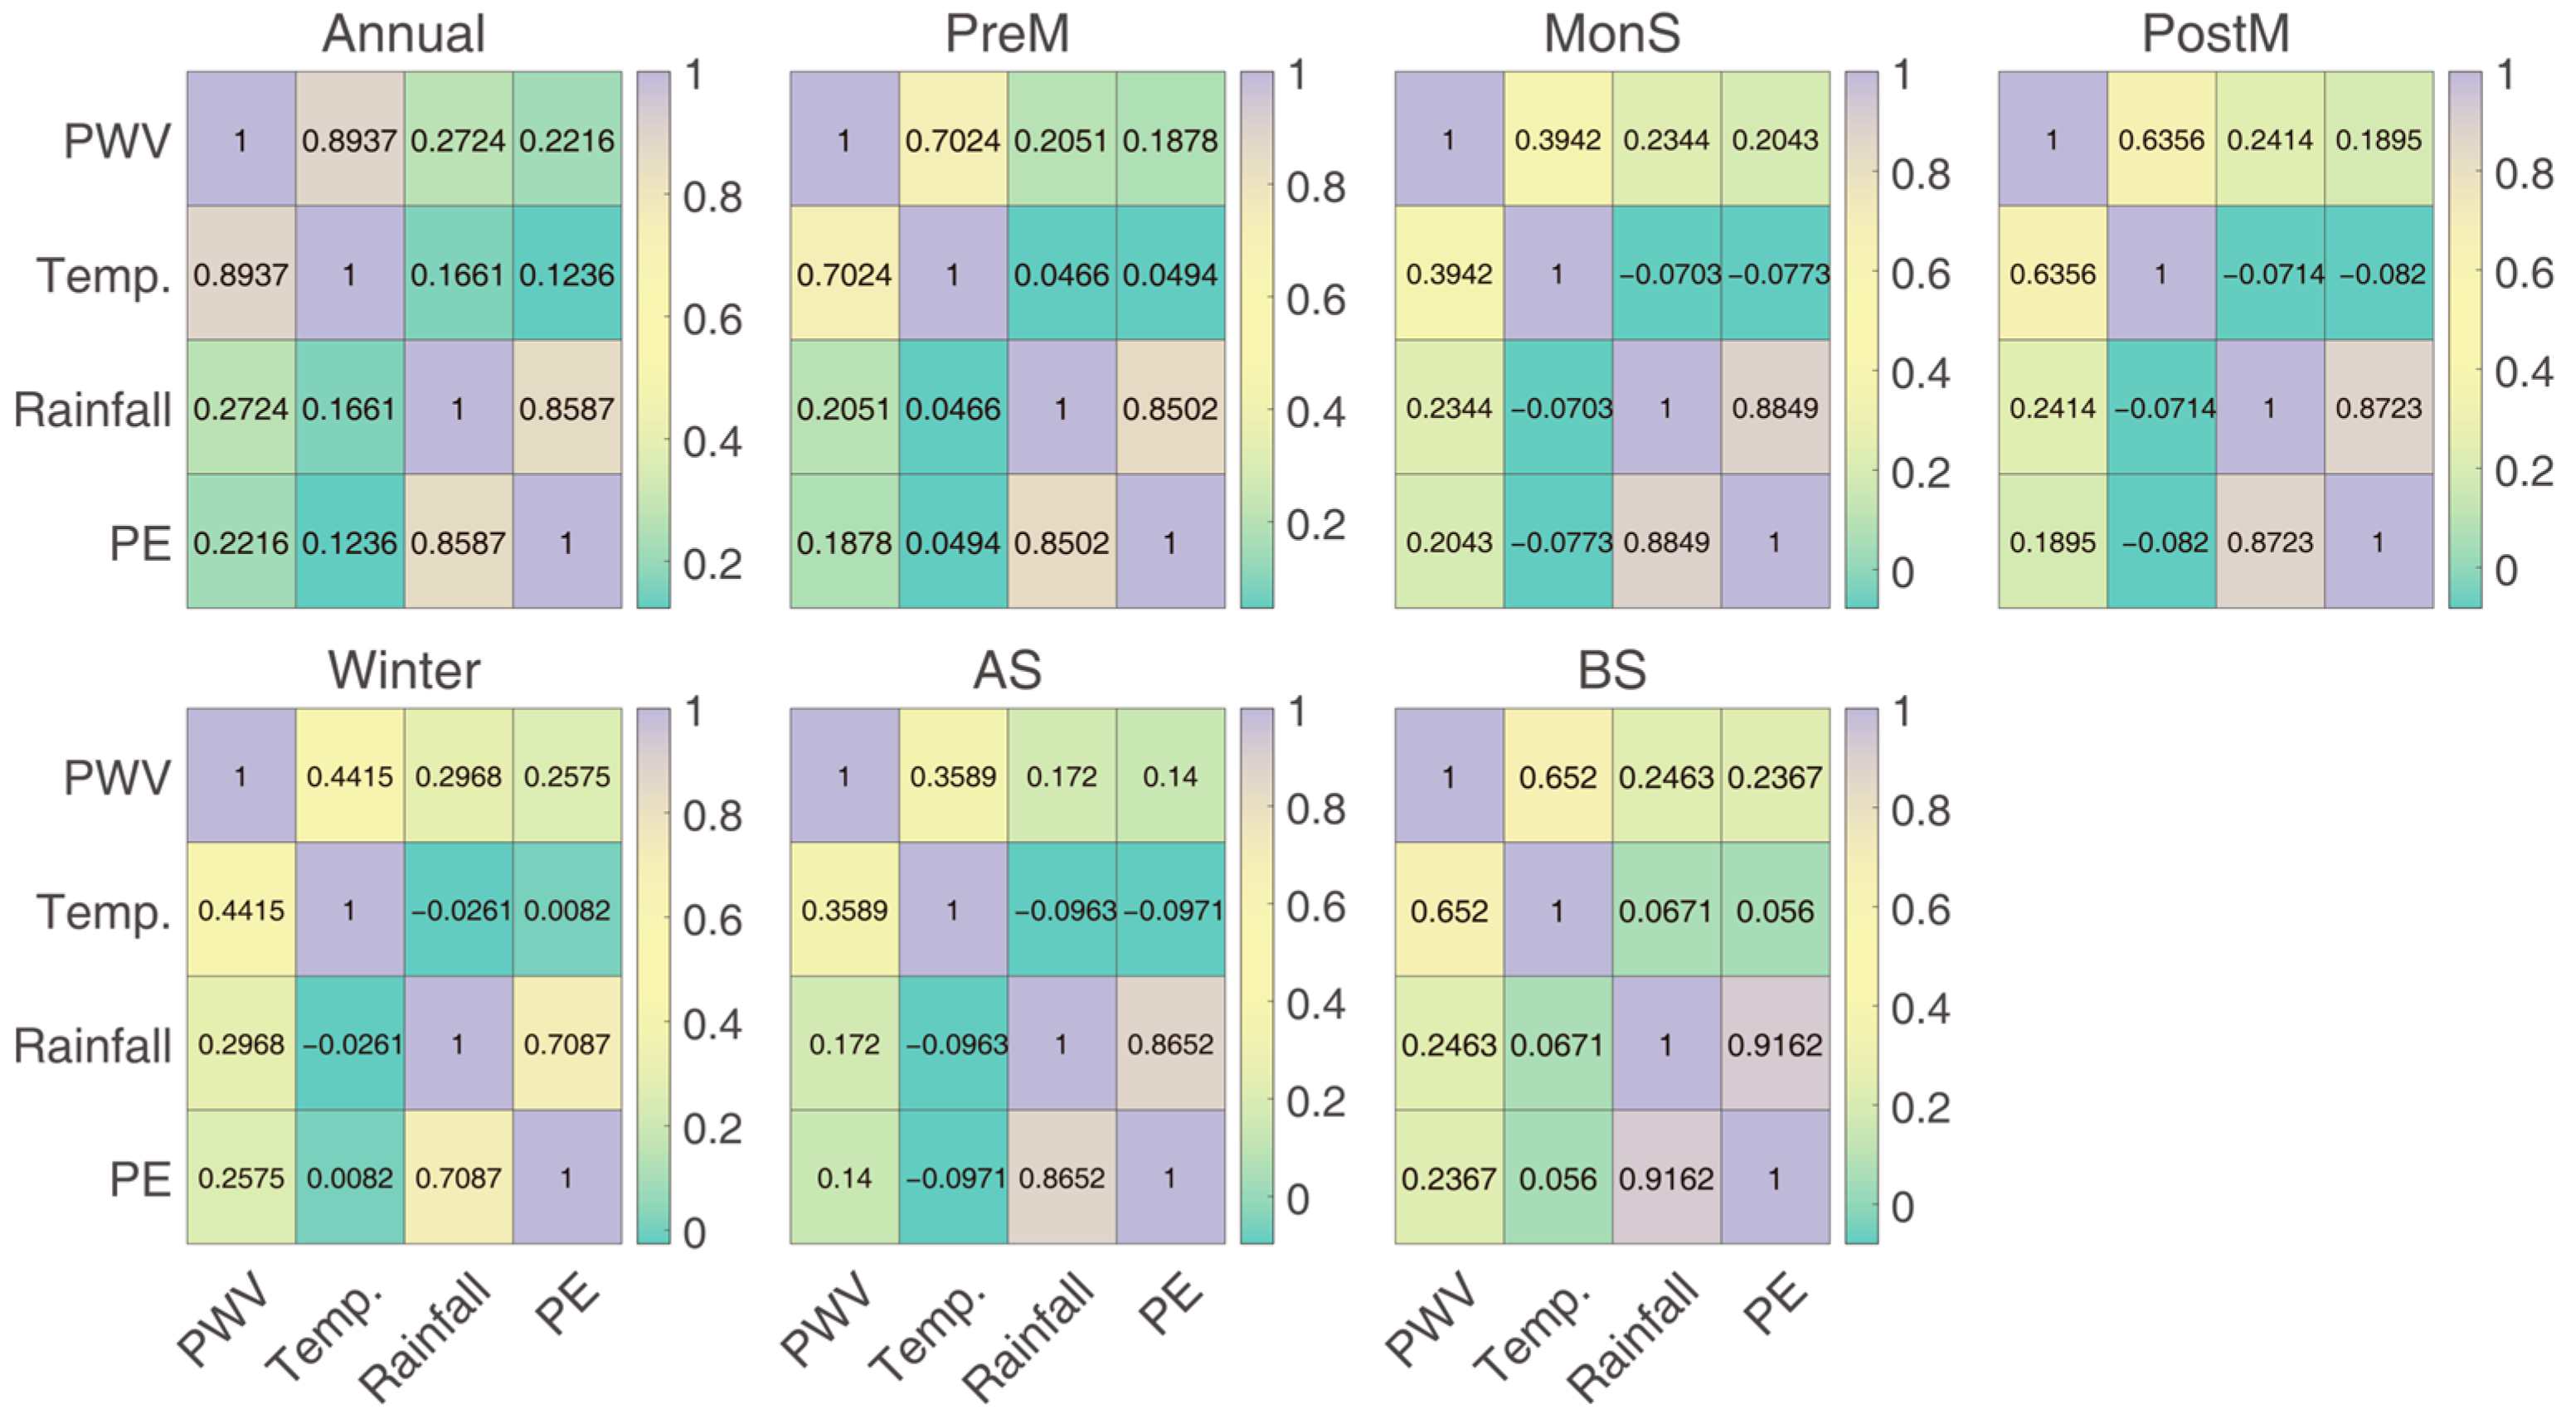
3.3. Active and Break Spells of Monsoon

Numerous methodologies have been proposed to identify active and break spells of monsoon, utilizing different atmospheric variables such as wind circulation patterns, temperature, and rainfall [58]. However, varying criteria exist for distinguishing monsoon active and break spells though rainfall remains the critical meteorological factor employed for identification. The criterion employed in this study [59] dictates that an active spell is identified when the average standardized rainfall anomaly exceeds +0.50 mm for three consecutive days or more. Conversely, if the value falls below −0.50 mm, the event signifies a break spell. Time series of active and break spells of three years are illustrated in Figure 8. The number of active and break spells from 2017 to 2020 was 7/5/3 and 7/3/7, respectively. The duration of the break spell varies between 3 and 7 days, while that of the active spell varies between 3 and 8 days. Moreover, the mean rainfall and PWV during active spells are 14.65 mm and 58.85 mm, with variation ranges of 7.00 to 36.13 mm and 25.29 to 64.91 mm, respectively. For break spells, the corresponding values are 0.11 mm and 29.35 mm, with ranges of 0 to 0.87 mm and 6.53 to 59.06 mm, respectively. During the active spell, PWV exhibited higher values and an upward trend with noticeable fluctuations, whereas it remained at lower levels and showed a consistent downward trend during the break spell.
To examine the diurnal variation of PWV during the active spell (AS) and the break spell (BS), we selected the complete deaveraged data from 2017 to 2020 as shown in Figure 9. The daily amplitude ranges of active spells from 2017 to 2020 were 1.41 to 2.49 mm, 0.69 to 5.4 mm, and 0.88 to 1.41 mm, respectively. Additionally, the daily amplitude ranges for the break spells of three years were 2.45 to 6.76 mm, 1.66 to 8.17 mm, and 1.48 to 2.99 mm, respectively. We have observed that the smallest negative PWV anomalies typically occurred at two distinct times during active spells: LT 7:00 for AS3, AS4, and AS5 in 2017; LT 7:00 for AS3, AS4, and AS6 in 2018; and LT 8:00 for AS2, AS5, and AS7 in 2018. These PWV anomalies suggest that the water vapor content remains low during these specific moments throughout the entire diurnal cycle of the active spells. We observed that the PWV anomalies during the three active periods identified using rainfall standardization in 2020 were all negative. This demonstrates that PWV is sensitive to temporal conditions, particularly the diurnal cycle, and illustrates the complex interactions among meteorological processes. In this context, rainfall can result in a reduction of surface water vapor, subsequently affecting PWV.
The conditions necessary for precipitation include the available water vapor, a specific degree of saturation, and a conducive dynamic mechanism [60]. PE is a standard parameter utilized to assess the efficacy of dynamic process mechanisms, defined as the ratio of total precipitation to total PWV during the same period and location [34]. The relationships between PWV, surface temperature, rainfall, and PE from 2017 to 2020 have been established using Pearson’s correlation coefficient and the confidence interval p-values are less than 0.05. In Figure 10, a robust positive correlation between PWV and temperature is evident across all periods. Considering Clausius-Clapeyron’s equation [61], as temperature rises, the atmosphere can hold more PWV before condensation leading to an observed upward trend in rainfall. Furthermore, except for the relatively modest correlation coefficients of 0.39 and 0.44 observed in MonS and winter, respectively, the correlation coefficients for all other periods exceed 0.63. The high correlation coefficient of 0.89 between PWV and temperature on the annual scale remains largely unaffected by MonS and winter which might be due to the relatively consistent temperature and ample water vapor content in Guangxi.
The correlation between PWV and both rainfall and PE is weak across all periods, with respective ranges of 0.17 to 0.30 and 0.14 to 0.26. Higher PWV may be associated with greater precipitation, especially in humid regions or under certain meteorological conditions. However, specific geographical locations do not follow this trend, such as some low-latitude regions that receive much solar radiation and can hold more water vapor, ultimately culminating in the rain even with variable temperatures [16,62,63]. The correlation between rainfall and PE is strong, with coefficients exceeding 0.85 for all periods except winter (R = 0.71). It should be noted that the correlation between temperature and both rainfall and PE is weak in each period, with coefficient values not exceeding 0.10. The correlation between temperature and rainfall is negative in all seasons except for PreM (R = 0.05). Furthermore, the positive correlation coefficients between temperature and PE in MonS and winter are 0.05 and 0.01, while the negative correlation coefficients in PreM and PostM are −0.08 and −0.08, respectively. Various references [64,65,66] have reported that higher temperature leads to higher PWV in winter and gives rise to rain without much impact on PE. However, higher temperatures decrease PE and rainfall during summer despite having high PWV.
To analyze the temperature conditions during the active and break spells, the statistics are presented in Table 4. The temperature difference during the active spell is generally higher than during the break spell. Furthermore, the temperature difference for break spells with extended durations and active spells with shorter durations tends to be higher than other spells.

4. Conclusions

PWV retrieved from 104 GNSS stations and the corresponding ERA5 PWV dataset were employed to analyze annual, monthly, seasonal, and daily variations in water vapor for the years 2017 to 2020 in Guangxi. The mean annual bias and RMSE between these two datasets range from −1.46 to −0.55 mm and 3.62 to 4.16 mm, respectively. Notably, compared to flat areas, regions like northern Guangxi and terrains featuring high mountains exhibit larger mean bias and RMSE values. During the summer monsoon, the RMSE between GNSS PWV and ERA5 PWV has a maximum of 3.31 mm and a minimum of 2.04 mm in winter. This trend indicates a clear seasonal pattern in PWV, primarily driven by the elevated summer rainfall and the suppression of surface evaporation due to lower temperatures in winter.
Based on the superior performance of GNSS PWV over ERA5 in detecting water vapor in the Guangxi region, the diurnal cycle variation across all stations during different seasons was examined by analyzing the deaveraged GNSS PWV anomaly. The peak values, minimums, and occurrence times of PWV anomalies at each station exhibit slight variations across the seasons, with an annual amplitude ranging from −1.13 to 0.94 mm. The fluctuating trend of PWV anomalies at each station during winter demonstrates a higher consistency and generally smaller amplitude than the trend observed in summer. For hourly PWV anomalies across various regions and seasons, the values are consistently larger during daytime compared to nighttime, and the phase appearance moment shifts from areas near large water bodies towards inland regions.
We identified the active and break spells of the monsoon and analyzed the interrelationships among PWV, temperature, rainfall, and PE during various periods in Guangxi. The variation trend of PWV exhibits a relatively consistent correlation with that of rainfall during active and break spells. In summary, PWV holds the potential to discern active and break spells within the monsoon season in Guangxi. Overall, PE is the significant factor affecting rainfall, compared with the weak positive correlation between PWV and rainfall and a weaker negative correlation between temperature and rainfall. In winter, higher temperatures lead to an increase in PWV, resulting in increased rainfall. However, in the summer monsoon season, despite the high levels of PWV, elevated temperatures decrease PE and rainfall.
In conclusion, the assessment between GNSS PWV and various water vapor products across different time scales suggests a significant impact of monsoon season on the precision of water vapor detection and the effectiveness of monitoring diverse extreme weather phenomena. Future endeavors will involve examining extended time series to validate observations, exploring the intricate relationships among a broader range of meteorological factors, and developing a predictive model for monsoon active and break spells.

Author Contributions

L.H., W.L. and S.X. (Si Xiong) conceptualization, methodology, and formal analysis; W.L., software; S.X. (Si Xiong) and L.Z., validation; S.X. (Shaofeng Xie) and L.L., investigation; L.H., resources; W.L., data curation; L.H. and W.L. writing—original draft preparation; L.L. and W.L., writing—review and editing; L.L., L.H. and S.X. (Shaofeng Xie), funding acquisition. All authors have read and agreed to the published version of the manuscript.

Funding

This study is supported by Guangxi Natural Science Foundation of China (2023GXNSFAA026434, 2023GXNSFAA026355), State Key Laboratory of Geodesy and Earth’s Dynamics, Innovation Academy for Precision Measurement Science and Technology, Chinese Academy of Sciences (SKLGED2023-3-1), Innovation Project of Guangxi Graduate Education (YCSW2023338) and the “Ba Gui Scholars” program of the provincial government of Guangxi.

Data Availability Statement

The radiosonde data are obtained from http://www1.ncdc.noaa.gov/pub/data/igra/ (accessed on 1 June 2022). The ERA5 data are available at https://cds.climate.copernicus.eu/cdsapp#!/search?type=dataset (accessed on 1 June 2022). All the figures in this manuscript are generated by MATLAB 2021 and GMT 6.4 software.

Acknowledgments

The authors thank the Natural Resources Information Center of Guangxi Zhuang Autonomous Region for providing CORS (Continuous Operational Reference System) data from 2017 to 2020, ECMWF (European Centre for Medium-Range Weather Forecasts) for providing the ERA5 grid data and IGRA (Integrated Global Radiosonde Archive) for radiosonde data in this study.

Conflicts of Interest

The authors declare no conflict of interest.

References

  1. Colman, R. A comparison of climate feedbacks in general circulation models. Clim. Dyn. 2003, 20, 865–873. [Google Scholar] [CrossRef]
  2. Soden, B.J.; Held, I.M. An assessment of climate feedbacks in coupled ocean-atmosphere models. J. Clim. 2006, 19, 6263. [Google Scholar] [CrossRef]
  3. Ziv, S.Z.; Reuveni, Y. Flash Floods Prediction Using Precipitable Water Vapor Derived From GPS Tropospheric Path Delays Over the Eastern Mediterranean. IEEE Trans. Geosci. Remote Sens. 2022, 60, 5804017. [Google Scholar] [CrossRef]
  4. Jin, S.; Luo, O.F. Variability and Climatology of PWV From Global 13-Year GPS Observations. IEEE Trans. Geosci. Remote Sens. 2009, 47, 1918–1924. [Google Scholar] [CrossRef]
  5. Roman, R.; Anton, M.; Cachorro, V.E.; Loyola, D.; Ortiz de Galisteo, J.P.; de Frutos, A.; Romero-Campos, P.M. Comparison of total water vapor column from GOME-2 on MetOp-A against ground-based GPS measurements at the Iberian Peninsula. Sci. Total Environ. 2015, 533, 317–328. [Google Scholar] [CrossRef] [PubMed]
  6. Huang, L.K.; Liu, W.; Mo, Z.X.; Zhang, H.X.; Li, J.Y.; Chen, F.D.; Liu, L.L.; Jiang, W.P. A new model for vertical adjustment of precipitable water vapor with consideration of the time-varying lapse rate. GPS Solut. 2023, 27, 170. [Google Scholar] [CrossRef]
  7. Tan, J.; Chen, B.; Wang, W.; Yu, W.; Dai, W. Evaluating Precipitable Water Vapor Products From Fengyun-4A Meteorological Satellite Using Radiosonde, GNSS, and ERA5 Data. IEEE Trans. Geosci. Remote Sens. 2022, 60, 4106512. [Google Scholar] [CrossRef]
  8. Thandlam, V.; Venkatramana, K. Enhancing Vertical Resolution of Satellite Atmospheric Profile Data: A Machine Learning Approach. Int. J. Adv. Res. 2018, 6, 542–550. [Google Scholar] [CrossRef]
  9. Sam Khaniani, A.; Nikraftar, Z.; Zakeri, S. Evaluation of MODIS Near-IR water vapor product over Iran using ground-based GPS measurements. Atmos. Res. 2020, 231, 104657. [Google Scholar] [CrossRef]
  10. Zhao, Q.; Su, J.; Xu, C.; Yao, Y.; Zhang, X.; Wu, J. High-Precision ZTD Model of Altitude-Related Correction. IEEE J. Sel. Top. Appl. Earth Obs. Remote Sens. 2023, 16, 609–621. [Google Scholar] [CrossRef]
  11. Zhang, H.X.; Yuan, Y.B.; Li, W. Real-time wide-area precise tropospheric corrections (WAPTCs) jointly using GNSS and NWP forecasts for China. J. Geod. 2022, 96, 44. [Google Scholar] [CrossRef]
  12. Zhang, H.; Yuan, Y.; Li, W. An analysis of multisource tropospheric hydrostatic delays and their implications for GPS/GLONASS PPP-based zenith tropospheric delay and height estimations. J. Geod. 2021, 95, 83. [Google Scholar] [CrossRef]
  13. Yuan, P.; Van Malderen, R.; Yin, X.A.; Vogelmann, H.; Jiang, W.P.; Awange, J.; Heck, B.; Kutterer, H. Characterisations of Europe’s integrated water vapour and assessments of atmospheric reanalyses using more than 2 decades of ground-based GPS. Atmos. Chem. Phys. 2023, 23, 3517–3541. [Google Scholar] [CrossRef]
  14. Bevis, M.; Businger, S.; Herring, T.A.; Rocken, C.; Anthes, R.A.; Ware, R.H. GPS Meteorology: Remote Sensing of Atmospheric Water Vapor Using the Global Positioning System. J. Geophys. Res.-Atmos. 1992, 97, 15787–15801. [Google Scholar] [CrossRef]
  15. Zhao, Q.Z.; Ma, X.W.; Yao, W.Q.; Liu, Y.; Yao, Y.B. A Drought Monitoring Method Based on Precipitable Water Vapor and Precipitation. J. Clim. 2020, 33, 10727–10741. [Google Scholar] [CrossRef]
  16. Manandhar, S.; Lee, Y.H.; Meng, Y.S.; Yuan, F.; Ong, J.T. GPS-Derived PWV for Rainfall Nowcasting in Tropical Region. IEEE Trans. Geosci. Remote Sens. 2018, 56, 4835–4844. [Google Scholar] [CrossRef]
  17. Wang, H.S.; Liu, Y.B.; Liu, Y.W.; Cao, Y.C.; Liang, H.; Hu, H.; Liang, J.S.; Tu, M.H. Assimilation of GNSS PWV with NCAR-RTFDDA to Improve Prediction of a Landfall Typhoon. Remote Sens. 2022, 14, 178. [Google Scholar] [CrossRef]
  18. Kang, I.S.; Park, J. Use of GNSS-Derived PWV for Predicting the Path of Typhoon: Case Studies of Soulik and Kongrey in 2018. J. Surv. Eng. 2021, 147, 04021018. [Google Scholar] [CrossRef]
  19. Guo, A.; Xu, Y.; Jiang, N.; Wu, Y.H.; Gao, Z.R.; Li, S.; Xu, T.H.; Bastos, L. Analyzing correlations between GNSS retrieved precipitable water vapor and land surface temperature after earthquakes occurrence. Sci. Total Environ. 2023, 872, 162225. [Google Scholar] [CrossRef]
  20. Gurbuz, G.; Aktug, B.; Jin, S.G.; Kutoglu, S.H. A GNSS-based near real time automatic Earth Crust and Atmosphere Monitoring Service for Turkey. Adv. Space Res. 2020, 66, 2854–2864. [Google Scholar] [CrossRef]
  21. He, Q.M.; Shen, Z.; Wan, M.F.; Li, L.J. Precipitable Water Vapor Converted from GNSS-ZTD and ERA5 Datasets for the Monitoring of Tropical Cyclones. IEEE Access 2020, 8, 87275–87290. [Google Scholar] [CrossRef]
  22. Gokhan, G.; Jin, S. Evaluation of ocean tide loading effects on GPS-estimated precipitable water vapour in Turkey. Geod. Geodyn. 2016, 7, 32–38. [Google Scholar] [CrossRef]
  23. Qin, N.X.; Wang, J.N.; Gao, L.; Hong, Y.; Huang, J.L.; Lu, Q.Q. Observed trends of different rainfall intensities and the associated spatiotemporal variations during 1958-2016 in Guangxi, China. Int. J. Climatol. 2021, 41, E2880–E2895. [Google Scholar] [CrossRef]
  24. Ortiz de Galisteo, J.P.; Cachorro, V.; Toledano, C.; Torres, B.; Laulainen, N.; Bennouna, Y.; de Frutos, A. Diurnal cycle of precipitable water vapor over Spain. Q. J. R. Meteorol. Soc. 2011, 137, 948–958. [Google Scholar] [CrossRef]
  25. Dai, A.; Wang, J.; Ware, R.H.; Van Hove, T. Diurnal variation in water vapor over North America and its implications for sampling errors in radiosonde humidity. J. Geophys. Res.-Atmos. 2002, 107, ACL 11-1–ACL 11-14. [Google Scholar] [CrossRef]
  26. Yadav, R.; Giri, R.K.; Puviarasan, N.; Bhan, S.C. Annual, seasonal, monthly & diurnal IPWV analysis and precipitation forecasting over the Indian subcontinent based on monthly thresholds of ground-based GNSS-IPWV. Adv. Space Res. 2022, 70, 3122–3136. [Google Scholar] [CrossRef]
  27. Huang, L.K.; Wang, X.; Xiong, S.; Li, J.Y.; Liu, L.L.; Mo, Z.X.; Fu, B.L.; He, H.C. High-precision GNSS PWV retrieval using dense GNSS sites and in-situ meteorological observations for the evaluation of MERRA-2 and ERA5 reanalysis products over China. Atmos. Res. 2022, 276, 106247. [Google Scholar] [CrossRef]
  28. Shu, B.; He, Y.; Wang, L.; Zhang, Q.; Li, X.; Qu, X.; Huang, G.; Qu, W. Real-time high-precision landslide displacement monitoring based on a GNSS CORS network. Measurement 2023, 217, 113056. [Google Scholar] [CrossRef]
  29. Lavers, D.A.; Simmons, A.; Vamborg, F.; Rodwell, M.J. An evaluation of ERA5 precipitation for climate monitoring. Q. J. R. Meteorol. Soc. 2022, 148, 3152–3165. [Google Scholar] [CrossRef]
  30. Jadala, N.B.; Sridhar, M.; Dutta, G.; Yousuf, M.; Reddy, Y.K. Integrated water vapor during active and break spells of monsoon and its relationship with temperature, precipitation and precipitation efficiency over a tropical site. Geod. Geodyn. 2022, 13, 238–246. [Google Scholar] [CrossRef]
  31. Yang, F.; Guo, J.M.; Meng, X.L.; Shi, J.B.; Xu, Y.; Zhang, D. Determination of Weighted Mean Temperature (Tm) Lapse Rate and Assessment of Its Impact on Tm Calculation. IEEE Access 2019, 7, 155028–155037. [Google Scholar] [CrossRef]
  32. Yang, P.F.; Zhao, Q.Z.; Li, Z.F.; Yao, W.Q.; Yao, Y.B. High temporal resolution global PWV dataset of 2005-2016 by using a neural network approach to determine the mean temperature of the atmosphere. Adv. Space Res. 2021, 67, 3087–3097. [Google Scholar] [CrossRef]
  33. Meza, A.; Mendoza, L.; Natali, M.P.; Bianchi, C.; Fernández, L. Diurnal variation of precipitable water vapor over Central and South America. Geod. Geodyn. 2020, 11, 426–441. [Google Scholar] [CrossRef]
  34. Ye, H.; Fetzer, E.J.; Wong, S.; Behrangi, A.; Olsen, E.T.; Cohen, J.; Lambrigtsen, B.H.; Chen, L. Impact of increased water vapor on precipitation efficiency over northern Eurasia. Geophys. Res. Lett. 2014, 41, 2941–2947. [Google Scholar] [CrossRef]
  35. Zhu, G.; Huang, L.K.; Liu, L.L.; Li, C.; Li, J.Y.; Huang, L.; Zhou, L.; He, H.C. A New Approach for the Development of Grid Models Calculating Tropospheric Key Parameters over China. Remote Sens. 2021, 13, 3546. [Google Scholar] [CrossRef]
  36. Saastamoinen, J. Atmospheric Correction for the Troposphere and Stratosphere in Radio Ranging Satellites. In The Use of Artificial Satellites for Geodesy; John Wiley & Sons Inc.: Hoboken, NJ, USA, 1972; pp. 247–251. [Google Scholar] [CrossRef]
  37. Huang, L.; Jiang, W.; Liu, L.; Chen, H.; Ye, S. A new global grid model for the determination of atmospheric weighted mean temperature in GPS precipitable water vapor. J. Geod. 2019, 93, 159–176. [Google Scholar] [CrossRef]
  38. Huang, L.; Liu, L.; Chen, H.; Jiang, W. An improved atmospheric weighted mean temperature model and its impact on GNSS precipitable water vapor estimates for China. GPS Solut. 2019, 23, 51. [Google Scholar] [CrossRef]
  39. Sun, Z.Y.; Zhang, B.; Yao, Y.B. An ERA5-Based Model for Estimating Tropospheric Delay and Weighted Mean Temperature Over China With Improved Spatiotemporal Resolutions. Earth Space Sci. 2019, 6, 1926–1941. [Google Scholar] [CrossRef]
  40. Ding, M.H. A neural network model for predicting weighted mean temperature. J. Geod. 2018, 92, 1187–1198. [Google Scholar] [CrossRef]
  41. Yao, Y.B.; Zhu, S.; Yue, S.Q. A globally applicable, season-specific model for estimating the weighted mean temperature of the atmosphere. J. Geod. 2012, 86, 1125–1135. [Google Scholar] [CrossRef]
  42. Zhang, S.K.; Gong, L.; Gao, W.L.; Zeng, Q.; Xiao, F.; Liu, Z.Z.; Lei, J.T. A weighted mean temperature model using principal component analysis for Greenland. GPS Solut. 2023, 27, 57. [Google Scholar] [CrossRef]
  43. Böhm, J.; Heinkelmann, R.; Schuh, H. Short Note: A global model of pressure and temperature for geodetic applications. J. Geod. 2007, 81, 679–683. [Google Scholar] [CrossRef]
  44. Landskron, D.; Boehm, J. VMF3/GPT3: Refined discrete and empirical troposphere mapping functions. J. Geod. 2018, 92, 349–360. [Google Scholar] [CrossRef] [PubMed]
  45. Mo, Z.; Zeng, Z.; Huang, L.; Liu, L.; Huang, L.; Zhou, L.; Ren, C.; He, H. Investigation of Antarctic Precipitable Water Vapor Variability and Trend from 18 Year (2001 to 2018) Data of Four Reanalyses Based on Radiosonde and GNSS Observations. Remote Sens 2021, 13, 3901. [Google Scholar] [CrossRef]
  46. Hersbach, H.; Bell, B.; Berrisford, P.; Hirahara, S.; Horányi, A.; Muñoz-Sabater, J.; Nicolas, J.; Peubey, C.; Radu, R.; Schepers, D.; et al. The ERA5 global reanalysis. Q. J. R. Meteorol. Soc. 2020, 146, 1999–2049. [Google Scholar] [CrossRef]
  47. Zhang, Y.; Cai, C.; Chen, B.; Dai, W.J.R.S. Consistency Evaluation of Precipitable Water Vapor Derived From ERA5, ERA-Interim, GNSS, and Radiosondes Over China. Radio Sci. 2019, 54, 561–571. [Google Scholar] [CrossRef]
  48. Zhu, D.; Zhang, K.; Yang, L.; Wu, S.; Li, L.J.R.S. Evaluation and Calibration of MODIS Near-Infrared Precipitable Water Vapor over China Using GNSS Observations and ERA-5 Reanalysis Dataset. Remote Sens. 2021, 13, 2761. [Google Scholar] [CrossRef]
  49. Huang, L.; Mo, Z.; Liu, L.; Zeng, Z.; Chen, J.; Xiong, S.; He, H. Evaluation of hourly PWV products derived from ERA5 and MERRA-2 over the Tibetan Plateau using ground-based GNSS observations by two enhanced models. Earth Space Sci. 2021, 8, e2020ea001516. [Google Scholar] [CrossRef]
  50. Wang, J.; Zhang, L.; Dai, A. Global estimates of water-vapor-weighted mean temperature of the atmosphere for GPS applications. J. Geophys. Res.-Atmos. 2005, 110, D21101. [Google Scholar] [CrossRef]
  51. Vomel, H.; Selkirk, H.; Miloshevich, L.; Valverde-Canossa, J.; Valdes, J.; Kyroe, E.; Kivi, R.; Stolz, W.; Peng, G.; Diaz, J.A. Radiation dry bias of the vaisala RS92 humidity sensor. J. Atmos. Ocean. Technol. 2007, 24, 953–963. [Google Scholar] [CrossRef]
  52. Tsidu, G.M.; Blumenstock, T.; Hase, F. Observations of precipitable water vapour over complex topography of Ethiopia from ground-based GPS, FTIR, radiosonde and ERA-Interim reanalysis. Atmos. Meas. Technol. 2015, 8, 3277–3295. [Google Scholar] [CrossRef]
  53. Zhao, Q.Z.; Yang, P.F.; Yao, W.Q.; Yao, Y.B. Hourly PWV Dataset Derived from GNSS Observations in China. Sensors 2020, 20, 231. [Google Scholar] [CrossRef]
  54. Huang, L.; Mo, Z.; Xie, S.; Liu, L.; Chen, J.; Kang, C.; Wang, S. Spatiotemporal characteristics of GNSS-derived precipitable water vapor during heavy rainfall events in Guilin, China. Satell. Navig. 2021, 2, 13. [Google Scholar] [CrossRef]
  55. Kannemadugu, H.B.S.; Ranganathan, K.; Gharai, B.; Seshasai, M.V.R. GNSS-GPS derived integrated water vapor and performance assessment of ERA-5 data over India. J. Atmos. Sol.-Terr. Phys. 2021, 227, 105807. [Google Scholar] [CrossRef]
  56. Hobbs, J. Characterizing Diurnal and Interannual Variability in the Atmosphere through Physical and Stochastic Models. Ph.D. Thesis, Iowa State University, Ames, IA, USA, 2014. [Google Scholar] [CrossRef]
  57. Li, G.; Kimura, F.; Sato, T.; Huang, D. A composite analysis of diurnal cycle of GPS precipitable water vapor in central Japan during Calm Summer Days. Theor. Appl. Climatol. 2008, 92, 15–29. [Google Scholar] [CrossRef]
  58. Eric, E.; Wandjie, B.B.S.; Lenouo, A.; Monkam, D.; Manatsa, D. African summer monsoon active and break spells cloud properties: Insight from CloudSat-CALIPSO. Atmos. Res. 2020, 237, 104842. [Google Scholar] [CrossRef]
  59. Rajeevan, M.; Gadgil, S.; Bhate, J. Active and break spells of the Indian summer monsoon. J. Earth Syst. Sci. 2010, 119, 229–247. [Google Scholar] [CrossRef]
  60. Tuller, S.E. Seasonal and annual precipitation efficiency in Canada. Atmosphere 1973, 11, 52–66. [Google Scholar] [CrossRef]
  61. Bauer, M.; Del Genio, A.D.; Lanzante, J.R. Observed and simulated temperature-humidity relationships: Sensitivity to sampling and analysis. J. Clim. 2002, 15, 203–215. [Google Scholar] [CrossRef]
  62. Lien, T.Y.; Yeh, T.K.; Hong, J.S.; Hsiao, T.Y. Variations in GPS precipitable water vapor and rainfall during the 2006-2019 Mei-yu season in Taiwan. Adv. Space Res. 2022, 70, 1375–1387. [Google Scholar] [CrossRef]
  63. Sapucci, L.F.; Machado, L.A.T.; de Souza, E.M.; Campos, T.B. Global Positioning System precipitable water vapour (GPS-PWV) jumps before intense rain events: A potential application to nowcasting. Meteorol. Appl. 2019, 26, 49–63. [Google Scholar] [CrossRef]
  64. Berg, P.; Haerter, J.O.; Thejll, P.; Piani, C.; Hagemann, S.; Christensen, J.H. Seasonal characteristics of the relationship between daily precipitation intensity and surface temperature. J. Geophys. Res.-Atmos. 2009, 114, D18102. [Google Scholar] [CrossRef]
  65. Yassien, A.E.; Mousa, A.E.-K.; Rabah, M.; Saber, A.; Zhran, M. Analysis of spatial and temporal variation of precipitable water vapor using COSMIC radio occultation observations over Egypt. Egypt. J. Remote Sens. Space Sci. 2022, 25, 751–764. [Google Scholar] [CrossRef]
  66. Ghaffari-Razin, S.R.; Majd, R.D.; Hooshangi, N. Regional modeling and forecasting of precipitable water vapor using least square support vector regression. Adv. Space Res. 2023, 71, 4725–4738. [Google Scholar] [CrossRef]
Figure 1. Distribution of 121 GNSS stations and 4 RS stations in Guangxi.
Remotesensing 15 04710 g001
Figure 2. Top is scatter plot at three different times between RS PWV and GNSS PWV (blue dots), respectively; Bottom is scatter plot of PWV between four RS stations and the selected co-located GNSS stations (gray dots). The red solid line means line of best fit and bule dotted line means 1:1 line.
Remotesensing 15 04710 g002
Figure 3. Scatter plot between GNSS PWV and ERA5 PWV in the entire Guangxi region and four subregions from 2017 to 2020 (solid line means line of best fit, dotted line means 1:1 line).
Remotesensing 15 04710 g003
Figure 4. Distribution of mean annual bias and RMSE between GNSS PWV and ERA5 PWV of 104 GNSS stations in Guangxi from 2017 to 2020. The red lines represent the boundaries of each subregion.
Remotesensing 15 04710 g004
Figure 5. The mean bias and RMSE between GNSS PWV and ERA5 PWV in different seasons and subregions from 2017 to 2020 (Q1 and Q3 of the box represent the first and third quartiles, respectively, the distance of Q1 and Q3 reflects degree of fluctuation of data; Q2 is the median value, which reflects the average level of data; Q4 represents the outlier). The purple boxes represent winter, the blue ones represent PerM, the red ones represent MonS, and the golden ones represent PostM.
Remotesensing 15 04710 g005
Figure 6. Top and middle are the time series of daily mean bias and RMSE between GNSS PWV and ERA5 PWV of four subregions from 2017 to 2020, respectively (negative bias is red; the bar length of RMSE is the difference between the corresponding days in this region and the entire of Guangxi). The bottom left is the time series of daily mean bias and RMSE between GNSS PWV and ERA5 PWV in the entire Guangxi region. The bottom right is a histogram of days with bias and RMSE greater than the daily average across four seasons.
Remotesensing 15 04710 g006
Figure 7. Diurnal variation of PWV anomaly in different seasons at 16 stations in four subregions.
Remotesensing 15 04710 g007
Figure 8. Time series of PWV (blue, left-hand ordinate) and standardized rainfall anomaly (orange, right-hand ordinate) during the monsoon of 2017–2018 to identify dry and wet spells. The horizontal lines represent ±0.5 standardized rainfall anomalies. The green circles show active spells and black circles show break spells.
Remotesensing 15 04710 g008
Figure 9. Mean diurnal fluctuations of PWV during active and break spells for 2017 and 2018 (AS is an active spell; BS is a break spell). The marks in each subplot represent the PWV anomalies at each hour during different time periods, and the lines represent the fitted curves. Standard deviations are depicted by vertical bars.
Remotesensing 15 04710 g009
Figure 10. Heatmap of the correlation between PWV, surface temperature, rainfall, and PE in different periods from 2017 to 2020.
Remotesensing 15 04710 g010
Table 1. Monthly Bias and RMSE between GNSS PWV and RS PWV.
MonthsJanuaryFebruaryMarchAprilMayJuneJulyAugustSeptemberOctoberNovemberDecember
Bias (mm)−0.74−0.080.78−0.120.690.361.412.241.03−0.520.16−0.32
RMSE (mm)0.220.060.550.080.490.261.001.580.730.370.120.23
Table 2. Statistics of the daily bias and RMSE between GNSS PWV and ERA5 PWV in the entire Guangxi and the four subregions from 2017 to 2020.
RegionsBias (mm)RMSE (mm)
MinMaxMeanMinMaxMean
GX−5.626.620.801.186.632.87
GXN−5.647.720.791.157.722.76
GXM−5.947.370.631.208.042.83
GXS−5.767.750.931.067.752.75
GXC−6.518.120.181.148.232.37
Table 3. Statistics and corresponding time of the hourly PWV anomaly of the daily cycle in different regions and different periods (unit: mm; time is local time).
RegionsAnnualPreMMonSPostMWinter
MinMaxMinMaxMinMaxMinMaxMinMax
GX−0.360.56−0.480.63−0.690.64−0.530.63−0.290.39
LT07:0016:0015:0008:0023:0009:0023:0008:0003:0008:00
GXN−0.470.42−0.690.46−0.800.74−0.430.49−0.450.22
LT08:0017:0002:0009:0023:0011:0023:0008:0002:0018:00
GXM−0.400.66−0.650.76−0.780.73−0.550.70−0.310.48
LT07:0016:0016:0008:0023:0007:0023:0010:0002:0008:00
GXS−0.400.63−0.750.84−0.510.57−0.610.66−0.370.56
LT23:0015:0015:0007:0023:0006:0023:0008:0015:0007:00
GXC−0.580.41−1.130.81−0.960.94−0.880.78−0.570.84
LT23:0013:0013:0022:0012:0000:0022:0009:0016:0008:00
Table 4. Duration of active and break spells (DT is temperature difference during the corresponding period).
YearNO.Duration of Active SpellDaysDT (°C)NO.Duration of Break SpellDaysDT (°C)
201715 June–9 June513118 July–20 July35
212 June–16 June512228 July–30 July37
327 June–4 July810318 August–21 August48
47 July–11 July58427 August–29 August36
51st August–5 August57511 September–17 September78
613 August–15 August39
75 September–7 September38
201811st June–4 June418114 June–19 June610
210 June–12 June31128 September–12 September58
320 June–26 June78328 September–30 September311
46 July–8 July37
528 July–4 August87
628 August–2 September612
716 September–18 September310
2020123 June–27 June522112 July–15 July416
230 June–2 July316223 July–25 July320
38 July–10 July31636 August–8 August319
417 August–22 August617
526 August–11 September718
616 September–18 September318
725 September–27 September319
Disclaimer/Publisher’s Note: The statements, opinions and data contained in all publications are solely those of the individual author(s) and contributor(s) and not of MDPI and/or the editor(s). MDPI and/or the editor(s) disclaim responsibility for any injury to people or property resulting from any ideas, methods, instructions or products referred to in the content.

