Article

Sentinel-2 Time Series and Classifier Fusion to Map an Aquatic Invasive Plant Species along a River—The Case of Water-Hyacinth

1
Departamento de Biologia, Faculdade de Ciências, Universidade do Porto, Rua Campo Alegre s/n, 4169-007 Porto, Portugal
2
CIBIO/InBIO-Research Centre in Biodiversity and Genetic Resources, Campus de Vairão, Universidade do Porto, Rua Padre Armando Quintas, 7, 4485-661 Vairão, Portugal
3
BIOPOLIS Program in Genomics, Biodiversity and Land Planning, CIBIO, Campus de Vairão, 4485-661 Vairão, Portugal
4
proMetheus-Research Unit in Materials, Energy and Environment for Sustainability, Instituto Politécnico de Viana do Castelo, 4900-347 Viana do Castelo, Portugal
*
Author to whom correspondence should be addressed.
Remote Sens. 2023, 15(13), 3248; https://doi.org/10.3390/rs15133248
Submission received: 5 May 2023 / Revised: 7 June 2023 / Accepted: 19 June 2023 / Published: 23 June 2023
(This article belongs to the Special Issue Remote Sensing Applications to Ecology: Opportunities and Challenges)

Abstract

:
Freshwater ecosystems host high levels of biodiversity but are also highly vulnerable to biological invasions. Aquatic Invasive Alien Plant Species (aIAPS) can cause detrimental effects on freshwater ecosystems and their services to society, raising challenges to decision-makers regarding their correct management. Spatially and temporally explicit information on the occurrence of aIAPS in dynamic freshwater systems is essential to implement efficient regional and local action plans. The use of unmanned aerial vehicle imagery synchronized with free Sentinel-2 multispectral data allied with classifier fusion techniques may support more efficient monitoring actions for non-stationary aIAPS. Here, we explore the advantages of such a novel approach for mapping the invasive water-hyacinth (Eichhornia crassipes) in the Cávado River (northern Portugal). Invaded and non-invaded areas were used to explore the evolution of spectral attributes of Eichhornia crassipes through a time series (processed by a super-resolution algorithm) that covers March 2021 to February 2022 and to build an occurrence dataset (presence or absence). Analysis of the spectral behavior throughout the year allowed the detection of spectral regions with greater capacity to distinguish the target plant from the surrounding environment. Classifier fusion techniques were implemented in the biomod2 predictive modelling package and fed with selected spectral regions to firstly extract a spectral signature from the synchronized day and secondly to identify pixels with similar reflectance values over time. Predictions from statistical and machine-learning algorithms were ensembled to map invaded spaces across the whole study area during all seasons with classifications attaining high accuracy values (True Skill Statistic, TSS: 0.932; Area Under the Receiver Operating Curve, ROC: 0.992; Kappa: 0.826). Our results provide evidence of the potential of our approach to mapping plant invaders in dynamic freshwater systems over time, applicable in the assessment of the success of control actions as well as in the implementation of long-term strategic monitoring.

Graphical Abstract

1. Introduction

Biological invasions are a major threat to biodiversity worldwide [1] and are identified as one of the main pressures on ecological values [2]. The expansion of aquatic Invasive Alien Plant Species (hereafter aIAPS) triggers complex and cumulative impacts on native biodiversity [3], human health [4], economic activities [5], and an overall decrease in ecosystem services and nature contributions to people [6]. Although the impacts of aIAPS are well studied by the scientific community [4,5,6], the number of habitats and locations threatened by their presence continues to increase [7].
Fluvial ecosystems suffer multiple anthropogenic pressures (e.g., dam and weir construction and diffuse pollution) leading to hydrological alterations (e.g., dissolved oxygen levels, light penetration, or flow velocity), which can promote irreversible changes in native species richness and composition [8,9]. Monitoring water systems is a required process to prevent and mitigate large-scale expansion and impacts associated with aIAPS [10]. Although monitoring water systems often entails high costs (e.g., human training, equipment, and field surveillance) and efforts (e.g., over large areas, complex vegetation cover, and inaccessible areas) when considered at early stages of the invasion process, it allows the early detection of aIAPS and consequent prevention of the irreversible changes that their spread could lead to [11]. Nonetheless, aIAPS are frequently best detected when they are vastly spread, having become hard to eradicate due to their high plasticity and lack of natural competitors.
The spread of aIAPS in rivers is usually exponentiated by anthropogenic and hydrological disturbances and are generally located at lower altitudes where rivers widen and more light is accessible at the water surface [10]. Moreover, these areas are also used for economic and recreational activities that (in)directly depend on “healthy” water bodies. In order to support aIAPS management interventions (e.g., control, removal), local decision-makers need a better understanding of aIAPS species’ dynamics over time and space [12,13]. Remote sensing (RS) platforms offer valuable tools for the detection and monitoring of aIAPS and ultimately for shaping and optimizing efficient strategic and operational management of aIAPS [14,15]. Additionally, RS satellite platforms offer repeated and standardized imagery over the same area along the time, allowing the study of spatiotemporal patterns of aIAPS [3,16]. The Copernicus mission, developed by the European Space Agency, provides free-of-charge satellite image collections, from optical to radar observations. Sentinel-2 multispectral optical images present us with promising opportunities for studying vegetation and, in particular, for detecting aIAPS [17,18,19]. Plants hold distinct phenologies, hence different leaf density rates and chlorophyll contents that result in electromagnetic reflectance variations over time and space. These differences are more pronounced in alien plants, which usually stand out from the autochthonous flora due to their physiology [20,21].
However, due to the relatively low spatial resolution of free satellite imagery, the use of such types of data has prevailed over large areas in natural or artificial great lakes [11,20], with less complex fluid dynamics than rivers allowing floating macrophytes to remain geographically stable without being dragged downstream by the current [3]. To overcome the limitations of sensor resolution and the high cost needed to update equipment orbiting space, powerful tools for image super-resolution based on pre-trained deep learning neural networks are increasingly being developed and improved, transforming imagery with coarse resolutions into a finer resolution, which allows enhancing the information registered by the sensors [22]. The increasing accessibility of Unoccupied Aerial Vehicles (UAVs) also allows improvements over satellite-derived data in aIAPS detection by producing highly detailed orthomosaics of ultra-high spatial resolution enabling the identification of invaded spaces with great reliability [23]. As such, the combined use of satellite and UAV imagery emerges as a promising opportunity to monitor aIAPS. When timely synchronized, the combined approach enables the identification (with high confidence) of target invasive species, minimizing the risk of using erroneous spectral information (e.g., due to plant displacement caused by river currents) [24,25,26].
Complementarily to advances in RS, the increased availability and ease of implementation of statistical and machine-learning algorithms further allow an in-depth interpretation of the spectral information recorded in RS imagery. The package biomod2 [27] is a platform implemented in R well-known and frequently used by the scientific community that can combine different modelling/classification techniques in a final consensus model that discriminates the presence/absence of a species across space [28]. The biomod2 framework can be applied to perform pixel-based supervised classification through an ensemble approach, “classifier fusion” [29]. Therefore, it can be used as a suitable multi-classifier stacking ensemble that standardizes the uncertainty present in the individual models and determines a general prediction consistent with all classification methods [30,31]. Another advantage of biomod2 for aIAPS mapping is its ability to run non-parametric models that, unlike parametric models, can assume that a pixel is a mixture of features and sub-divide each one to increase spectral variance inside and between pixels [32].
The ability to explore all spectral regions of Sentinel-2 with the same resolution, combined with precise geopositioning data from UAVs and allied with processing abilities of semi-automatic classification techniques, makes it possible to use multispectral imagery to generate valuable information for the management of invasions considering short and long-term monitoring time frames [33,34]. This is possible due to the model’s ability to deal with large amounts of information and identify relationships between the input variables (spectral variables) and species occurrence data. The execution of these techniques allows policymakers to aggregate specific and local knowledge along the river to understand which spaces are more prone to invasion, spread velocity throughout the year, and early signs of necessity to anticipate measures of control or mitigation [9].
In this study, we developed and tested a methodological novelty framework for monitoring a river body invaded by aIAPS by combining UAVs for high-precision mapping (5 cm/pixel) and collections of multispectral data processed with classifier fusion techniques that map and identify the spectral regions of the Sentinel-2 sensor most capable of detecting invaded spaces as well as define optimal time frames. This study contributes to the development and optimization of methodologies for monitoring aIAPS [22,32,35,36], using Eichhornia crassipes (Mart.) Solms (hereafter E. crassipes) in dynamic rivers as a test case.

2. Materials and Methods

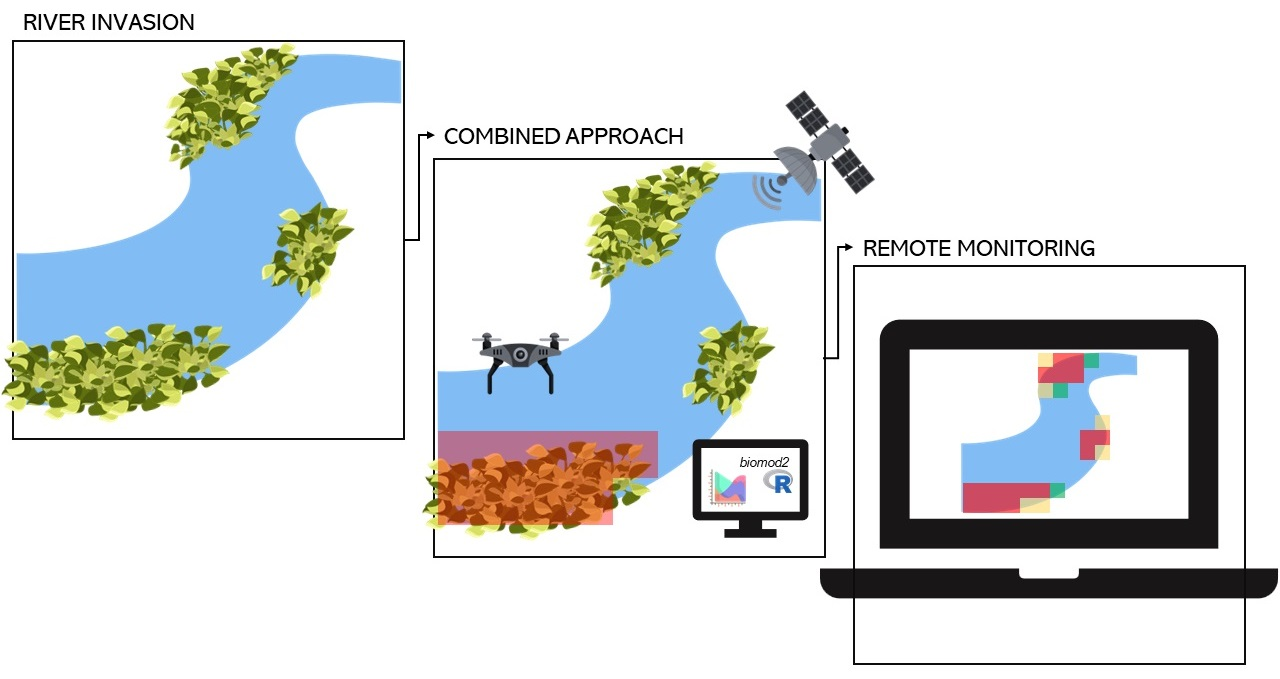
2.1. General Workflow

This study follows the main workflow described in Figure 1. In Step 1, field data were collected using a UAV to obtain a georeferenced orthomosaic of invaded spaces. The flight was performed on the 13 November 2021 (the collection date is important for subsequent steps, where the UAV data is timely synchronized with the Sentinel-2 imagery). The main objective of this step was the collection of data on two test sample areas that could allow the testing of two questions: (1) if there is spectral separability between E. crassipes and the other components of its habitat, and (2) if registered spectral information can be used to map and monitor E. crassipes.
In Step 2, Sentinel-2 time series were retrieved and processed with a super-resolution algorithm (DSen2) to standardize the spectral resolution. This algorithm enhances the potential of Sentinel-2 imagery by upscaling the lower-resolution regions of the electromagnetic spectrum covered by this sensor to 10 m resolution.
In Step 3, the first test sample of pixels (henceforward TS1) obtained in Step 1 was used to understand whether there are regions of the electromagnetic spectrum where E. crassipes reflectance patterns are distinct from the surrounding environment. Studying the spectral behavior of aIAPS along the temporal space can be challenging, especially regarding floating species that are frequently washed away by the river current. To overcome this challenge, geographically static areas are necessary, so an ever-invaded area (Figure 2B) was used to study the spectral behavior of the target species.
An image classification model was developed in Step 4, using the R package biomod2 and taking advantage of its classifier fusion approach that results in a final consensus model by considering several classification methods. This step is unfolded in two subsequential steps: In Step 4a, the second test sample obtained in Step 1 (henceforward TS2) was used to record “presence” and “absence” training areas, with the selected spectral regions defined in Step 3 being considered as predictor variables. In Step 4b, the spectral response recorded on 13 November for the defined regions of the electromagnetic spectrum (spectral signature) was then used in the rest of the imagery collection to detect pixels with identical spectral behavior to the one registered, enabling the mapping of E. crassipes invasion over time.

2.2. Study Area

Located in the northern hemisphere of Northwestern (NW) Portugal, the study area has a temperate climate with dry and mild summers (Csb type, according to the Köppen and Geiger classification of climate systems) [37]. Characterized by the presence of discontinuous patches of E. crassipes, which throughout the summer (June to August) and autumn (September to November) have strong impact on riverine ecology and human activities, the study area extends from the Caniçada dam (41°39′N, 8°14′W) to the mouth of the Cávado River, covering a total of 60 km and an area of 548 ha (Figure 2). It is an elongated river with a transversal profile of narrow valleys (characteristic of a mountain river) progressing, after the Caniçada dam, from gradually opening valleys to flat valleys with higher levels of solar exposition and lower flow velocity due to the river’s meandering.

2.3. Target Species

The E. crassipes (common name: water hyacinth) is an aquatic invasive plant species listed in the Portuguese Decree-Law nº 92/2019 of 10 July and in the European Union Regulation 1143/2014 of the European Parliament and of the Council of 22 October 2014 [38].
As a perennial and herbaceous weed, it reproduces both sexually (seeds) and clonally (vegetative parts). Seeds can be dormant for several years in the hydro soil and germinate in favorable conditions, generating a constantly evolving gene pool [35,36]. The ability to create dense light-excluding canopy layers on the water surface and to vegetatively disperse over a wide area leads to several impacts on fluvial ecosystems (see Figure 3). Once introduced, the species is very difficult to manage and can hinder riverside activities, increase water loss, create hypoxic and hypercarbic systems [39,40], and decrease the overall landscape visual quality.
The morphology of E. crassipes is closely related to the availability of light, pointed out as a significant morphogenetic factor. When plants are sparsely distributed and have short, inflated petioles, mature leaves do not shade the shoot apex and expanding leaves. However, as crowding increases, the decrease in light stimulates the production of leaves with long narrow petioles that elevate laminas above the existing canopy [41]. The increase in leaf length directly expands the plant surface area and the reflectance levels, ultimately making monitoring with RS techniques easier.

2.4. Occurrence Data

The delimitation of training areas is crucial for obtaining accurate results. A field survey was conducted to assess invaded areas and obtain aerial images with a UAV on 13 November 2021 (Step 1).
One DJI Mavic Pro was set to fly at 70 m, and an overlay per image of 80% was considered to collect imagery that enabled the creation of an orthophoto map (5 cm pixel) with the 3D photogrammetry software Agisoft Metashape (version 1.7.3).
The orthophoto map supported the definition of target areas, which were defined as TS1 (n = 15) and consisted of 5 areas per main occupation class (i.e., water, E. crassipes, and woody trees) containing 2 to 5 pixels each (Figure 2A), and the digitalization of all presence areas detected in the orthophoto, defined as TS2 (n = 42). Absence areas (n = 97) were implemented across all invaded areas to ensure a representative distribution of training areas using an open-source base map.

2.5. Remote Sensing Data

Sentinel-2 satellite has a revisit time of approximately two to three days for our study area. The L2A imagery, collected from both Sentinel-2 A and B, covered the period from 20 March 2021 to 2 February 2022, comprising 18 images with low levels of cloud cover along the study area. The imagery was collected through the online platform Copernicus Open Access Hub. Each image was pre-processed with the DSen2 super-resolution algorithm [42], resulting in 12 bands per image (Step 2).
The delimitation of the study area with a 10 m buffer around the river margins allows computational gains by reducing the total number of pixels analyzed and the types of land occupations to mainly riparian woody trees, water, and our target species.
In total, 216 variables were collected (n = 18 × 12). This information was used to compare the target species and the surrounding environment through the average of reflectance values across the spectral regions registered as TS1 pixels (Step 3).

2.6. Multi-Algorithm Supervised Classification

The biomod2 (version 3.5.1) software package is a platform implemented in R that allows the user to evaluate and combine different modelling/classification techniques based on statistical and machine-learning algorithms.
The biomod2 workflow (Step 4) was implemented with 30 modelling rounds for several classifiers: Random Forest (RF), Generalized Linear Model (GLM), Flexible Discriminant Analysis (FDA), Artificial Neural Network (ANN), MAXENT. Phillips 2 (MAX. 2), and Classification Tree Analysis (CTA). To evaluate the overall performance of the classifiers, we calculated the True-Skill Statistic (TSS), Cohen Kappa (KAPPA), and the Area Under the Receiver Operating Curve (ROC).
Although each statistical model provides a different perspective on performance, TSS and Kappa are threshold-dependent measures that take into account the number of correctly classified presences and absences relative to a threshold, whereas ROC is a threshold-independent measure that evaluates the final result as a continuous value within the [0, 1] range and is more prone to overestimation of the classifier’s performance.
Both TSS and Kappa measures vary from [−1, 1] and can be used to obtain a binary outcome (species presence: 1; absence: 0) through the application of a numerical threshold; however, kappa is also sensitive to class imbalance once it considers both true positives and true negatives separately instead of measuring an overall agreement between observed and predicted classifications.
This makes TSS a more reliable metric in cases where a high sensitivity (proportion of observed presences correctly predicted) is more important than a high specificity (proportion of observed absences that are correct) such as in the case of invasive plants (better a false positive than false negative). A classifier fusion model was obtained by calculating the weighted mean of the True-Skill Statistic (TSS) performance score of all partial classifiers and applying the rule of TSS > 0.8.
Finally, to convert the model result from probability/suitability to a binary outcome, we applied a numerical threshold that maximizes the TSS score [29]. Values close to the TSS cutoff were considered pixels with very low spectral similarity to E. crassipes, in opposition to values close to the maximum (1000), which were considered to have very-high spectral similarity to E. crassipes.
Once the pipeline was implemented, the selected variables and training set TS2 were processed through biomod2 to extract firstly a spectral signature of the target plant base on the spectral information captured on the synchronized day (13 November 2021) (Step 4a), and secondly, to map through the collected time series pixels with similar spectral signature to the ones registered (Step 4b).

3. Results

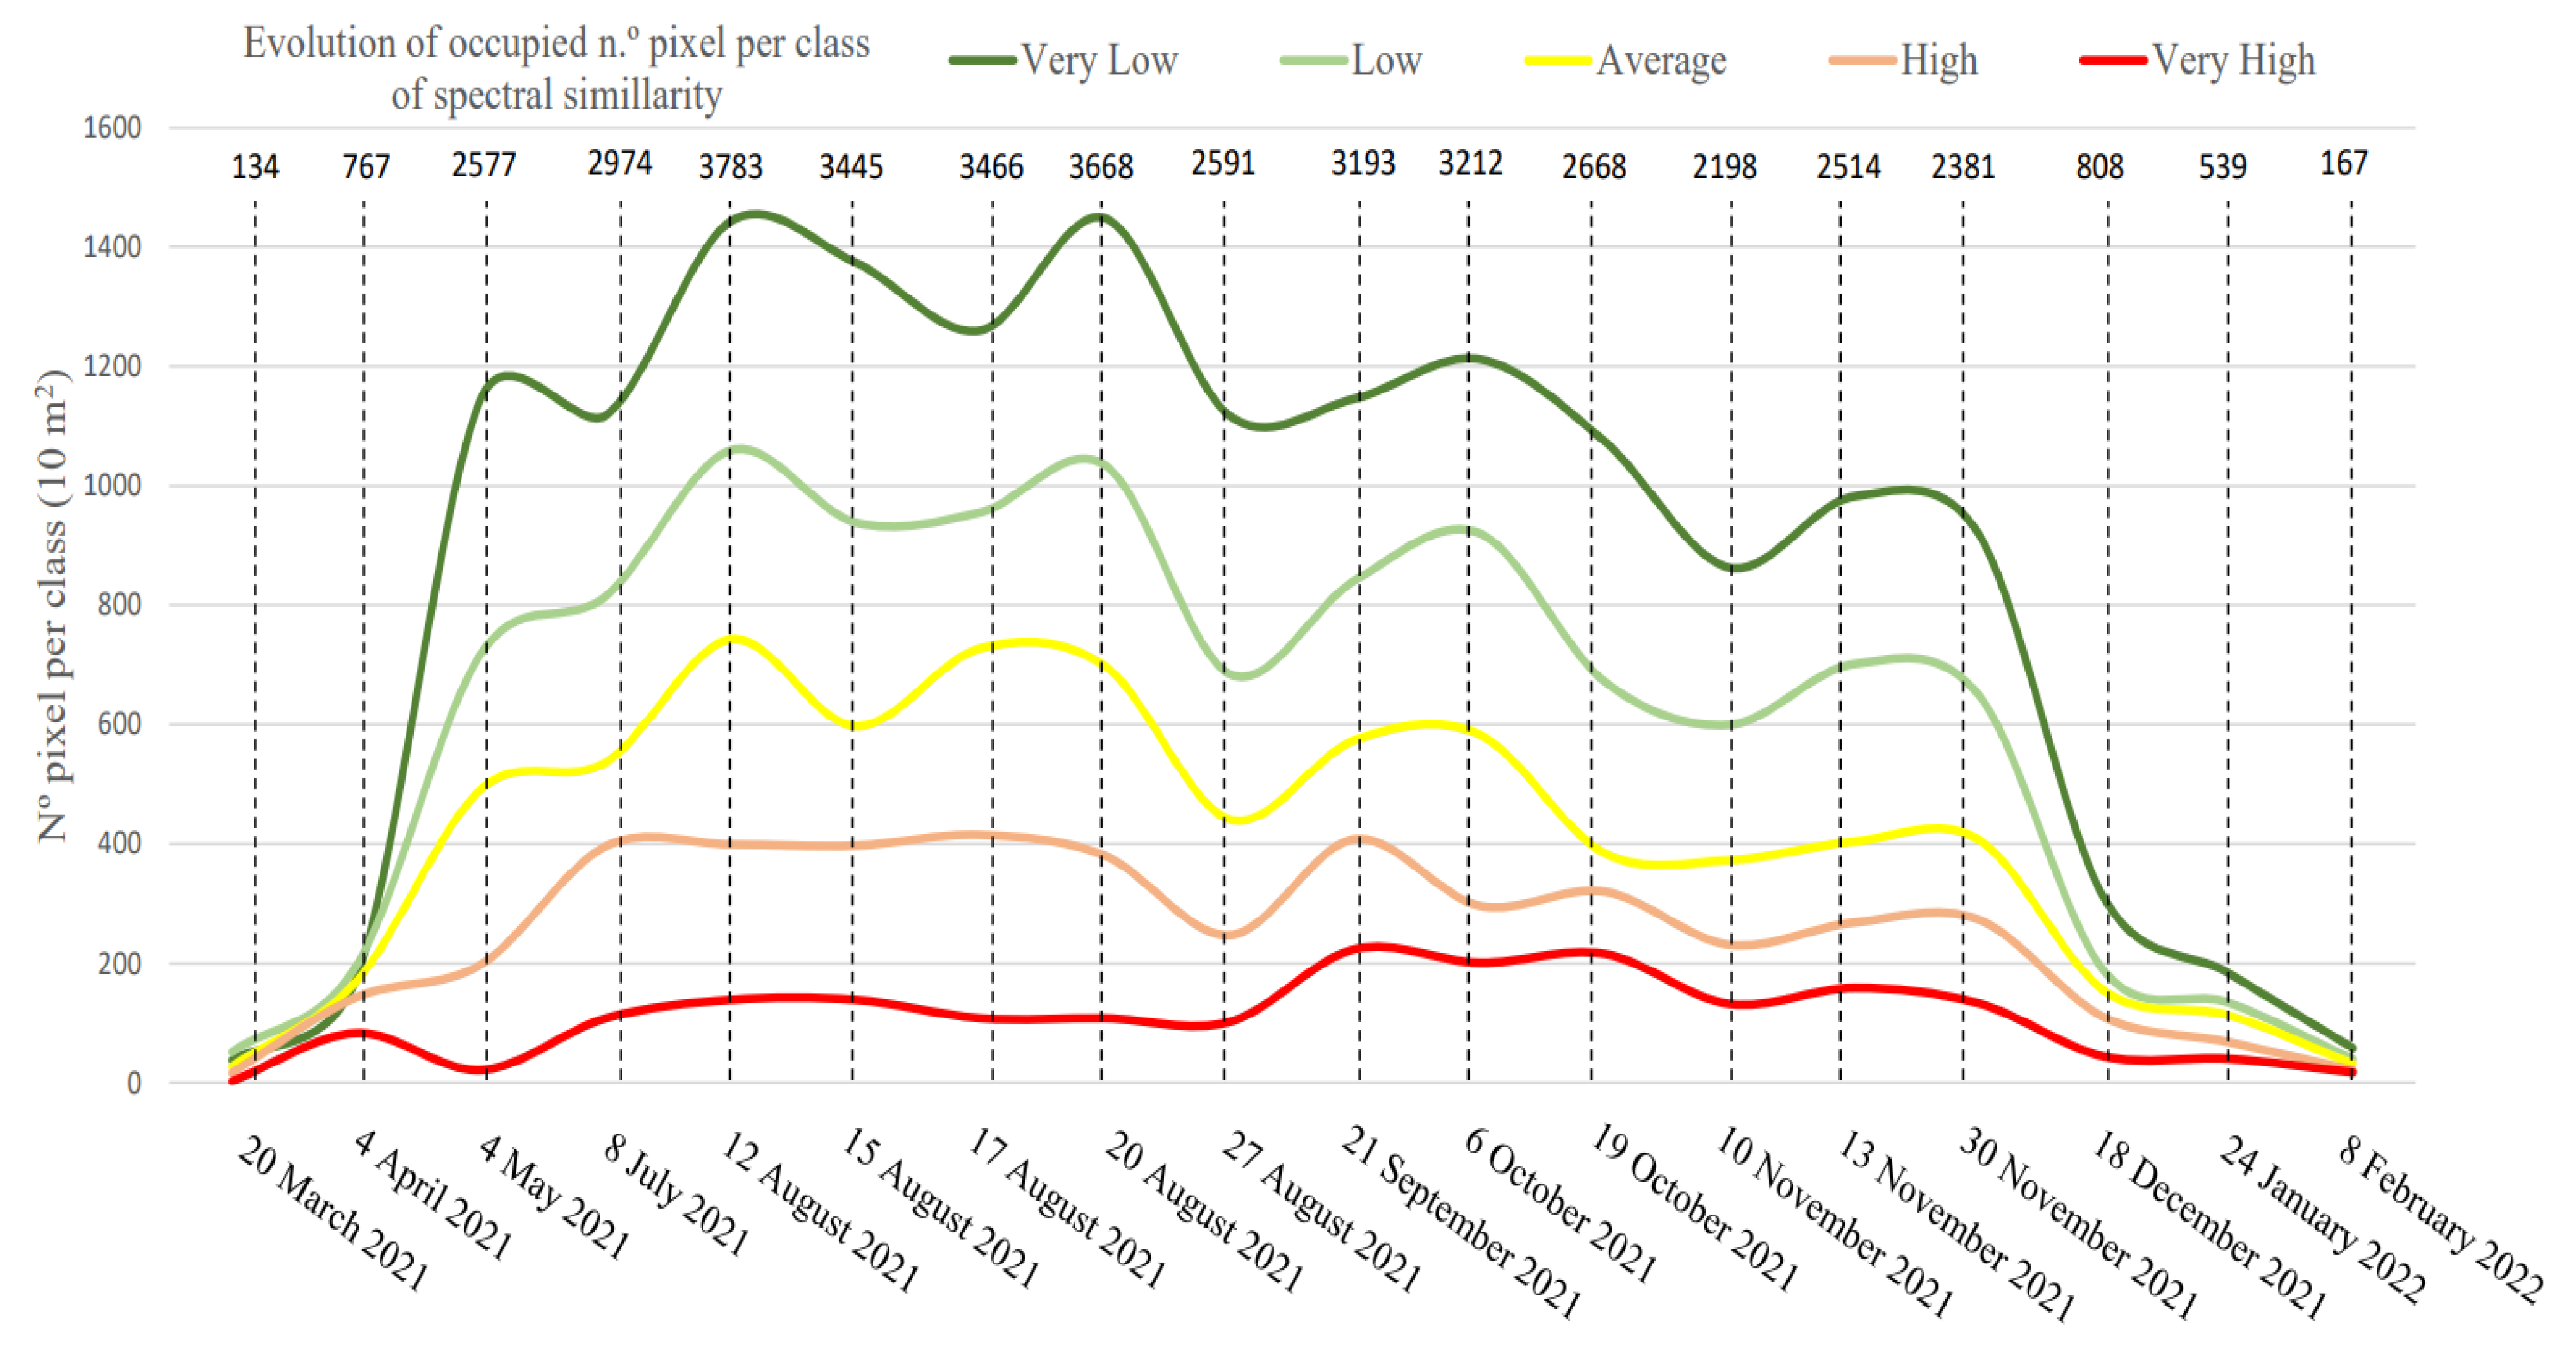
3.1. Spectral Analysis and Separability of E. crassipes through Time

The results show that riverbank riparian trees had a higher spectral reflectance during the summer (close to the peak of the growing season) that decreases through autumn and winter (December to February) due to the senescence process. Water reflectance also had an expected behavior, maintaining low and constant reflectance values except in February due to the severe drought that decreased the river flow (Figure 4).
For TS1 E. crassipes areas, a gradual increase in the reflectance values was registered during spring and summer, with the highest reflectance levels registered in November, in contrast to the leafless riparian forests.
Spectrally, our results show that the spectrum between wavelengths 0.443 µm (band 1) and 0.665 µm (band 4) and at 2.190 µm (band 12) had a poor ability to distinguish E. crassipes from other riparian vegetation. During most of the year (except for moments when the growth or decay of the E. crassipes’ reflectance coincides with the one from riparian woody trees), the spectrum between 0.740–1.610 µm (band 5 to band 11) presented a higher spectral separability.

3.2. Classification Algorithms Performance

The performance of the considered models showed moderate (0.6 < 0.7) (e.g., CTA and FDA) to very good (>0.8) (e.g., GLM and MAX.2) average scores for all evaluation statistical algorithms used. On average, across all partial classifiers, scores with 0.76 for TSS, 0.69 for ROC, and 0.90 for KAPPA were presented.
Although GLM and MAX.2 were the only models performing with a TSS score > 0.8, the partial classifier ANN and RF evaluations scores fall closely to the approved range (see Table 1).
Overall, the classifier fusion based on biomod2 showed very good performance values as translated by their sensitivity and specificity (>0.95) for TSS (see Table 2). The ensemble model presented a performance gain for any evaluation metric value compared to the best partial classification model (i.e., GLM). This result demonstrates the benefit of fusing multiple classifiers with distinct algorithmic frameworks concerning individual partial classifiers.

3.3. Eichornia crassipes Mapping

The classified time series reproduced in a spatially explicit way the growth and decline of E. crassipes, demonstrating the ability of the methodology to map and monitor the distribution of this aIAPS (Figure 5). Pixels with identical spectral values to the ones identified in presence areas were spatialized and classified according to their similarity through the application of the TSS threshold (279).
The ability of E. crassipes to dominate large areas was recorded in the results, where the expansion process of the target plant over a small trench of the analyzed area is visible. The mapping timeline shows that as warmer months pass, the invaded area increases rapidly, keeping rather static during autumn. Conversely, during colder months, at the start of winter, a decrease in the invaded area can be observed.
The number of pixels classified based on the spectral similarity to the one registered on 13 November was mapped and counted for the whole study area, and their evolution through the following months is shown in Figure 6. Each pixel represents an area of 100 m2, making it possible to estimate the total invaded area.
For the whole study area, results suggest a lower dispersion of E. crassipes during winter, a fast growth during spring with a peak in summer, and a progressive slow decrease during autumn. The dispersion of pixels reached its maximum on 20 August with 3668 pixels; the lowest dispersion occurred on 20 March with 164 pixels, suggesting a rapid expansion of E. crassipes.
Although pixels with very low and low spectral proximity made up more than 50% of the information generated on most days tested, they followed a growth and decrease pattern identical to the classes with greater spectral proximity, being able to serve as proxies for the state of E. crassipes spread/growth. Pixels identified with very high spectral similarity had a maximum (>200 pixels) during September and October.

4. Discussion

4.1. Eichornia crassipes Spectral Reflectance Patterns

The identification and use of specific regions of spectra where a target plant has a distinct reflectance pattern enables classifier techniques to improve accuracy by being fed with only relevant information [43,44,45,46].
In our study, Sentinel-2′s multispectral data proved to have enough spatial and temporal resolution to detect and map the distribution of E. crassipes in dynamic freshwater ecosystems [11,43]. For most of the year, E. crassipes had a distinctive spectral reflection pattern compared to the studied surrounding environment, peaking during the first months of autumn, which made this period favorable to the detection of our target species.
The spectral information captured the plant’s life cycle, showing increasingly high reflectance levels as summer weather approached and a decline as winter brought low temperatures and the plant entered dormancy.
Periods of overlap in the reflectance values happened between riparian woody trees and E. crassipes during the end of summer and the beginning of spring. A possible explanation for these overlaps is the seasonal variation in reflectance, where at the end of summer and autumn, riparian woody trees enter a period of senescence, and in contrast, E. crassipes maintains its photosynthetic activity. In the spring, the opposite happens, with E. crassipes lowering photosynthetic activity and riparian woody trees increasing.
Spectral information between bands 5 and 11 (0.740–1.610 µm) were selected as the best spectral regions registered by the Sentinel-2 sensor to detect E. crassipess. These results are not surprising since the ability of the red edge and near-infrared to detect changes in the physiological and structural characteristics of the vegetation is well known in the literature [43,44].
Moreover, the Short Wave Infra-Red (SWIR) spectral region (Sentinel-2′s band 11) was shown to be more sensitive to vegetation variations than SWIR 2 (Sentinel-2′s band 12) [46], which is used to study mineral content (a reason why it has low spectral separability from riparian woody trees) [47].

4.2. Predictive Modelling to Detect and Map

Accurate and reliable detection and mapping of invasive species such as E. crassipes in dynamic freshwater ecosystems provide important spatial and ecological information for sustainable early detection and consequent design of control measures in management programs [48,49]. The application of algorithms to map aIAPS is an increasingly used technique [50], but this approach needs computational expertise and knowledge, which creates difficulties for wide implementation. The use of straightforward modelling techniques, well established in academic communities and with solid information available, facilitates the adoption of this process to map aIAPS.
The R package biomod2 proved able to produce a classifier fusion final consensus map useful for regional and local policymakers, who need spatially explicit information to develop better strategic plants for aIAPS management [51,52]. The ability of biomod2 to incorporate multispectral information in a classifier fusion technique to detect alien species has been demonstrated before [29]; however, aquatic systems remained unexploited by this technique due to intrinsic difficulties of RS in dynamic freshwater systems [34]. The applied methodology showed that UAVs and Sentinel-2 can be coupled and work in a complementary framework that can provide more precise spectral information of aIAPS.
Among the different model techniques in biomod2, GLM had the best performance. Although the GLM is simpler in some respects compared to other more complex models such as neural networks or decision tree models, it is less prone to overfitting and has a greater ability to generalize [53]. However, the ensemble shows the benefit of fusing multiple classifiers with distinct algorithmic frameworks by receiving a higher evaluation than all partial classifiers.
Our results indicate that upstream zones tend to have a very low presence/abundance of E. crassipes, possibly due to higher speed and considerably smaller river width [10,41]. In contrast, open valleys, associated with a lower flow velocity and higher incidence of light, had a higher concentration of areas spectrally similar to invaded ones. As we approach the river mouth, E. crassipes density decreases, probably due to the increase in water salinity that acts as a biological barrier to the species [54].

4.3. Limitations and Proposed Advances

The detection of aIAPS through RS techniques often relies on the spectral regions with the best spatial resolution registered on satellite sensors. Nonetheless, the super-resolution algorithms employed in this study enhanced the potential of spectral regions associated with lower spatial resolution such as Vegetation Red Edge and SWIR for monitoring aquatic environments [55]. The study of longer time series processed through super-resolution algorithms can provide further advances in RS techniques to detect aIAPS.
The overall performance of our models suggests that an increase in the areas of E. crassipes presence can contribute to more spectral variance, which helps acquire more robust and close-to-reality results. As we move away from the day on which the spectral signature of E. crassipes was collected, the less robust the model results are, due to seasonal variation in the spectral signature. Caution is warranted in relation to the temporal variations associated with E. crassipes phenology, as they may limit the transferability of the spectral signature of the species over time and other supervised classifiers. As such, repeated satellite-synchronized UAV flights should be made to collect representative data of the plant spectra in different seasons, thus increasing the phenological variability presented to classifier models.
The lessons learned from our test study suggest that the way forward may be taking our proposed methodology to incorporate correlations between dispersion and descriptive physical factors of space (e.g., flow velocity, bathymetry, river curvature index, water temperature, solar exposure, and soil occupation). Such considerations would also deepen knowledge of ecological and human factors that promote or inhibit the process of invasiveness, which is fundamental to the success of aIAPS management sustained by yearly warning and prevention.

5. Conclusions

Meaningful information and data on aIAPS spatial distribution, growth, and spread remain a challenge in fluvial systems. In this study, we tested a spatially and temporally explicit mapping of Eichornnia crassipes through the use of selected spectral information recorded by Sentinel-2 on semi-automatic classification systems.
Our results indicate that the inclusion of a synchronization process between UAV and satellite imagery and the implementation of super-resolution algorithms can improve aIAPS detection and monitorization. The use of only spectral information sensitive to a highly dynamic aIAPS (Eichornnia crassipes) proved capable of performing semi-automatic classification processes with temporally and spatially accurate results throughout its application in data fusion models. Specifically, this study demonstrates the influence of the red edge region of the electromagnetic spectrum derived from the Sentinel-2 sensor, amongst other influential spectral bands that are relevant in detecting and mapping invasive species in freshwater ecosystems.
Our findings suggest that embracing cutting-edge remote sensing technologies to monitor and manage freshwater ecosystems can improve the spatial awareness of invaded areas from a regional to a local scale.

Author Contributions

Conceptualization, J.F.G., N.M. and R.S.; data curation, N.M., R.S. and J.F.G.; funding acquisition, J.R.V., A.S.V. and J.M.A.; investigation, N.M. and J.F.G.; data creation, N.M. and E.M.P.; writing—original draft, N.M., E.M.P. and J.F.G.; writing—review, A.S.V., J.H., J.M.A. and J.R.V. All authors have read and agreed to the published version of the manuscript.

Funding

This work was supported by Fundo Ambiental Notice nº 9678/2021 as part of the project “SINVAQUA-Support system for the control, monitoring, containment and eradication of aquatic invasive exotic flora by remote detection” and proMetheus—Research Unit on Materials, Energy and Environment for Sustainability. N.M. was supported by the Portuguese Science Foundation (FCT) through the 2022 PhD Studentships (grant reference 2022.12295.BD); E.M.P. was supported by the Portuguese Science Foundation (FCT) through the 2022 PhD Studentships (grant reference 2022.10833.BD); J.F.G. was funded by the Individual Scientific Employment Stimulus Program (2017) through FCT (contract no. CEECIND/02331/2017); A.S.V. acknowledges support from the Portuguese Foundation for Science and Technology (FCT) through the program Stimulus for Scientific Employment—Individual Support [contract reference 2020.01175.CEECIND/CP1601/CT0009]; J.R.V. acknowledges research contract DL57/2016/CP1440/CT0024.

Data Availability Statement

The data presented in this study are available on request from the corresponding author. The data are not publicly available due to legal (e.g., privacy) and ethical restrictions.

Acknowledgments

To all anonymous rewires.

Conflicts of Interest

The authors declare no conflict of interest. The funders had no role in the design of the study; in the collection, analyses, or interpretation of data; in the writing of the manuscript, or in the decision to publish the results.

References

  1. Vaz, A.S.; Kueffer, C.; Kull, C.A.; Richardson, D.M.; Vicente, J.R.; Kühn, I.; Schröter, M.; Hauck, J.; Bonn, A.; Honrado, J.P. Integrating Ecosystem Services and Disservices: Insights from Plant Invasions. Ecosyst. Serv. 2017, 23, 94–107. [Google Scholar] [CrossRef] [Green Version]
  2. European Commission. European Union Biodiversity Strategy for 2030: Bringing Nature Back into Our Lives; European Commission: Brussels, Belgium, 2020. [Google Scholar]
  3. Thamaga, K.H.; Dube, T. Remote Sensing of Invasive Water Hyacinth (Eichhornia crassipes): A Review on Applications and Challenges. Remote Sens. Appl. Soc. Environ. 2018, 10, 36–46. [Google Scholar] [CrossRef]
  4. May, L.; Dobel, A.J.; Ongore, C. Controlling Water Hyacinth (Eichhornia crassipes (Mart.) Solms): A Proposed Framework for Preventative Management. Inland Waters 2021, 12, 163–172. [Google Scholar] [CrossRef]
  5. Cuthbert, R.N.; Pattison, Z.; Taylor, N.G.; Verbrugge, L.; Diagne, C.; Ahmed, D.A.; Leroy, B.; Angulo, E.; Briski, E.; Capinha, C.; et al. Global Economic Costs of Aquatic Invasive Alien Species. Sci. Total Environ. 2021, 775, 145238. [Google Scholar] [CrossRef] [PubMed]
  6. Janssen, A.B.G.; Hilt, S.; Kosten, S.; de Klein, J.J.M.; Paerl, H.W.; Van de Waal, D.B. Shifting States, Shifting Services: Linking Regime Shifts to Changes in Ecosystem Services of Shallow Lakes. Freshw. Biol. 2021, 66, 1–12. [Google Scholar] [CrossRef]
  7. Basu, A.; Hazra, A.K.; Chaudhury, S.; Ross, A.B.; Balachandran, S. State of the Art Research on Sustainable Use of Water Hyacinth: A Bibliometric and Text Mining Analysis. Informatics 2021, 8, 38. [Google Scholar] [CrossRef]
  8. Sabater, S.; Elosegi, A. Balancing Conservation Needs with Uses of River Ecosystems. Acta Biol. Colomb. 2014, 19, 3–10. [Google Scholar] [CrossRef]
  9. Oficialdegui, F.J.; Zamora-Marín, J.M.; Guareschi, S.; Anastácio, P.M.; García-Murillo, P.; Ribeiro, F.; Miranda, R.; Cobo, F.; Gallardo, B.; García-Berthou, E.; et al. A Horizon Scan Exercise for Aquatic Invasive Alien Species in Iberian Inland Waters. Sci. Total Environ. 2023, 869, 161798. [Google Scholar] [CrossRef]
  10. Aguiar, F.C.F.; Ferreira, M.T. Plant Invasions in the Rivers of the Iberian Peninsula, South-Western Europe: A Review. Plant Biosyst. 2013, 147, 1107–1119. [Google Scholar] [CrossRef]
  11. Thamaga, K.H.; Dube, T. Understanding Seasonal Dynamics of Invasive Water Hyacinth (Eichhornia crassipes) in the Greater Letaba River System Using Sentinel-2 Satellite Data. GIScience Remote Sens. 2019, 56, 1355–1377. [Google Scholar] [CrossRef]
  12. Villamagna, A.M.; Murphy, B.R. Ecological and Socio-Economic Impacts of Invasive Water Hyacinth (Eichhornia crassipes): A Review. Freshw. Biol. 2010, 55, 282–298. [Google Scholar] [CrossRef]
  13. Hall, S.A.; Bastos, R.; Vicente, J.; Vaz, A.S.; Honrado, J.P.; Holmes, P.M.; Gaertner, M.; Esler, K.J.; Cabral, J.A. A Dynamic Modeling Tool to Anticipate the Effectiveness of Invasive Plant Control and Restoration Recovery Trajectories in South African Fynbos. Restor. Ecol. 2021, 29, e13324. [Google Scholar] [CrossRef]
  14. Pádua, L.; Antão-Geraldes, A.M.; Sousa, J.J.; Rodrigues, M.Â.; Oliveira, V.; Santos, D.; Miguens, M.F.P.; Castro, J.P. Water Hyacinth (Eichhornia crassipes) Detection Using Coarse and High Resolution Multispectral Data. Drones 2022, 6, 47. [Google Scholar] [CrossRef]
  15. Datta, A.; Maharaj, S.; Prabhu, G.N.; Bhowmik, D.; Marino, A.; Akbari, V.; Rupavatharam, S.; Sujeetha, J.A.R.P.; Anantrao, G.G.; Poduvattil, V.K.; et al. Monitoring the Spread of Water Hyacinth (Pontederia crassipes): Challenges and Future Developments. Front. Ecol. Evol. 2021, 9, 631338. [Google Scholar] [CrossRef]
  16. Kleinschroth, F.; Winton, R.S.; Calamita, E.; Niggemann, F.; Botter, M.; Wehrli, B.; Ghazoul, J. Living with Floating Vegetation Invasions. Ambio 2021, 50, 125–137. [Google Scholar] [CrossRef] [PubMed]
  17. Mukarugwiro, J.A.; Newete, S.W.; Adam, E.; Nsanganwimana, F.; Abutaleb, K.; Byrne, M.J. Mapping Spatio-Temporal Variations in Water Hyacinth (Eichhornia crassipes) Coverage on Rwandan Water Bodies Using Multispectral Imageries. Int. J. Environ. Sci. Technol. 2021, 18, 275–286. [Google Scholar] [CrossRef]
  18. State, P. Erratum Regarding Missing Declaration of Competing Interest Statements in Previously Published Articles. Remote Sens. Appl. Soc. Environ. 2021, 21, 100453. [Google Scholar] [CrossRef]
  19. Karouach, F.; Ben Bakrim, W.; Ezzariai, A.; Sobeh, M.; Kibret, M.; Yasri, A.; Hafidi, M.; Kouisni, L. A Comprehensive Evaluation of the Existing Approaches for Controlling and Managing the Proliferation of Water Hyacinth (Eichhornia crassipes): Review. Front. Environ. Sci. 2022, 9, 767871. [Google Scholar] [CrossRef]
  20. Silva, T.S.F.; Costa, M.P.F.; Melack, J.M.; Novo, E.M.L.M. Remote Sensing of Aquatic Vegetation: Theory and Applications. Environ. Monit. Assess. 2008, 140, 131–145. [Google Scholar] [CrossRef]
  21. Rowan, G.S.L.; Kalacska, M. A Review of Remote Sensing of Submerged Aquatic Vegetation for Non-specialists. Remote Sens. 2021, 13, 623. [Google Scholar] [CrossRef]
  22. Wang, P.; Bayram, B.; Sertel, E. A Comprehensive Review on Deep Learning Based Remote Sensing Image Super-Resolution Methods. Earth Sci. Rev. 2022, 232, 104110. [Google Scholar] [CrossRef]
  23. Dash, J.P.; Hartley, R.; Watt, M.S.; Paul, T.S.H.; Morgenroth, J. Taking a Closer Look at Invasive Alien Plant Research: A Review of the Current State, Opportunities, and Future Directions for UAVs. Methods Ecol. Evol. 2020, 10, 2020–2033. [Google Scholar] [CrossRef] [Green Version]
  24. Elkind, K.; Sankey, T.T.; Munson, S.M.; Aslan, C.E. Invasive Buffelgrass Detection Using High-Resolution Satellite and UAV Imagery on Google Earth Engine. Remote Sens. Ecol. Conserv. 2019, 5, 318–331. [Google Scholar] [CrossRef]
  25. Martin, F.M.; Müllerová, J.; Borgniet, L.; Dommanget, F.; Breton, V.; Evette, A. Using Single- and Multi-Date UAV and Satellite Imagery to Accurately Monitor Invasive Knotweed Species. Remote Sens. 2018, 10, 1662. [Google Scholar] [CrossRef] [Green Version]
  26. Holden, P.B.; Rebelo, A.J.; New, M.G. Mapping Invasive Alien Trees in Water Towers: A Combined Approach Using Satellite Data Fusion, Drone Technology and Expert Engagement. Remote Sens. Appl. Soc. Environ. 2021, 21, 100448. [Google Scholar] [CrossRef]
  27. Thuiller, W.; Georges, D.; Robin, E.; Breiner, F.; Engler, R.; Breiner, F. Package “biomod2” Type Package Title Ensemble Platform for Species Distribution Modeling; R Foundation: Vienna, Austria, 2020. [Google Scholar]
  28. Georges, D.; Engler, R.; Breiner, F.; Georges, M.D.; Thuiller, C.W. Package ‘Biomod2′ February; R Foundation: Vienna, Austria, 2003. [Google Scholar]
  29. Mouta, N.; Silva, R.; Pais, S.; Alonso, J.M.; Gonçalves, J.F.; Honrado, J.; Vicente, J.R. ‘The Best of Two Worlds’—Combining Classifier Fusion and Ecological Models to Map and Explain Landscape Invasion by an Alien Shrub. Remote Sens. 2021, 13, 3287. [Google Scholar] [CrossRef]
  30. Thuiller, W.; Lafourcade, B.; Engler, R.; Araújo, M.B. BIOMOD—A Platform for Ensemble Forecasting of Species Distributions. Ecography 2009, 32, 369–373. [Google Scholar] [CrossRef]
  31. Fernandes, R.F.; Vicente, J.R.; Georges, D.; Alves, P.; Thuiller, W.; Honrado, J.P. A Novel Downscaling Approach to Predict Plant Invasions and Improve Local Conservation Actions. Biol. Invasions 2014, 16, 2577–2590. [Google Scholar] [CrossRef]
  32. Huang, C.; Asner, G. Applications of Remote Sensing to Alien Invasive Plant Studies. Sensors 2009, 9, 4869. [Google Scholar] [CrossRef] [Green Version]
  33. Janssens, N.; Schreyers, L.; Biermann, L.; Van Der Ploeg, M.; Bui, T.K.L.; Van Emmerik, T. Rivers Running Green: Water Hyacinth Invasion Monitored from Space. Environ. Res. Lett. 2022, 17, 044069. [Google Scholar] [CrossRef]
  34. Rowan, G.; Kalacska, M. Remote Sensing of Submerged Aquatic Vegetation: An Introduction and Best Practices Review. Available online: https://www.researchgate.net/publication/343210031_Remote_sensing_of_submerged_aquatic_vegetation_an_introduction_and_best_practices_review (accessed on 3 May 2023).
  35. Fawad, M.; Jamal, A. Water Hyacinth: Utilization and Impact on Diversity. Black Sea J. Agric. 2019, 2, 58–62. [Google Scholar]
  36. García-De-lomas, J.; Dana, E.D.; Borrero, J.; Yuste, J.; Corpas, A.; Boniquito, J.M.; Castilleja, F.J.; Martínez, J.M.; Rodríguez, C.; Verloove, F. Rapid Response to Water Hyacinth (Eichhornia crassipes) Invasion in the Guadalquivir River Branch in Seville (Southern Spain). Manag. Biol. Invasions 2022, 13, 724–736. [Google Scholar] [CrossRef]
  37. Falquina, R.; De, A.; Cabos, W.; Sein, D.; Gallardo, C. Impact of Ocean-Atmosphere Coupling on Present and Future Köppen-Geiger Climate Classification in Europe. Atmos. Res. 2022, 275, 106223. [Google Scholar] [CrossRef]
  38. European Parliament; Council of the European Union. REGULATION (EU) No 1143/2014 of the European Parliament and of the Council of 22 October 2014 on the Prevention and Management of the Introduction and Spread of Invasive Alien Species. Off. J. Eur. Union 2014, 2014, 35–55. [Google Scholar]
  39. Strange, E.F.; Landi, P.; Hill, J.M.; Coetzee, J.A. Modeling Top-down and Bottom-up Drivers of a Regime Shift in Invasive Aquatic Plant Stable States. Front. Plant Sci. 2019, 10, 889. [Google Scholar] [CrossRef] [PubMed]
  40. Otieno, D.; Nyaboke, H.; Nyamweya, C.S.; Odoli, C.O.; Aura, C.M.; Outa, N.O. Water Hyacinth (Eichhornia crassipes) Infestation Cycle and Interactions with Nutrients and Aquatic Biota in Winam Gulf (Kenya), Lake Victoria. Lakes Reserv. Res. Manag. 2022, 27, e12391. [Google Scholar] [CrossRef]
  41. Richards, J.H.; Lee, D.W. Light Effects on Leaf Morphology in Water Hyacinth (Eichhornia crassipes). Am. J. Bot. 1986, 73, 1741–1747. [Google Scholar] [CrossRef]
  42. Lanaras, C.; Bioucas-Dias, J.; Galliani, S.; Baltsavias, E.; Schindler, K. Super-Resolution of Sentinel-2 Images: Learning a Globally Applicable Deep Neural Network. ISPRS J. Photogramm. Remote Sens. 2018, 146, 305–319. [Google Scholar] [CrossRef] [Green Version]
  43. Misra, G.; Cawkwell, F.; Wingler, A. Status of Phenological Research Using Sentinel-2 Data: A Review. Remote Sens. 2020, 12, 2760. [Google Scholar] [CrossRef]
  44. Frampton, W.J.; Dash, J.; Watmough, G.; Milton, E.J. Evaluating the Capabilities of Sentinel-2 for Quantitative Estimation of Biophysical Variables in Vegetation. ISPRS J. Photogramm. Remote Sens. 2013, 82, 83–92. [Google Scholar] [CrossRef] [Green Version]
  45. Thakur, S.; Mondal, I.; Ghosh, P.B.; Das, P.; De, T.K. A Review of the Application of Multispectral Remote Sensing in the Study of Mangrove Ecosystems with Special Emphasis on Image Processing Techniques. Spat. Inf. Res. 2020, 28, 39–51. [Google Scholar] [CrossRef]
  46. Immitzer, M.; Vuolo, F.; Atzberger, C. First Experience with Sentinel-2 Data for Crop and Tree Species Classifications in Central Europe. Remote Sens. 2016, 8, 166. [Google Scholar] [CrossRef]
  47. Van der Meer, F.D.; van der Werff, H.M.A.; van Ruitenbeek, F.J.A. Potential of ESA’s Sentinel-2 for Geological Applications. Remote Sens. Environ. 2014, 148, 124–133. [Google Scholar] [CrossRef]
  48. Mucheye, T.; Haro, S.; Papaspyrou, S.; Caballero, I. Water Quality and Water Hyacinth Monitoring with the Sentinel-2A/B Satellites in Lake Tana (Ethiopia). Remote Sens. 2022, 14, 4921. [Google Scholar] [CrossRef]
  49. Cai, J.; Jiao, C.; Mekonnen, M.; Legesse, S.A.; Ishikawa, K.; Wondie, A.; Sato, S. Water Hyacinth Infestation in Lake Tana, Ethiopia: A Review of Population Dynamics. Limnology 2023, 24, 51–60. [Google Scholar] [CrossRef]
  50. Bayable, G.; Cai, J.; Mekonnen, M.; Legesse, S.A.; Ishikawa, K.; Imamura, H.; Kuwahara, V.S. Detection of Water Hyacinth (Eichhornia crassipes) in Lake Tana, Ethiopia, Using Machine Learning Algorithms. Water 2023, 15, 880. [Google Scholar] [CrossRef]
  51. Potgieter, L.J.; Shrestha, N.; Cadotte, M.W. Prioritizing Sites for Terrestrial Invasive Alien Plant Management in Urban Ecosystems. Ecol. Solut. Evid. 2022, 3, e12160. [Google Scholar] [CrossRef]
  52. Tucker, A.J.; Chadderton, W.L.; Annis, G.; Davidson, A.D.; Hoffman, J.; Bossenbroek, J.; Hensler, S.; Hoff, M.; Jensen, E.; Kashian, D.; et al. A Framework for Aquatic Invasive Species Surveillance Site Selection and Prioritization in the Us Waters of the Laurentian Great Lakes. Manag. Biol. Invasions 2020, 11, 607–632. [Google Scholar] [CrossRef]
  53. Faraway, J.J. Generalized Linear Models. In International Encyclopedia of Education, 3rd ed.; Peterson, P., Baker, E., McGaw, B., Eds.; Elsevier: Oxford, UK, 2010; pp. 178–183. [Google Scholar] [CrossRef]
  54. Hadad, H.R.; Mufarrege, M.M.; Di Luca, G.A.D.; Maine, M.A. Salinity and PH Effects on Floating and Emergent Macrophytes in a Constructed Wetland. Water Sci. Technol. 2018, 2017, 270–275. [Google Scholar] [CrossRef] [Green Version]
  55. Ade, C.; Khanna, S.; Lay, M.; Ustin, S.L.; Hestir, E.L. Genus-Level Mapping of Invasive Floating Aquatic Vegetation Using Sentinel-2 Satellite Remote Sensing. Remote Sens. 2022, 14, 3013. [Google Scholar] [CrossRef]
Figure 1. General workflow proposed for E. crassipes mapping with the methodology applied divided into sequential processing steps.
Remotesensing 15 03248 g001
Figure 2. Location of the river system targeted in this study and the location of the study area location (A). The figure also shows a UAV orthophoto map of an invaded space that supports the delineation of pixels representative of E. crassipes reflectance (B).
Remotesensing 15 03248 g002
Figure 3. Illustration of E. crassipes invasion process. (a) establishment in a new area; (b) plant reproduction creates dense mats on the surface, blocking light and decreasing dissolved oxygen; (c) primary producers are affected, as well as trophic chains, promoting lifeless spaces.
Remotesensing 15 03248 g003
Figure 4. E. crassipes spectral profile and average of its reflectance evolution through time (at orange) compared to riparian woody trees (green) and water (blue) along the multispectral bands of Sentinel-2.
Remotesensing 15 03248 g004
Figure 5. Spatiotemporal change over a section of the study area classified according to different levels of spectral similarity for spaces classified as invaded (the base map in the background also records the propensity of this space to be invaded).
Remotesensing 15 03248 g005
Figure 6. Temporal change in the number of pixels classified as invaded by the ensemble classifier by spectral similarity class. The “very-low” class represents the relatively lowest level of spectral similarity in relation to training areas, whereas “very-high” comprises the highest level of spectral similarity.
Remotesensing 15 03248 g006
Table 1. Results of the evaluation scores for the test set TS2 by the classification algorithm. Values show the average and standard deviation for each performance measure: TSS—True Skill Statistic; ROC—Area Under the Receiver Operating Curve; KAPPA—Cohen’s Kappa.
Classification AlgorithmTSSROCKAPPA
AverageStandard DeviationAverageStandard DeviationAverageStandard Deviation
RF0.7770.1460.6970.1350.8910.091
GLM0.8460.1210.7470.1320.9560.041
FDA0.6740.2240.6390.1510.8850.116
ANN0.7870.1420.6980.1280.9130.081
MAX.20.8310.0920.7340.1380.9570.032
CTA0.6280.1570.5710.1390.8300.079
Table 2. Performance evaluation scores for the final ensemble classifier combining biomod2 algorithms. TSS—True Skill Statistic; ROC—Area Under the Receiver Operating Curve; KAPPA—Cohen’s Kappa.
Classification
Algorithm
TestingCutoffSensitivitySpecificity
KAPPA0.82651878.9499.49
TSS0.93227997.3695.85
ROC0.99228397.3696.23
Disclaimer/Publisher’s Note: The statements, opinions and data contained in all publications are solely those of the individual author(s) and contributor(s) and not of MDPI and/or the editor(s). MDPI and/or the editor(s) disclaim responsibility for any injury to people or property resulting from any ideas, methods, instructions or products referred to in the content.

