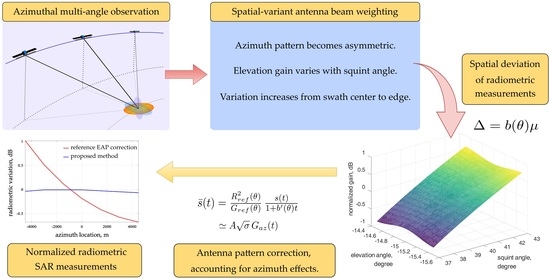
1. Introduction
Synthetic aperture radar (SAR) provides high-resolution observation under most weather conditions during day and night. Conventionally, spaceborne SARs observe in cross-track directions. In recent years, based on the continuously improved beam-steering capability, a novel azimuthal multi-angle observation (AMAO) spaceborne SAR technique was put forward in [
1] and relevant researches have been conducted in [
2,
3,
4,
5,
6,
7,
8]. With highly flexible antenna beams, AMAO spaceborne SAR can achieve efficient observation of multi-azimuth information, such as the target scattering information, geometric information, and motion information.
SAR images (sequences) require accurate calibration to achieve comparability and quantitative application. The antenna pattern is a primary source of errors in SAR radiometric calibration. From the point of view of SAR radiometric calibration in [
9], the two antenna patterns play separate roles: the elevation antenna pattern (EAP) determines the spatial radiation gain over the swath, and the azimuth antenna pattern (AAP) is generally negligible except for in ScanSAR correction. Current spaceborne SARs have achieved high radiometric accuracy with the EAP correction. For example, the radiometric accuracy of PALSAR on ALOS is 0.22 dB (1
) from the Amazon forest data [
9], and that of TerraSAR-X is better than 0.3 dB (1
) during the commissioning phase [
10]. However, for the novel AMAO SAR, the antenna beam is steered to a squint angle of up to several tens of degrees [
7,
8] and rotated to extend the target exposure time for high resolution. In an on-ground point target view, the antenna pattern becomes broadened, nonideal, and varies in space. Common correction methods do not apply to the spatial-variant antenna pattern, so radiometric variations appear in the image. Therefore, it is necessary to analyze the antenna pattern effects in the AMAO SAR imaging context, and then propose the corresponding innovative correction method to deal with the radiometric variations in AMAO SAR images.
This paper firstly gives the geometric properties of AMAO SAR imaging, establishes an antenna pattern model accounting for squint beam-steering, and then analyzes the antenna pattern characteristics in the AMAO SAR imaging context. Subsequently, a practical and analytical model of the antenna pattern effect on SAR image intensities is presented by introducing two factors derived from the two-dimensional (2D) antenna pattern. After that, the improved method of the antenna pattern correction is given to normalize the 2D radiometric effects. Finally, experiments are conducted to quantify the antenna pattern effects and verify the precision of the proposed correction method.
The rest of this paper is organized as follows: the antenna pattern characteristics are presented in
Section 2. The antenna pattern effects in images are investigated in
Section 3, and the improved correction method is given in
Section 4. Experiments are performed in
Section 5. The proposed approach and the results are discussed in
Section 6, and the conclusions are summarized in
Section 7.
2. Antenna Pattern Characteristics
2.1. Geometric Properties
The antenna pattern represents a 2D sensitivity in space. In this section, the coordinates of the antenna pattern are established and linked to the SAR observation coordinates. Then, the geometric properties in the three-dimensional antenna coordinates are analyzed, including azimuth, elevation, and range distance.
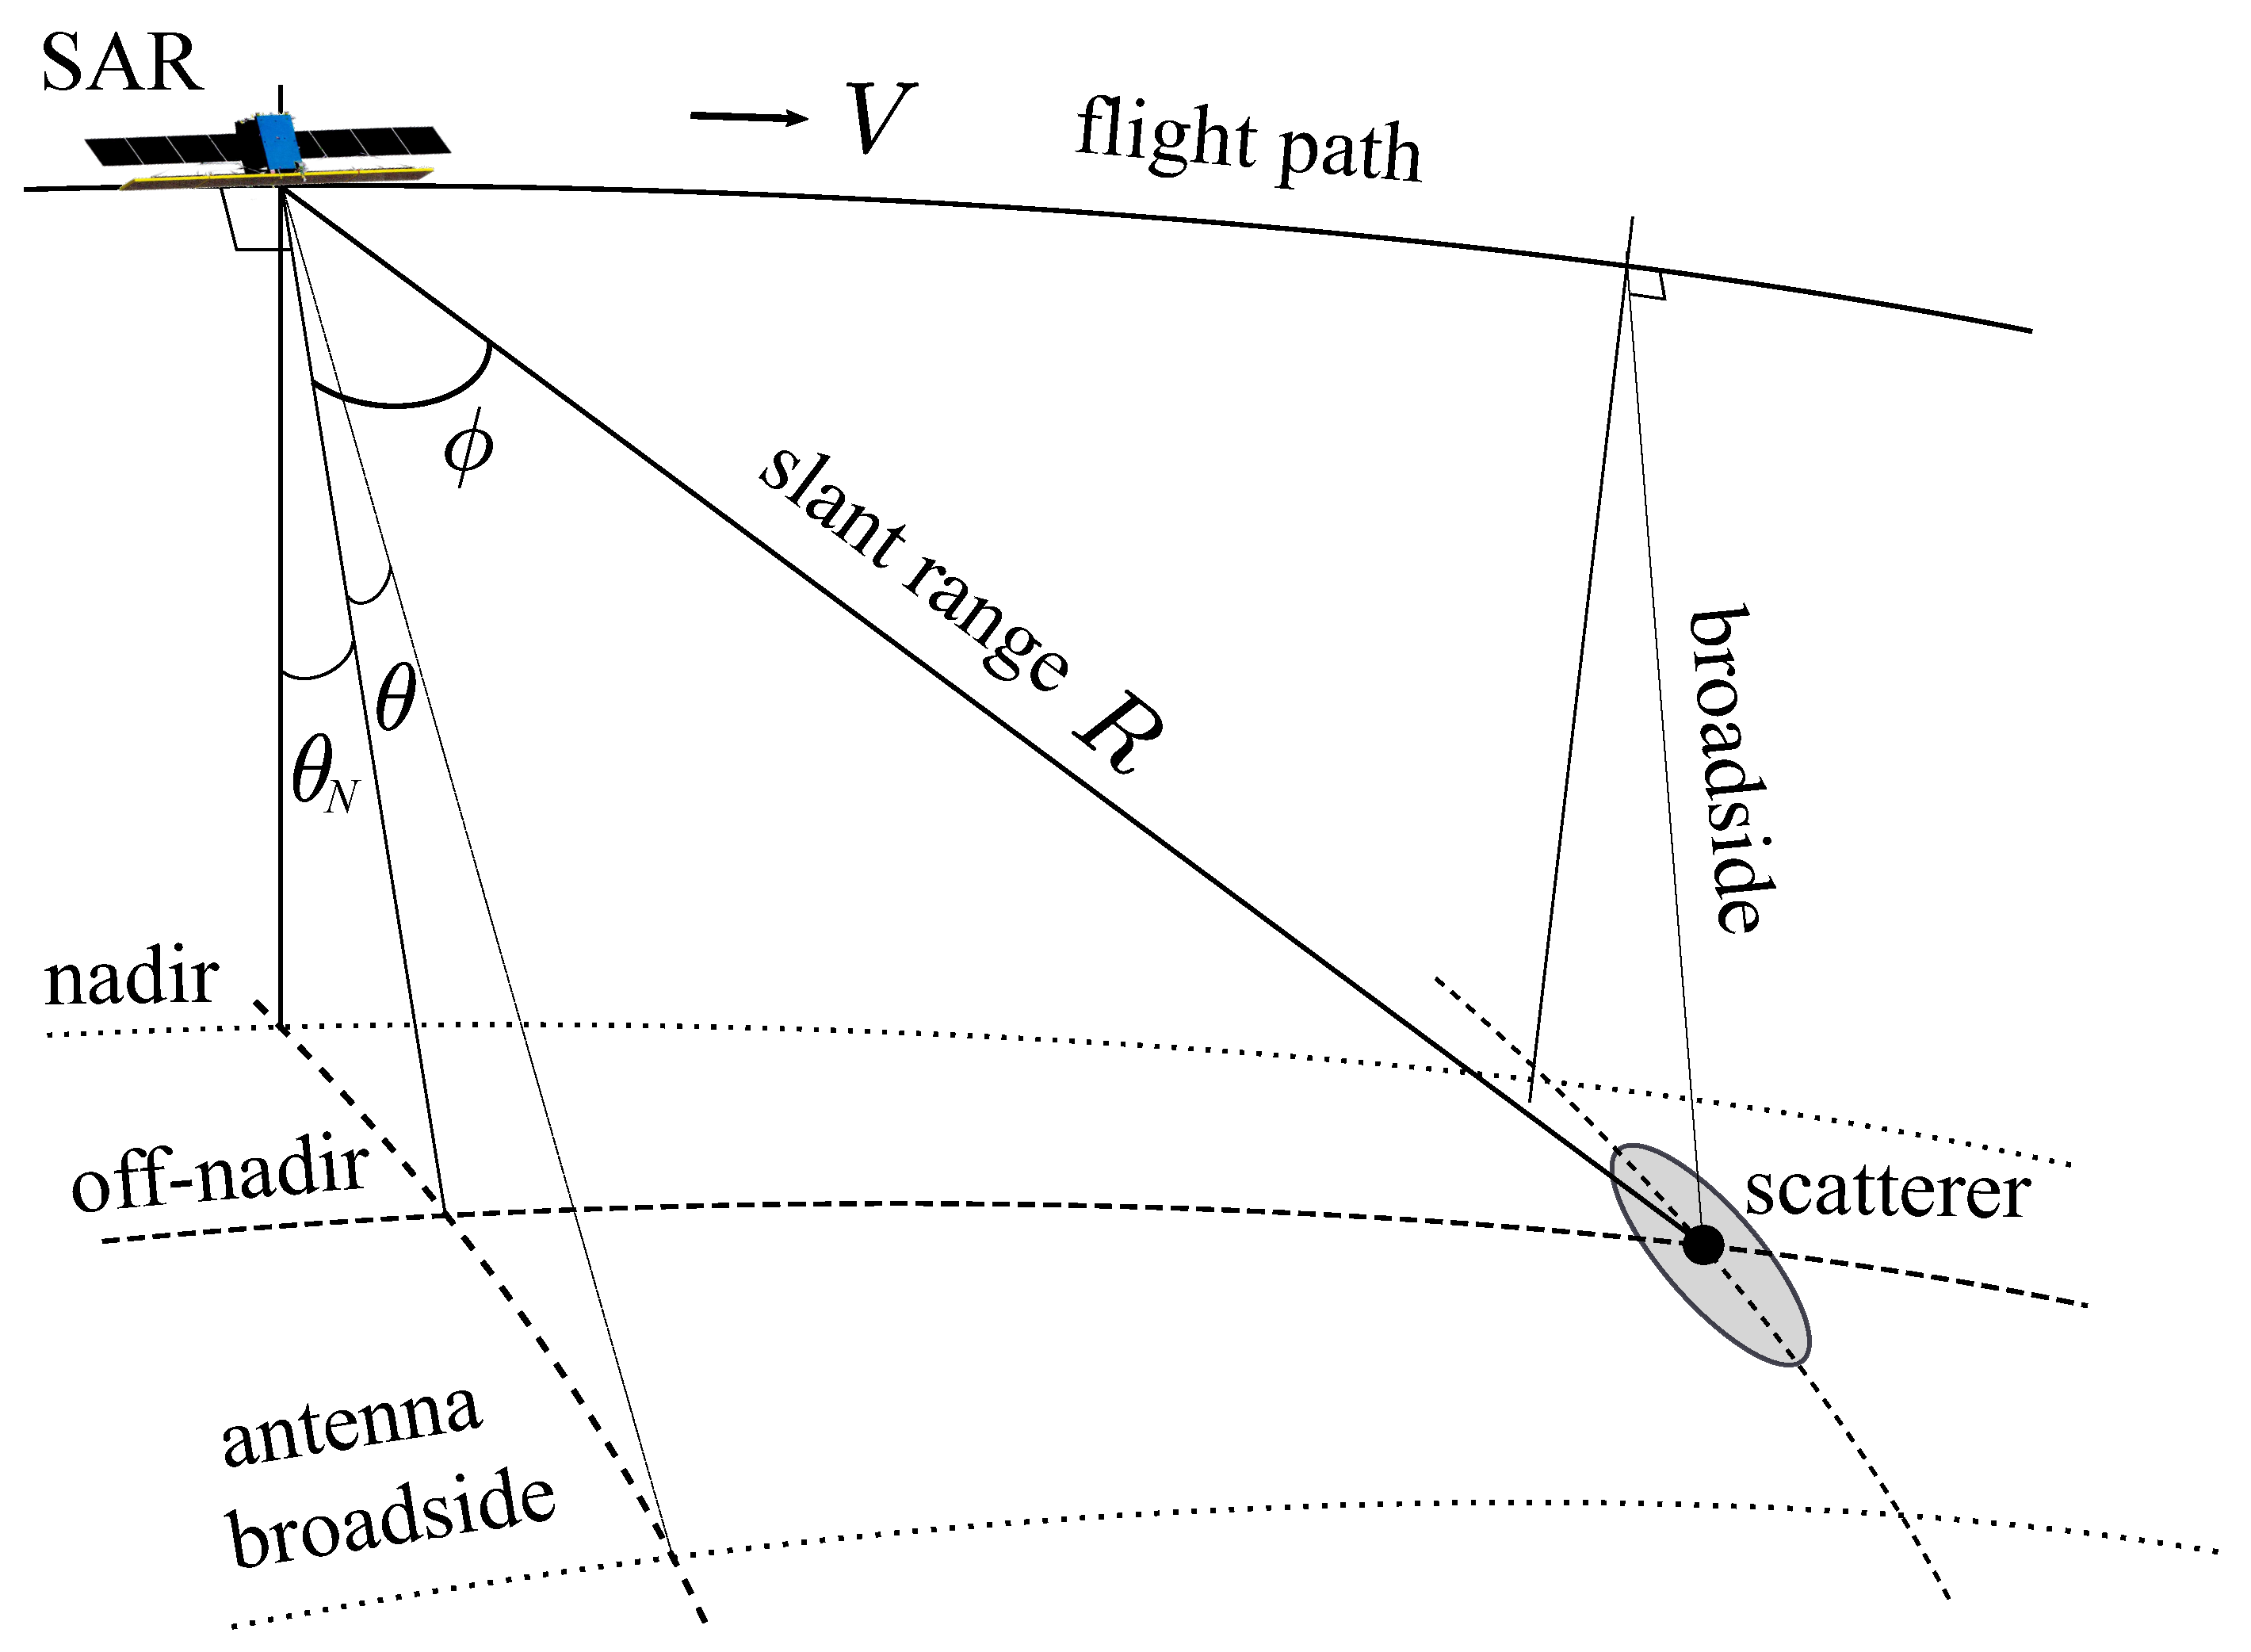
The imaging geometry of AMAO spaceborne SAR is shown in
Figure 1. Vector
V is the relative velocity of the radar to the scatterer, including the effect of the Earth’s rotation, so that it is perpendicular to the zero Doppler plane. The slant-range vector,
R, forms the slant-range plane with vector
V. The observation direction from radar to scatterer is measured in the two planes—the off-nadir angle
in the zero-Doppler plane, and the squint angle
in the slant-range plane (i.e., the angle between the slant-range vector and the zero Doppler plane).
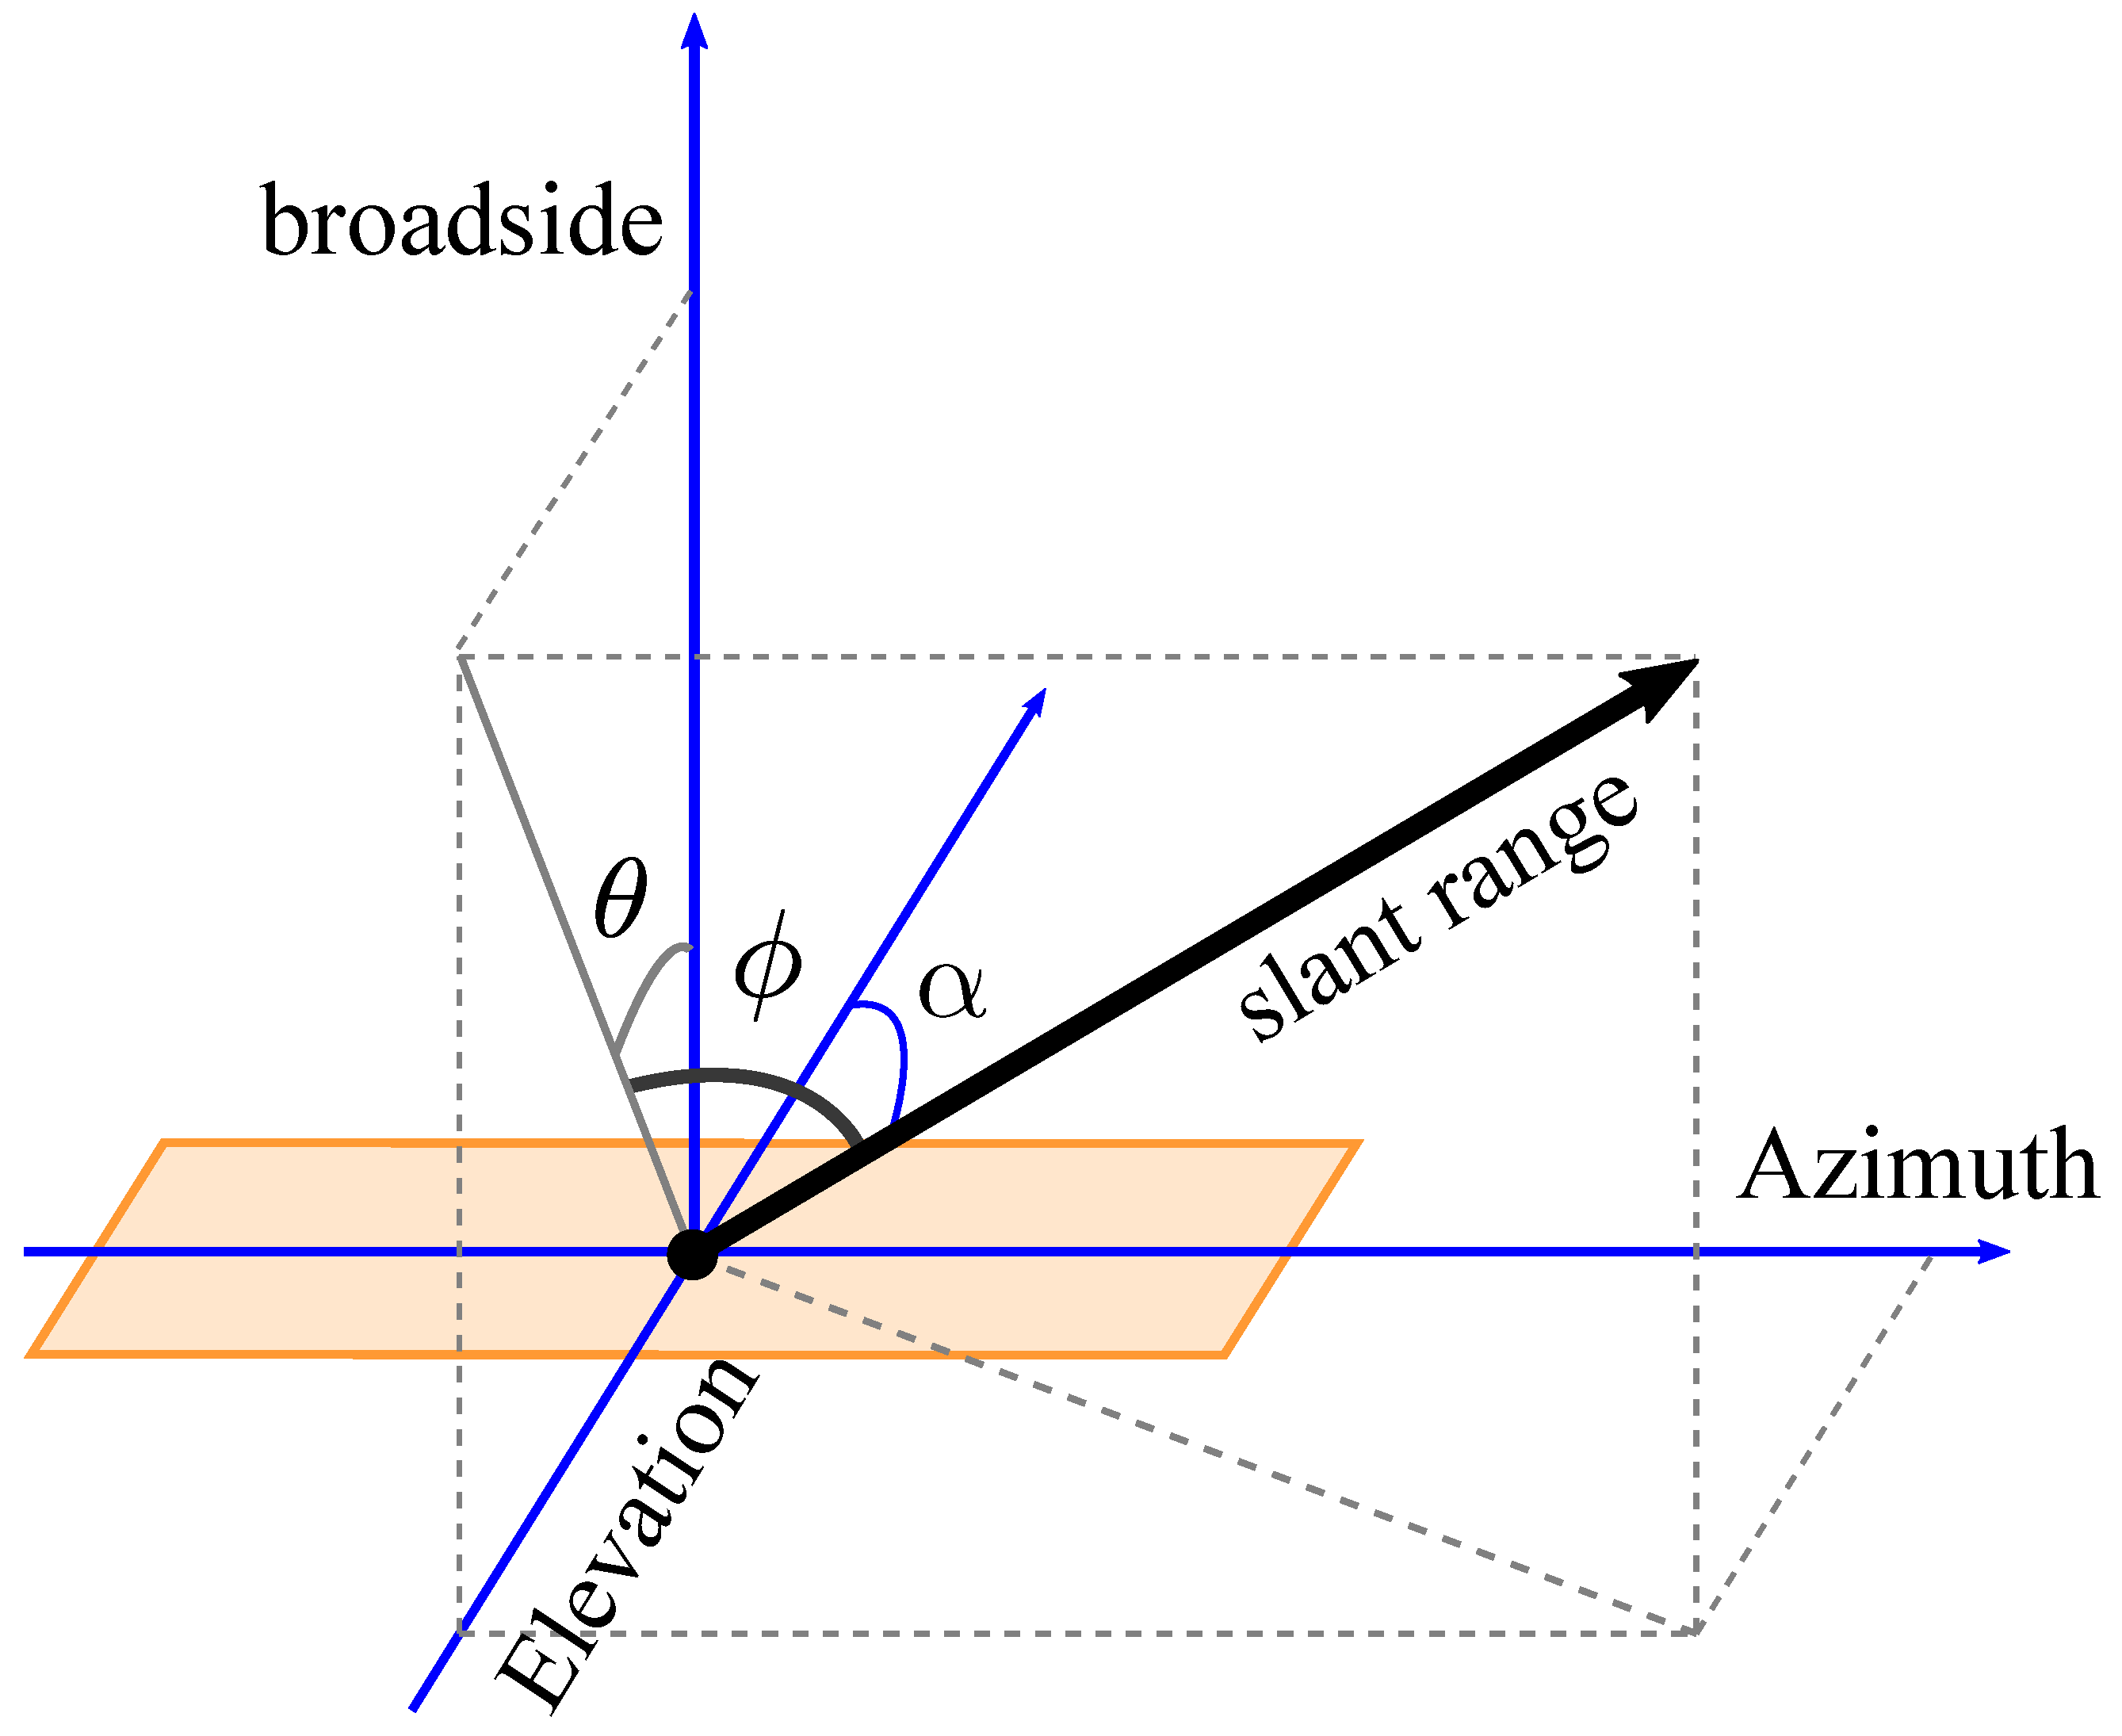
Figure 2 shows the antenna pattern coordinates. The azimuth and elevation axes are in the antenna plane, perpendicular to each other. The broadside axis is normal to the antenna plane. For convenience and simplicity, the azimuth axis is assumed to be parallel to the relative velocity vector so that convenient relations link the antenna pattern coordinates and the SAR observation coordinates. Then, the elevation plane formed by the elevation axis and the broadside axis is the zero-Doppler plane in observation geometry, and the azimuth plane formed by the azimuth axis and the slant-range vector is the slant-range plane. Consequently, the line-of-sight direction
in antenna coordinates is related to
in observation geometry, by the relation
, where
is the off-nadir angle of antenna broadside in observation geometry.
The antenna-scatterer relative motion is in the slant-range plane, i.e., the azimuth plane. Therefore, the instantaneous squint angle is a free variable for a given on-ground point target, while the elevation angle is a constant. The synthetic angle,
, is the change in the squint angle of a scatterer from entering to exiting the antenna footprint, related to the azimuth resolution
by
where the subscript
c signifies a target’s beam center crossing. In the high-resolution case, the synthetic angle can be much larger than the width of the physical beam due to the beam rotation. For example, 0.25 m X-band resolution (the same as TerraSAR-X NG [
11]) needs a synthetic angle of 3.44 degrees. The larger synthetic angle implies the higher variations involved.
The antenna pattern is often defined in the (
u,
v) coordinates
where
is the elevation off-axis angle between the slant-range vector and the elevation axis. From Equation (
2), both
u and
v vary with the free variable
, indicating a 2D variation of the line of sight in antenna pattern coordinates. The variations in (
u,
v) coordinates are given by
From Equation (
3), the variation in the
v coordinate is related to three parameters—the azimuth resolution, the elevation angle, and the squint angle. It is low in the low-squint case and emerges in the high-resolution, high-squint case.
The slant-range distance changes with the azimuth time, given by
where the free variable
t represents the azimuth time. At the beam center crossing time
, the slant-range distance is
. From the point of view of radiometric effect analysis, the azimuth variation of the slant-range distance can be approximated by a linear model, written as
2.2. Antenna Pattern Model
Based on the antenna coordinates established above, this section presents a theoretical model of the antenna pattern, which explicitly represents the 2D angular dependence of the elevation pattern of a squint beam and the effect on azimuth pattern due to beam rotation.
Accurate antenna modeling requires detailed on-ground measurements, onboard characteristic monitoring, and external verification. For convenience, the theoretical model of the planar antenna pattern is used for analytical analysis, usually written as [
12]
where
is the antenna gain,
is the wavelength of the center frequency,
is the boresight direction (subscript
B denotes boresight), and
and
are the antenna sizes in azimuth and elevation directions, respectively. There are three distinctive factors in Equation (
6). From left to right, the first accounts for the antenna gain,
; the second accounts for the EAP, denoted as
; and the last accounts for the azimuth antenna pattern (AAP), denoted as
.
After variable substitution with Equation (
2), the antenna pattern is written approximately as
The approximate relation of Equation (
7) is based on the fact that for spaceborne SAR antennas, the azimuth width of the physical beam is very narrow (i.e.,
is very close to
), so two approximate relations are found:
and
. In Equation (
7), the azimuth angle,
, is a free variable. The elevation angle,
, is a constant for a given point target and a variable for different targets across the swath. The antenna beam should always point to the swath centerline, so
is a constant, while
can be a variable in the case of beam rotation.
AMAO SAR antenna beam is often steered to a rotation center to achieve high resolution and/or wide swath. A factor is defined to describe the beam azimuth rotation:
It can be deduced that the synthetic angle is
times the width
of the physical beam. With Equation (
1) and the expression of physical beamwidth,
, the factor
can also be related to azimuth resolution by
Moreover, the beam rotation factor is also related to the imaging mode. For instance, one stands for the Stripmap, greater than one for the sliding Spotlight, and between one and zero stands for the TopSAR. When
is large enough, the AAP of a rotating beam is approximately expressed by
Compared with the AAP factor in Equation (
7), which has two variables for a given point target in the case of beam rotation, Equation (
10) has the advantage of only one free variable
in it. In this way, one does not need to know how the antenna beam is steered, but only needs to know the azimuth resolution to derive the antenna pattern.
2.3. Antenna Pattern Characteristics Analysis
According to the models given above, this section analyzes the antenna pattern characteristics of a squint steering beam. Equations (
7) and (
10) indicate three characteristics. First, the azimuth beamwidth is
times the width of the physical beam, due to the beam steering; second, the AAP becomes asymmetric, especially in the high squint case; last, the EAP varies two-dimensionally, not only in elevation but also in azimuth.
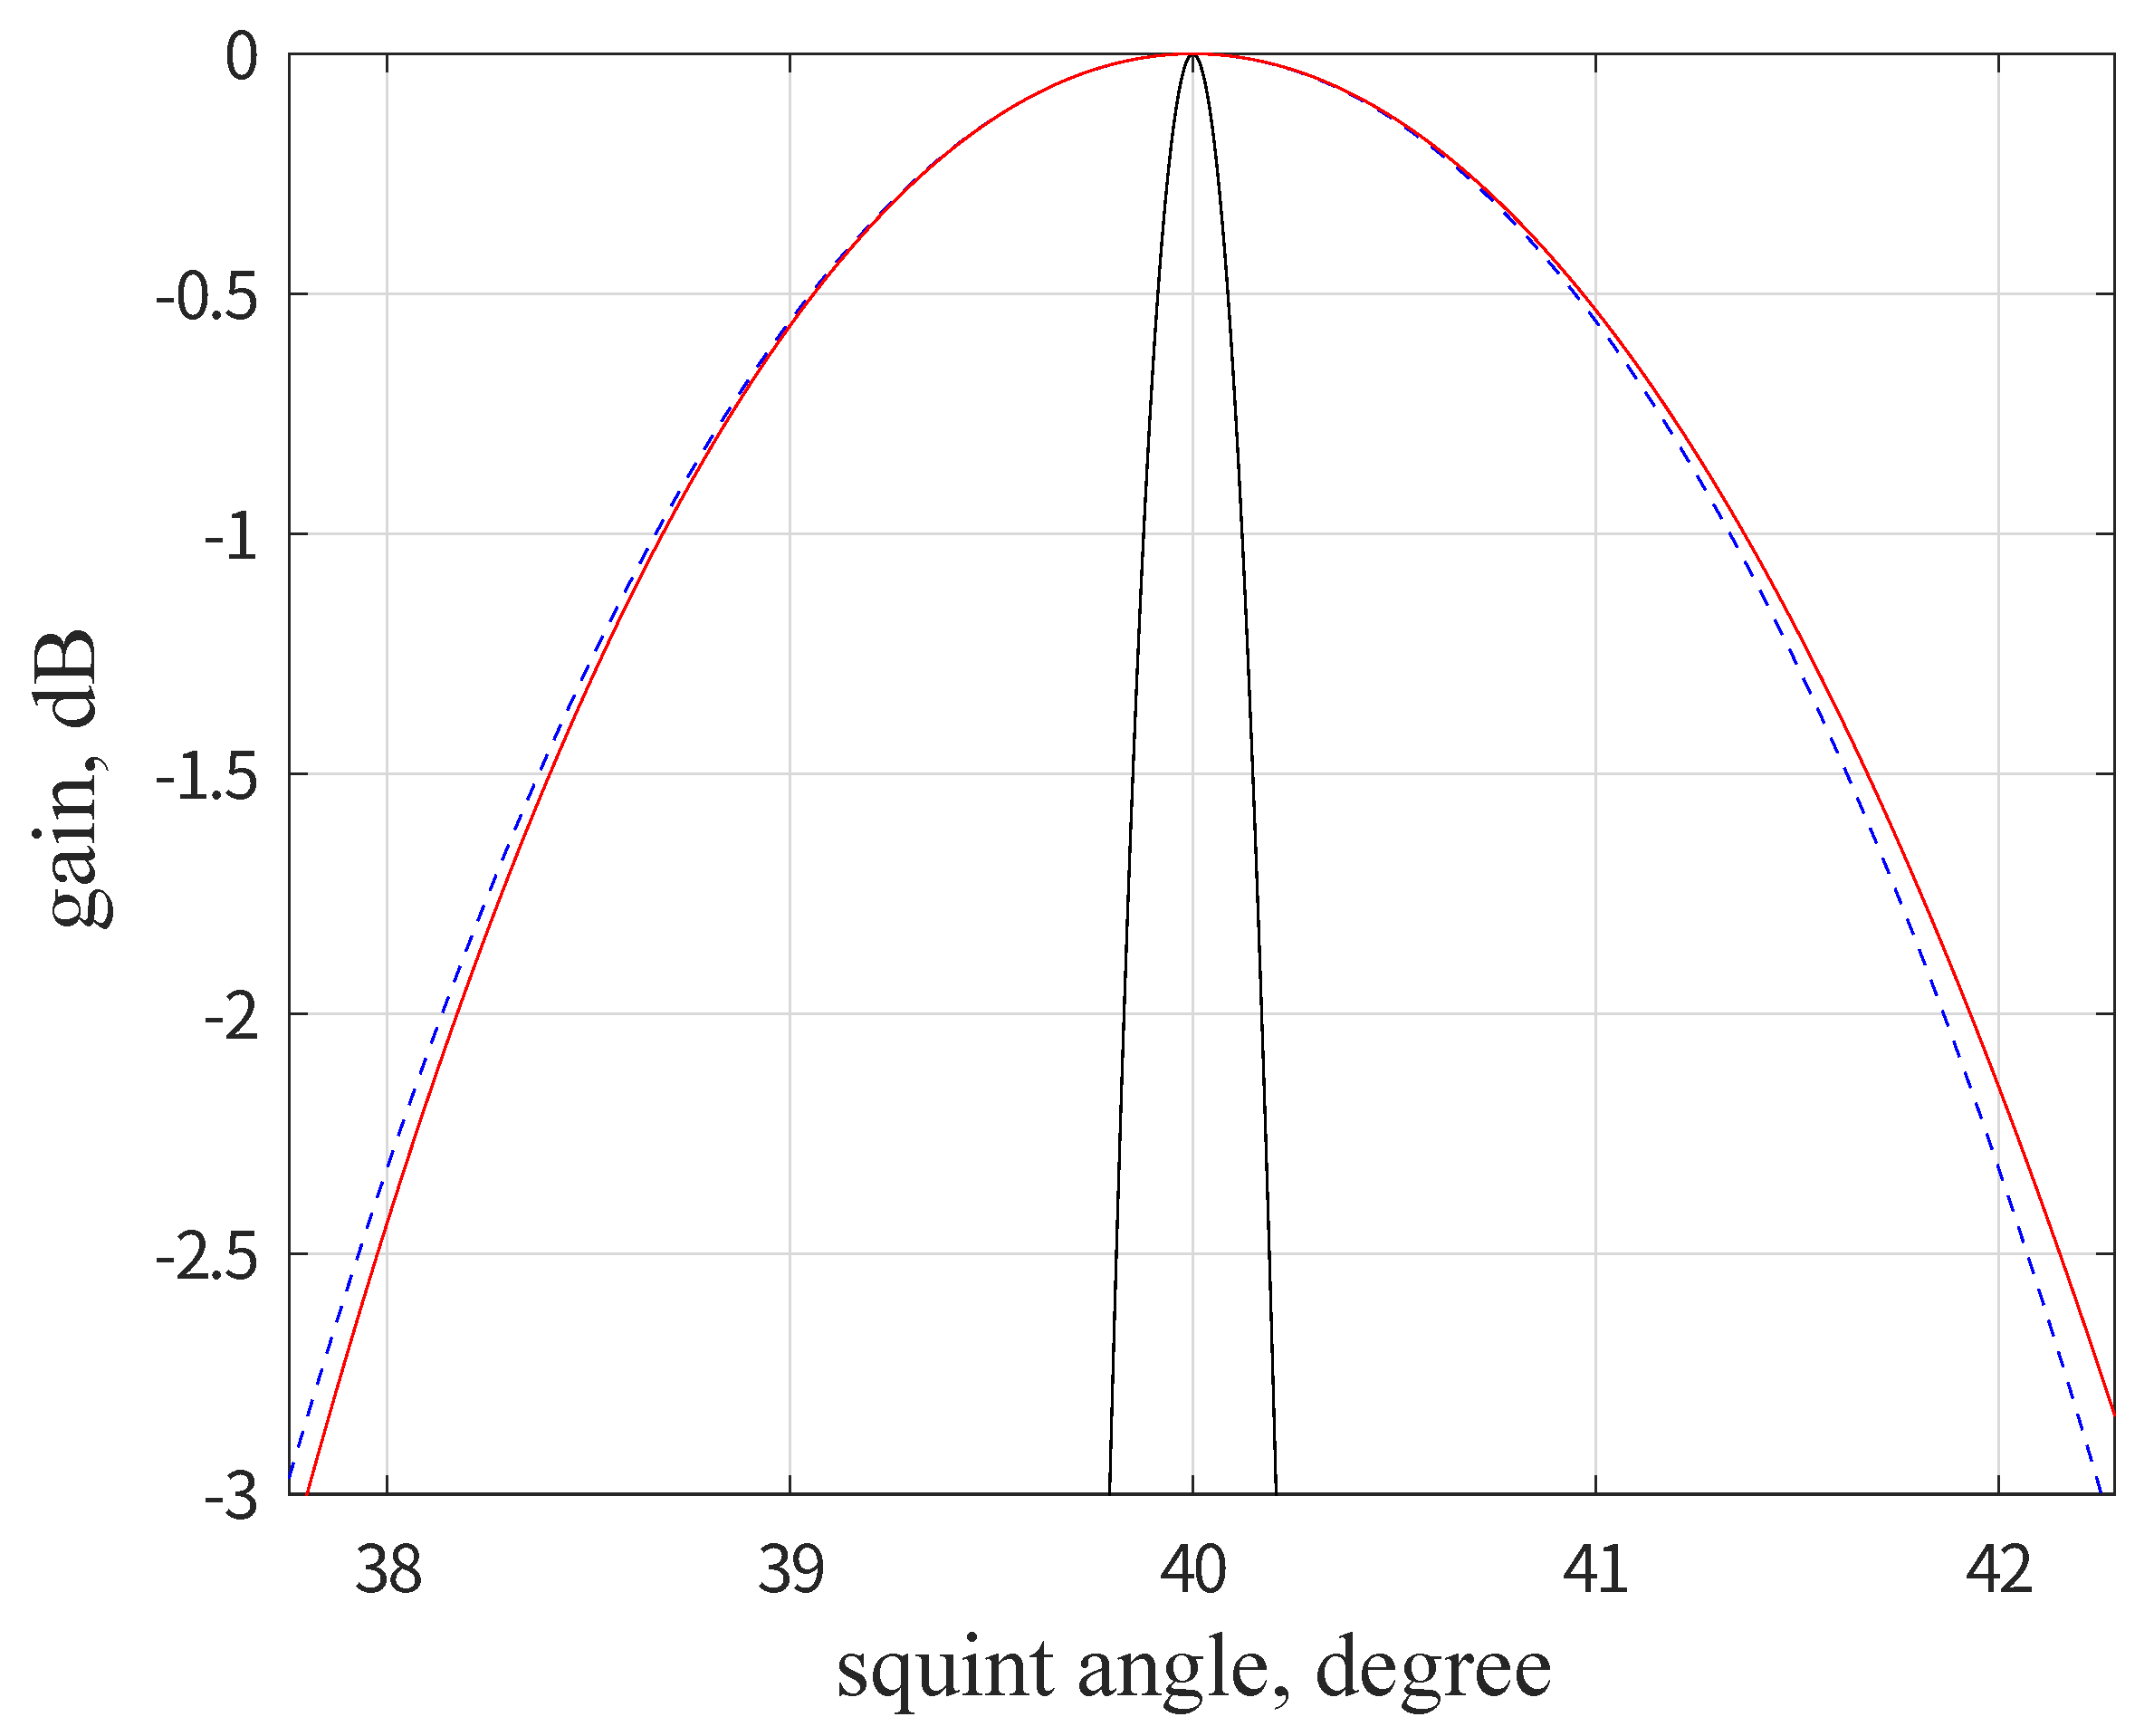
The AAP from Equation (
10) is almost symmetric in the low-squint case. However, as the squint angle increases, the AAP shape becomes asymmetric.
Figure 3 shows the AAP of a squint steering beam. The width of the physical beam is narrow. As the antenna beam rotates, it is broadened in a ground point target view, scaled approximately by factor
. Meanwhile, the pattern shape becomes asymmetric, so its centroid shifts from the beam center.
The following focuses on the azimuth dependence of EAP. The EAP from Equation (
7) is
It varies mainly in elevation and slightly in azimuth. When SAR observes broadside,
, the azimuth dependence of EAP is negligible. At the swath centerline,
results in
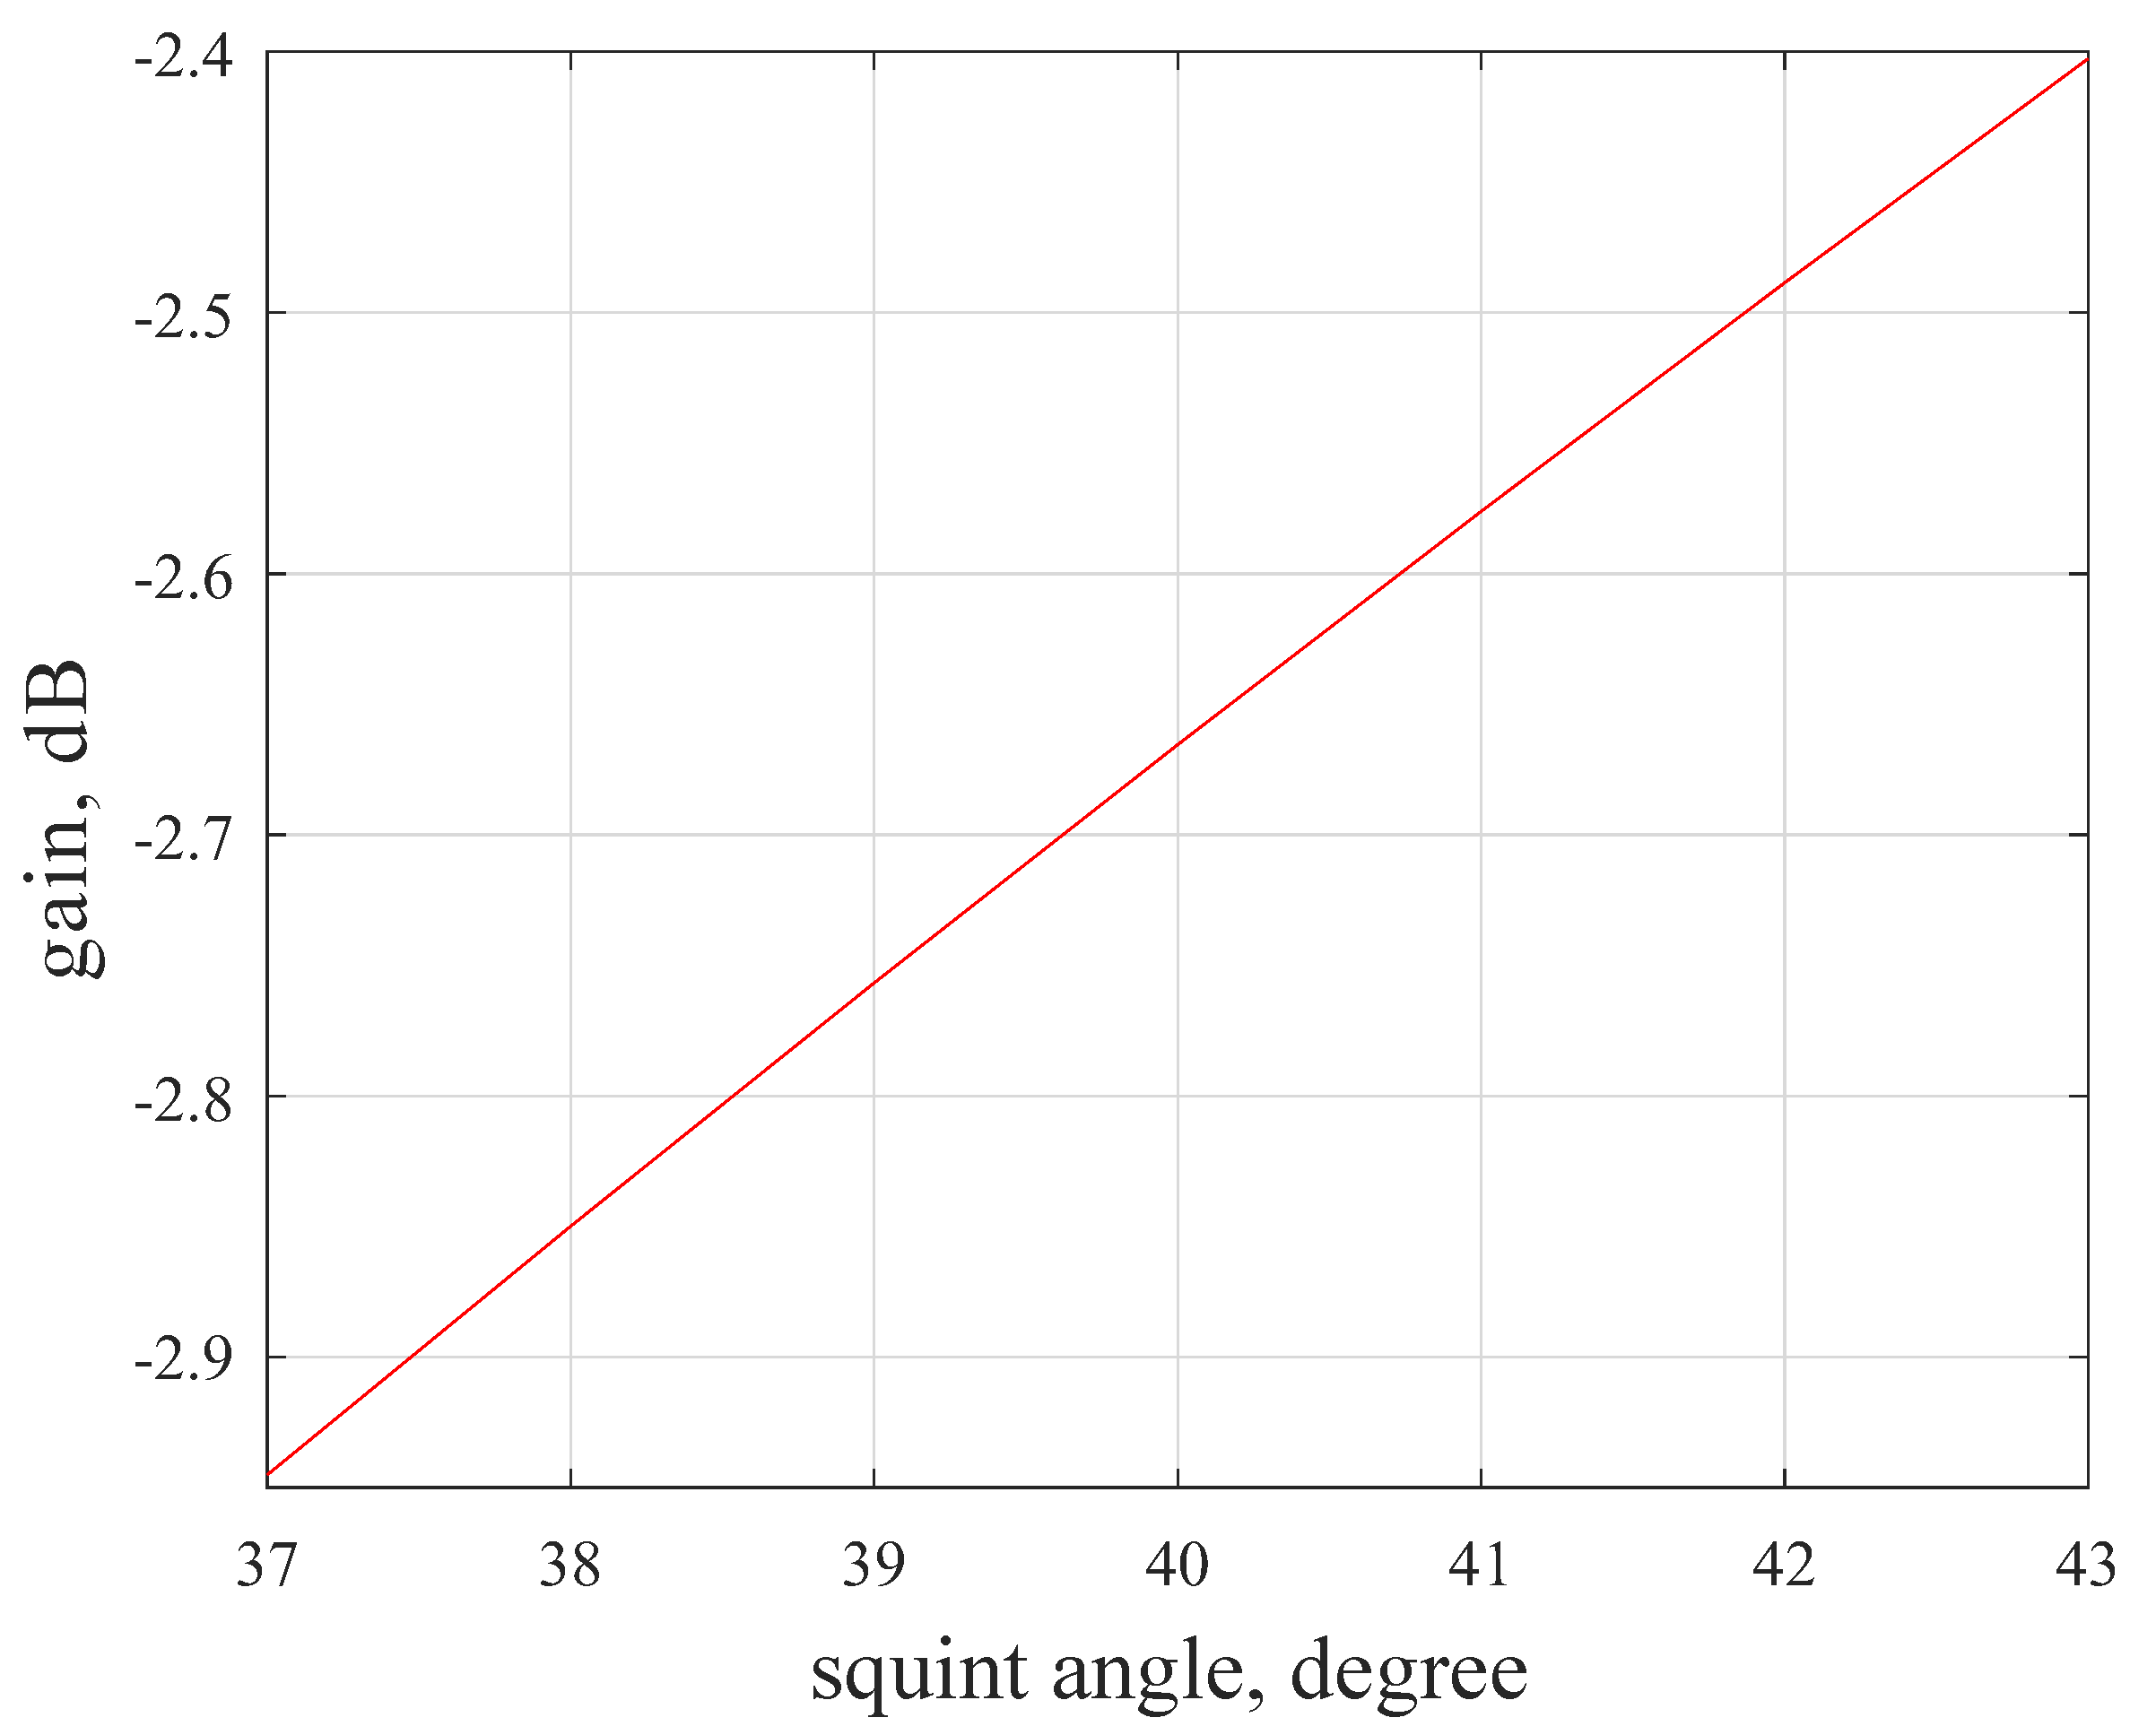
, i.e., independent of the squint angle. However, as the elevation angle deviates from boresight, a squint dependence arises in the EAP and increases to the maximum at the swath edge.
Figure 4 shows the azimuth variation of the EAP at the swath edge. It is approximately a linear model, so a convenient expression is
3. Antenna Pattern Effects in Images
This section establishes a practical analytical model of the antenna pattern effect on SAR image intensities. The model is succinctly represented by two factors derived from the 2D antenna pattern, a linear coefficient of EAP variation with squint angle and the centroid shift of the azimuth signal.
The radiometric SAR measurement is based on the SAR radar equation [
13], which relates the image intensity to target backscattering characteristics and the SAR system parameters. Conventionally, the elevation pattern is included in the SAR radar equation, and the azimuth pattern is not. This is problematic for AMAO SAR because it does not account for the squint angle dependence of the elevation pattern and the AAP nonideality. Moreover, future high-resolution AMAO spaceborne SARs have long synthetic apertures and strong beam-steering capabilities with squint angle up to tens of degrees [
7,
8], thus involving higher variations.
For a given point target, the received signal magnitude is given by
where
A is a magnitude coefficient that contains parameters considered to be constant in the radar equation, and
is the target RCS. The azimuth variation of target RCS within the synthetic aperture is neglected. The integrated energy of the point target signal is then given by
where
and
are the start and end times of the SAR acquisition.
Conventionally, the effects of EAP and the slant range are normalized using a correction function derived at the reference squint angle (usually the squint angle of the beam center when crossing the scene center). After that, the signal energy becomes
where the subscript
signifies the reference.
Two facts are apparent from Equations (
5) and (
12): the azimuth variations in EAP and slant range are gradual and almost linear over the narrow synthetic angle. On these bases, the first-order approximation is used
where
is a linear coefficient that depends on the elevation angle, which summarizes the linear variations in EAP and slant range with the squint angle. Using Equation (
16), a convenient expression of signal energy can be further deduced from Equation (
15)
For an accurately calibrated AMAO SAR image sequence, any variation in the overall system gain should be compensated, i.e., the system gain should equal one. From Equation (
17), despite the normalization using the correction function derived at the reference squint angle (see Equation (
15)), there are still radiometric variations in AMAO images, given by
where, for convenience,
represents the shift of the signal centroid from the reference point. At the reference squint angle, Equation (
19) becomes
where
T is the target exposure time. In this case, the integration interval is symmetric about zero, so the integral of linear modulated AAP is mostly canceled out, and a centroid offset arises from AAP asymmetry.
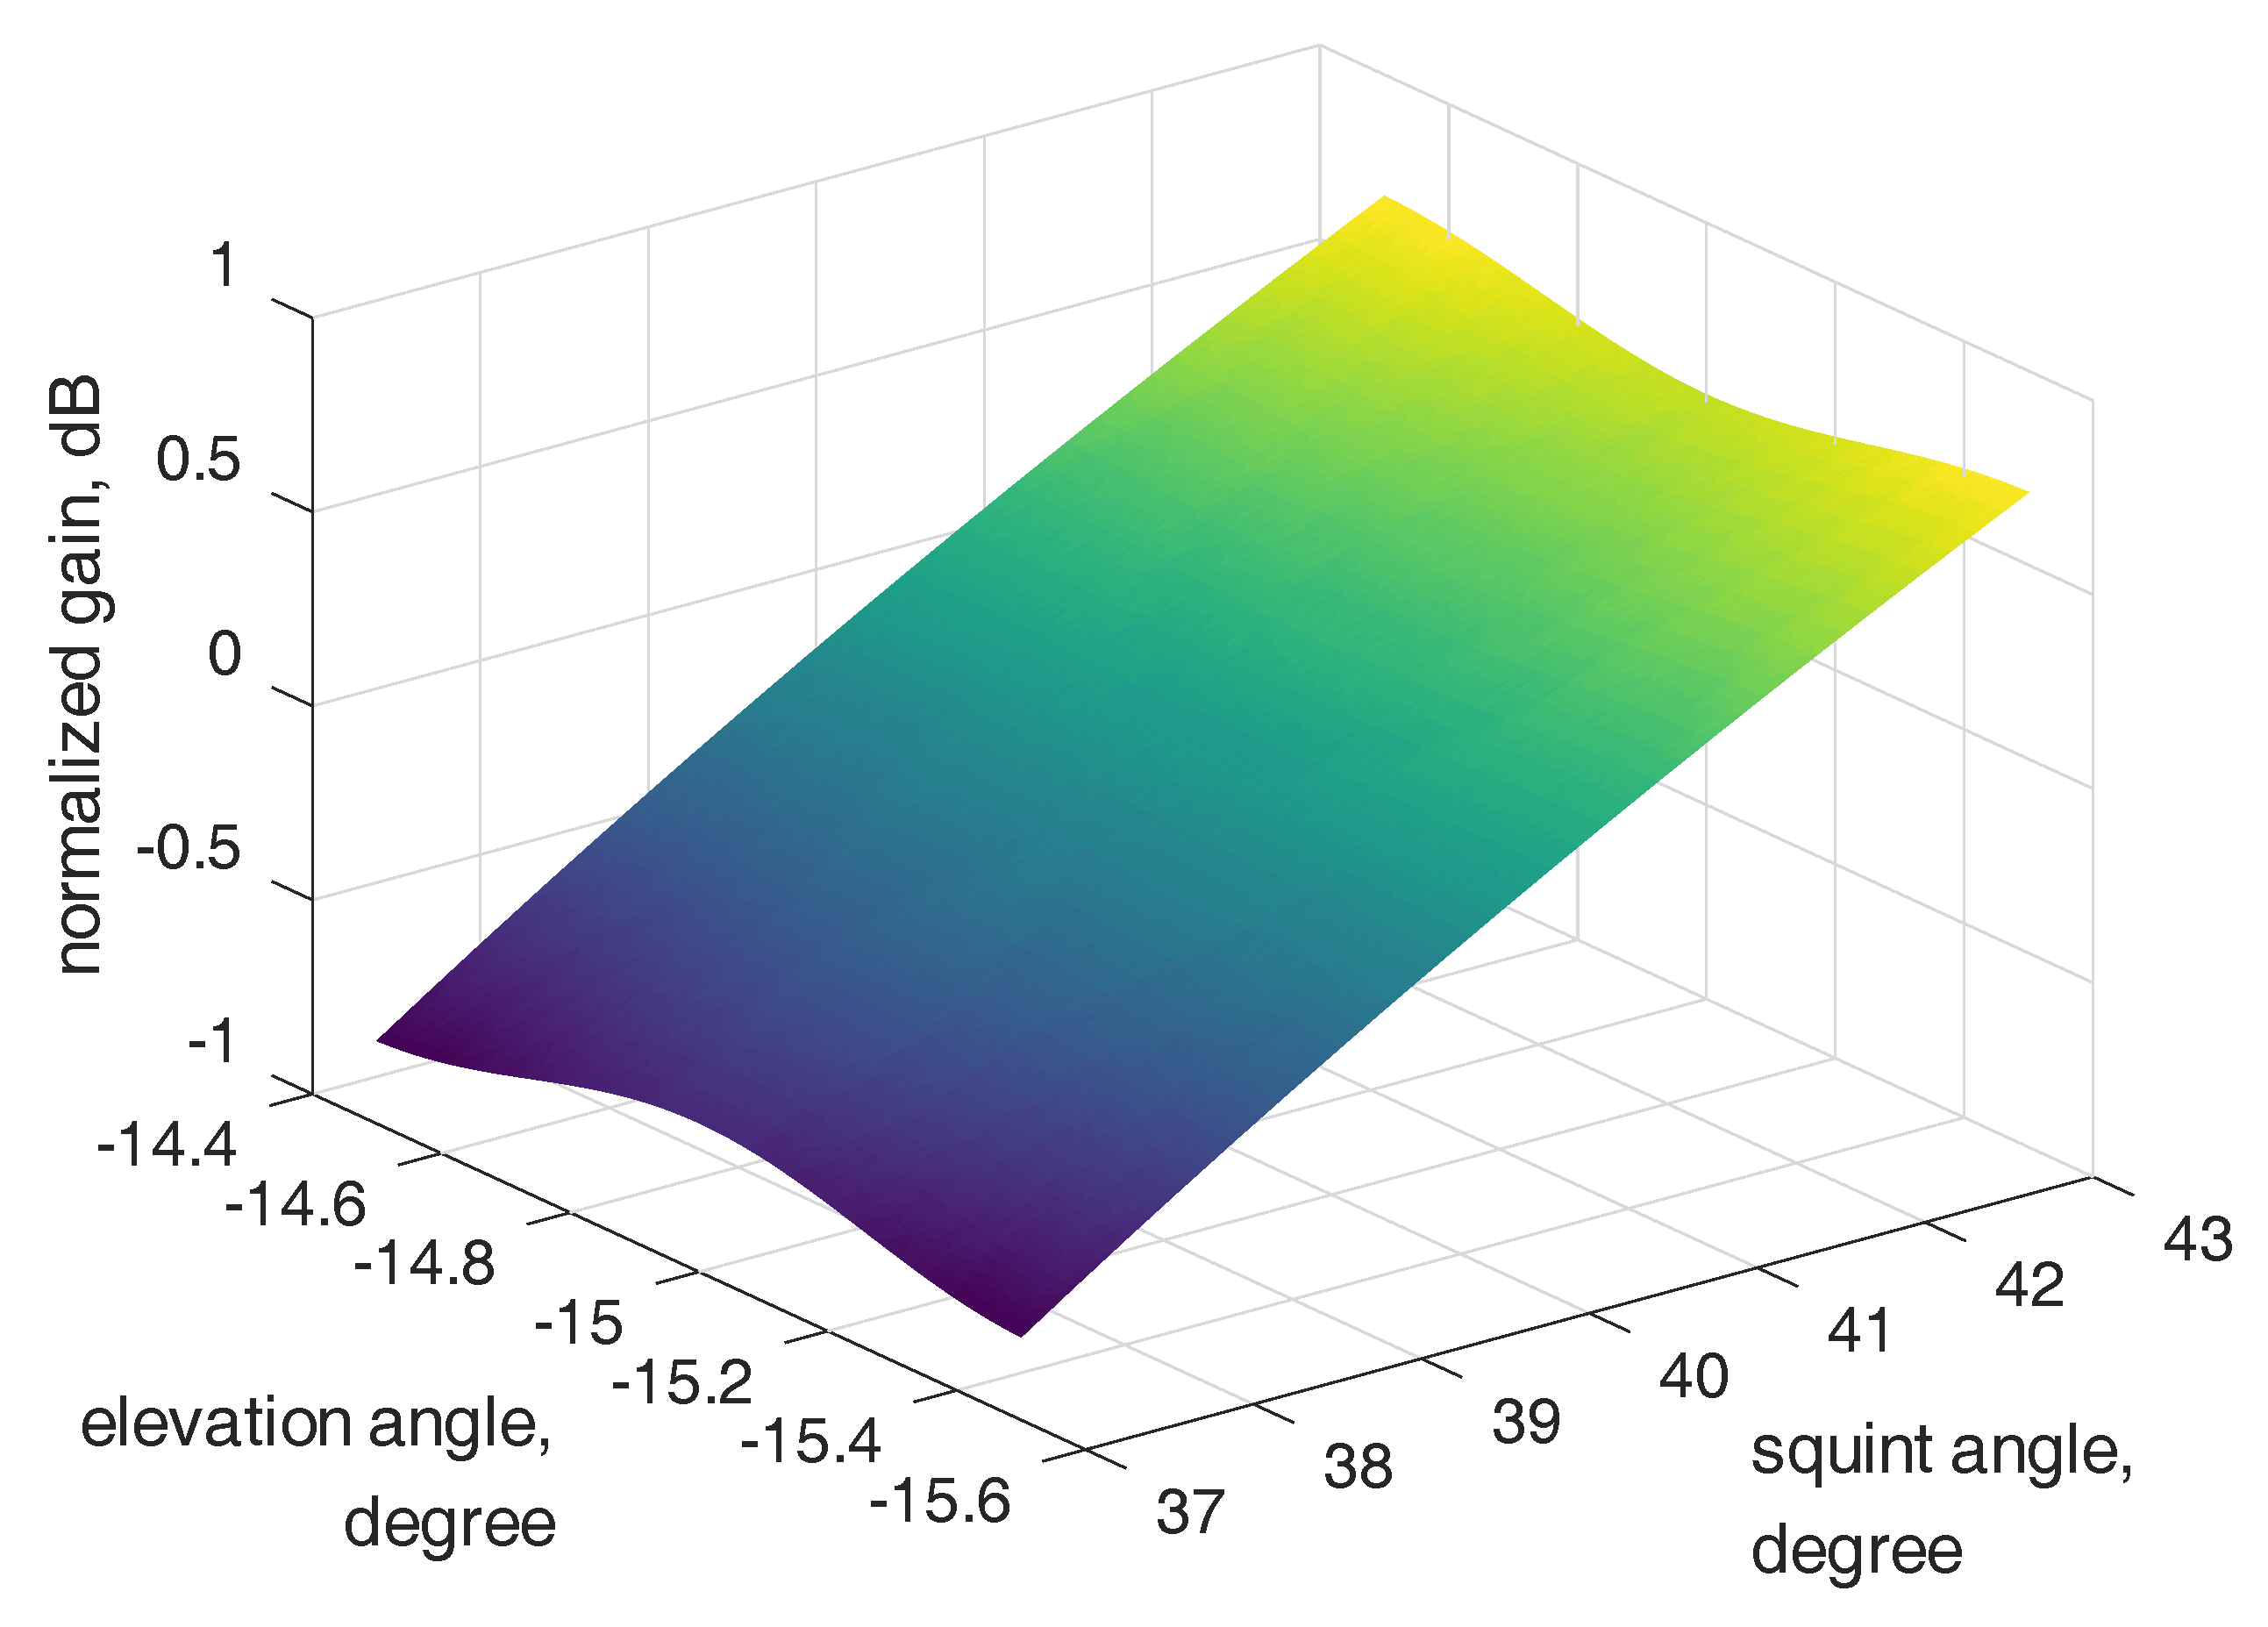
At this point, a convenient relation is proposed to analytically analyze the antenna pattern effect on radiometric intensities in AMAO SAR images. It explicitly contains two factors: one is an elevation-dependent factor derived from the EAP, the other is an azimuth shift of the signal centroid from the reference point. These two independent factors lead to 2D radiometric variations in AMAO SAR images.
Figure 5 shows the 2D effect of the antenna pattern in the image. The maximum variation occurs at the swath edge along the azimuth, and the minimum appears near the reference squint angle.
4. Correction Method
In this section, the method of the antenna pattern correction is improved to normalize the 2D radiometric variation in AMAO SAR images. The proposed method accounts for the insensitivity to errors in antenna patterns.
The antenna pattern has a 2D effect on the radiometric variation in AMAO SAR images. A direct approach to radiometric normalization is a numerical evaluation of the integrated energy for each resolution unit or coarser grid, taking into account the full 2D antenna pattern. From Equation (
14), the relative correction factor of each given resolution cell can be obtained by integration
where
i and
j are the index variables in azimuth and range, respectively. This approach requires integration operations for each cell, leading to high computational costs. To improve efficiency, according to Equation (
18), the SAR image can be corrected first using the reference antenna pattern, followed by additional corrections for the residual radiometric variation. From Equations (
18) and (
20), the additional correction factor can be obtained by
where
is the azimuth size of the cell. Since the normalization is applied to image intensities after image formation, it has no effect on the nonideal signal weighting induced by the 2D antenna pattern.
For the normalization of radiometric variation and signal weighting, a novel approach is proposed according to the characteristics of the antenna pattern effect. It implements linear effect correction after range compression and before image formation. There are two necessary steps: the first is to derive the elevation-dependent linear coefficient in signal magnitude,
The second step is to remove the 2D antenna pattern from the range-compressed signal
The following step is image formation. This method improves both the radiometric precision and impulse function. The normalization is very stable because the correction of the linear effect is insensitive to the antenna pointing error and Doppler estimation error.
5. Experiments
In this section, experiments are conducted to quantify the antenna pattern effect in the image and verify the precision of the proposed correction method. From the analysis in
Section 3, the maximum radiometric variation occurs in the azimuth direction of the swath edge, and the minimum at the reference squint angle. Consequently, the experiments are designed as follows: First, point targets are set in the scene, distributed in the azimuth direction along the swath edge and the range direction of the scene center. The RCS of each point target is the same. Next, the echo signals are generated from the simulation of the physical process of the AMAO spaceborne SAR acquisition. Then, the image is focused and radiometrically calibrated. Two antenna pattern-correction approaches are respectively applied, which are the proposed approach accounting for the spatial-variant antenna pattern and the conventional one using the reference EAP. Finally, target image energy is measured by integrating the power response over a sufficiently large area. The relative deviation of these measurements represents the antenna pattern effect and correction precision.
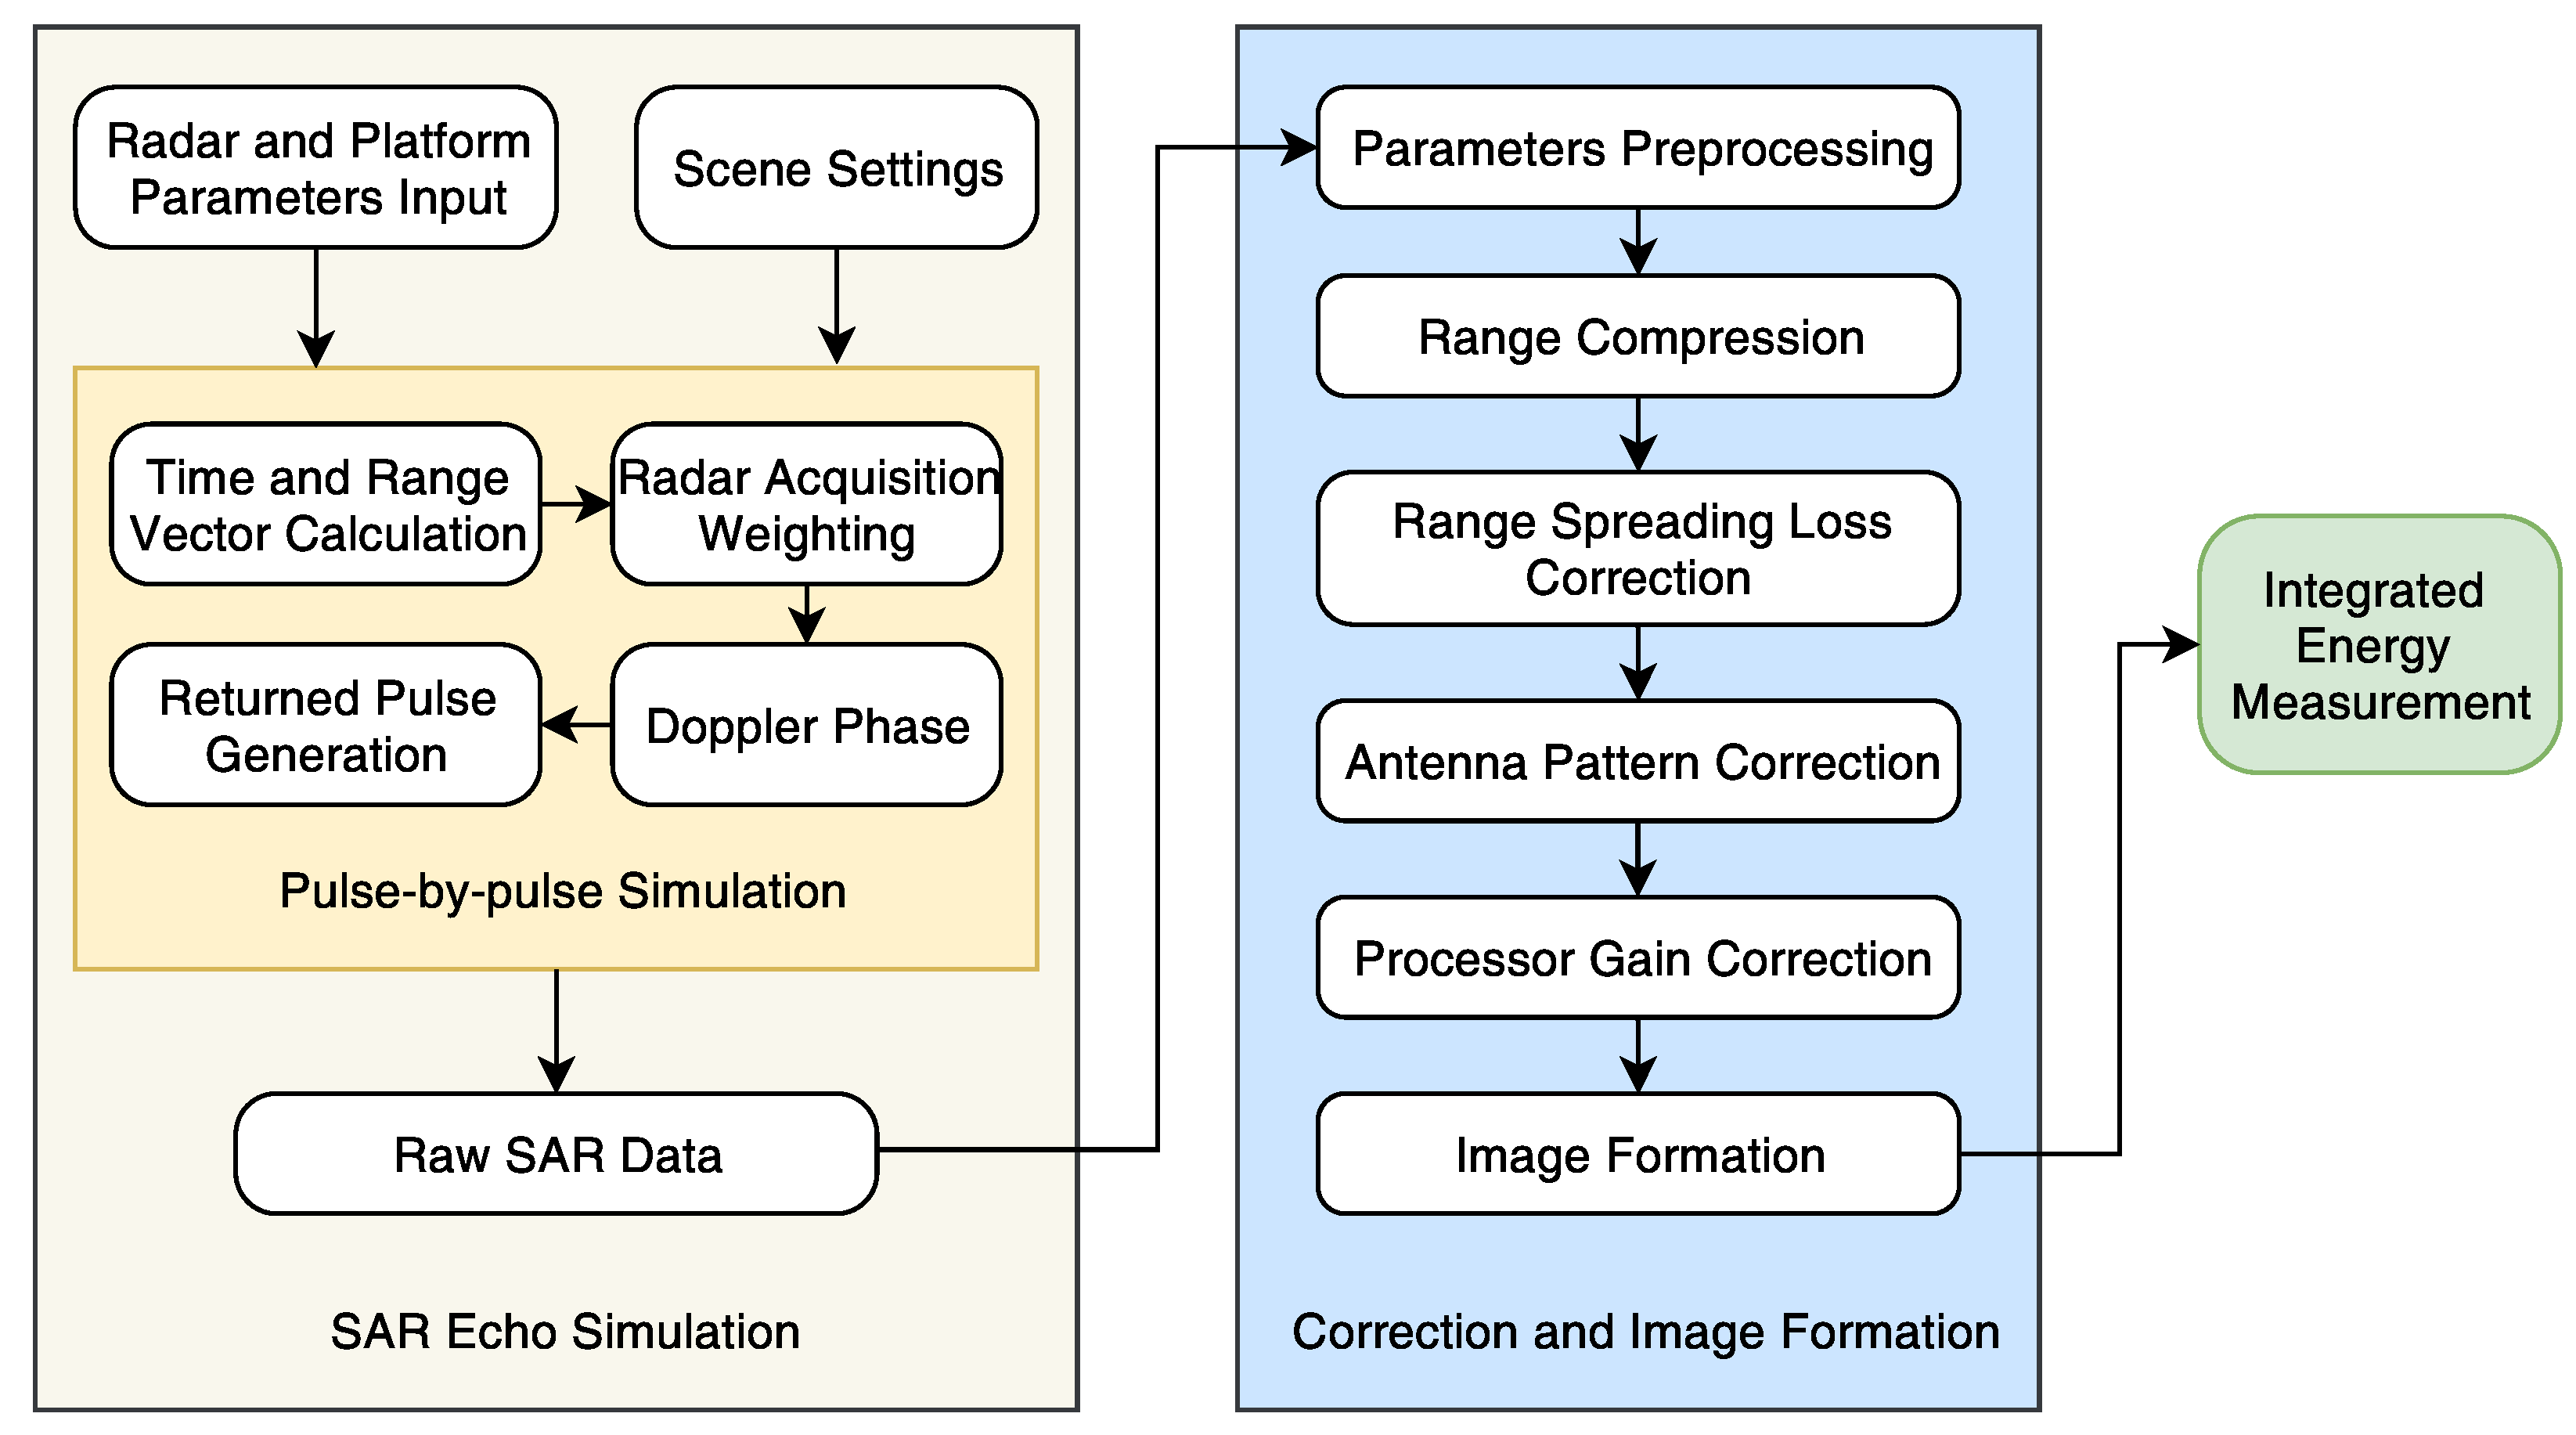
The main simulation parameters are listed in
Table 1. The block diagram of the simulation is shown in
Figure 6, and
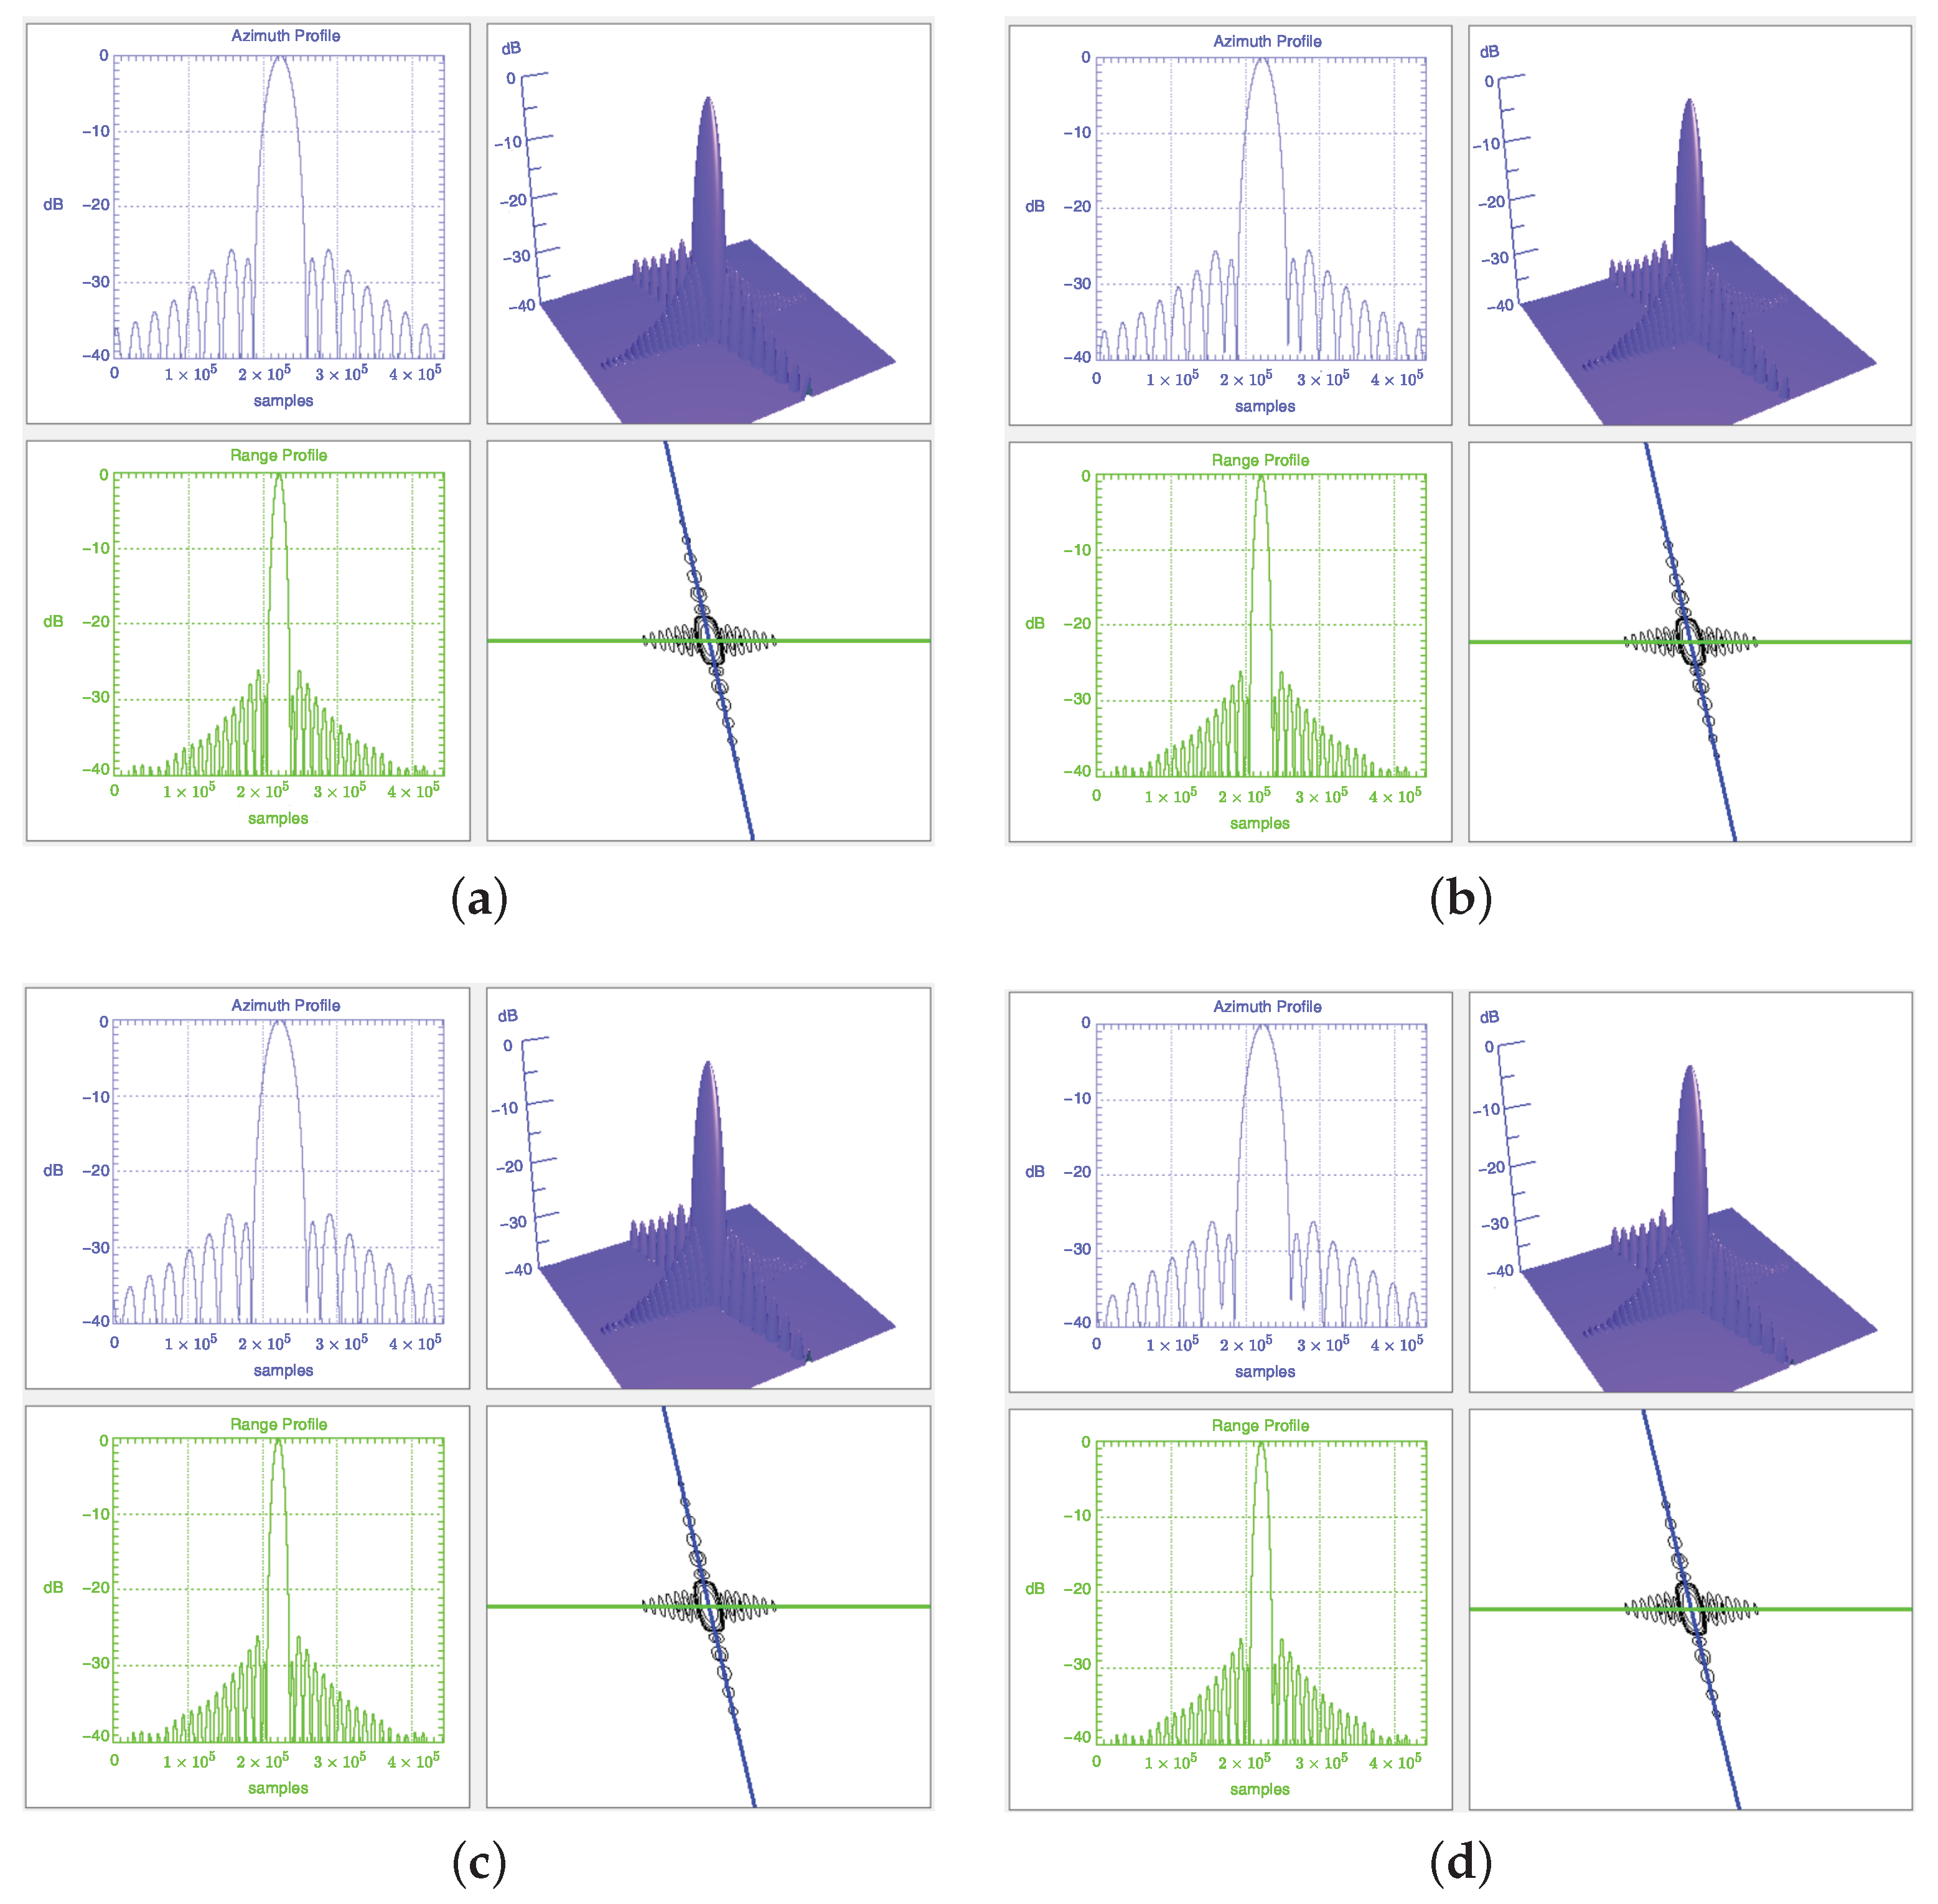
Figure 7 shows partial imaging results of point targets at different positions in the scene.
5.1. Azimuth Radiometric Variation
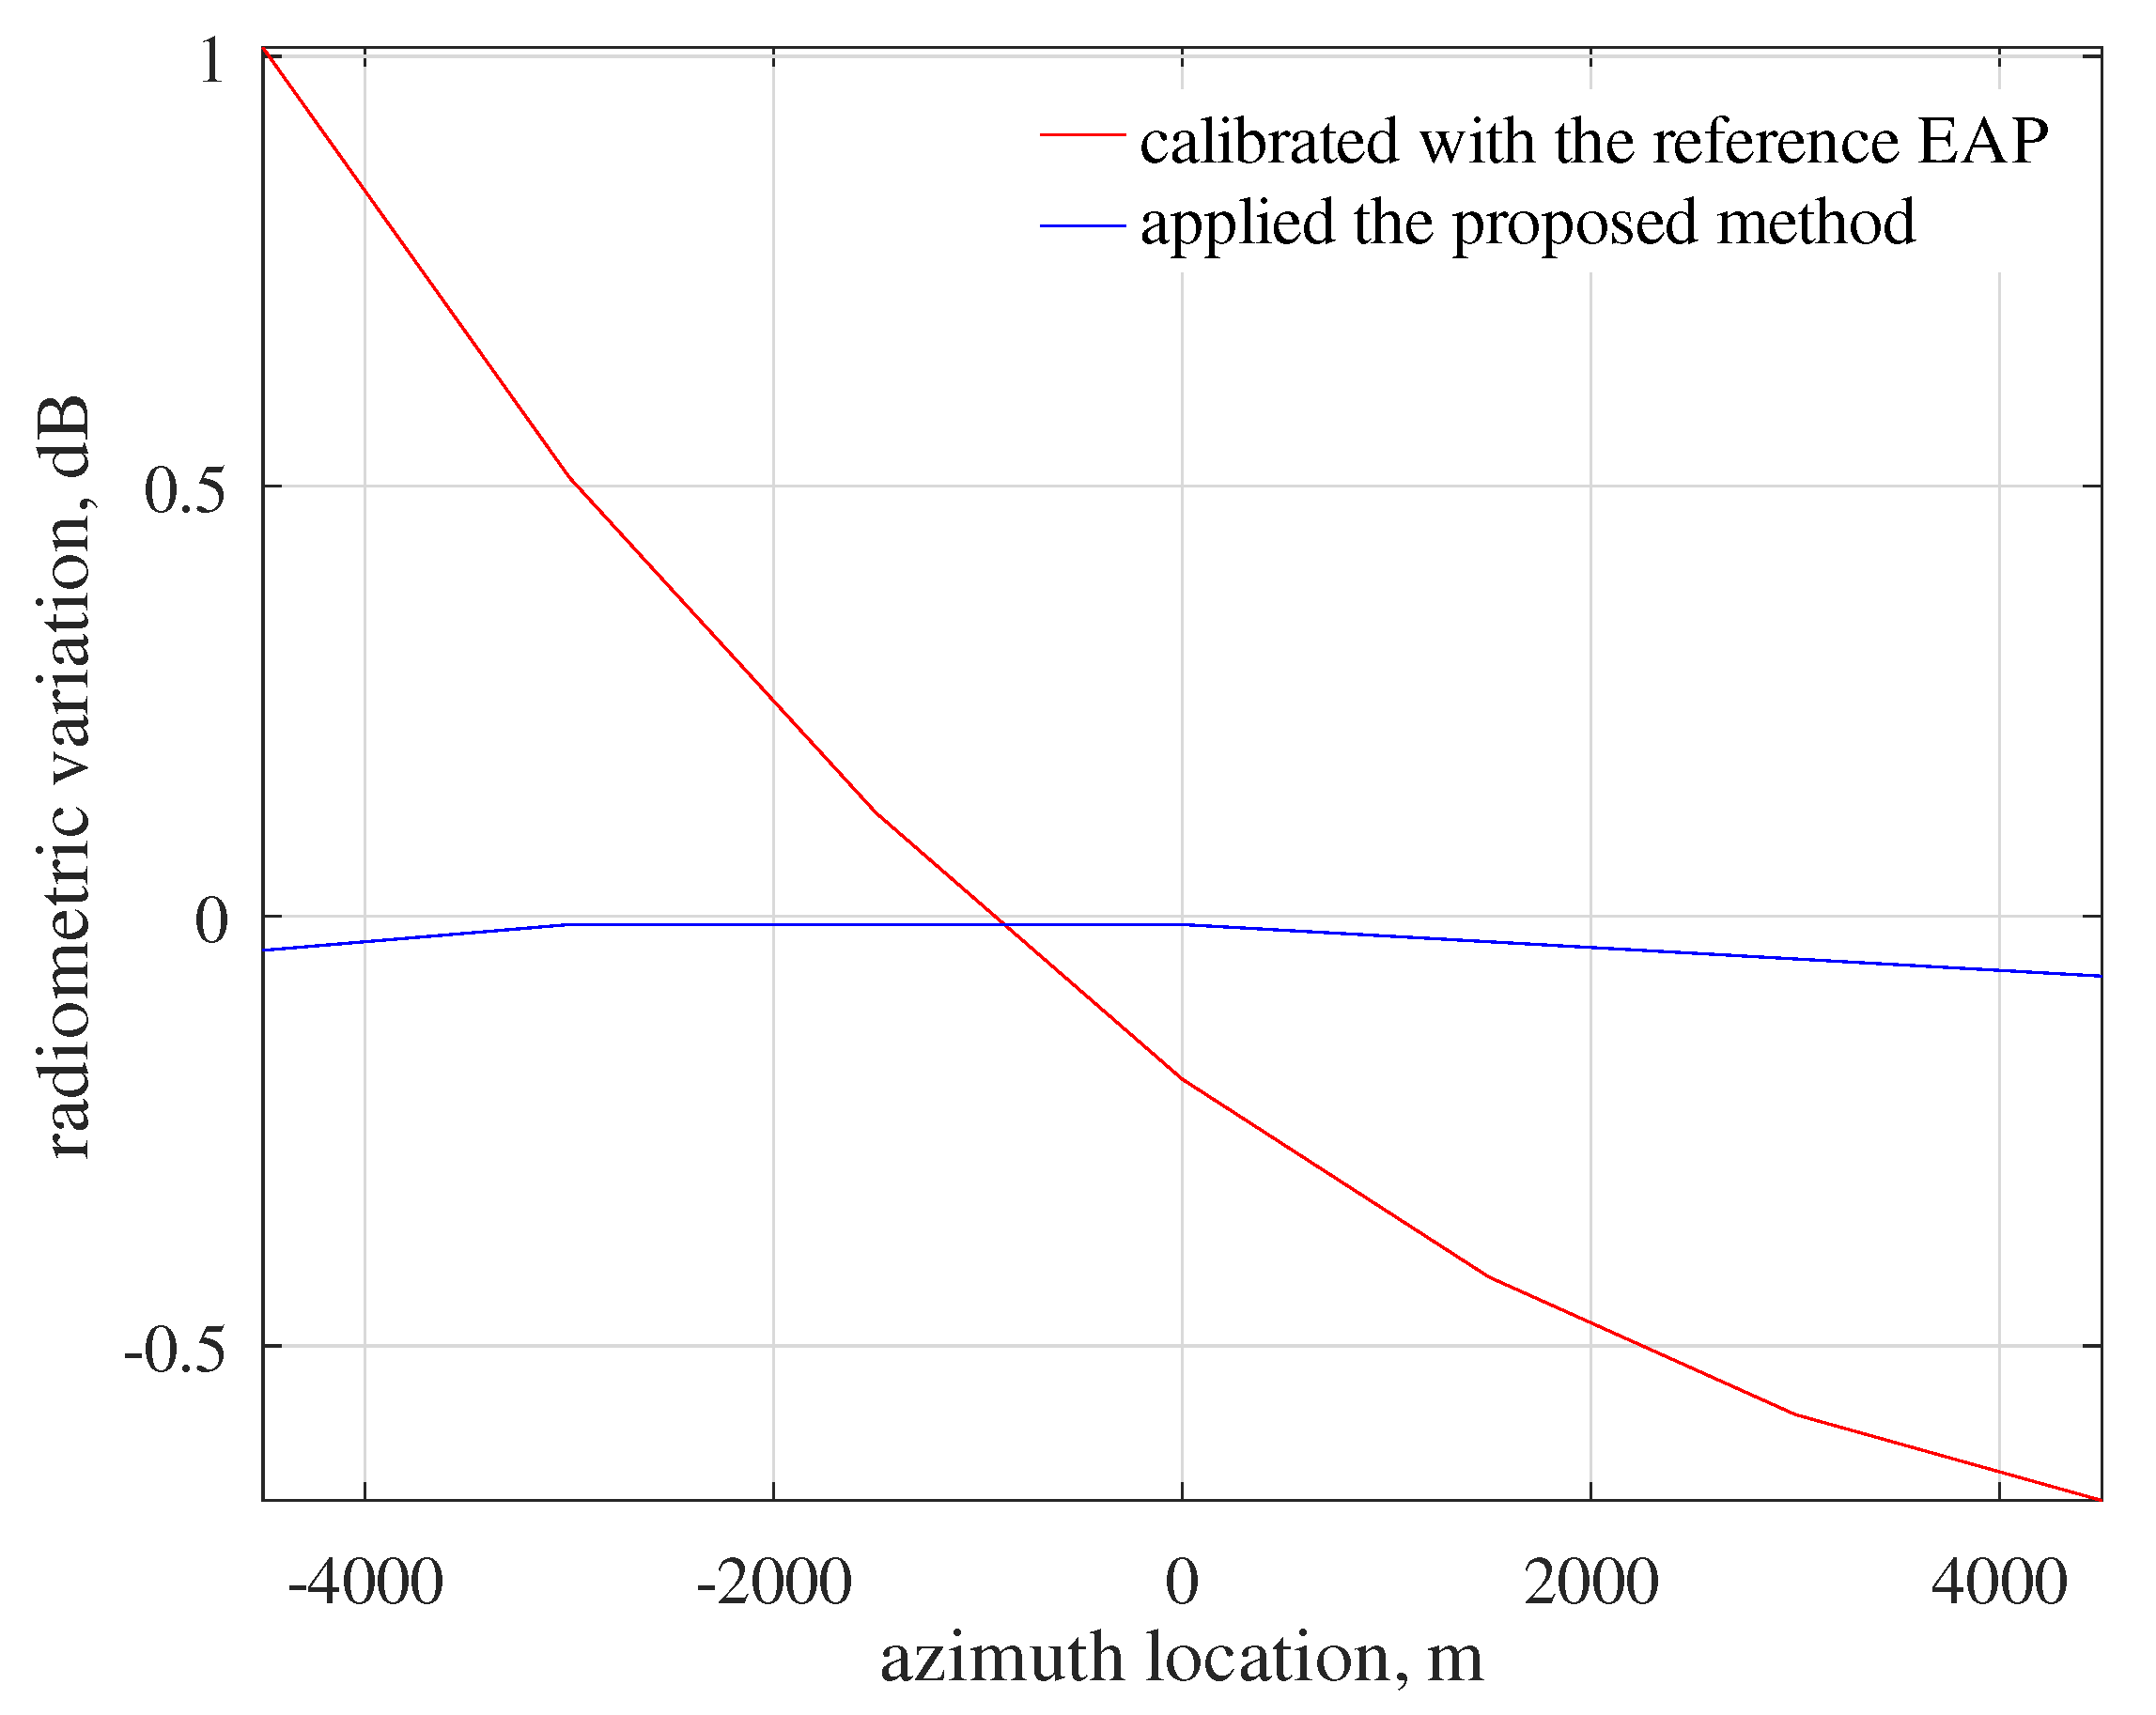
Seven point targets are set along the swath edge, 4.5 km from the swath centerline and 1.5 km apart in the azimuth direction. After the correction with the reference EAP, the parameters of each target response, including the integrated energy, are measured.
Table 2 summarizes the target response measurements. From the results, the relative radiometric variation reaches 1.69 dB, despite the correction with EAP. As previously mentioned, this high variation is caused by ignoring the 2D variation of the antenna pattern. The results conform to the effect analysis in
Section 3.
Accounting for the 2D change in EAP, the proposed method of antenna pattern correction is applied in the processor. The parameters of each target response are measured in the calibrated image, as shown in
Table 3. Comparing
Table 2 and
Table 3, the improvement in the relative radiometric accuracy is apparent, which means the proposed method can effectively correct the antenna pattern effect in the image with high precision. Results show that the azimuth radiometric variation is reduced from 1.69 dB to better than 0.1 dB, as shown in
Figure 8. Meanwhile, the image quality parameters, such as azimuth peak-to-sidelobe ratio (PSLR) and integrated side-lobe ratio (ISLR), are slightly improved as a side effect.
5.2. Radiometric Variation at the Azimuth Scene Center
As previously analyzed, the minimum radiometric variation occurs at the azimuth scene center, where the reference EAP is usually derived. Seven point targets are set at the scene centerline, 1.5 km apart in the range direction. The RCS of each point target is the same. After the correction with the reference EAP, parameters of each point target are measured, see
Table 4. The results show that the relative radiometric variation is very low when EAP is precise. After the proposed method of antenna pattern correction is applied, the imaging results are given in
Table 5. A careful comparison between the parameters in
Table 4 and
Table 5 shows that even at the reference squint angle, the proposed correction method still has better performance than the conventional correction using the reference EAP.
6. Discussion
AMAO spaceborne SAR, with its powerful beam-steering capability, can acquire rich information flexibly and efficiently. On the other hand, it brings new challenges to radiometric calibration. In particular, the antenna pattern effect and correction are concerns for SAR calibration engineers.
The main differences are that for conventional SARs, the AAP is not important to the radiometric accuracy, so the antenna pattern correction usually refers to the correction in the range direction (see [
9]). Current spaceborne SARs have achieved high radiometric accuracy with this EAP correction approach. However, in the case of AMAO, especially with high-squint and high-resolution, targets at different positions within a scene are exposed to different antenna patterns, each a different cut of the 2D antenna pattern, resulting in complex 2D effects on image. The spatial-variant radiometric error can reach about 1.7 dB, as analysis in
Section 3 and experimental results in
Section 5 show. The correction error of the antenna pattern effect is a systematic error, which must be corrected accurately to achieve the consistency and accuracy of SAR radiometric measurements.
In this paper, the antenna pattern characteristics are analyzed for the first time. The 2D variation is identified in the antenna pattern of a squint beam, which is mainly because the two angles—azimuth and the elevation off-axis—are both variables, especially in the high-squint, high-resolution case. Moreover, the antenna beam is often steered to a rotation center during AMAO SAR acquisition to achieve high resolution and/or wide swath. As a side effect, the shape of the antenna pattern becomes less than ideal.
The spatial variation and nonideality of the antenna pattern make radiometric normalization difficult. Since the spatial variation in antenna pattern is not considered in [
9], the EAP correction approach is precise only at the reference squint angle, but causes high relative variation across the high-squint image. Numerical examples of the SAR image calibrated with EAP show that the 2D variant effect of the antenna pattern does exist in the AMAO SAR image and can be very high (e.g., 1.69 dB in the example).
A straightforward approach to antenna pattern correction is to numerically evaluate the integrated energy per resolution cell or coarser grid, taking the full 2D antenna pattern into account. In this way, the authors in [
14,
15] carefully considered the full 2D antenna pattern in airborne F-SAR calibration. However, this method requires many integration operations. The considerations needed for airborne SAR are mainly the variations in the platform track and the sensor attitude angles, which are not the main problems of AMAO spaceborne SAR. Therefore, this paper developed a practical radiometric error model for AMAO spaceborne SAR. The model contains an elevation-dependent linear factor and a signal centroid shift factor, both of which can be derived from the antenna pattern. On this basis, an improved antenna pattern correction approach is proposed. The results show that the improved method can adequately correct the spatial-variant effect of the antenna pattern, and according to the experimental results, the radiometric error of about 1.69 dB is removed, thus enabling consistent radiometric measurements. Meanwhile, the proposed method has slight benefits on PSLR and ISLR as a side effect.
This paper focuses on the analysis and correction of the antenna pattern effect, which is part of the radiometric calibration of AMAO spaceborne SAR. A more detailed discussion on real data has to be deferred to later work.
7. Conclusions
The analysis and correction of antenna pattern effects are of great importance for AMAO spaceborne SAR to achieve consistent radiometric measurements. This paper first analyzes the side effects of the antenna pattern on AMAO SAR radiometric measurements, especially in the high-squint case. Then, an analytical model is developed to analyze the radiometric variation in AMAO SAR images. On these bases, an improved correction method corresponding to the spatial-variant antenna pattern is provided and numerically verified. Experimental results show that, despite the conventional correction efforts using the reference EAP, the residual radiometric variation is still noticeable in the high-squint case. Compared with the traditional correction method, the improved method can adequately correct the spatial-variant antenna pattern effects to enable precise and consistent radiometric measurements. The good experimental performance indicators verify the correctness of the analysis and the effectiveness of the improved correction method.
Author Contributions
Conceptualization, J.C. and J.H.; methodology, J.H. and P.W.; software, P.W.; validation, J.H. and Y.G.; formal analysis, J.H.; investigation, J.H.; resources, P.W.; data curation, Y.G.; writing—original draft preparation, J.H. and Y.G.; writing—review and editing, J.H., J.C. and P.W.; visualization, P.W. and Y.G.; supervision, J.C.; project administration, P.W.; funding acquisition, P.W. All authors have read and agreed to the published version of the manuscript.
Funding
This research received no external funding.
Data Availability Statement
Not applicable.
Acknowledgments
The authors would like to express their gratitude to the anonymous reviewers and the associate editor for their constructive comments on the paper.
Conflicts of Interest
The authors declare no conflict of interest.
Abbreviations
The following abbreviations are used in this manuscript:
| AMAO | Azimuthal multi-angle observation |
| AAP | Azimuth antenna pattern |
| EAP | Elevation antenna pattern |
| SAR | Synthetic aperture radar |
| 2D | Two-dimensional |
References
- Chen, J.; Yang, W.; Wang, P.; Zeng, H.; Men, Z.; Li, C. Review of Novel Azimuthal Multi-angle Observation Spaceborne SAR Technique. J. Radars 2020, 9, 205–220. [Google Scholar] [CrossRef]
- Yang, W.; Ma, X. A Novel Spaceborne SAR Imaging Mode for Moving Target Velocity Estimation. In Proceedings of the 2016 International Conference on Control, Automation and Information Sciences (ICCAIS), Ansan, Korea, 27–29 October 2016; pp. 13–16. [Google Scholar] [CrossRef]
- Wang, Y.; Yang, W.; Chen, J.; Kuang, H.; Liu, W.; Li, C. Azimuth Sidelobes Suppression Using Multi-Azimuth Angle Synthetic Aperture Radar Images. Sensors 2019, 19, 2764. [Google Scholar] [CrossRef] [PubMed] [Green Version]
- Men, Z.; Wang, P.; Li, C.; Chen, J.; Liu, W.; Fang, Y. High-Temporal-Resolution High-Spatial-Resolution Spaceborne SAR Based on Continuously Varying PRF. Sensors 2017, 17, 1700. [Google Scholar] [CrossRef] [PubMed] [Green Version]
- Ansari, H.; De Zan, F.; Parizzi, A.; Eineder, M.; Goel, K.; Adam, N. Measuring 3-D Surface Motion With Future SAR Systems Based on Reflector Antennae. IEEE Geosci. Remote Sens. Lett. 2016, 13, 272–276. [Google Scholar] [CrossRef] [Green Version]
- Huang, J.; Wang, P.; Chen, J. Impact of 2-D Antenna Pattern on Radiometric Calibration of Azimuthal Multi-angle Observation Spaceborne SAR. In Proceedings of the 2021 Photonics Electromagnetics Research Symposium (PIERS), Hangzhou, China, 21–25 November 2021; pp. 2835–2839. [Google Scholar] [CrossRef]
- Kuang, H.; Wang, T.; Gao, H.; Yu, H.; Liu, L.; Zhang, R. Geometry and Signal Properties of Multiple Azimuth Angle Spaceborne SAR. In Proceedings of the IET International Radar Conference (IET IRC 2020), Institution of Engineering and Technology, Online Conference, 4–6 November 2020; pp. 379–383. [Google Scholar] [CrossRef]
- Jung, H.S.; Lu, Z.; Shepherd, A.; Wright, T. Simulation of the SuperSAR Multi-Azimuth Synthetic Aperture Radar Imaging System for Precise Measurement of Three-Dimensional Earth Surface Displacement. IEEE Trans. Geosci. Remote Sens. 2015, 53, 6196–6206. [Google Scholar] [CrossRef]
- Shimada, M. Imaging from Spaceborne and Airborne SARs, Calibration, and Applications; CRC Press: Boca Raton, FL, USA, 2018. [Google Scholar] [CrossRef]
- Schwerdt, M.; Brautigam, B.; Bachmann, M.; Doring, B.; Schrank, D.; Hueso Gonzalez, J. Final TerraSAR-X Calibration Results Based on Novel Efficient Methods. IEEE Trans. Geosci. Remote Sens. 2010, 48, 677–689. [Google Scholar] [CrossRef]
- Janoth, J.; Gantert, S.; Schrage, T.; Kaptein, A. From TerraSAR-X towards TerraSAR Next Generation. In Proceedings of the EUSAR 2014, 10th European Conference on Synthetic Aperture Radar, Berlin, Germany, 3–5 June 2014; VDE: Berlin, Germany, 2014; pp. 1–4. [Google Scholar]
- Balanis, C.A. Antenna Theory: Analysis and Design; John Wiley & Sons: Hoboken, NJ, USA, 2005. [Google Scholar]
- El-Darymli, K.; Mcguire, P.; Gill, E.; Power, D.; Moloney, C. Understanding the Significance of Radiometric Calibration for Synthetic Aperture Radar Imagery. In Proceedings of the 2014 IEEE 27th Canadian Conference on Electrical and Computer Engineering (CCECE), Toronto, ON, Canada, 5–8 May 2014; IEEE: Toronto, ON, Canada, 2014; pp. 1–6. [Google Scholar] [CrossRef]
- Jäger, M.; Reigber, A.; Scheiber, R. Accurate Consideration of Sensor Parameters in the Calibration and Focusing of F-SAR Data. In Proceedings of the EUSAR 2012, 9th European Conference on Synthetic Aperture Radar, Nuremberg, Germany, 23–26 April 2012; Volume 2012, pp. 20–23. [Google Scholar]
- Reigber, A.; Scheiber, R.; Jager, M.; Prats-Iraola, P.; Hajnsek, I.; Jagdhuber, T.; Papathanassiou, K.P.; Nannini, M.; Aguilera, E.; Baumgartner, S.; et al. Very-High-Resolution Airborne Synthetic Aperture Radar Imaging: Signal Processing and Applications. Proc. IEEE 2013, 101, 759–783. [Google Scholar] [CrossRef] [Green Version]
| Publisher’s Note: MDPI stays neutral with regard to jurisdictional claims in published maps and institutional affiliations. |
© 2022 by the authors. Licensee MDPI, Basel, Switzerland. This article is an open access article distributed under the terms and conditions of the Creative Commons Attribution (CC BY) license (https://creativecommons.org/licenses/by/4.0/).


