
3D Point Cloud for Cultural Heritage: A Scientometric Survey

Abstract
:1. Introduction
2. Background
2.1. Data Acquisition and Fusion
2.2. Data Processing and Application
2.2.1. Orthophoto Image Production
2.2.2. Damage Detection
2.2.3. HBIM
2.2.4. Integration with 3D GIS
2.2.5. Virtual Restoration
2.3. Summary
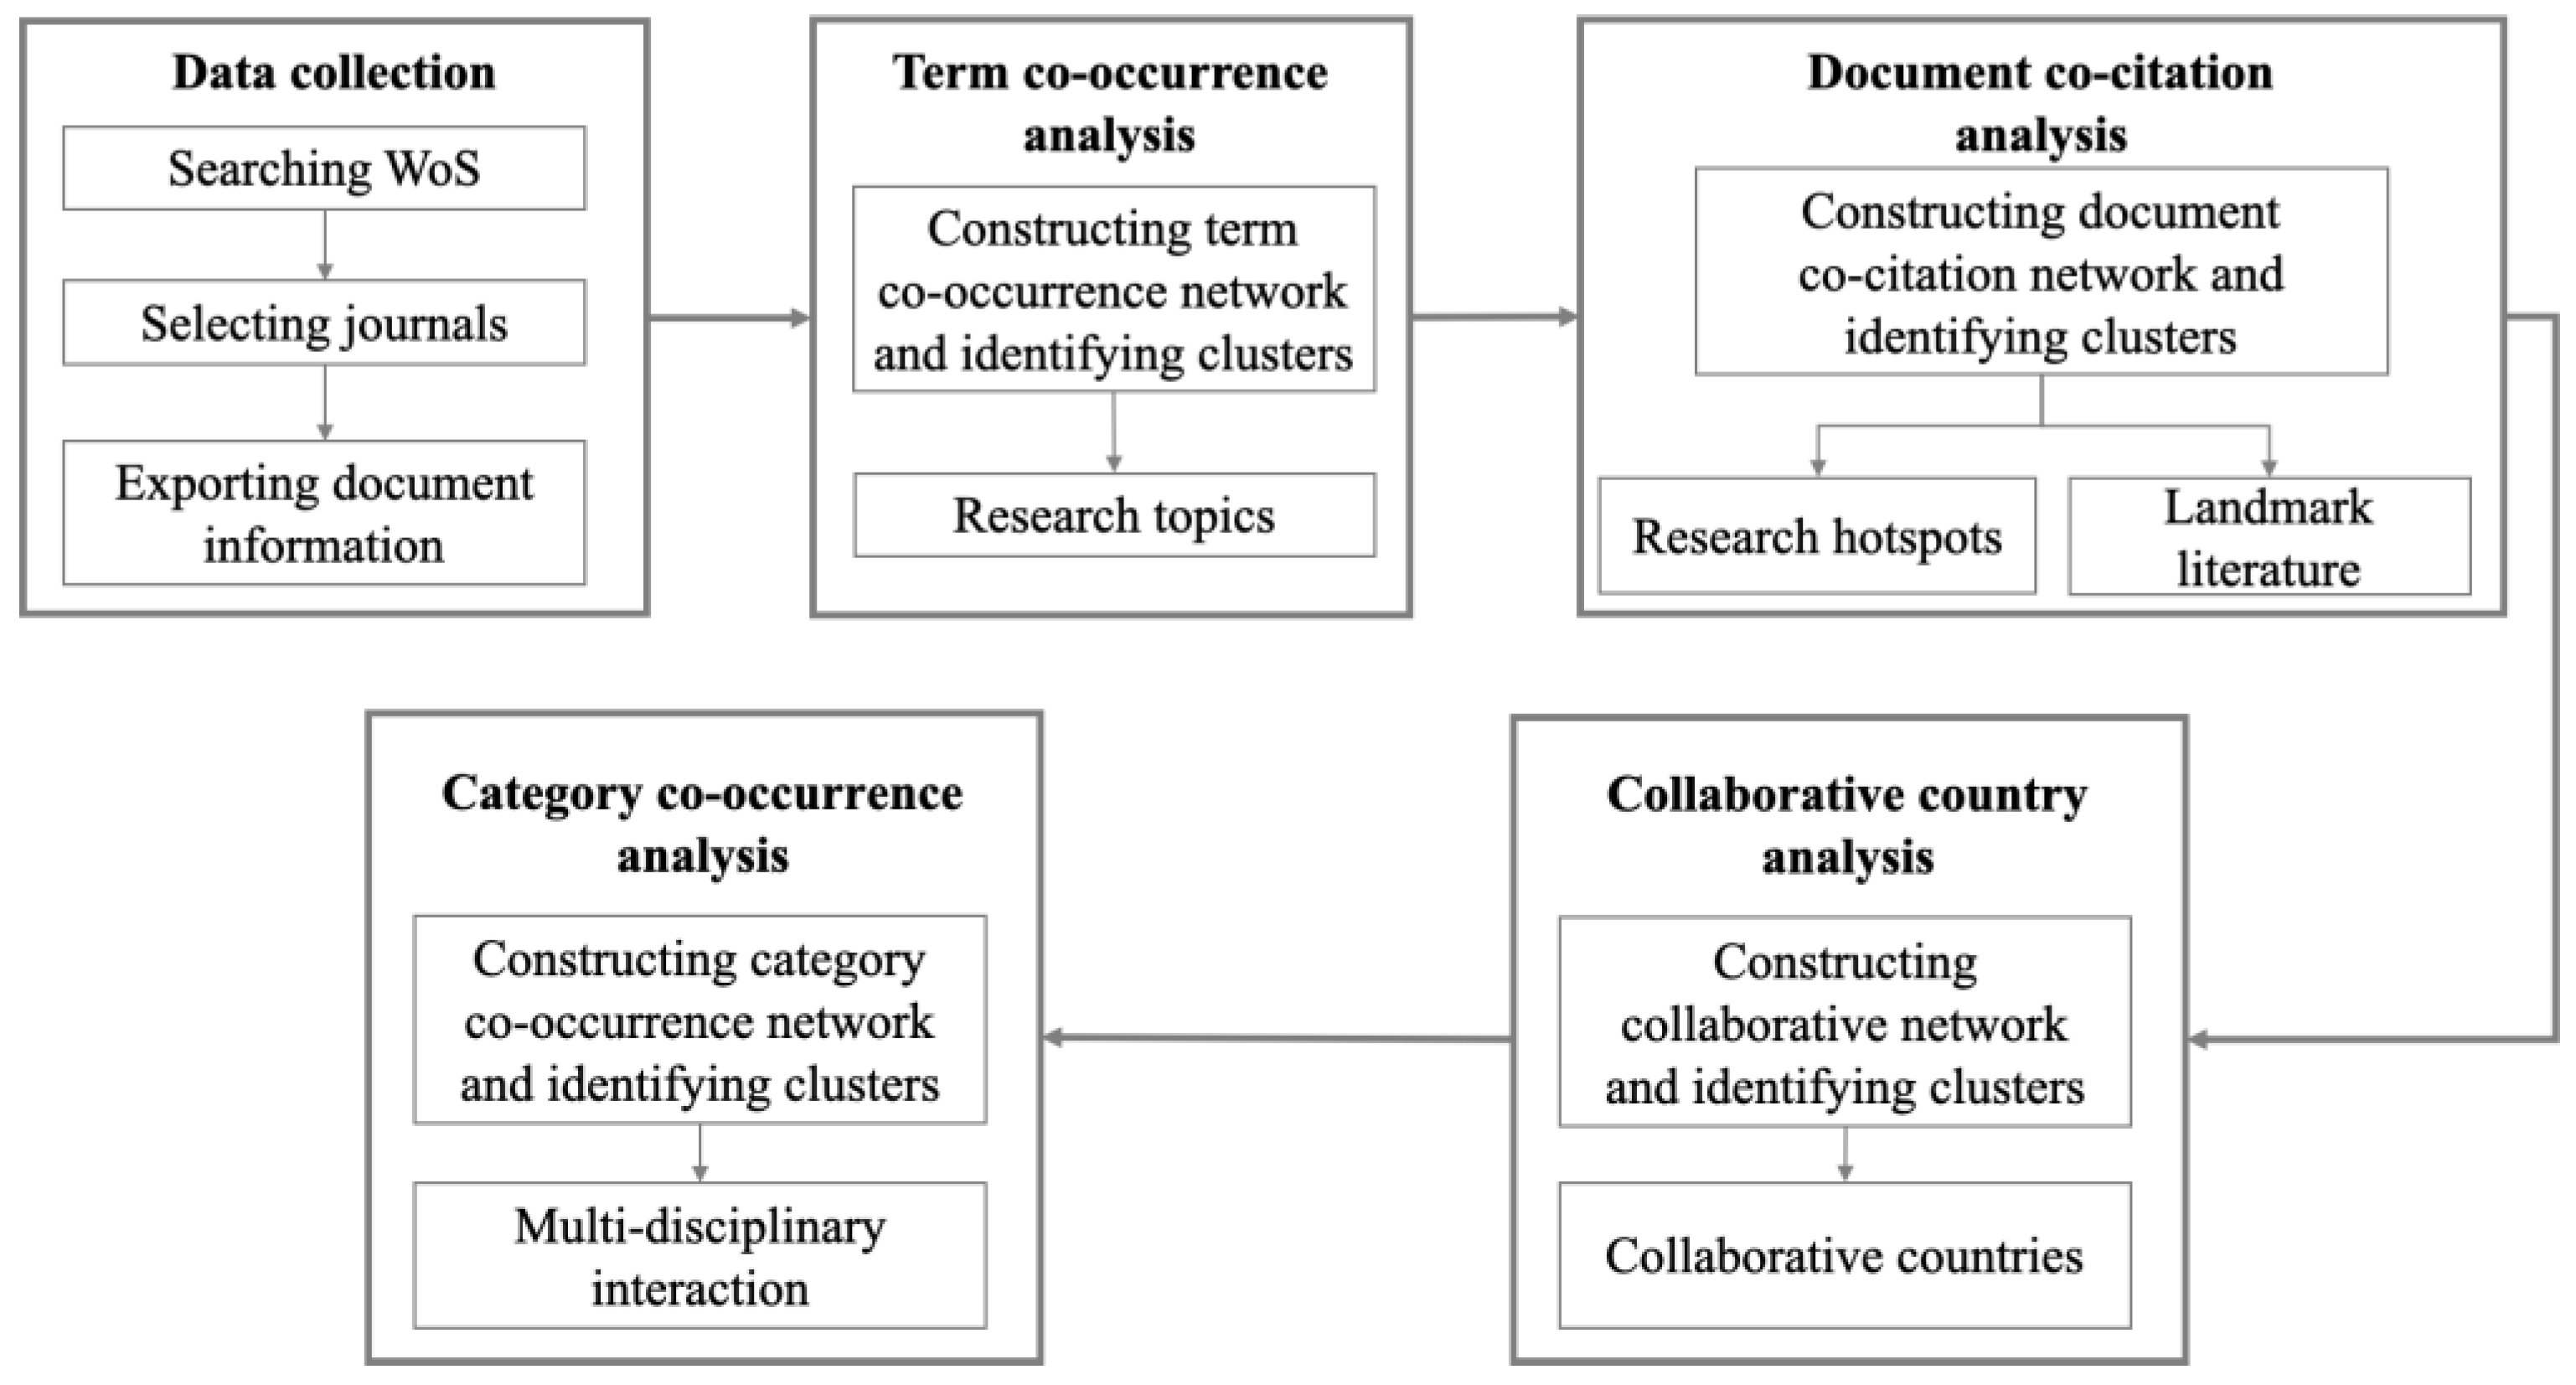
3. Methodology
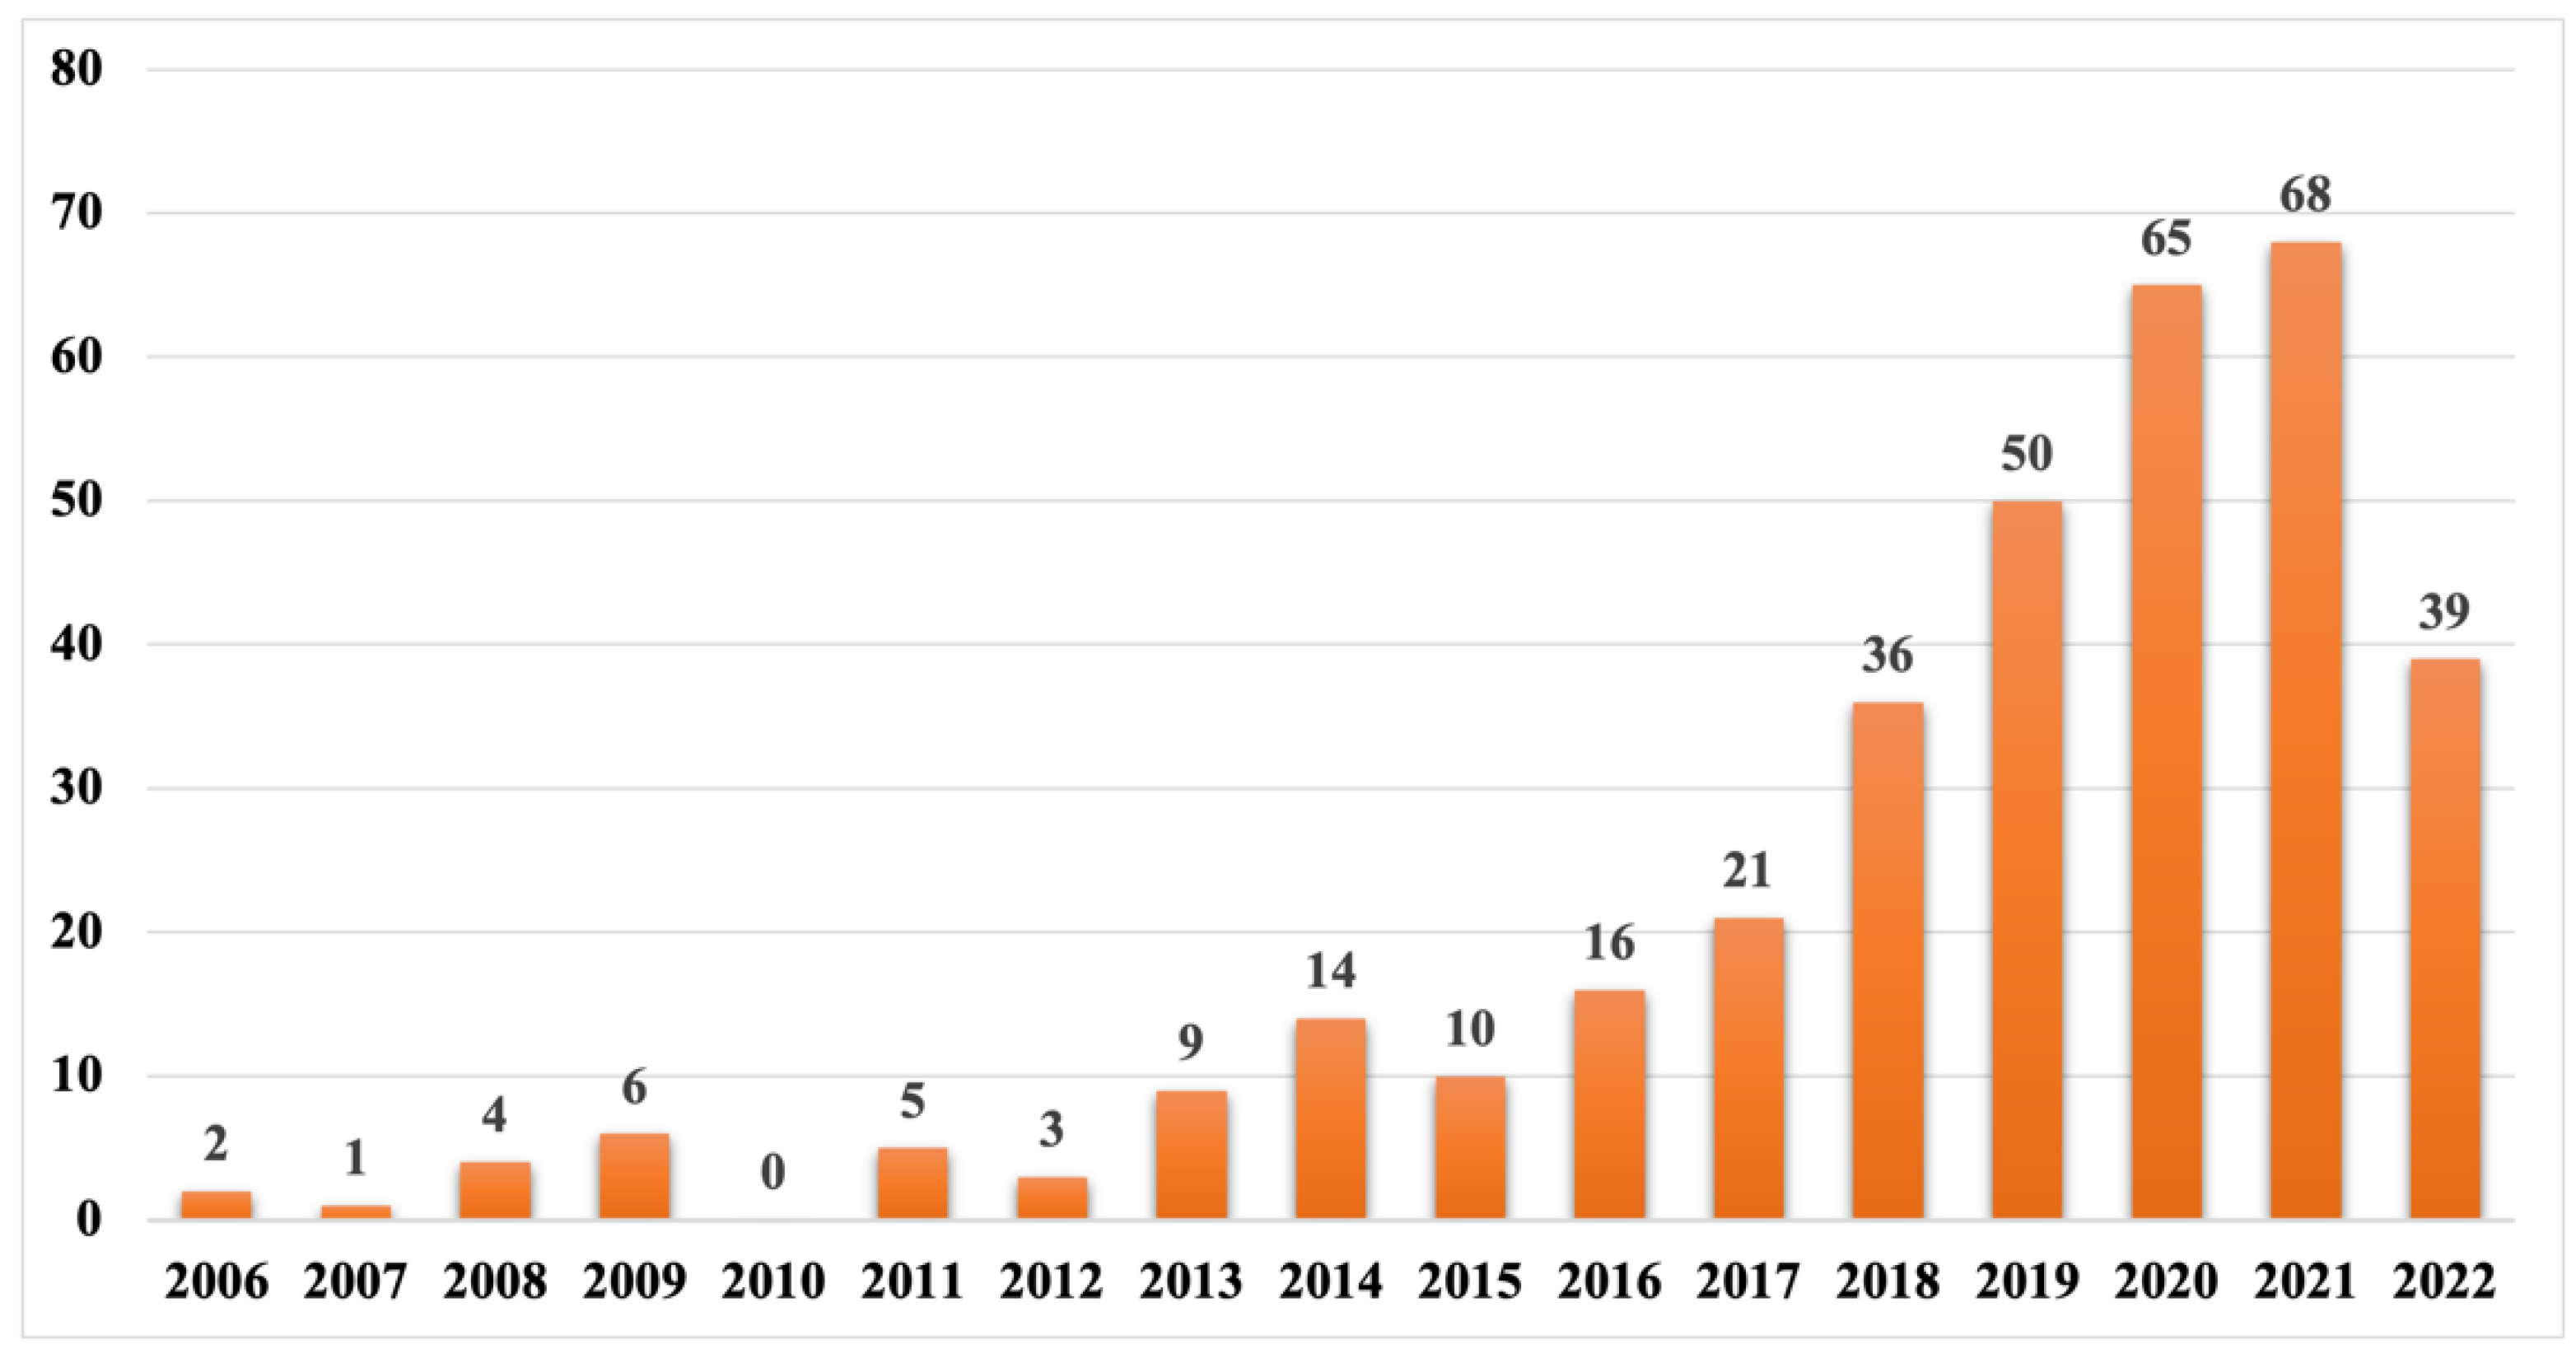
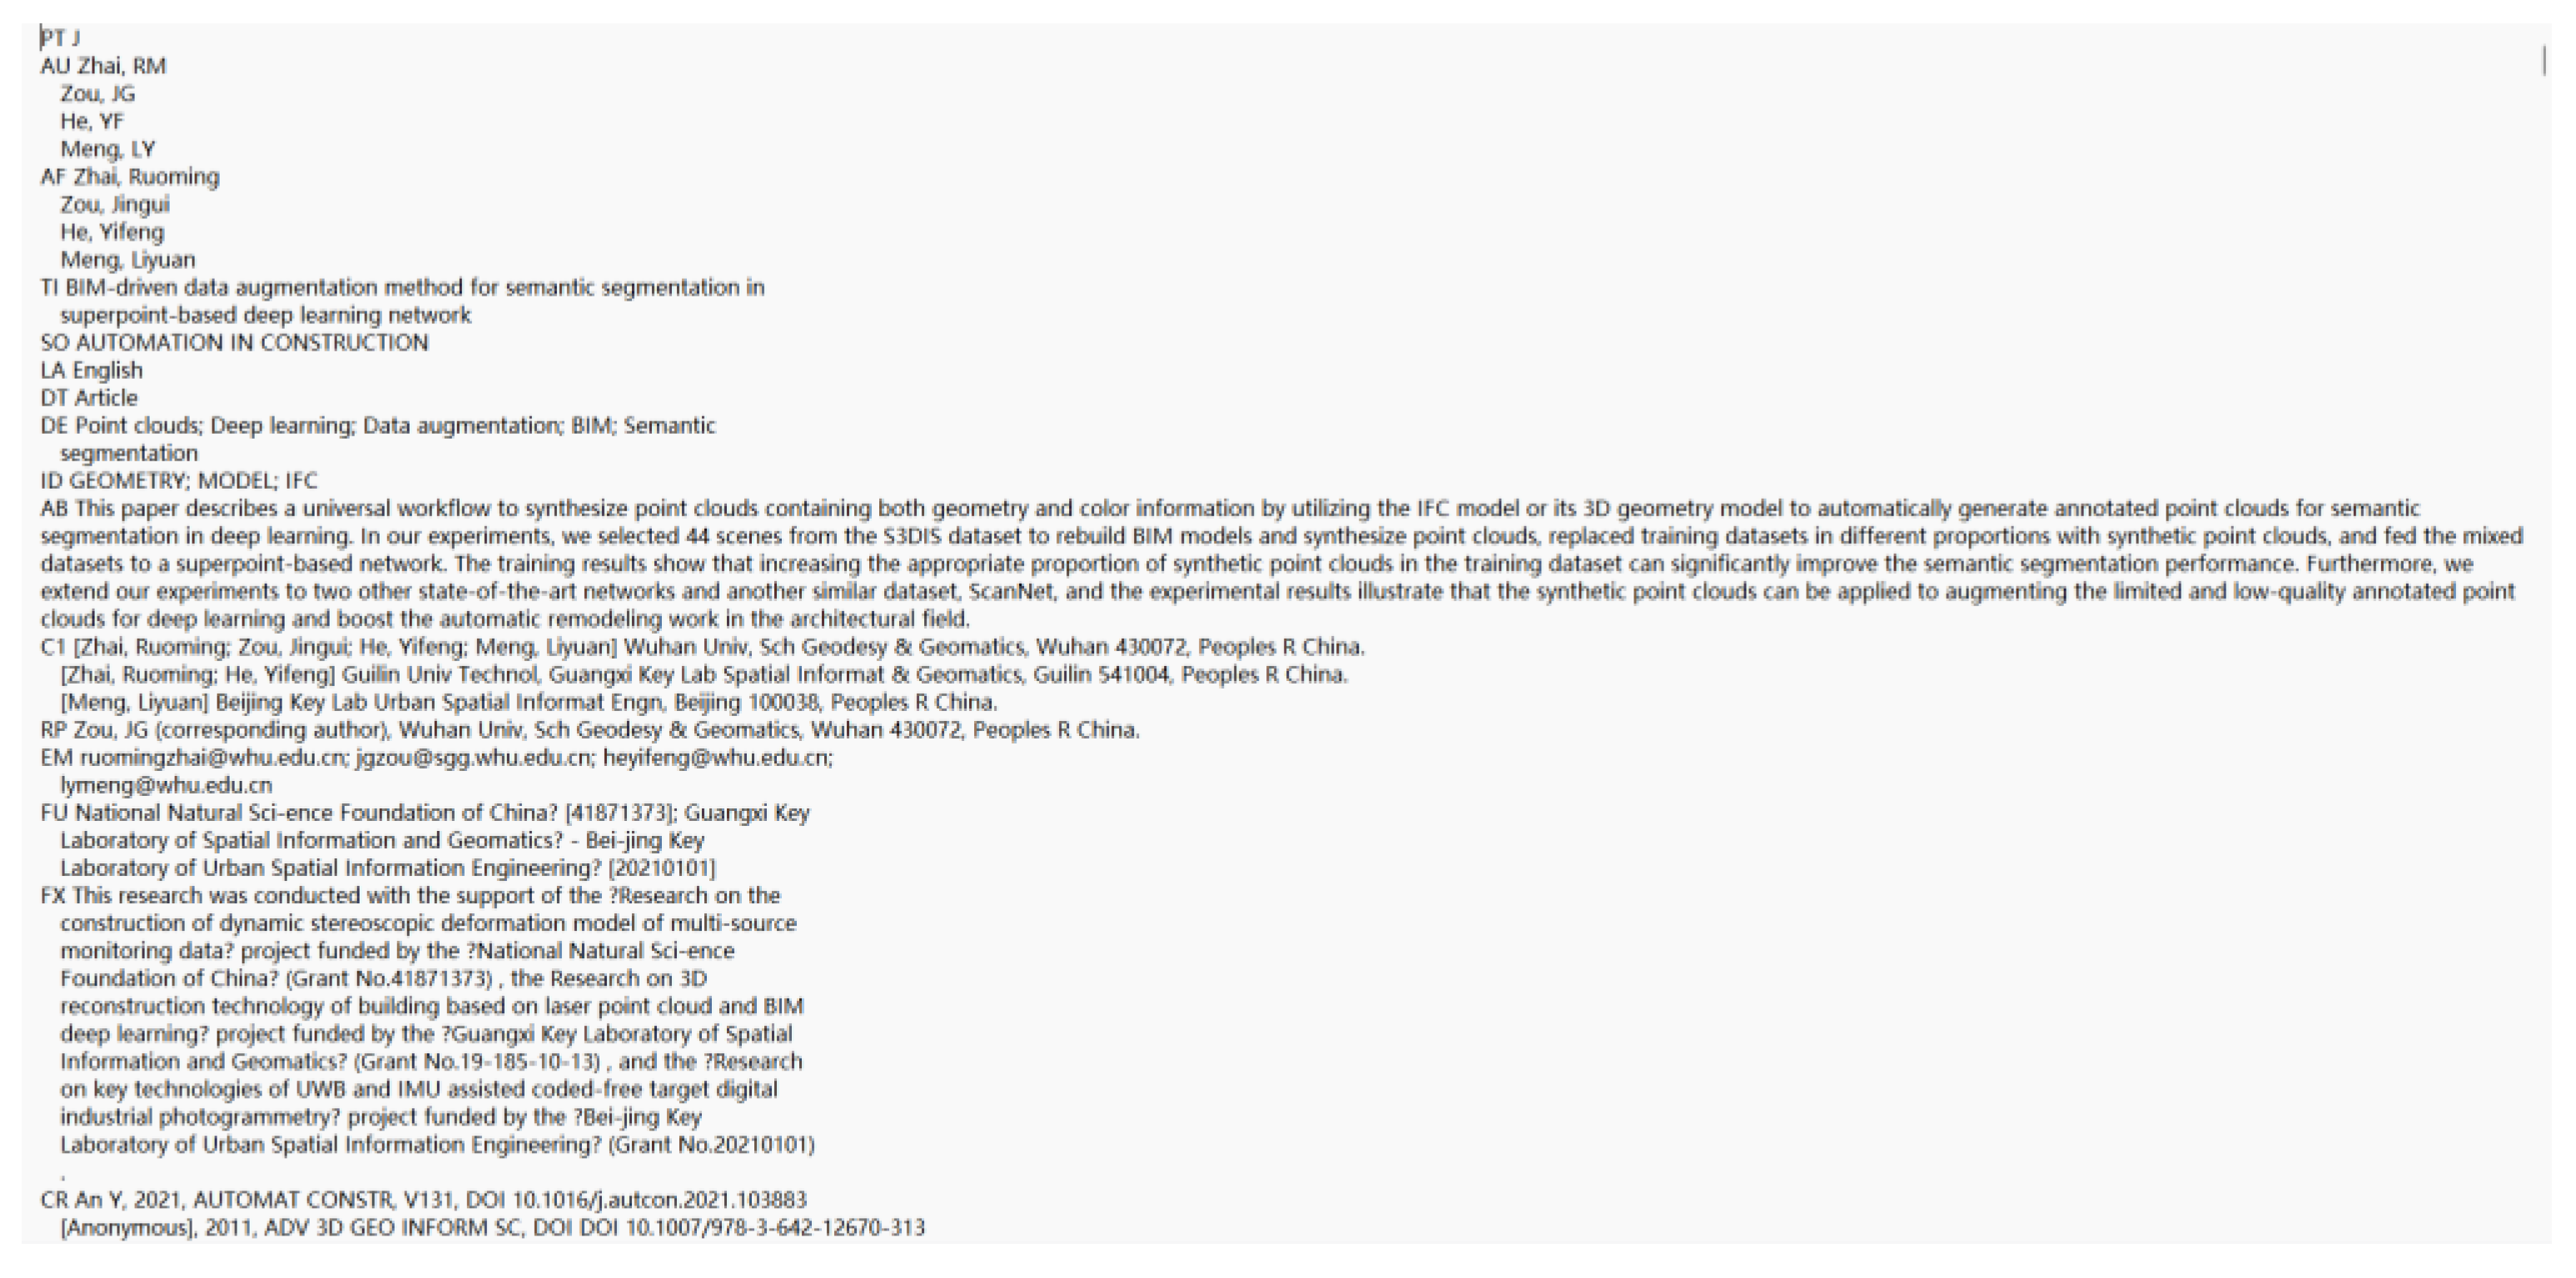
3.1. Data Collection
3.2. Analysis Tools—CiteSpace Software
4. Results and Discussion
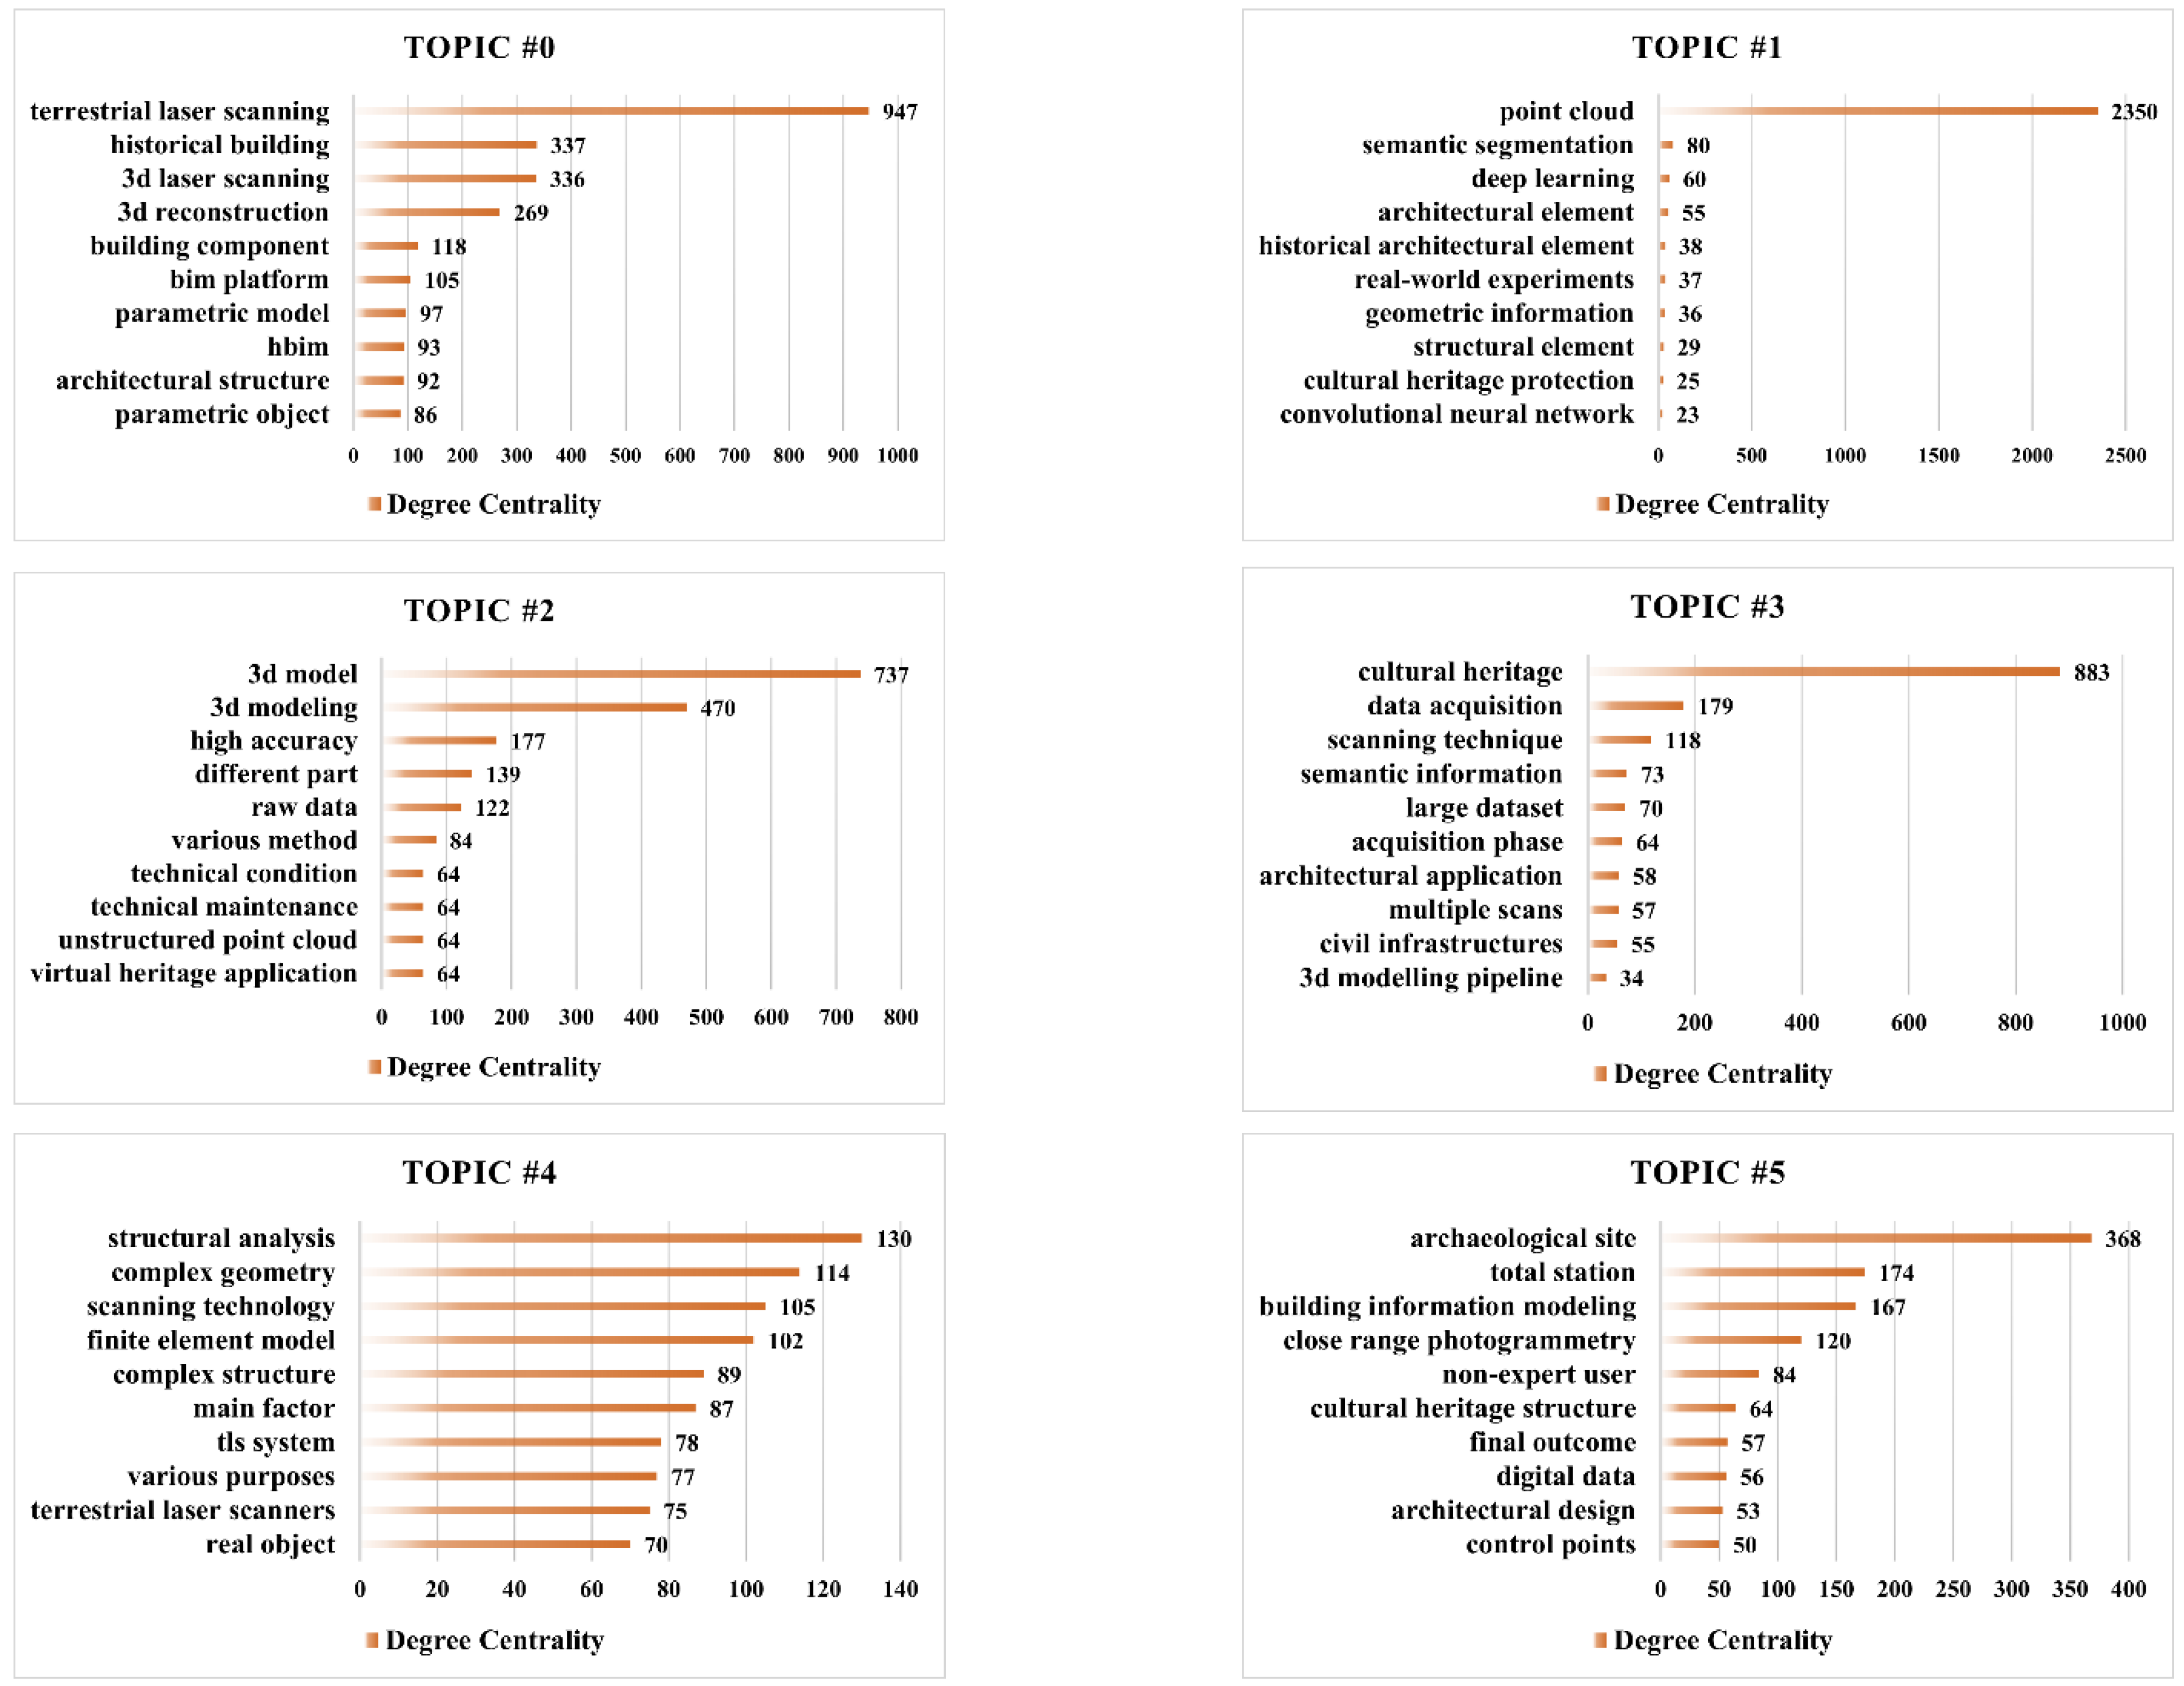
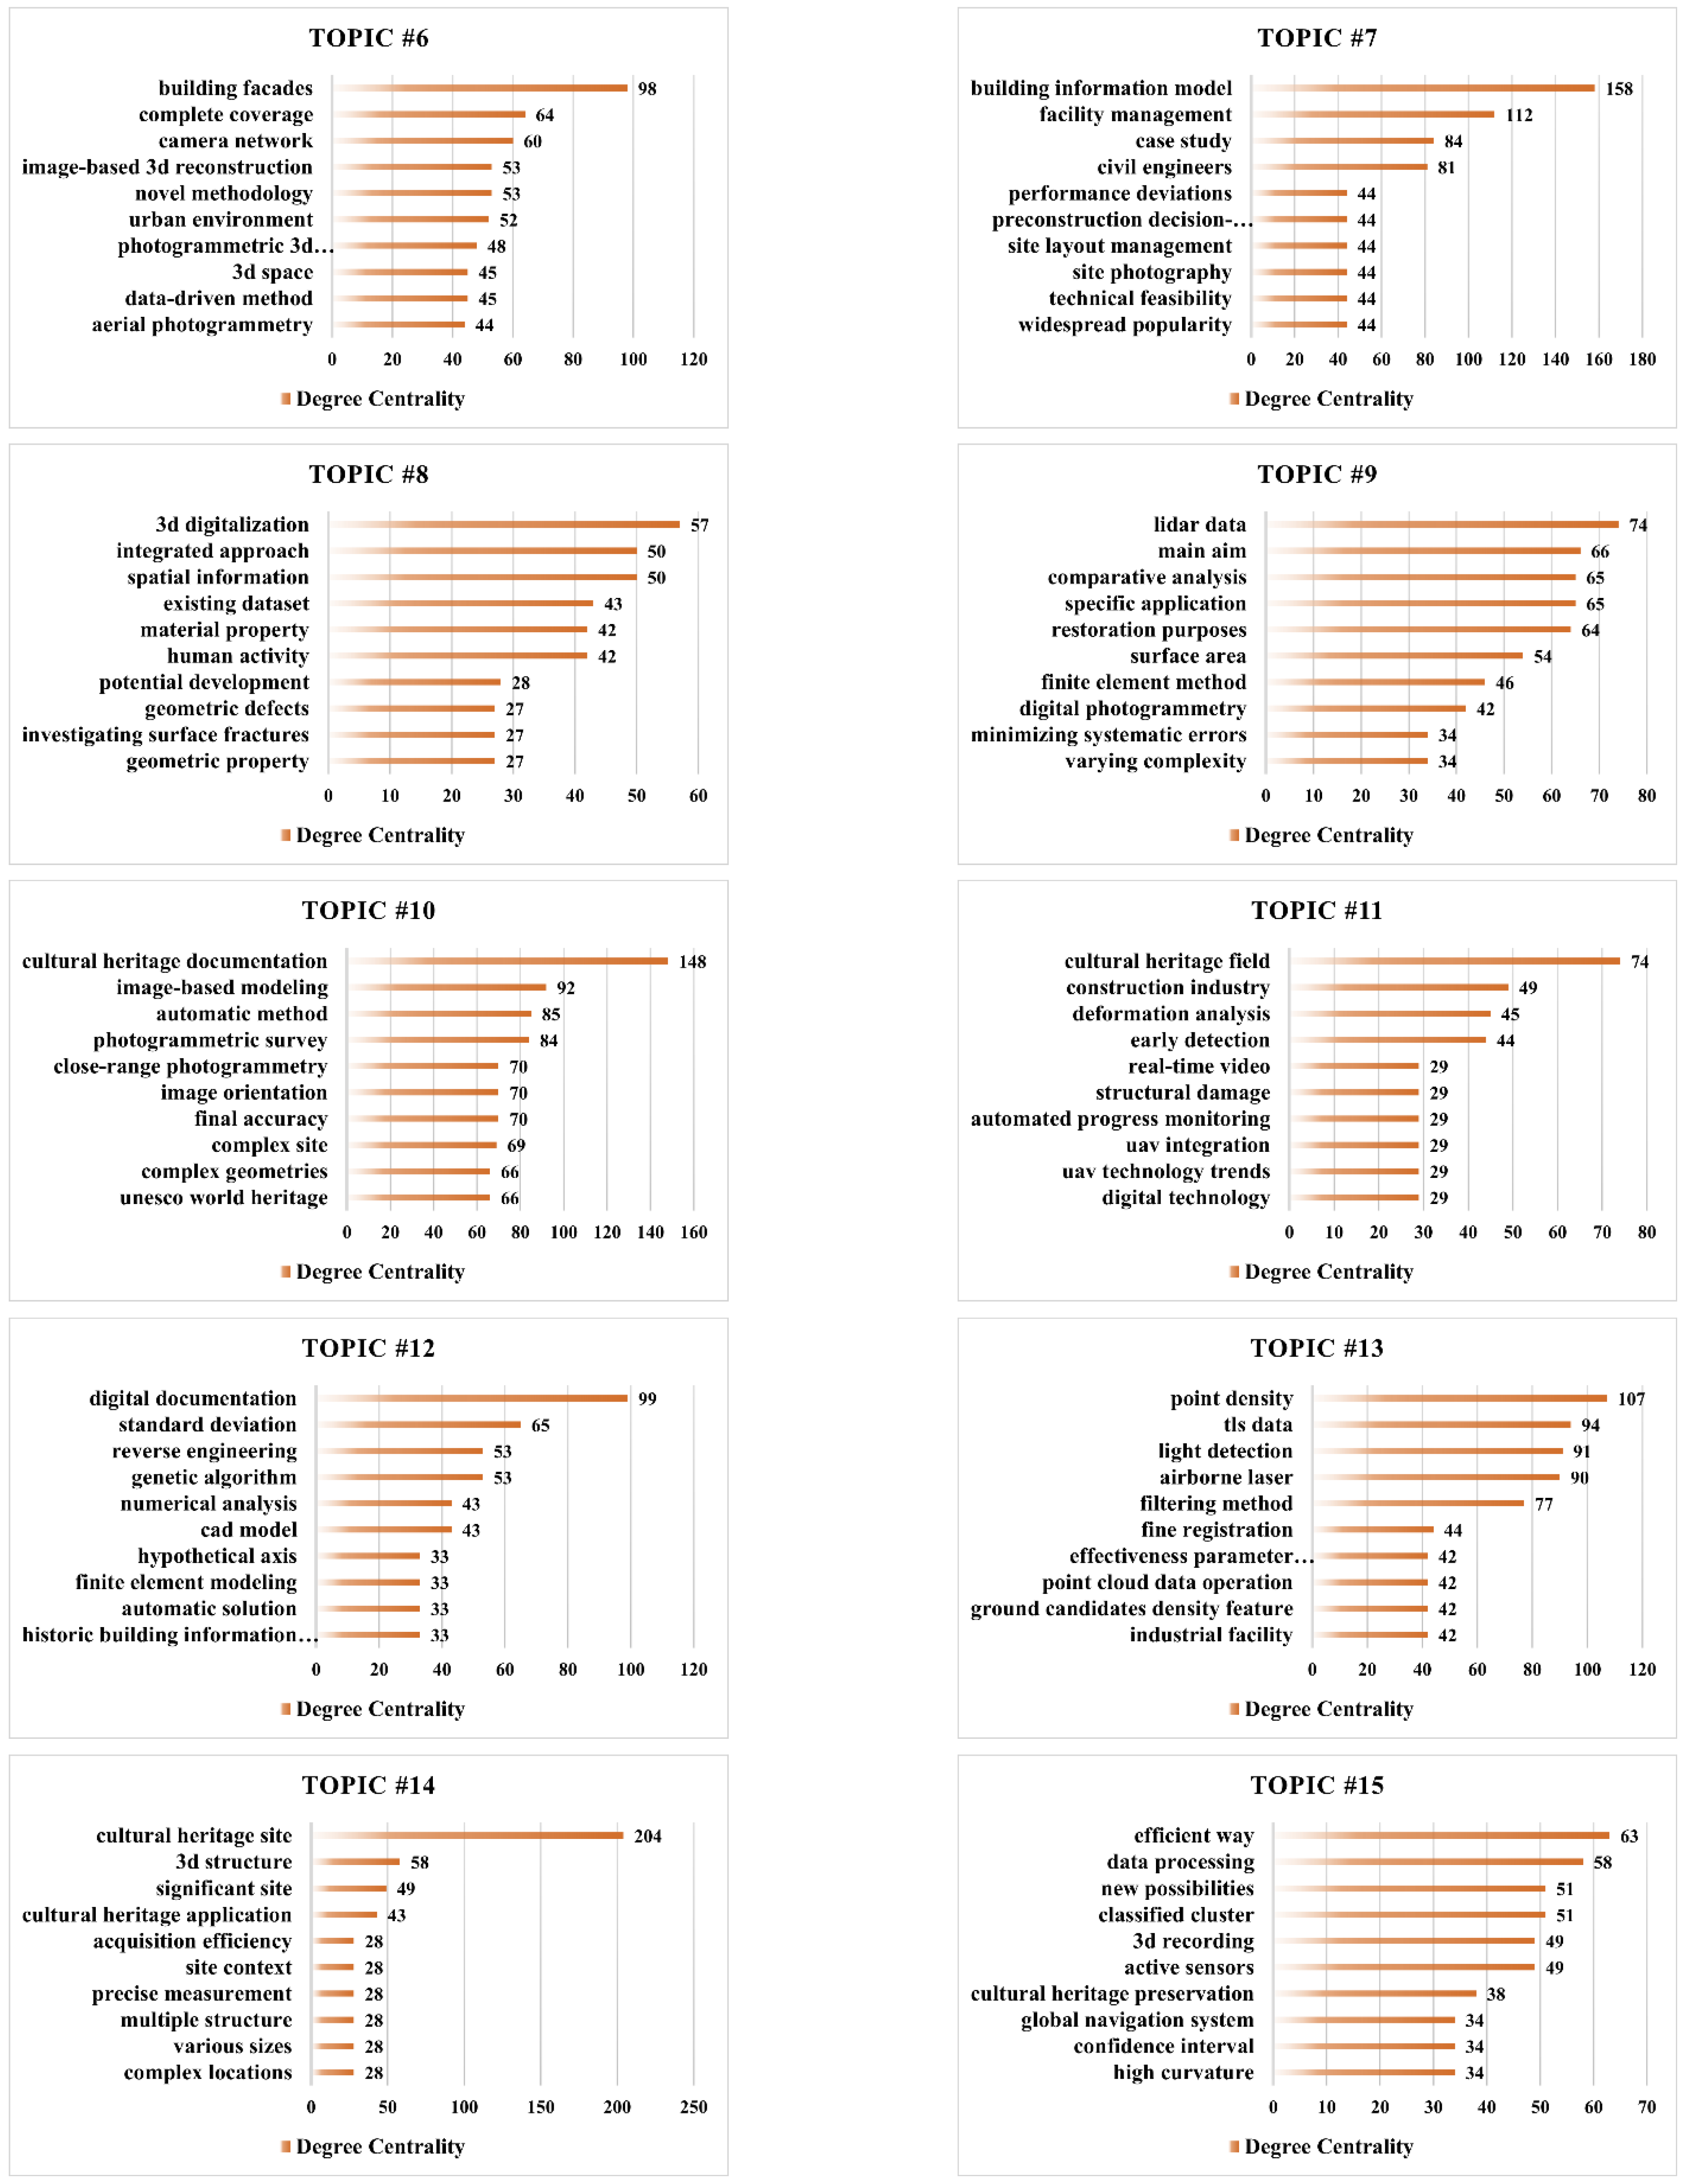
4.1. Term Co-Occurrence Network Analysis
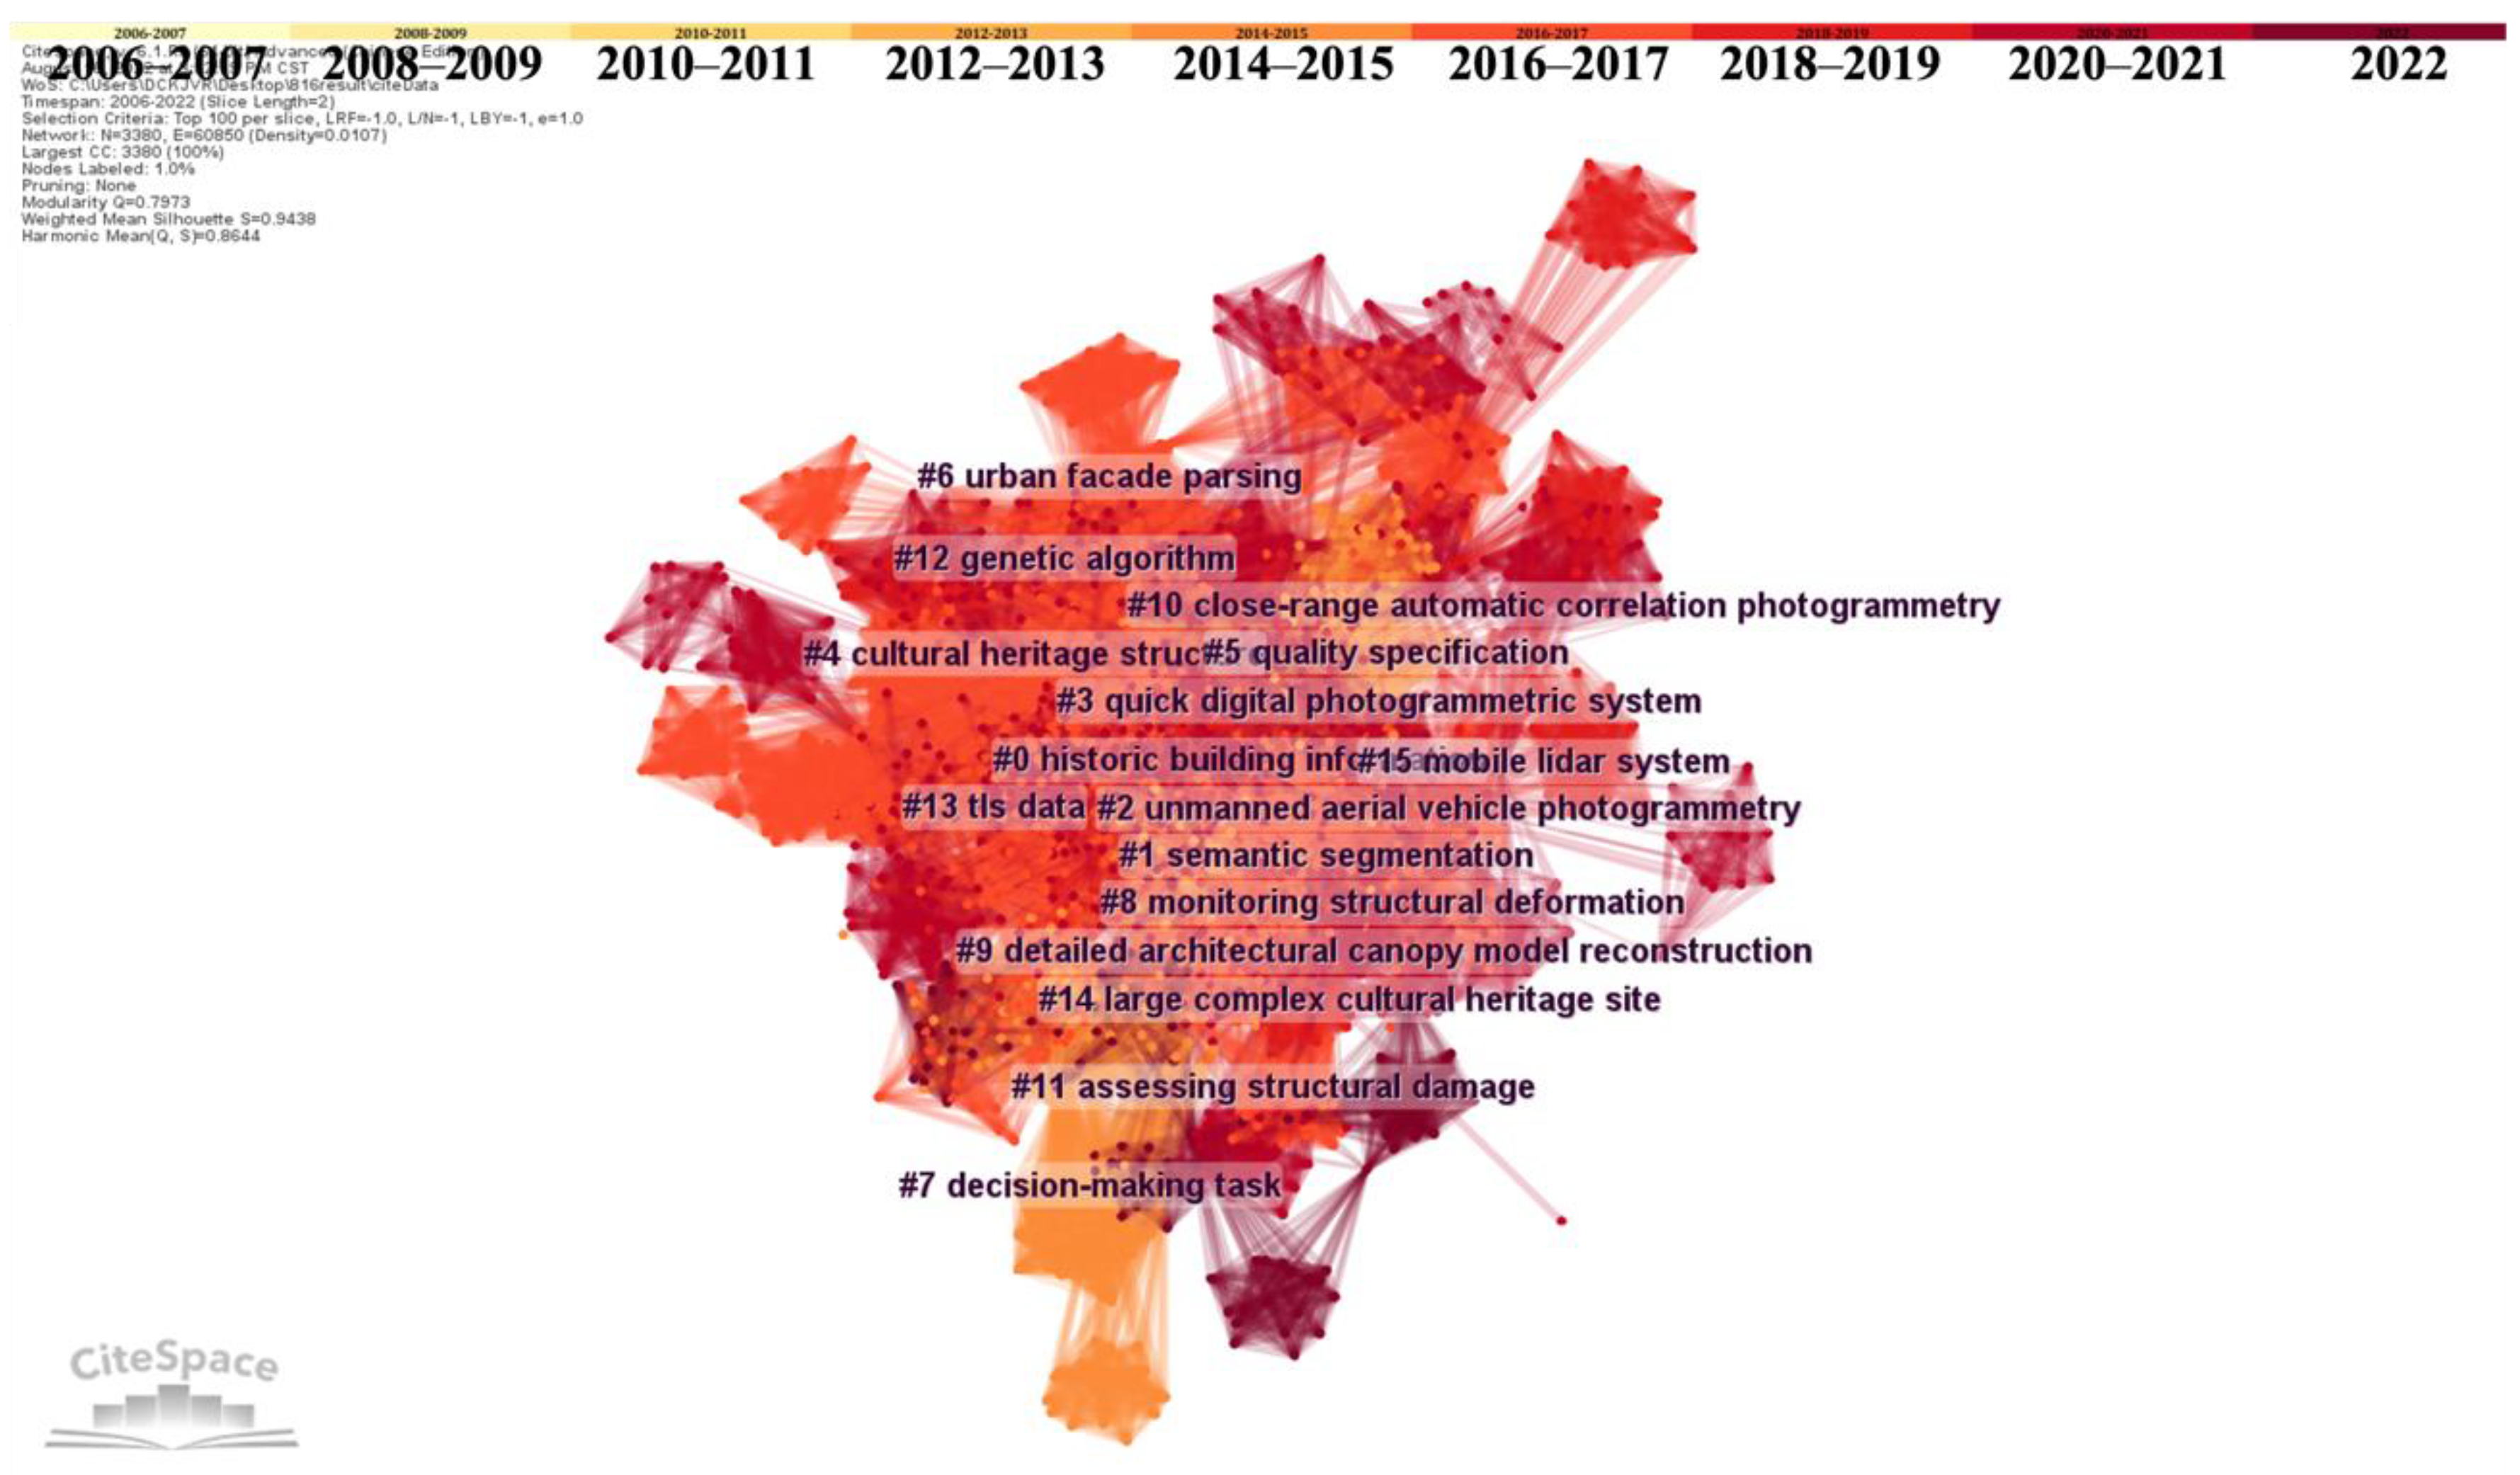
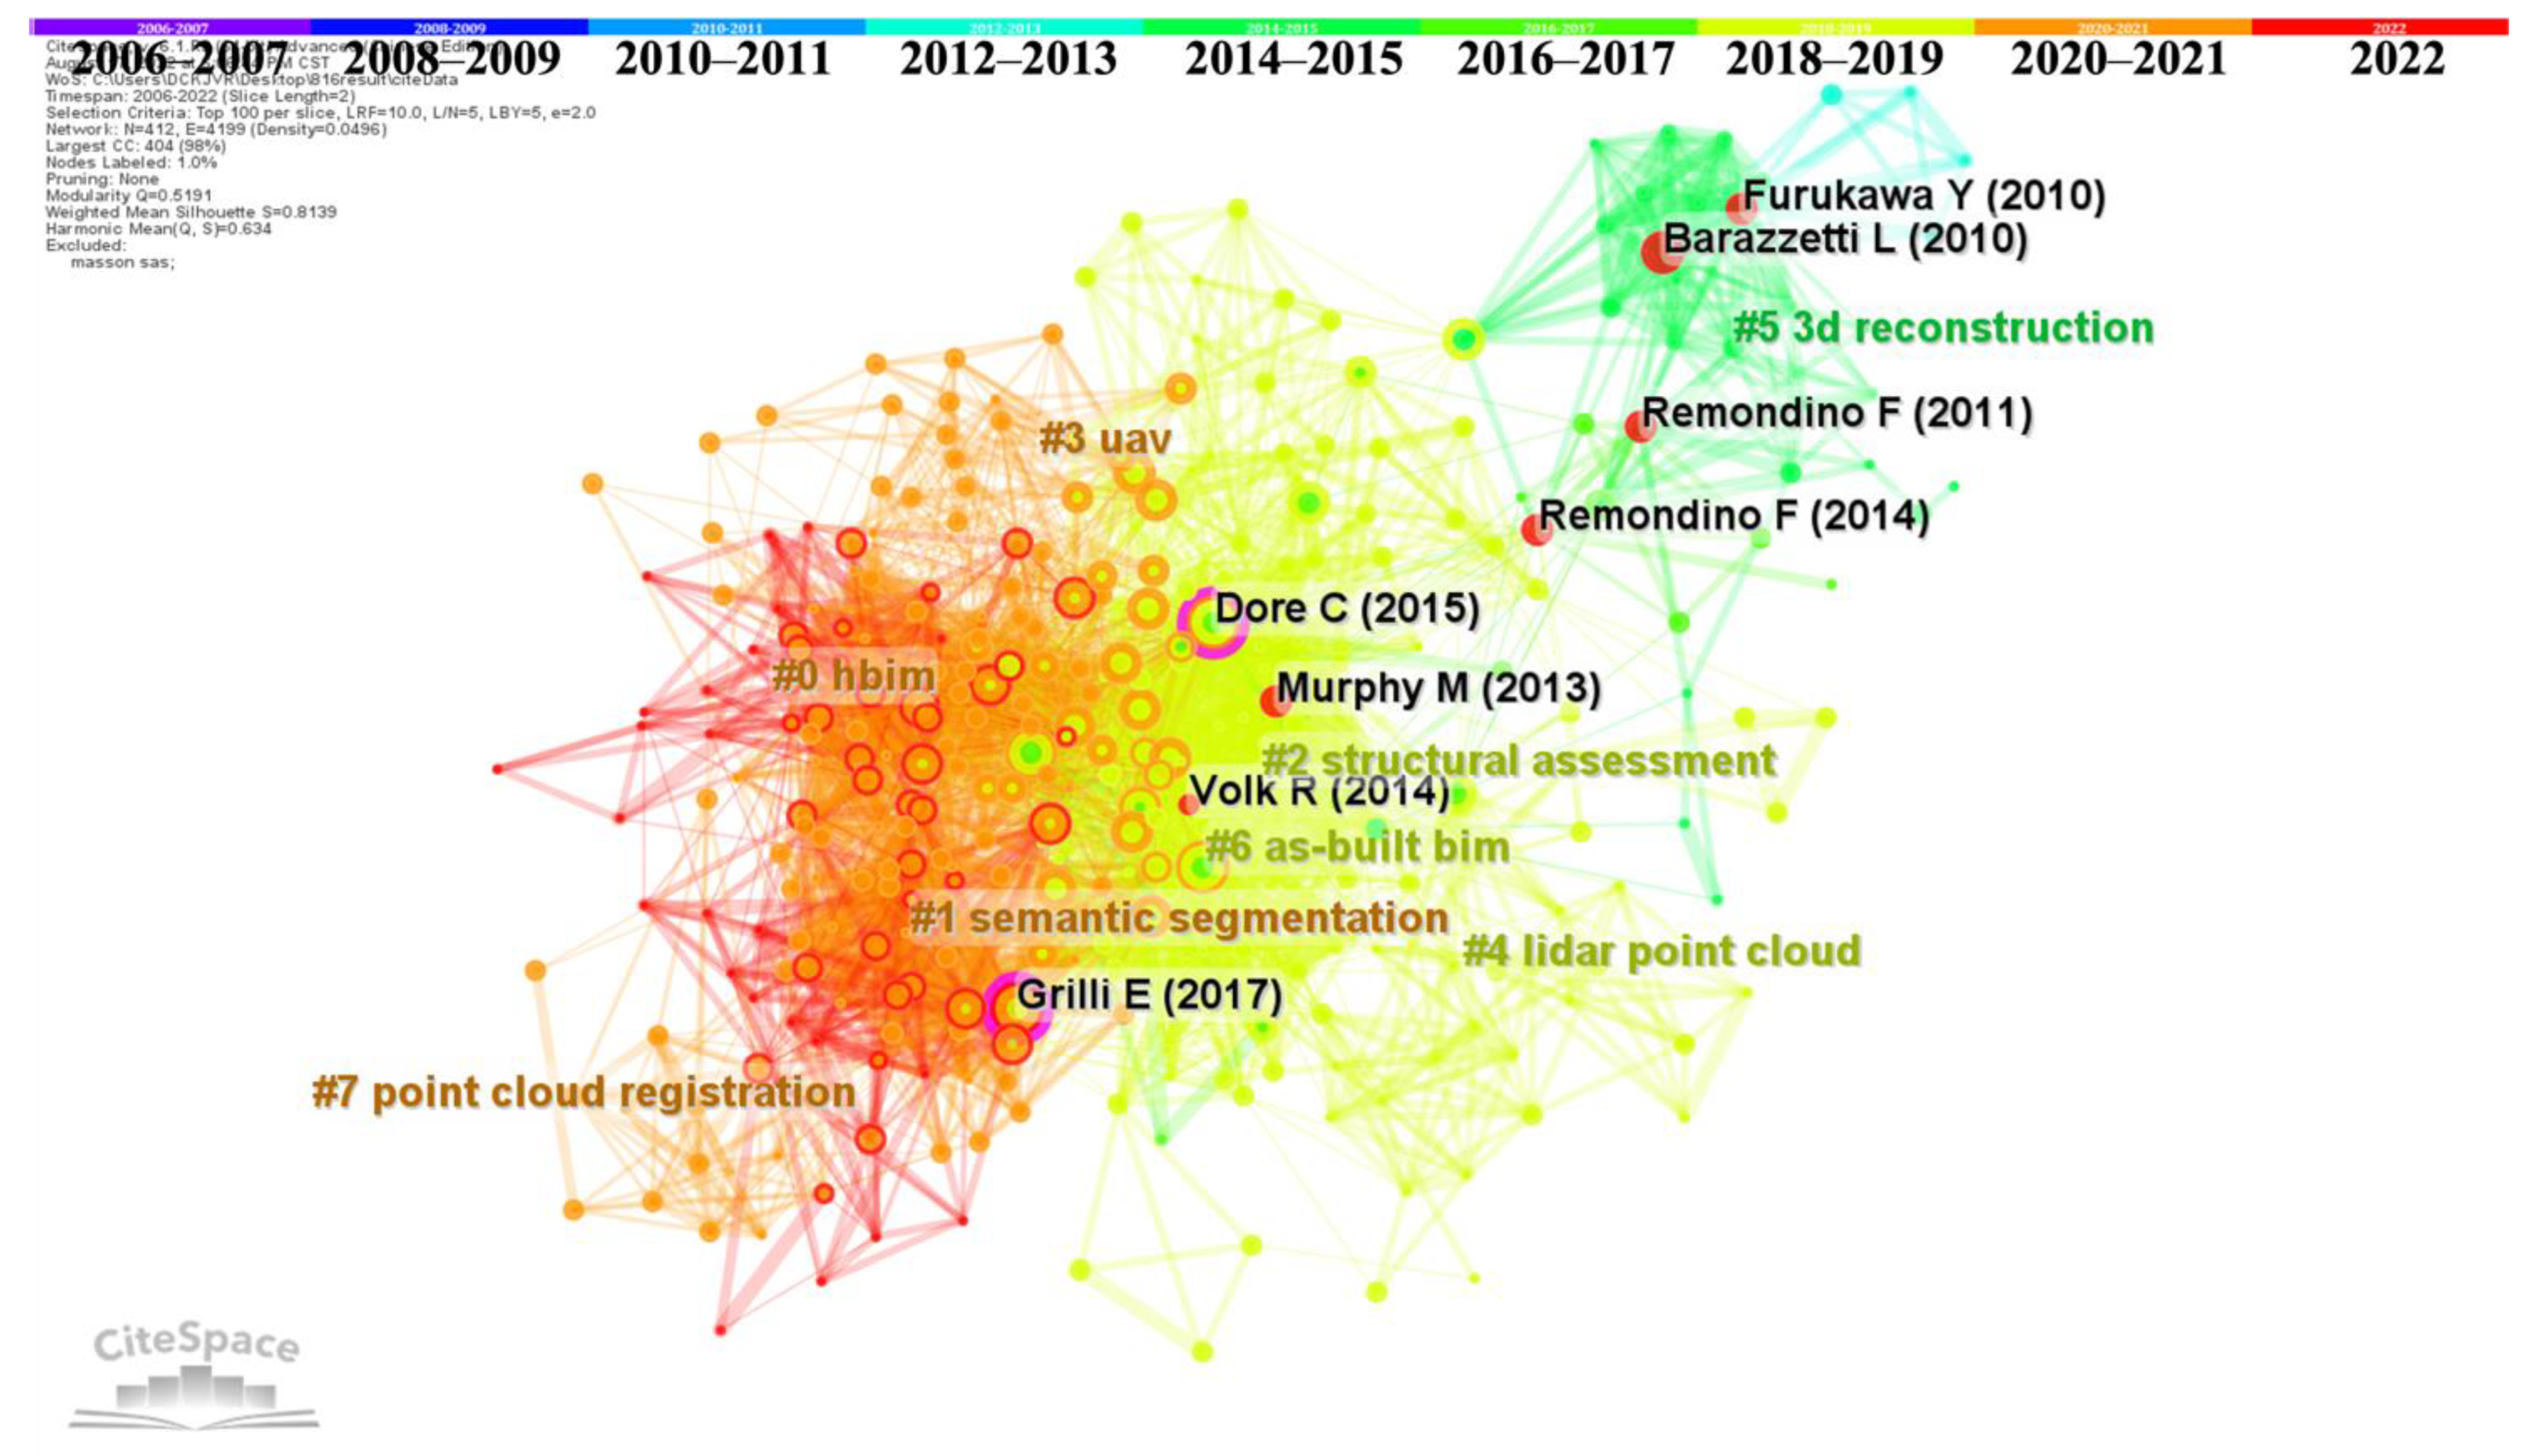
4.2. Document Co-Citation Network Analysis

| Author | Year | Journal Abbr. | Title |
|---|---|---|---|
| Articles with high betweenness centrality score | |||
| Grilli et al. [118] | 2017 | Int Arch Photogramm | A review of point clouds segmentation and classification algorithms |
| Dore et al. [119] | 2015 | Int Arch Photogramm | Structural simulations and conservation analysis Historic Building Information Model (HBIM) |
| Articles with strong citation burst | |||
| Furukawa et al. [120] | 2010 | IEEE T Pattern Anal | Accurate, sense, and robust Multiview stereopsis |
| Remondino et al. [123] | 2014 | Photogramm Rec | State of the art in high density image matching |
| Barazzetti et al. [121] | 2010 | Photogramm Rec | Orientation and 3D modelling from markerless terrestrial images: combining accuracy with automation |
| Volk et al. [125] | 2014 | Automat Constr | Building Information Modeling (BIM) for existing buildings—Literature review and future needs |
| Remondino et al. [122] | 2011 | Remote Sens-Basel | Heritage recording and 3D modeling with photogrammetry and 3D scanning |
| Murphy et al. [124] | 2013 | ISPRS J Photogramm | Historic Building Information Modelling—Adding intelligence to laser and image based surveys of European classical architecture |
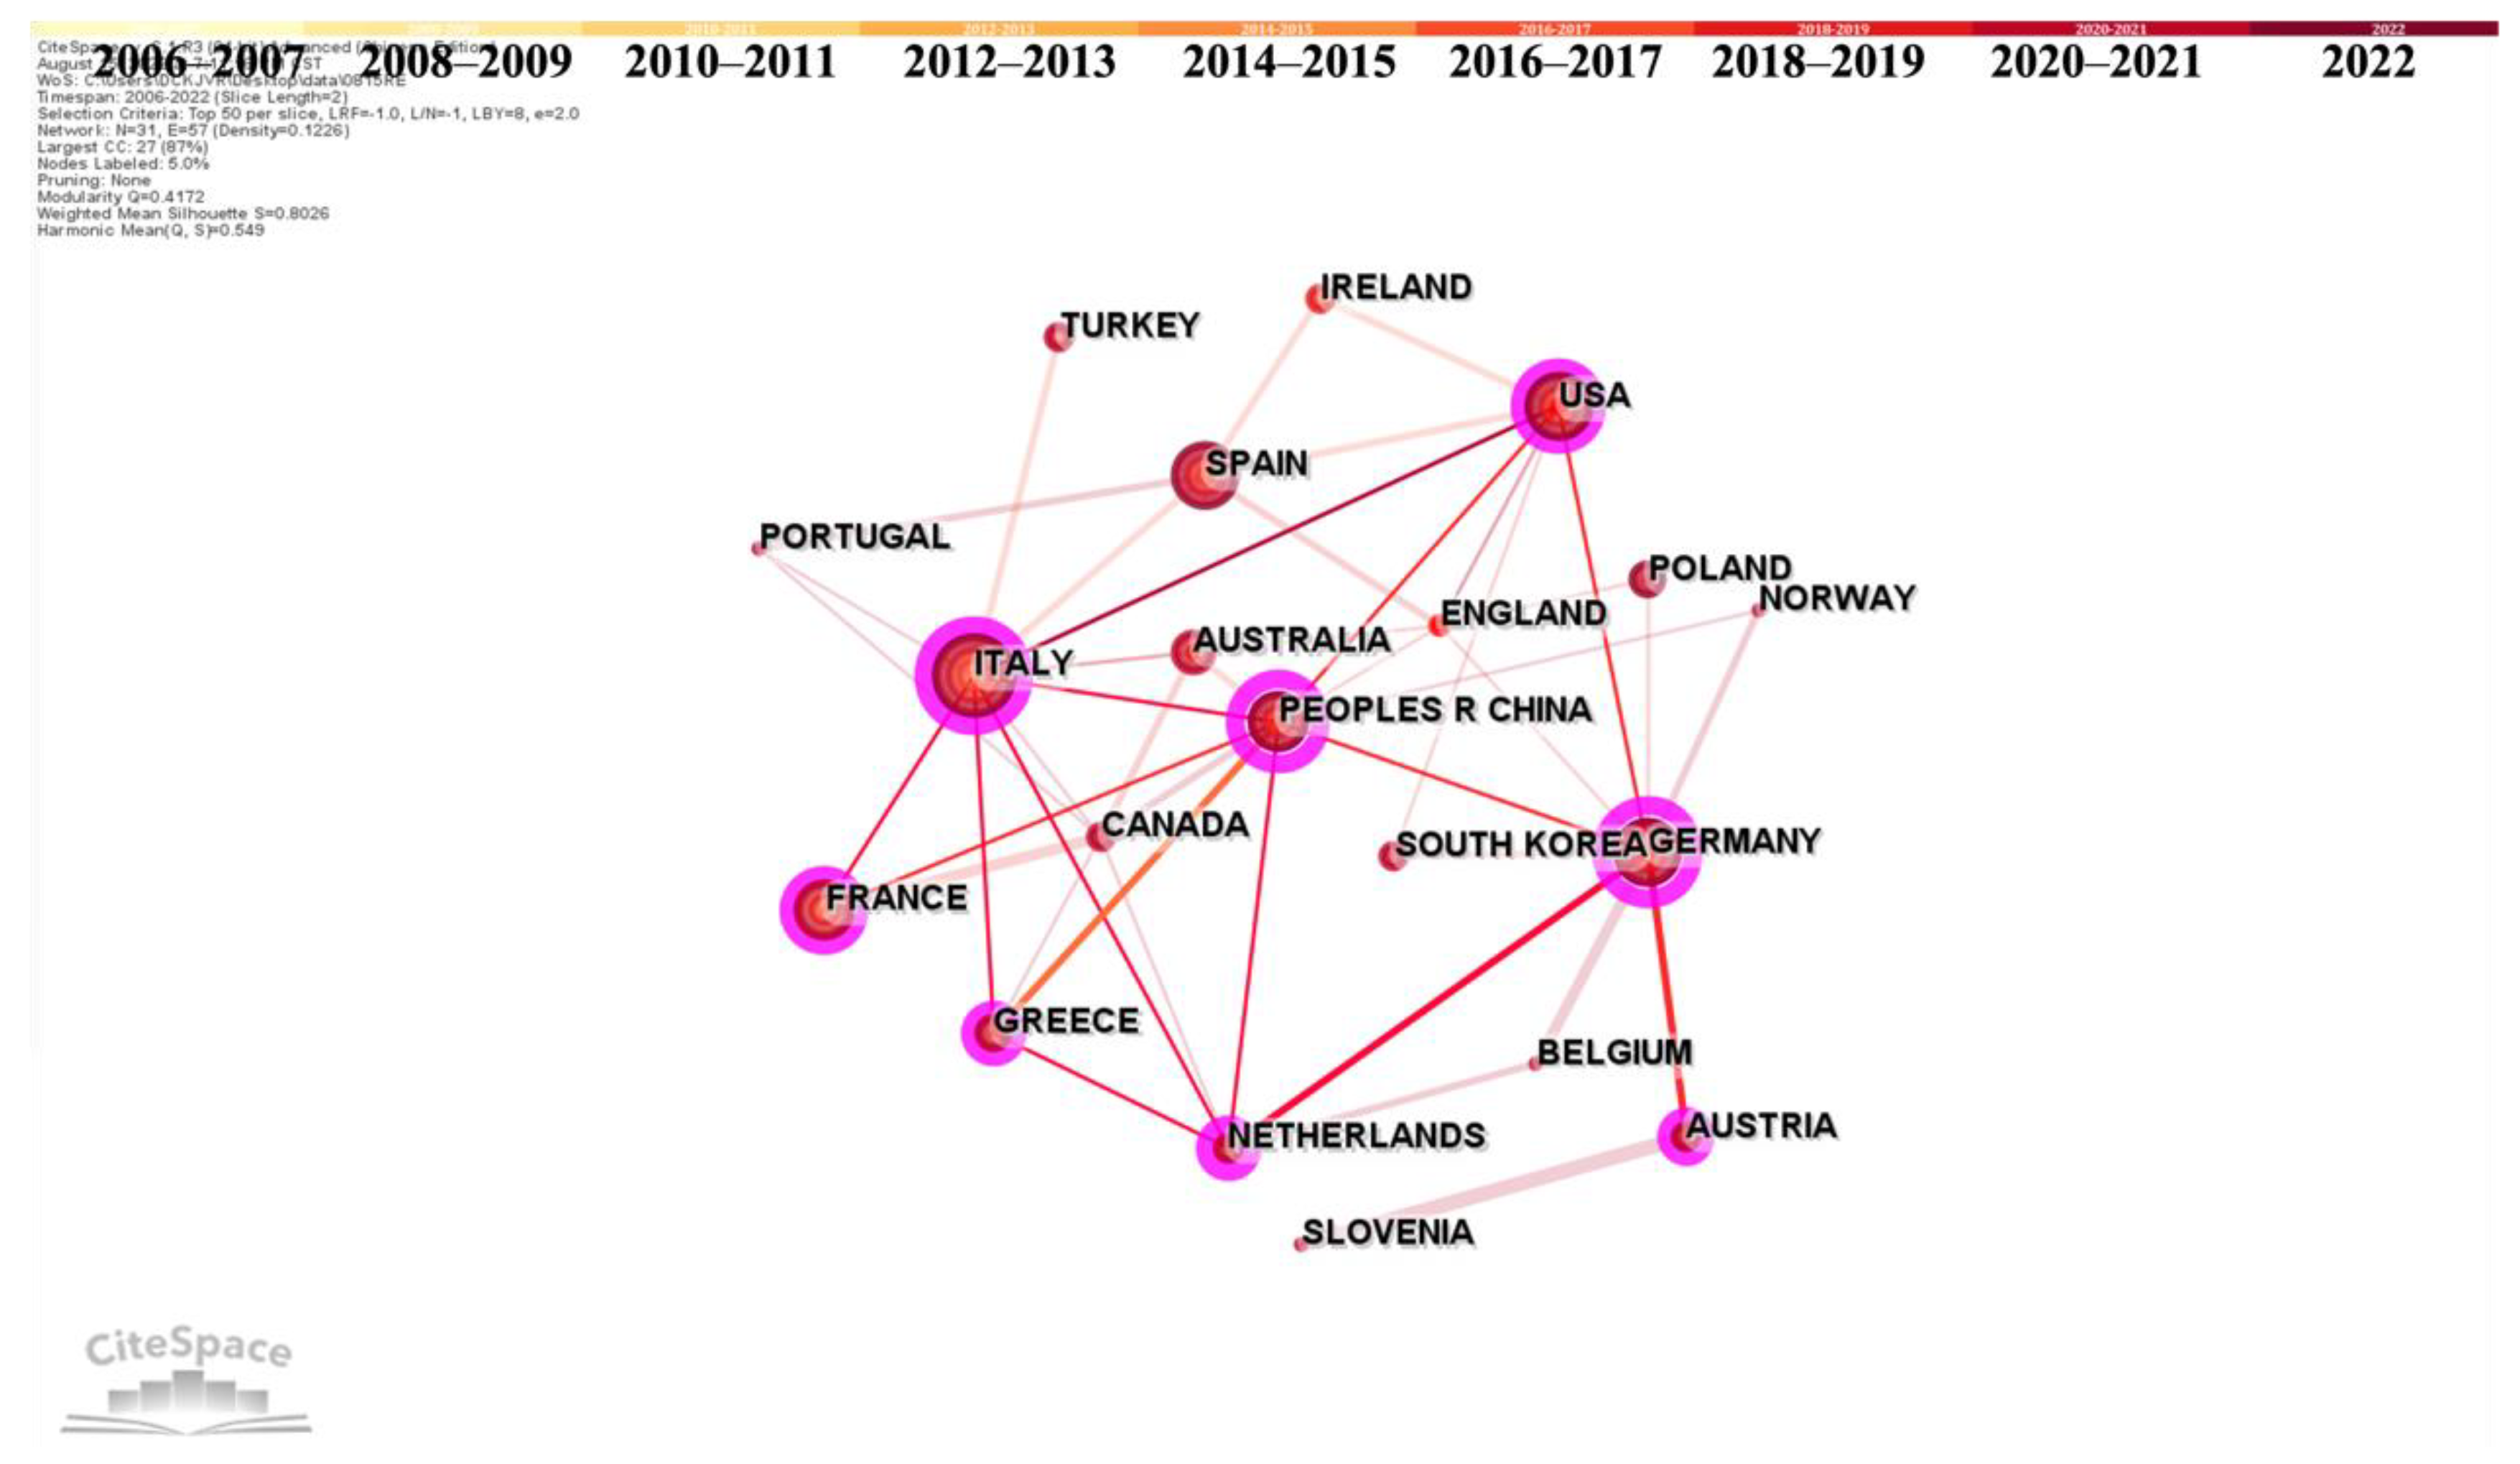
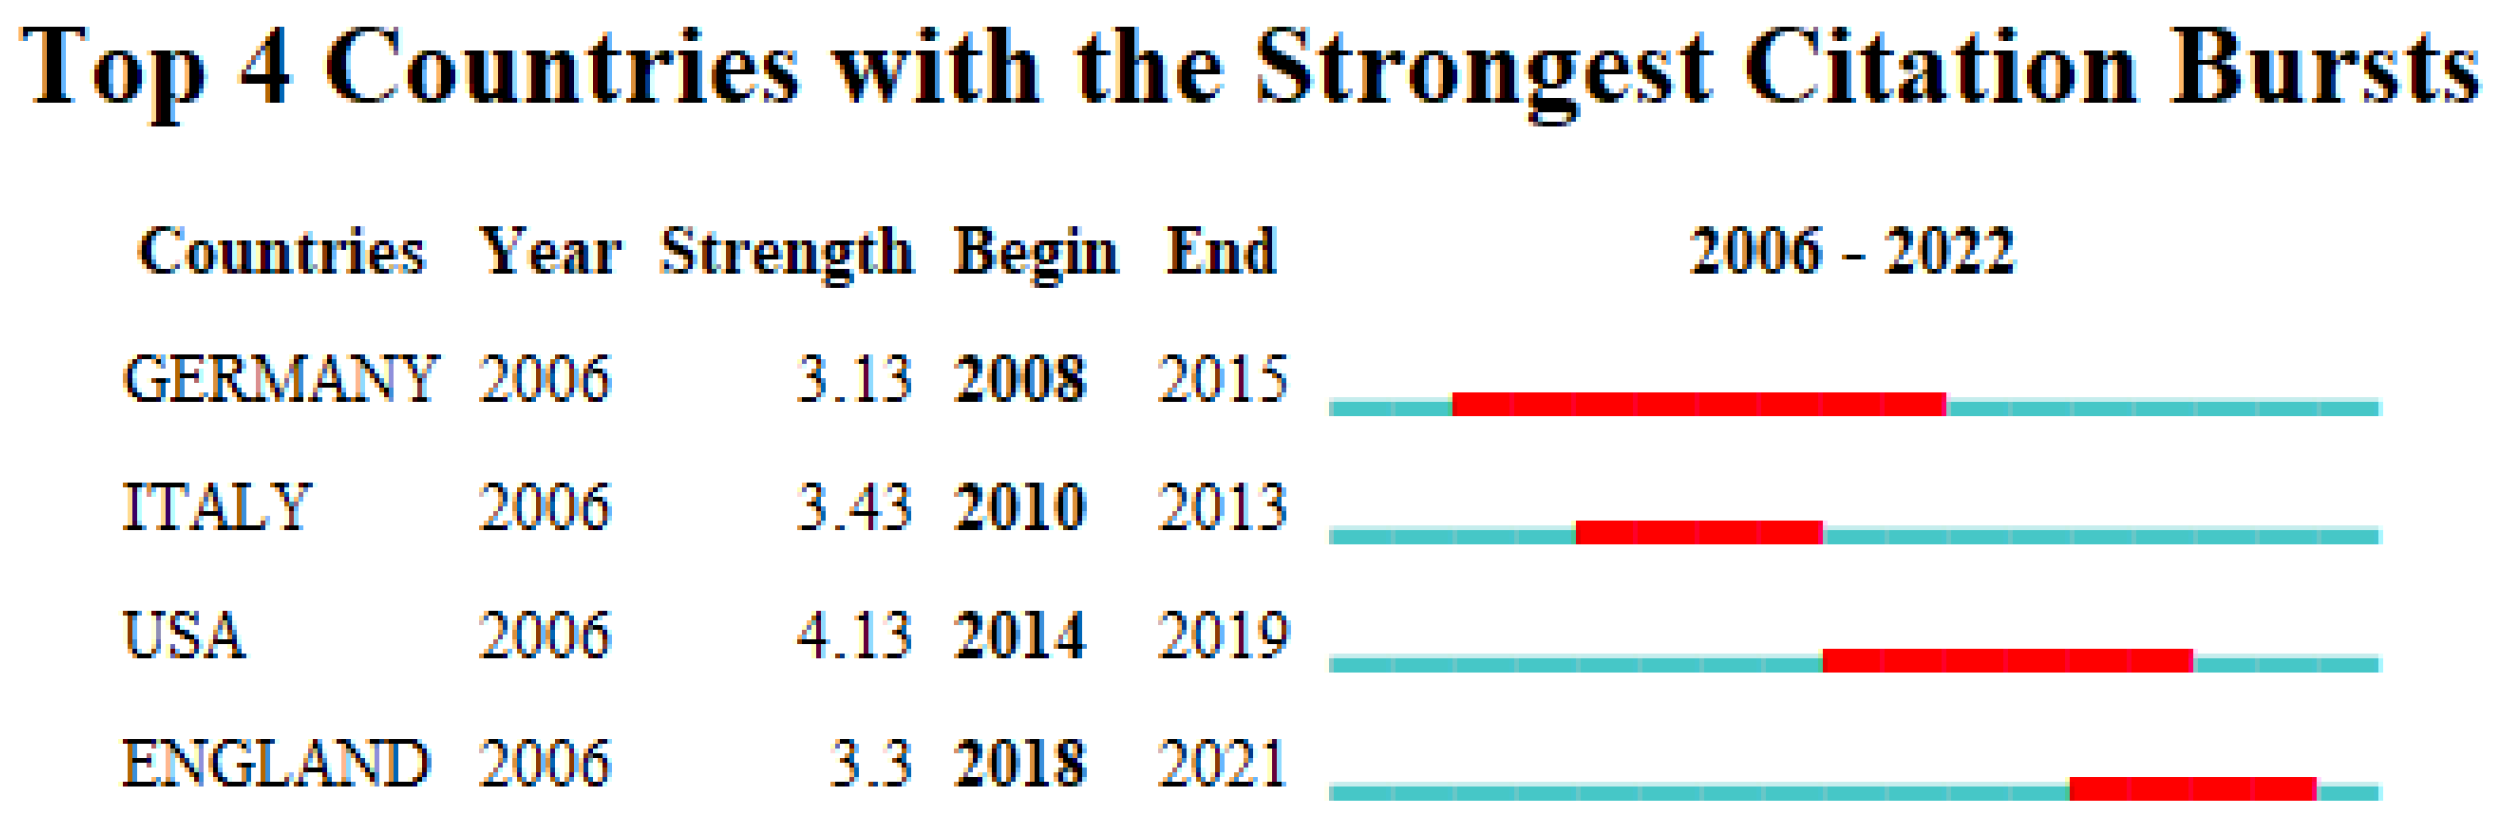
4.3. Collaborative Country Network Analysis
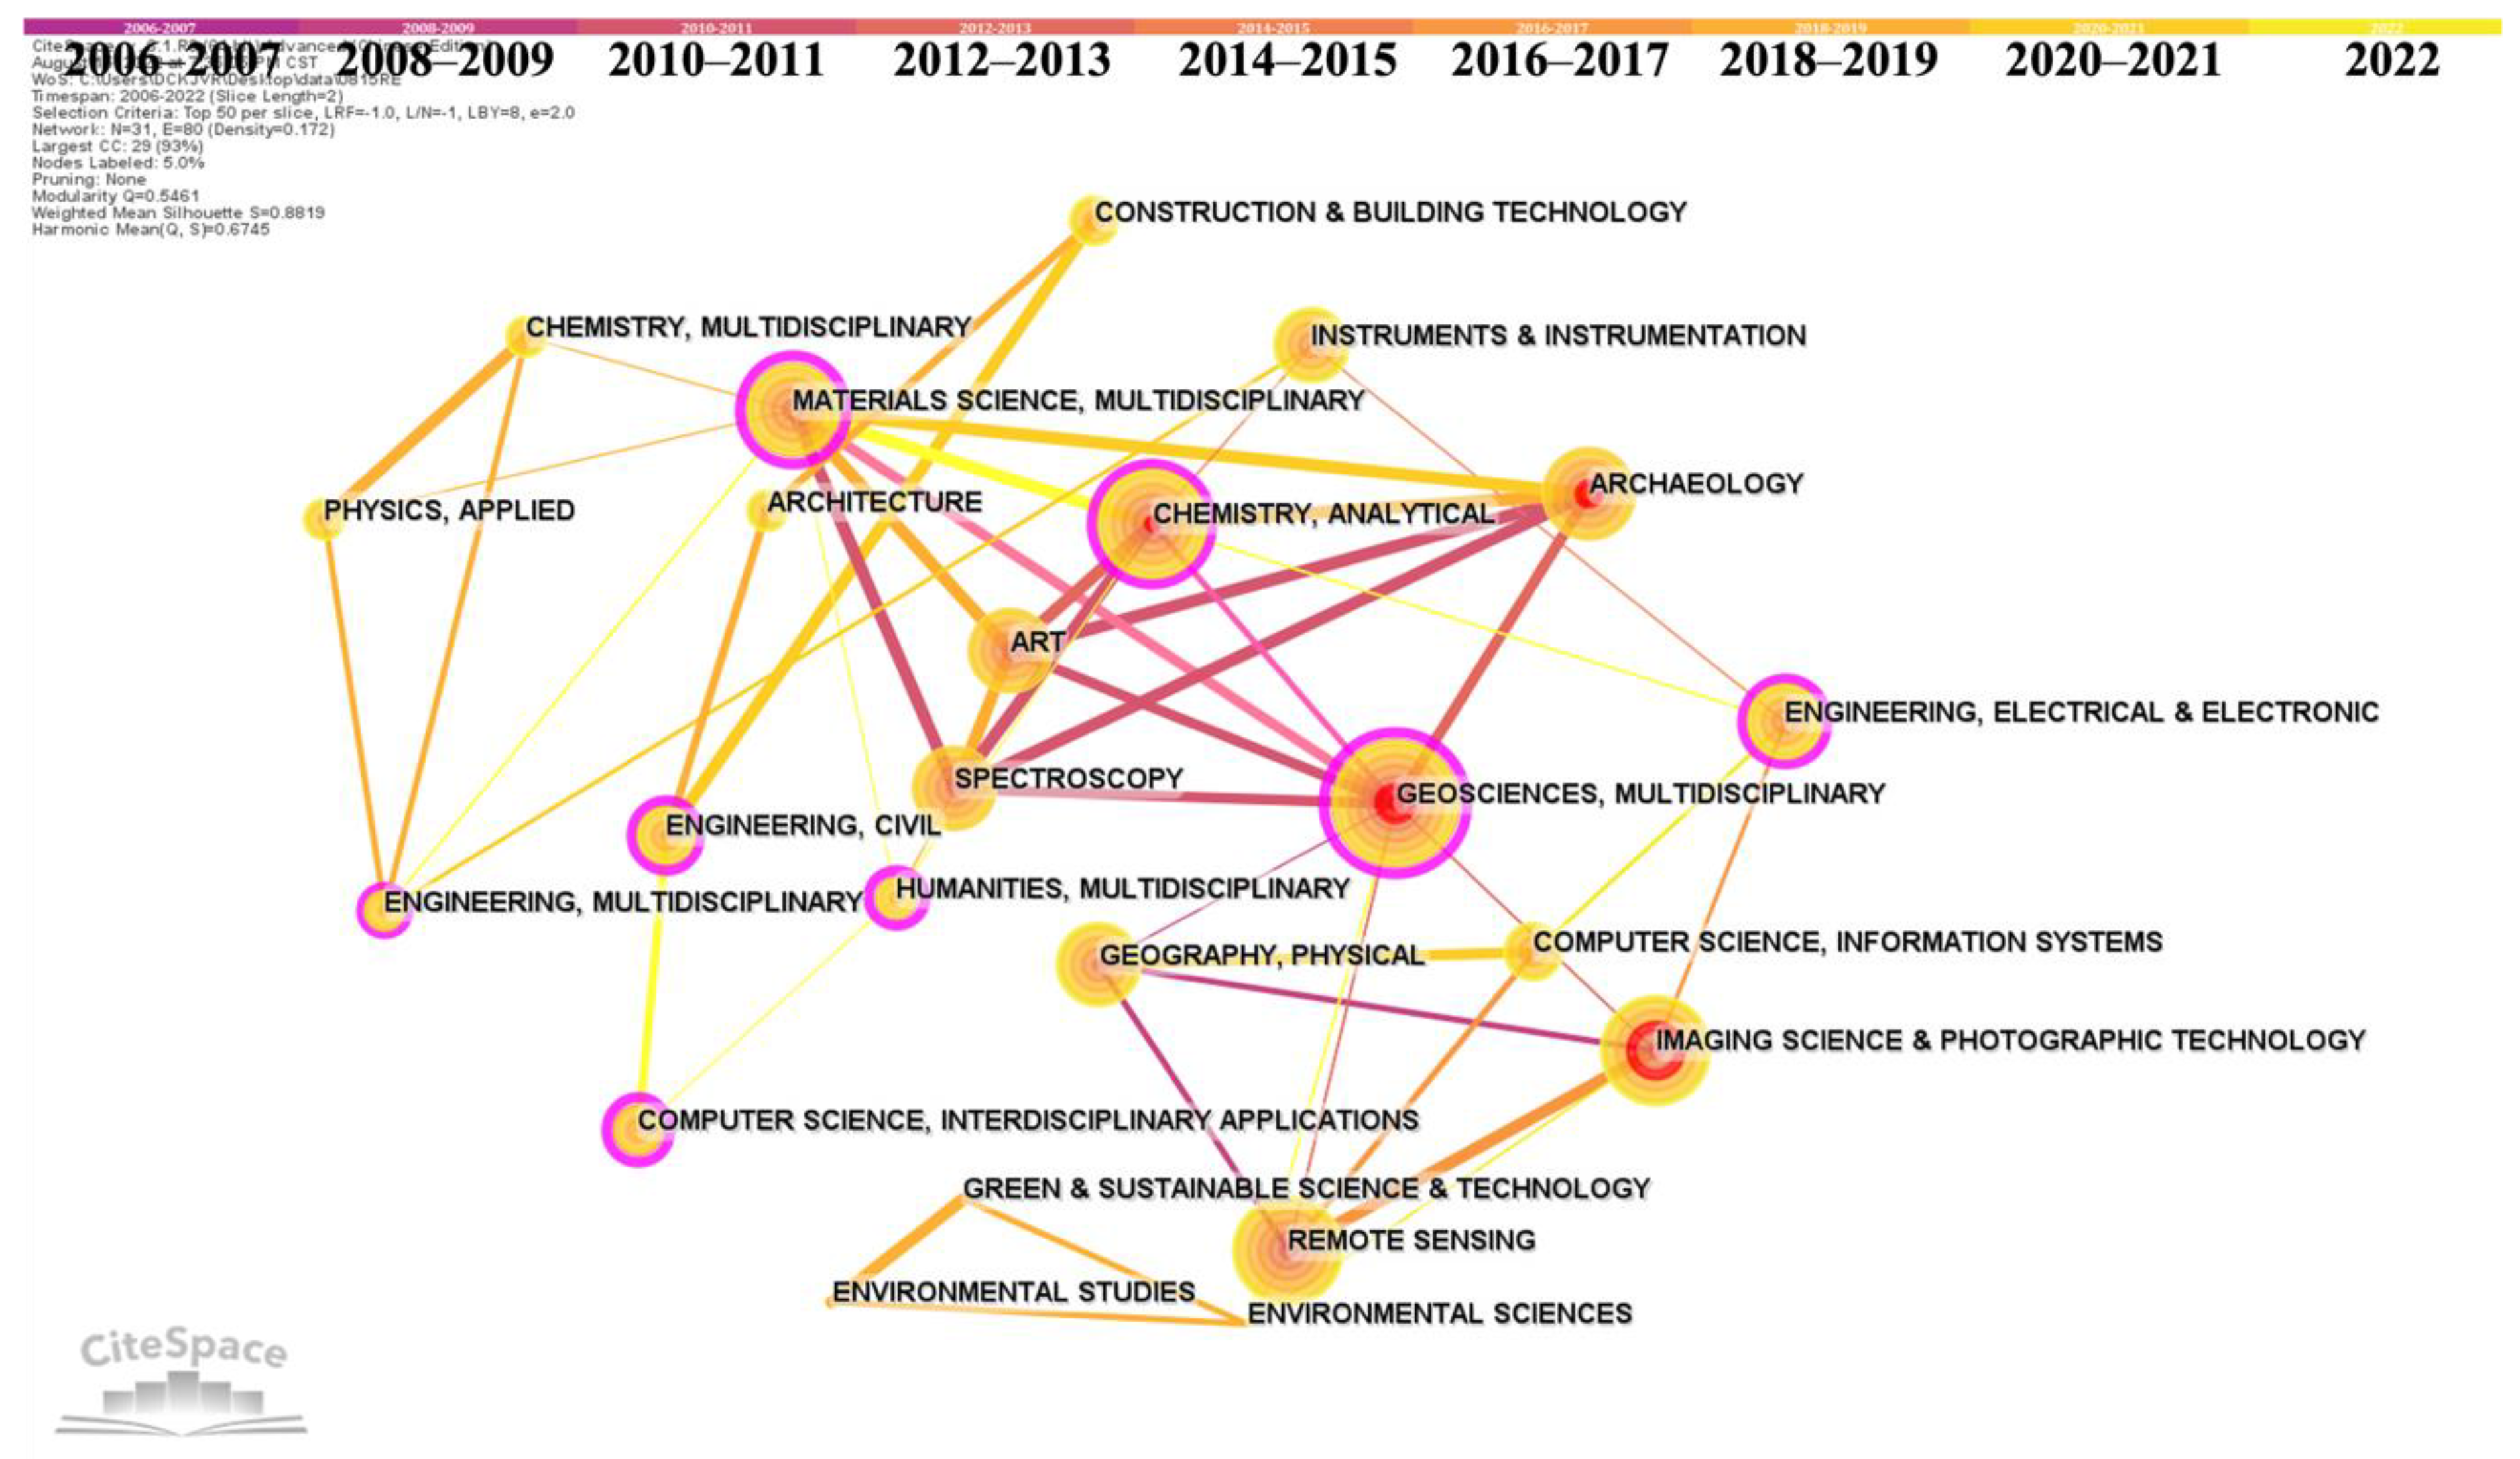
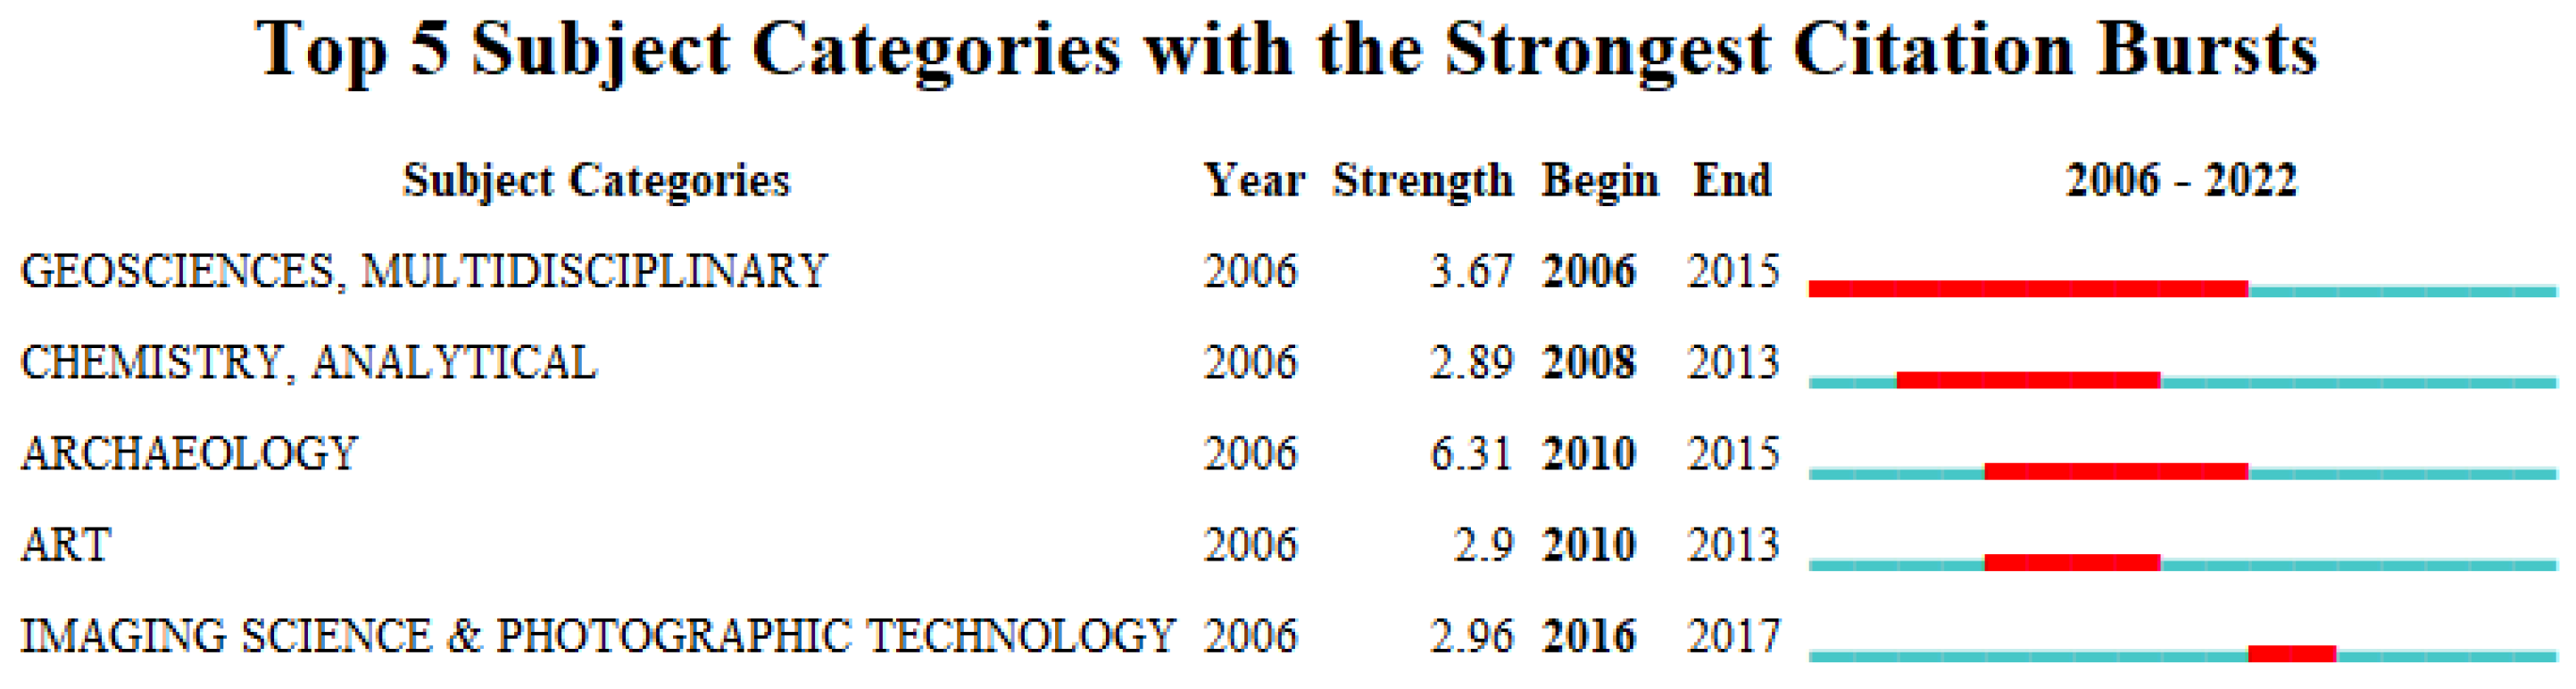
4.4. Category Co-Occurrence Network Analysis
5. Conclusions
Funding
Conflicts of Interest
References
- Wang, Q.; Kim, M.-K. Applications of 3D point cloud data in the construction industry: A fifteen-year review from 2004 to 2018. Adv. Eng. Inform. 2019, 39, 306–319. [Google Scholar] [CrossRef]
- Doulamis, A.; Voulodimos, A.; Protopapadakis, E.; Doulamis, N.; Makantasis, K. Automatic 3D Modeling and Reconstruction of Cultural Heritage Sites from Twitter Images. Sustainability 2020, 12, 4223. [Google Scholar] [CrossRef]
- Lu, Q.; Lee, S. Image-based technologies for constructing as-is building information models for existing buildings. J. Comput. Civ. Eng. 2017, 31, 04017005. [Google Scholar] [CrossRef]
- Tang, P.; Huber, D.; Akinci, B.; Lipman, R.; Lytle, A. Automatic reconstruction of as-built building information models from laser-scanned point clouds: A review of related techniques. Autom. Constr. 2010, 19, 829–843. [Google Scholar] [CrossRef]
- Acke, L.; De Vis, K.; Verwulgen, S.; Verlinden, J. Survey and literature study to provide insights on the application of 3D technologies in objects conservation and restoration. J. Cult. Herit. 2021, 49, 272–288. [Google Scholar] [CrossRef]
- Aicardi, I.; Chiabrando, F.; Lingua, A.M.; Noardo, F. Recent trends in cultural heritage 3D survey: The photogrammetric computer vision approach. J. Cult. Herit. 2018, 32, 257–266. [Google Scholar] [CrossRef]
- Yastikli, N. Documentation of cultural heritage using digital photogrammetry and laser scanning. J. Cult. Herit. 2007, 8, 423–427. [Google Scholar] [CrossRef]
- Guidi, G.; Beraldin, J.-A.; Atzeni, C. High-accuracy 3D modeling of cultural heritage: The digitizing of Donatello’s “Maddalena”. IEEE Trans. Image Process. 2004, 13, 370–380. [Google Scholar] [CrossRef]
- Pavlidis, G.; Koutsoudis, A.; Arnaoutoglou, F.; Tsioukas, V.; Chamzas, C. Methods for 3D digitization of cultural heritage. J. Cult. Herit. 2007, 8, 93–98. [Google Scholar] [CrossRef] [Green Version]
- Pieraccini, M.; Guidi, G.; Atzeni, C. 3D digitizing of cultural heritage. J. Cult. Herit. 2001, 2, 63–70. [Google Scholar] [CrossRef]
- Korumaz, M.; Betti, M.; Conti, A.; Tucci, G.; Bartoli, G.; Bonora, V.; Korumaz, A.G.; Fiorini, L. An integrated Terrestrial Laser Scanner (TLS), Deviation Analysis (DA) and Finite Element (FE) approach for health assessment of historical structures. A minaret case study. Eng. Struct. 2017, 153, 224–238. [Google Scholar] [CrossRef]
- Micoli, L.; Guidi, G.; Angheleddu, D.; Russo, M. A multidisciplinary approach to 3D survey and reconstruction of historical buildings. In Proceedings of the 2013 Digital Heritage International Congress (DigitalHeritage), Marseille, France, 28 October–1 November 2013; pp. 241–248. [Google Scholar]
- Poux, F.; Valembois, Q.; Mattes, C.; Kobbelt, L.; Billen, R. Initial user-centered design of a virtual reality heritage system: Applications for digital tourism. Remote Sens. 2020, 12, 2583. [Google Scholar] [CrossRef]
- Yang, W.-B.; Chen, M.-B.; Yen, Y.-N. An application of digital point cloud to historic architecture in digital archives. Adv. Eng. Softw. 2011, 42, 690–699. [Google Scholar] [CrossRef]
- Cheng, L.; Chen, S.; Liu, X.; Xu, H.; Wu, Y.; Li, M.; Chen, Y. Registration of laser scanning point clouds: A review. Sensors 2018, 18, 1641. [Google Scholar] [CrossRef] [Green Version]
- 1Tobiasz, A.; Markiewicz, J.; Łapiński, S.; Nikel, J.; Kot, P.; Muradov, M. Review of Methods for Documentation, Management, and Sustainability of Cultural Heritage. Case Study: Museum of King Jan III’s Palace at Wilanów. Sustainability 2019, 11, 7046. [Google Scholar] [CrossRef] [Green Version]
- Moyano, J.; León, J.; Nieto-Julián, J.E.; Bruno, S. Semantic interpretation of architectural and archaeological geometries: Point cloud segmentation for HBIM parameterisation. Autom. Constr. 2021, 130, 103856. [Google Scholar] [CrossRef]
- Santos, D.; Sousa, H.S.; Cabaleiro, M.; Branco, J.M. HBIM Application in Historic Timber Structures: A Systematic Review. Int. J. Archit. Herit. 2022, 1–15. [Google Scholar] [CrossRef]
- Leydesdorff, L.; Milojević, S. Scientometrics. In International Encyclopedia of the Social & Behavioral Sciences; Elsevier: Amsterdam, The Netherlands, 2015; pp. 322–327. [Google Scholar]
- Fortunato, S.; Bergstrom, C.T.; Börner, K.; Evans, J.A.; Helbing, D.; Milojević, S.; Petersen, A.M.; Radicchi, F.; Sinatra, R.; Uzzi, B. Science of science. Science 2018, 359, eaao0185. [Google Scholar] [CrossRef] [Green Version]
- Zhao, X. A scientometric review of global BIM research: Analysis and visualization. Autom. Constr. 2017, 80, 37–47. [Google Scholar] [CrossRef]
- Martinez, P.; Al-Hussein, M.; Ahmad, R. A scientometric analysis and critical review of computer vision applications for construction. Autom. Constr. 2019, 107. [Google Scholar] [CrossRef]
- Rashidi, M.; Mohammadi, M.; Kivi, S.S.; Abdolvand, M.M.; Linh, T.H.; Samali, B. A Decade of Modern Bridge Monitoring Using Terrestrial Laser Scanning: Review and Future Directions. Remote Sens. 2020, 12, 3796. [Google Scholar] [CrossRef]
- Balz, T. Scientometric Full-Text Analysis of Papers Published in Remote Sensing between 2009 and 2021. Remote Sens. 2022, 14, 4285. [Google Scholar] [CrossRef]
- Chen, C.; Dubin, R.; Kim, M.C. Orphan drugs and rare diseases: A scientometric review (2000–2014). Expert Opin. Orphan Drugs 2014, 2, 709–724. [Google Scholar] [CrossRef]
- Chen, C. Searching for intellectual turning points: Progressive knowledge domain visualization. Proc. Natl. Acad. Sci. USA 2004, 101, 5303–5310. [Google Scholar] [CrossRef] [Green Version]
- Arapakopoulos, A.; Liaskos, O.; Mitsigkola, S.; Papatzanakis, G.; Peppa, S.; Remoundos, G.; Ginnis, A.; Papadopoulos, C.; Mazis, D.; Tsilikidis, O.; et al. 3D Reconstruction & Modeling of the Traditional Greek Trechadiri: “Aghia Varvara”. Heritage 2022, 5, 1295–1309. [Google Scholar] [CrossRef]
- Mihu-Pintilie, A.; Brașoveanu, C.; Stoleriu, C.C. Using UAV Survey, High-Density LiDAR Data and Automated Relief Analysis for Habitation Practices Characterization during the Late Bronze Age in NE Romania. Remote Sens. 2022, 14, 2466. [Google Scholar] [CrossRef]
- Li, J.; Yang, B.; Chen, C.; Habib, A. NRLI-UAV: Non-rigid registration of sequential raw laser scans and images for low-cost UAV LiDAR point cloud quality improvement. ISPRS J. Photogramm. Remote Sens. 2019, 158, 123–145. [Google Scholar] [CrossRef]
- Garcia-Gago, J.; Gonzalez-Aguilera, D.; Gomez-Lahoz, J.; San Jose-Alonso, J.I. A Photogrammetric and Computer Vision-Based Approach for Automated 3D Architectural Modeling and Its Typological Analysis. Remote Sens. 2014, 6, 5671–5691. [Google Scholar] [CrossRef] [Green Version]
- Salonia, P.; Scolastico, S.; Pozzi, A.; Marcolongo, A.; Messina, T.L. Multi-scale cultural heritage survey: Quick digital photogrammetric systems. J. Cult. Herit. 2009, 10, E59–E64. [Google Scholar] [CrossRef]
- Leonov, A.V.; Anikushkin, M.N.; Ivanov, A.V.; Ovcharov, S.V.; Bobkov, A.E.; Baturin, Y.M. Laser scanning and 3D modeling of the Shukhov hyperboloid tower in Moscow. J. Cult. Herit. 2015, 16, 551–559. [Google Scholar] [CrossRef]
- Costantino, D.; Vozza, G.; Alfio, V.S.; Pepe, M. Strategies for 3D Modelling of Buildings from Airborne Laser Scanner and Photogrammetric Data Based on Free-Form and Model-Driven Methods: The Case Study of the Old Town Centre of Bordeaux (France). Appl. Sci. 2021, 11, 10993. [Google Scholar] [CrossRef]
- Bakirman, T.; Bayram, B.; Akpinar, B.; Karabulut, M.F.; Bayrak, O.C.; Yigitoglu, A.; Seker, D.Z. Implementation of ultra-light UAV systems for cultural heritage documentation. J. Cult. Herit. 2020, 44, 174–184. [Google Scholar] [CrossRef]
- Zlot, R.; Bosse, M.; Greenop, K.; Jarzab, Z.; Juckes, E.; Roberts, J. Efficiently capturing large, complex cultural heritage sites with a handheld mobile 3D laser mapping system. J. Cult. Herit. 2014, 15, 670–678. [Google Scholar] [CrossRef]
- Herban, S.; Costantino, D.; Alfio, V.S.; Pepe, M. Use of Low-Cost Spherical Cameras for the Digitisation of Cultural Heritage Structures into 3D Point Clouds. J. Imaging 2022, 8, 13. [Google Scholar] [CrossRef]
- Lose, L.T.; Spreafico, A.; Chiabrando, F.; Tonolo, F.G. Apple LiDAR Sensor for 3D Surveying: Tests and Results in the Cultural Heritage Domain. Remote Sens. 2022, 14, 4157. [Google Scholar] [CrossRef]
- Costantino, D.; Vozza, G.; Pepe, M.; Alfio, V.S. Smartphone LiDAR Technologies for Surveying and Reality Modelling in Urban Scenarios: Evaluation Methods, Performance and Challenges. Appl. Syst. Innov. 2022, 5, 63. [Google Scholar] [CrossRef]
- Ruther, H.; Bhurtha, R.; Held, C.; Schroder, R.; Wessels, S. Laser Scanning in Heritage Documentation: The Scanning Pipeline and its Challenges. Photogramm. Eng. Remote Sens. 2012, 78, 309–316. [Google Scholar] [CrossRef]
- Ghorbani, F.; Ebadi, H.; Pfeifer, N.; Sedaghat, A. Uniform and Competency-Based 3D Keypoint Detection for Coarse Registration of Point Clouds with Homogeneous Structure. Remote Sens. 2022, 14, 4099. [Google Scholar] [CrossRef]
- Zheng, Z.; Zha, B.; Zhou, Y.; Huang, J.; Xuchen, Y.; Zhang, H. Single-Stage Adaptive Multi-Scale Point Cloud Noise Filtering Algorithm Based on Feature Information. Remote Sens. 2022, 14, 367. [Google Scholar] [CrossRef]
- Gao, R.; Park, J.; Hu, X.; Yang, S.; Cho, K. Reflective Noise Filtering of Large-Scale Point Cloud Using Multi-Position LiDAR Sensing Data. Remote Sens. 2021, 13, 3058. [Google Scholar] [CrossRef]
- Ren, Y.; Chu, T.; Jiao, Y.F.; Zhou, M.Q.; Geng, G.H.; Li, K.; Cao, X. Multi-Scale Upsampling GAN Based Hole-Filling Framework for High-Quality 3D Cultural Heritage Artifacts. Appl. Sci. 2022, 12, 4581. [Google Scholar] [CrossRef]
- Shao, Z.F.; Yang, N.; Xiao, X.W.; Zhang, L.; Peng, Z. A Multi-View Dense Point Cloud Generation Algorithm Based on Low-Altitude Remote Sensing Images. Remote Sens. 2016, 8, 381. [Google Scholar] [CrossRef] [Green Version]
- Gaiani, M.; Remondino, F.; Apollonio, F.; Ballabeni, A. An Advanced Pre-Processing Pipeline to Improve Automated Photogrammetric Reconstructions of Architectural Scenes. Remote Sens. 2016, 8, 178. [Google Scholar] [CrossRef] [Green Version]
- Xu, Z.H.; Wu, L.X.; Shen, Y.L.; Li, F.S.; Wang, Q.L.; Wang, R. Tridimensional Reconstruction Applied to Cultural Heritage with the Use of Camera-Equipped UAV and Terrestrial Laser Scanner. Remote Sens. 2014, 6, 10413–10434. [Google Scholar] [CrossRef] [Green Version]
- Achille, C.; Adami, A.; Chiarini, S.; Cremonesi, S.; Fassi, F.; Fregonese, L.; Taffurelli, L. UAV-Based Photogrammetry and Integrated Technologies for Architectural Applications—Methodological Strategies for the After-Quake Survey of Vertical Structures in Mantua (Italy). Sensors 2015, 15, 15520–15539. [Google Scholar] [CrossRef] [Green Version]
- Galeazzi, F. Towards the definition of best 3D practices in archaeology: Assessing 3D documentation techniques for intra-site data recording. J. Cult. Herit. 2016, 17, 159–169. [Google Scholar] [CrossRef]
- Rodríguez-Gonzálvez, P.; Jiménez Fernández-Palacios, B.; Muñoz-Nieto, Á.; Arias-Sanchez, P.; Gonzalez-Aguilera, D. Mobile LiDAR System: New Possibilities for the Documentation and Dissemination of Large Cultural Heritage Sites. Remote Sens. 2017, 9, 189. [Google Scholar] [CrossRef] [Green Version]
- Erenoglu, R.C.; Akcay, O.; Erenoglu, O. An UAS-assisted multi-sensor approach for 3D modeling and reconstruction of cultural heritage site. J. Cult. Herit. 2017, 26, 79–90. [Google Scholar] [CrossRef]
- Puente, I.; Solla, M.; Laguela, S.; Sanjurjo-Pinto, J. Reconstructing the Roman Site “Aquis Querquennis” (Bande, Spain) from GPR, T-LiDAR and IRT Data Fusion. Remote Sens. 2018, 10, 379. [Google Scholar] [CrossRef] [Green Version]
- Alicandro, M.; Di Angelo, L.; Di Stefano, P.; Dominici, D.; Guardiani, E.; Zollini, S. Fast and Accurate Registration of Terrestrial Point Clouds Using a Planar Approximation of Roof Features. Remote Sens. 2022, 14, 2986. [Google Scholar] [CrossRef]
- Pepe, M.; Alfio, V.S.; Costantino, D.; Herban, S. Rapid and Accurate Production of 3D Point Cloud via Latest-Generation Sensors in the Field of Cultural Heritage: A Comparison between SLAM and Spherical Videogrammetry. Heritage 2022, 5, 1910–1928. [Google Scholar] [CrossRef]
- Cura, R.; Perret, J.; Paparoditis, N. A scalable and multi-purpose point cloud server (PCS) for easier and faster point cloud data management and processing. ISPRS J. Photogramm. Remote Sens. 2017, 127, 39–56. [Google Scholar] [CrossRef]
- Arias, P.; GonzÁLez-Aguilera, D.; Riveiro, B.; Caparrini, N. Orthoimage-Based Documentation of Archaeological Structures: The Case of a Mediaeval Wall in Pontevedra, Spain. Archaeometry 2011, 53, 858–872. [Google Scholar] [CrossRef]
- Korumaz, S.A.G.; Yıldız, F. Positional Accuracy Assessment of Digital Orthophoto Based on UAV Images: An Experience on an Archaeological Area. Heritage 2021, 4, 1304–1327. [Google Scholar] [CrossRef]
- Markiewicz, J.; Podlasiak, P.; Zawieska, D. A New Approach to the Generation of Orthoimages of Cultural Heritage Objects—Integrating TLS and Image Data. Remote Sens. 2015, 7, 16963–16985. [Google Scholar] [CrossRef] [Green Version]
- Armesto-González, J.; Riveiro-Rodríguez, B.; González-Aguilera, D.; Rivas-Brea, M.T. Terrestrial laser scanning intensity data applied to damage detection for historical buildings. J. Archaeol. Sci. 2010, 37, 3037–3047. [Google Scholar] [CrossRef]
- Alshawabkeh, Y. Linear feature extraction from point cloud using color information. Herit. Sci. 2020, 8, 28. [Google Scholar] [CrossRef]
- Masiero, A.; Costantino, D. TLS for Detecting Small Damages on a Building Facade. In Proceedings of the 2nd International Conference of Geomatics and Restoration (GEORES), Milan, Italy, 8–10 May 2019; pp. 831–836. [Google Scholar]
- Galantucci, R.A.; Fatiguso, F. Advanced damage detection techniques in historical buildings using digital photogrammetry and 3D surface anlysis. J. Cult. Herit. 2019, 36, 51–62. [Google Scholar] [CrossRef]
- Wood, R.L.; Mohammadi, M.E. Feature-Based Point Cloud-Based Assessment of Heritage Structures for Nondestructive and Noncontact Surface Damage Detection. Heritage 2021, 4, 775–793. [Google Scholar] [CrossRef]
- Alkadri, M.F.; Alam, S.; Santosa, H.; Yudono, A.; Beselly, S.M. Investigating Surface Fractures and Materials Behavior of Cultural Heritage Buildings Based on the Attribute Information of Point Clouds Stored in the TLS Dataset. Remote Sens. 2022, 14, 410. [Google Scholar] [CrossRef]
- Murphy, M.; McGovern, E.; Pavia, S. Historic building information modelling (HBIM). Struct. Surv. 2009, 27, 311–327. [Google Scholar] [CrossRef] [Green Version]
- Nieto-Julián, J.E.; Antón, D.; Moyano, J.J. Implementation and Management of Structural Deformations into Historic Building Information Models. Int. J. Archit. Herit. 2019, 14, 1384–1397. [Google Scholar] [CrossRef]
- Bastem, S.S.; Cekmis, A. Development of historic building information modelling: A systematic literature review. Build. Res. Inf. 2021, 50, 527–558. [Google Scholar] [CrossRef]
- Wang, Q.; Guo, J.; Kim, M.-K. An Application Oriented Scan-to-BIM Framework. Remote Sens. 2019, 11, 365. [Google Scholar] [CrossRef] [Green Version]
- Rocha, G.; Mateus, L.; Fernández, J.; Ferreira, V. A Scan-to-BIM Methodology Applied to Heritage Buildings. Heritage 2020, 3, 47–67. [Google Scholar] [CrossRef] [Green Version]
- Park, S.; Ju, S.; Yoon, S.; Nguyen, M.H.; Heo, J. An efficient data structure approach for BIM-to-point-cloud change detection using modifiable nested octree. Autom. Constr. 2021, 132, 103922. [Google Scholar] [CrossRef]
- Ursini, A.; Grazzini, A.; Matrone, F.; Zerbinatti, M. From scan-to-BIM to a structural finite elements model of built heritage for dynamic simulation. Autom. Constr. 2022, 142, 104518. [Google Scholar] [CrossRef]
- Pepe, M.; Costantino, D.; Restuccia Garofalo, A. An Efficient Pipeline to Obtain 3D Model for HBIM and Structural Analysis Purposes from 3D Point Clouds. Appl. Sci. 2020, 10, 1235. [Google Scholar] [CrossRef] [Green Version]
- Moyano, J.; Odriozola, C.P.; Nieto-Julián, J.E.; Vargas, J.M.; Barrera, J.A.; León, J. Bringing BIM to archaeological heritage: Interdisciplinary method/strategy and accuracy applied to a megalithic monument of the Copper Age. J. Cult. Herit. 2020, 45, 303–314. [Google Scholar] [CrossRef]
- Andriasyan, M.; Moyano, J.; Nieto-Julián, J.E.; Antón, D. From Point Cloud Data to Building Information Modelling: An Automatic Parametric Workflow for Heritage. Remote Sens. 2020, 12, 1094. [Google Scholar] [CrossRef]
- Antón, D.; Medjdoub, B.; Shrahily, R.; Moyano, J. Accuracy evaluation of the semi-automatic 3D modeling for historical building information models. Int. J. Archit. Herit. 2018, 12, 790–805. [Google Scholar] [CrossRef] [Green Version]
- Laefer, D.F.; Truong-Hong, L. Toward automatic generation of 3D steel structures for building information modelling. Autom. Constr. 2017, 74, 66–77. [Google Scholar] [CrossRef]
- Lee, J.H.; Park, J.J.; Yoon, H. Automatic Bridge Design Parameter Extraction for Scan-to-BIM. Appl. Sci. 2020, 10, 7346. [Google Scholar] [CrossRef]
- Yang, X.; Lu, Y.-C.; Murtiyoso, A.; Koehl, M.; Grussenmeyer, P. HBIM Modeling from the Surface Mesh and Its Extended Capability of Knowledge Representation. ISPRS Int. J. Geo-Inf. 2019, 8, 301. [Google Scholar] [CrossRef] [Green Version]
- Capolupo, A. Accuracy Assessment of Cultural Heritage Models Extracting 3D Point Cloud Geometric Features with RPAS SfM-MVS and TLS Techniques. Drones 2021, 5, 145. [Google Scholar] [CrossRef]
- Grilli, E.; Remondino, F. Classification of 3D Digital Heritage. Remote Sens. 2019, 11, 847. [Google Scholar] [CrossRef] [Green Version]
- Matrone, F.; Grilli, E.; Martini, M.; Paolanti, M.; Pierdicca, R.; Remondino, F. Comparing Machine and Deep Learning Methods for Large 3D Heritage Semantic Segmentation. ISPRS Int. J. Geo-Inf. 2020, 9, 535. [Google Scholar] [CrossRef]
- Pierdicca, R.; Paolanti, M.; Matrone, F.; Martini, M.; Morbidoni, C.; Malinverni, E.S.; Frontoni, E.; Lingua, A.M. Point Cloud Semantic Segmentation Using a Deep Learning Framework for Cultural Heritage. Remote Sens. 2020, 12, 1005. [Google Scholar] [CrossRef] [Green Version]
- Croce, V.; Caroti, G.; De Luca, L.; Jacquot, K.; Piemonte, A.; Véron, P. From the Semantic Point Cloud to Heritage-Building Information Modeling: A Semiautomatic Approach Exploiting Machine Learning. Remote Sens. 2021, 13, 461. [Google Scholar] [CrossRef]
- Alshawabkeh, Y.; Baik, A.; Fallatah, A. As-Textured As-Built BIM Using Sensor Fusion, Zee Ain Historical Village as a Case Study. Remote Sens. 2021, 13, 5135. [Google Scholar] [CrossRef]
- Nishanbaev, I.; Champion, E.; McMeekin, D.A. A Web GIS-Based Integration of 3D Digital Models with Linked Open Data for Cultural Heritage Exploration. ISPRS Int. J. Geo-Inf. 2021, 10, 684. [Google Scholar] [CrossRef]
- Doğan, Y.; Yakar, M. Gis and Three-Dimensional Modeling for Cultural Heritages. Int. J. Eng. Geosci. 2018, 3, 50–55. [Google Scholar] [CrossRef] [Green Version]
- Campiani, A.; Lingle, A.; Lercari, N. Spatial analysis and heritage conservation: Leveraging 3-D data and GIS for monitoring earthen architecture. J. Cult. Herit. 2019, 39, 166–176. [Google Scholar] [CrossRef] [Green Version]
- Colucci, E.; Matrone, F.; Noardo, F.; Assumma, V.; Datola, G.; Appiotti, F.; Bottero, M.; Chiabrando, F.; Lombardi, P.; Migliorini, M.; et al. Documenting cultural heritage in an INSPIRE-based 3D GIS for risk and vulnerability analysis. J. Cult. Herit. Manag. Sustain. Dev. 2022; ahead of print. [Google Scholar] [CrossRef]
- Yagoub, M.M.; Al Yammahi, A.A. Spatial distribution of natural hazards and their proximity to heritage sites: Case of the United Arab Emirates. Int. J. Disaster Risk Reduct. 2022, 71, 102827. [Google Scholar] [CrossRef]
- Costantino, D.; Angelini, M.G.; Alfio, V.S.; Claveri, M.; Settembrini, F. Implementation of a system WebGIS open-source for the protection and sustainable management of rural heritage. Appl. Geomat. 2020, 12, 41–54. [Google Scholar] [CrossRef]
- Pepe, M.; Costantino, D.; Alfio, V.S.; Restuccia, A.G.; Papalino, N.M. Scan to BIM for the digital management and representation in 3D GIS environment of cultural heritage site. J. Cult. Herit. 2021, 50, 115–125. [Google Scholar] [CrossRef]
- Sánchez-Sánchez, Y.; Elez, J.; Silva, P.G.; Santos-Delgado, G.; Giner-Robles, J.L.; Reicherter, K. 3D Modelling of Archaeoseismic Damage in the Roman Site of Baelo Claudia (Gibraltar Arc, South Spain). Appl. Sci. 2022, 12, 5223. [Google Scholar] [CrossRef]
- Pietroni, E.; Ferdani, D. Virtual Restoration and Virtual Reconstruction in Cultural Heritage: Terminology, Methodologies, Visual Representation Techniques and Cognitive Models. Information 2021, 12, 167. [Google Scholar] [CrossRef]
- Chen, S.; Hu, Q.; Wang, S.; Yang, H. A Virtual Restoration Approach for Ancient Plank Road Using Mechanical Analysis with Precision 3D Data of Heritage Site. Remote Sens. 2016, 8, 828. [Google Scholar] [CrossRef]
- Setty, S.; Mudenagudi, U. Example-based 3D inpainting of point clouds using metric tensor and Christoffel symbols. Mach. Vis. Appl. 2018, 29, 329–343. [Google Scholar] [CrossRef]
- Baik, A. The Use of Interactive Virtual BIM to Boost Virtual Tourism in Heritage Sites, Historic Jeddah. ISPRS Int. J. Geo-Inf. 2021, 10, 577. [Google Scholar] [CrossRef]
- Hou, M.; Yang, S.; Hu, Y.; Wu, Y.; Jiang, L.; Zhao, S.; Wei, P. Novel Method for Virtual Restoration of Cultural Relics with Complex Geometric Structure Based on Multiscale Spatial Geometry. ISPRS Int. J. Geo-Inf. 2018, 7, 353. [Google Scholar] [CrossRef] [Green Version]
- Yang, W.; Mingquan, Z.; Pengfei, Z.; Guohua, G. Matching Method of Cultural Relic Fragments Constrained by Thickness and Contour Feature. IEEE Access 2020, 8, 25892–25904. [Google Scholar] [CrossRef]
- Ackoff, R.L. From data to wisdom. J. Appl. Syst. Anal. 1989, 16, 3–9. [Google Scholar]
- Pepe, M.; Alfio, V.S.; Costantino, D.; Scaringi, D. Data for 3D reconstruction and point cloud classification using machine learning in cultural heritage environment. Data Brief 2022, 42, 6. [Google Scholar] [CrossRef]
- Poux, F.; Neuville, R.; Van Wersch, L.; Nys, G.-A.; Billen, R. 3D Point Clouds in Archaeology: Advances in Acquisition, Processing and Knowledge Integration Applied to Quasi-Planar Objects. Geosciences 2017, 7, 96. [Google Scholar] [CrossRef] [Green Version]
- Poux, F.; Hallot, P.; Neuville, R.; Billen, R. Smart Point Cloud: Definition and Remaining Challenges. ISPRS Ann. Photogramm. Remote Sens. Spat. Inf. Sci. 2016, IV-2/W1, 119–127. [Google Scholar] [CrossRef] [Green Version]
- Poux, F.; Neuville, R.; Hallot, P.; Billen, R. Model for Semantically Rich Point Cloud Data. ISPRS Ann. Photogramm. Remote Sens. Spat. Inf. Sci. 2017, IV-4/W5, 107–115. [Google Scholar] [CrossRef] [Green Version]
- Yang, S.; Hou, M.; Shaker, A.; Li, S. Modeling and Processing of Smart Point Clouds of Cultural Relics with Complex Geometries. ISPRS Int. J. Geo-Inf. 2021, 10, 617. [Google Scholar] [CrossRef]
- Ponciano, J.J.; Prudhomme, C.; Boochs, F. From Acquisition to Presentation-The Potential of Semantics to Support the Safeguard of Cultural Heritage. Remote Sens. 2021, 13, 2226. [Google Scholar] [CrossRef]
- Hou, J.; Yang, X.; Chen, C. Emerging trends and new developments in information science: A document co-citation analysis (2009–2016). Scientometrics 2018, 115, 869–889. [Google Scholar] [CrossRef]
- Chen, C. Predictive effects of structural variation on citation counts. J. Am. Soc. Inf. Sci. Technol. 2012, 63, 431–449. [Google Scholar] [CrossRef] [Green Version]
- Chen, C. Science mapping: A systematic review of the literature. J. Data Inf. Sci. 2017, 2, 1–40. [Google Scholar] [CrossRef] [Green Version]
- Chen, C.; Song, M. Visualizing a field of research: A methodology of systematic scientometric reviews. PLoS ONE 2019, 14, e0223994. [Google Scholar] [CrossRef] [PubMed] [Green Version]
- Chen, X.; Liu, Y. Visualization analysis of high-speed railway research based on CiteSpace. Transp. Policy 2020, 85, 1–17. [Google Scholar] [CrossRef]
- Chen, C. CiteSpace: A Practical Guide for Mapping Scientific Literature; Nova Science Publishers: Hauppauge, NY, USA, 2016. [Google Scholar]
- Khan, B.S.; Niazi, M.A. Network community detection: A review and visual survey. arXiv 2017, arXiv:1708.00977. [Google Scholar]
- Wang, W.; Lu, C. Visualization analysis of big data research based on Citespace. Soft Comput. 2020, 24, 8173–8186. [Google Scholar] [CrossRef]
- Chen, C.; Ibekwe-SanJuan, F.; Hou, J. The structure and dynamics of cocitation clusters: A multiple-perspective cocitation analysis. J. Am. Soc. Inf. Sci. Technol. 2010, 61, 1386–1409. [Google Scholar] [CrossRef] [Green Version]
- Brandes, U. A faster algorithm for betweenness centrality. J. Math. Sociol. 2001, 25, 163–177. [Google Scholar] [CrossRef]
- Yan, E.; Ding, Y. Applying centrality measures to impact analysis: A coauthorship network analysis. J. Am. Soc. Inf. Sci. Technol. 2009, 60, 2107–2118. [Google Scholar] [CrossRef] [Green Version]
- Zhang, J.; Luo, Y. Degree centrality, betweenness centrality, and closeness centrality in social network. In Proceedings of the 2017 2nd international Conference on Modelling, Simulation and Applied Mathematics (MSAM2017), Bangkok, Thailand, 26–27 March 2017; pp. 300–303. [Google Scholar]
- Kleinberg, J.; Tardos, E. Approximation algorithms for classification problems with pairwise relationships: Metric labeling and Markov random fields. J. ACM 2002, 49, 616–639. [Google Scholar] [CrossRef]
- Grilli, E.; Menna, F.; Remondino, F. A review of point clouds segmentation and classification algorithms. Int. Arch. Photogramm. Remote Sens. Spat. Inf. Sci. 2017, 42, 339. [Google Scholar] [CrossRef] [Green Version]
- Dore, C.; Murphy, M.; McCarthy, S.; Brechin, F.; Casidy, C.; Dirix, E. Structural simulations and conservation analysis-historic building information model (HBIM). Int. Arch. Photogramm. Remote Sens. Spat. Inf. Sci. 2015, 40, 351. [Google Scholar] [CrossRef] [Green Version]
- Furukawa, Y.; Ponce, J. Accurate, dense, and robust multiview stereopsis. IEEE Trans. Pattern Anal. Mach. Intell. 2009, 32, 1362–1376. [Google Scholar] [CrossRef]
- Barazzetti, L.; Scaioni, M.; Remondino, F. Orientation and 3D modelling from markerless terrestrial images: Combining accuracy with automation. Photogramm. Rec. 2010, 25, 356–381. [Google Scholar] [CrossRef]
- Remondino, F. Heritage recording and 3D modeling with photogrammetry and 3D scanning. Remote Sens. 2011, 3, 1104–1138. [Google Scholar] [CrossRef] [Green Version]
- Remondino, F.; Spera, M.G.; Nocerino, E.; Menna, F.; Nex, F. State of the art in high density image matching. Photogramm. Rec. 2014, 29, 144–166. [Google Scholar] [CrossRef] [Green Version]
- Murphy, M.; McGovern, E.; Pavia, S. Historic Building Information Modelling–Adding intelligence to laser and image based surveys of European classical architecture. ISPRS J. Photogramm. Remote Sens. 2013, 76, 89–102. [Google Scholar] [CrossRef]
- Volk, R.; Stengel, J.; Schultmann, F. Building Information Modeling (BIM) for existing buildings—Literature review and future needs. Autom. Constr. 2014, 38, 109–127. [Google Scholar] [CrossRef]


| Journals | Papers |
|---|---|
| Remote Sensing | 62 |
| ISPRS International Journal of Geo Information | 37 |
| Journal of Cultural Heritage | 31 |
| Sensors | 27 |
| Applied Sciences Basel | 17 |
| ISPRS Journal of Photogrammetry and Remote Sensing | 16 |
| International Journal of Architectural Heritage | 16 |
| Automation in Construction | 16 |
| Sustainability | 11 |
| ACM Journal on Computing and Cultural Heritage | 10 |
| Journal of Archaeological Science Reports | 9 |
| Photogrammetrie Fernerkundung Geoinformation | 7 |
| Mediterranean Archaeology Archaeometry | 7 |
| Photogrammetric Record | 6 |
| Measurement | 6 |
| IEEE Access | 6 |
| Computers Graphics UK | 6 |
| Journal of Archaeological Science | 5 |
| Drones | 5 |
| Advanced Engineering Informatics | 5 |
| Symmetry Basel | 4 |
| Journal of Construction Engineering And Management | 4 |
| Journal of Building Engineering | 4 |
| International Journal of Remote Sensing | 4 |
| Heritage Science | 4 |
| Forests | 4 |
| Buildings | 4 |
| Archaeological Prospection | 4 |
| Survey Review | 3 |
| Remote Sensing of Environment | 3 |
| Journal of Computing in Civil Engineering | 3 |
| International Journal of Computer Vision | 3 |
| ClusterID | Size | Silhouette | Label (LLR) | Average Year |
|---|---|---|---|---|
| 0 | 208 | 0.848 | historic building information | 2018 |
| 1 | 189 | 0.808 | semantic segmentation | 2017 |
| 2 | 184 | 0.896 | unmanned aerial vehicle photogrammetry | 2014 |
| 3 | 165 | 0.911 | quick digital photogrammetric system | 2016 |
| 4 | 143 | 0.944 | cultural heritage structure | 2016 |
| 5 | 140 | 0.939 | quality specification | 2018 |
| 6 | 138 | 0.969 | urban facade parsing | 2016 |
| 7 | 118 | 0.947 | decision-making task | 2012 |
| 8 | 116 | 0.946 | monitoring structural deformation | 2018 |
| 9 | 109 | 0.965 | detailed architectural canopy model reconstruction | 2018 |
| 10 | 108 | 0.951 | close-range automatic correlation photogrammetry | 2013 |
| 11 | 105 | 0.956 | assessing structural damage | 2016 |
| 12 | 97 | 0.961 | genetic algorithm | 2015 |
| 13 | 95 | 0.95 | tls data | 2017 |
| 14 | 94 | 0.933 | large complex cultural heritage site | 2016 |
| 15 | 91 | 0.963 | mobile LiDAR system | 2018 |
| Country | Betweenness Centrality | Degree Centrality | Number of World Heritage Sites |
|---|---|---|---|
| Germany | 0.46 | 10 | 51 |
| Peoples R China | 0.41 | 11 | 56 |
| Italy | 0.40 | 12 | 58 |
| Netherlands | 0.23 | 7 | 12 |
| Greece | 0.18 | 6 | 18 |
| Category | Betweenness Centrality | Year |
|---|---|---|
| Geosciences Multidisciplinary | 0.53 | 2006 |
| Humanities Multidisciplinary | 0.53 | 2018 |
| Materials Science Multidisciplinary | 0.44 | 2011 |
| Computer Science Interdisciplinary Applications | 0.44 | 2016 |
| Chemistry Analytical | 0.40 | 2009 |
| Engineering Electrical Electronic | 0.35 | 2014 |
| Engineering Civil | 0.35 | 2015 |
| Environmental Sciences | 0.24 | 2014 |
| Engineering Multidisciplinary | 0.15 | 2018 |
| Imaging Science Photographic Technology | 0.10 | 2008 |
Publisher’s Note: MDPI stays neutral with regard to jurisdictional claims in published maps and institutional affiliations. |
© 2022 by the authors. Licensee MDPI, Basel, Switzerland. This article is an open access article distributed under the terms and conditions of the Creative Commons Attribution (CC BY) license (https://creativecommons.org/licenses/by/4.0/).
Share and Cite
Yang, S.; Xu, S.; Huang, W. 3D Point Cloud for Cultural Heritage: A Scientometric Survey. Remote Sens. 2022, 14, 5542. https://doi.org/10.3390/rs14215542
Yang S, Xu S, Huang W. 3D Point Cloud for Cultural Heritage: A Scientometric Survey. Remote Sensing. 2022; 14(21):5542. https://doi.org/10.3390/rs14215542
Chicago/Turabian StyleYang, Su, Shishuo Xu, and Wei Huang. 2022. "3D Point Cloud for Cultural Heritage: A Scientometric Survey" Remote Sensing 14, no. 21: 5542. https://doi.org/10.3390/rs14215542