Next Issue
Volume 14, November-2
Previous Issue
Volume 14, October-2
 
 
remotesensing-logo

Journal Browser

Journal Browser

Remote Sens., Volume 14, Issue 21 (November-1 2022) – 346 articles

Cover Story (view full-size image): 
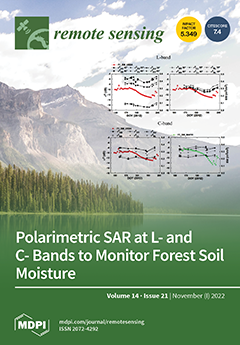
Polarimetric SAR parameters and backscattering coefficients at different frequencies are important to characterize soil moisture over forest areas. The L-band Uninhabited Aerial Vehicle Synthetic Aperture Radar (UAVSAR) and C-band RADARSAT-2 were analyzed in terms of soil and vegetation parameters collected during the SMAPVEX12 campaign in Canada. Several optimal polarimetric parameters and linear/circular backscattering coefficients at L-band allow the monitoring of forest soil moisture. However, only a few polarimetric parameters—φHHHV, φVVHV, and φHHVV at C-band—are sensitive to forest soil moisture. View this paper
  • Issues are regarded as officially published after their release is announced to the table of contents alert mailing list.
  • You may sign up for e-mail alerts to receive table of contents of newly released issues.
  • PDF is the official format for papers published in both, html and pdf forms. To view the papers in pdf format, click on the "PDF Full-text" link, and use the free Adobe Reader to open them.
Order results
Result details
Section
Select all
Export citation of selected articles as:
22 pages, 4796 KiB  
Article
Developing an Automated Python Surface Energy Balance System (PySEBS) Software for Calculating Actual Evapotranspiration-Software Development and Application Case in Jilin Province, China
by Haipeng Liu, Feng Huang, Yingxuan Li, Pinpin Ren, Gary W. Marek, Beibei Ding, Baoguo Li and Yong Chen
Remote Sens. 2022, 14(21), 5629; https://doi.org/10.3390/rs14215629 - 07 Nov 2022
Viewed by 1992
Abstract
In this study, Python Surface Energy Balance System (PySEBS) software was developed in the Python 2.7 programming language for continuous calculation of actual evapotranspiration (ETa) at regional scales. The software is based on the Surface Energy Balance System (SEBS) model, which [...] Read more.
In this study, Python Surface Energy Balance System (PySEBS) software was developed in the Python 2.7 programming language for continuous calculation of actual evapotranspiration (ETa) at regional scales. The software is based on the Surface Energy Balance System (SEBS) model, which uses basic meteorological data, MODIS remote sensing data, and Digital Elevation Model (DEM) data as the original input data and finally outputs daily-scale ETa in the form of raster data with a spatial resolution of 1 km × 1 km. To verify the reliability of the PySEBS model, the ETa of spring maize during the growing season in Jilin Province, China, from 2001 to 2020 was calculated and analyzed in this study and compared with the results of similar studies by others. The findings showed that the PySEBS model has a reasonable accuracy in estimating ETa within ±15% and is a robust model that can achieve the continuous calculation of ETa at a regional scale. Therefore, PySEBS software is a useful tool for regional irrigation scheduling and water resources management. Full article
Show Figures

Figure 1

11 pages, 2736 KiB  
Article
The Formation of Yardangs Surrounding the Suoyang City Ruins in the Hexi Corridor of Northwestern China and Its Climatic–Environmental Significance
by Qingbin Fan, Jie Liao, Yan Li, Wei Ye, Tao Wang, Lupeng Yu, Xiao Feng and Weixiao Han
Remote Sens. 2022, 14(21), 5628; https://doi.org/10.3390/rs14215628 - 07 Nov 2022
Cited by 2 | Viewed by 1487
Abstract
The yardangs surrounding the Suoyang City ruins are proven to be wind-eroded landforms developed in an oasis which was used for agriculture in history. According to OSL and 14C dating, as well as historical records of local human activities, we suggest that [...] Read more.
The yardangs surrounding the Suoyang City ruins are proven to be wind-eroded landforms developed in an oasis which was used for agriculture in history. According to OSL and 14C dating, as well as historical records of local human activities, we suggest that the formation of yardangs in the Suoyang City oasis probably started in the mid-Yuan Dynasty of China (AD 1291). After being abandoned, the Suoyang City oasis quickly evolved into desert land with yardangs and nebkhas under the background of desertification enlargement in a cold, dry climate in the Hexi Corridor. Although human factors are considered to have played an important role in the process of desertification, the effect imposed by climatic changes should not be ignored. Desertification constitutes a serious threat to human survival and development, we should reasonably develop and utilize water and land resources, effectively prevent and control desertification, and promote the harmonious development between man and nature in arid areas. Full article
Show Figures

Graphical abstract

13 pages, 4702 KiB  
Article
Global Soil Salinity Prediction by Open Soil Vis-NIR Spectral Library
by Yin Zhou, Songchao Chen, Bifeng Hu, Wenjun Ji, Shuo Li, Yongsheng Hong, Hanyi Xu, Nan Wang, Jie Xue, Xianglin Zhang, Yi Xiao and Zhou Shi
Remote Sens. 2022, 14(21), 5627; https://doi.org/10.3390/rs14215627 - 07 Nov 2022
Cited by 10 | Viewed by 3541
Abstract
Soil salinization is one of the major degradation processes threatening food security and sustainable development. Detailed soil salinity information is increasingly needed to tackle this global challenge for improving soil management. Soil-visible and near-infrared (Vis-NIR) spectroscopy has been proven to be a potential [...] Read more.
Soil salinization is one of the major degradation processes threatening food security and sustainable development. Detailed soil salinity information is increasingly needed to tackle this global challenge for improving soil management. Soil-visible and near-infrared (Vis-NIR) spectroscopy has been proven to be a potential solution for estimating soil-salinity-related information (i.e., electrical conductivity, EC) rapidly and cost-effectively. However, previous studies were mainly conducted at the field, regional, or national scale, so the potential application of Vis-NIR spectroscopy at a global scale needs further investigation. Based on an extensive open global soil spectral library (61,486 samples with both EC and Vis-NIR spectra), we compared four spectral predictive models (PLSR, Cubist, Random Forests, and XGBoost) in estimating EC. Our results indicated that XGBoost had the best model performance (R2 of 0.59, RMSE of 1.96 dS m−1) in predicting EC at a global scale, whereas PLSR had a relatively limited ability (R2 of 0.39, RMSE of 2.41 dS m−1). The results also showed that auxiliary environmental covariates (i.e., coordinates, elevation, climatic variables) could greatly improve EC prediction accuracy by the four models, and the XGBoost performed best (R2 of 0.71, RMSE of 1.65 dS m−1). The outcomes of this study provide a valuable reference for improving broad-scale soil salinity prediction by the coupling of the spectroscopic technique and easily obtainable environmental covariates. Full article
(This article belongs to the Special Issue Remote Sensing of Soil Salinity: Detection and Quantification)
Show Figures

Figure 1

26 pages, 22782 KiB  
Article
Spatial Estimation of Regional PM2.5 Concentrations with GWR Models Using PCA and RBF Interpolation Optimization
by Youbing Tang, Shaofeng Xie, Liangke Huang, Lilong Liu, Pengzhi Wei, Yabo Zhang and Chunyang Meng
Remote Sens. 2022, 14(21), 5626; https://doi.org/10.3390/rs14215626 - 07 Nov 2022
Cited by 7 | Viewed by 1810
Abstract
In recent years, geographically weighted regression (GWR) models have been widely used to address the spatial heterogeneity and spatial autocorrelation of PM2.5, but these studies have not fully considered the effects of all potential variables on PM2.5 variation and have [...] Read more.
In recent years, geographically weighted regression (GWR) models have been widely used to address the spatial heterogeneity and spatial autocorrelation of PM2.5, but these studies have not fully considered the effects of all potential variables on PM2.5 variation and have rarely optimized the models for residuals. Therefore, we first propose a modified GWR model based on principal component analysis (PCA-GWR), then introduce five different spatial interpolation methods of radial basis functions to correct the residuals of the PCA-GWR model, and finally construct five combinations of residual correction models to estimate regional PM2.5 concentrations. The results show that (1) the PCA-GWR model can fully consider the contributions of all potential explanatory variables to estimate PM2.5 concentrations and minimize the multicollinearity among explanatory variables, and the PM2.5 estimation accuracy and the fitting effect of the PCA-GWR model are better than the original GWR model. (2) All five residual correction combination models can better achieve the residual correction optimization of the PCA-GWR model, among which the PCA-GWR model corrected by Multiquadric Spline (MS) residual interpolation (PCA-GWRMS) has the most obvious accuracy improvement and more stable generalizability at different time scales. Therefore, the residual correction of PCA-GWR models using spatial interpolation methods is effective and feasible, and the results can provide references for regional PM2.5 spatial estimation and spatiotemporal mapping. (3) The PM2.5 concentrations in the study area are high in winter months (January, February, December) and low in summer months (June, July, August), and spatially, PM2.5 concentrations show a distribution of high north and low south. Full article
(This article belongs to the Special Issue Beidou/GNSS Precise Positioning and Atmospheric Modeling II)
Show Figures

Figure 1

22 pages, 5601 KiB  
Article
Early-Season Crop Identification in the Shiyang River Basin Using a Deep Learning Algorithm and Time-Series Sentinel-2 Data
by Zhiwei Yi, Li Jia, Qiting Chen, Min Jiang, Dingwang Zhou and Yelong Zeng
Remote Sens. 2022, 14(21), 5625; https://doi.org/10.3390/rs14215625 - 07 Nov 2022
Cited by 8 | Viewed by 2231
Abstract
Timely and accurate crop identification and mapping are of great significance for crop yield estimation, disaster warning, and food security. Early-season crop identification places higher demands on the quality and mining of time-series information than post-season mapping. In recent years, great strides have [...] Read more.
Timely and accurate crop identification and mapping are of great significance for crop yield estimation, disaster warning, and food security. Early-season crop identification places higher demands on the quality and mining of time-series information than post-season mapping. In recent years, great strides have been made in the development of deep-learning algorithms, and the emergence of Sentinel-2 data with a higher temporal resolution has provided new opportunities for early-season crop identification. In this study, we aimed to fully exploit the potential of deep-learning algorithms and time-series Sentinel-2 data for early-season crop identification and early-season crop mapping. In this study, four classifiers, i.e., two deep-learning algorithms (one-dimensional convolutional networks and long and short-term memory networks) and two shallow machine-learning algorithms (a random forest algorithm and a support vector machine), were trained using early-season Sentinel-2 images and field samples collected in 2019. Then, these algorithms were applied to images and field samples for 2020 in the Shiyang River Basin. Twelve scenarios with different classifiers and time intervals were compared to determine the optimal combination for the earliest crop identification. The results show that: (1) the two deep-learning algorithms outperformed the two shallow machine-learning algorithms in early-season crop identification; (2) the combination of a one-dimensional convolutional network and 5-day interval time-series Sentinel-2 data outperformed the other schemes in obtaining the early-season crop identification time and achieving early mapping; and (3) the early-season crop identification mapping time in the Shiyang River Basin was identified as the end of July, and the overall classification accuracy reached 0.83. In addition, the early identification time for each crop was as follows: the wheat was in the flowering stage (mid-late June); the alfalfa was in the first harvest (mid-late June); the corn was in the early tassel stage (mid-July); the fennel and sunflower were in the flowering stage (late July); and the melons were in the fruiting stage (around late July). This study demonstrates the potential of using Sentinel-2 time-series data and deep-learning algorithms to achieve early-season crop identification, and this method is expected to provide new solutions and ideas for addressing early-season crop identification monitoring. Full article
(This article belongs to the Special Issue Monitoring Crops and Rangelands Using Remote Sensing)
Show Figures

Graphical abstract

18 pages, 20053 KiB  
Article
Enabling Deep-Neural-Network-Integrated Optical and SAR Data to Estimate the Maize Leaf Area Index and Biomass with Limited In Situ Data
by Peilei Luo, Huichun Ye, Wenjiang Huang, Jingjuan Liao, Quanjun Jiao, Anting Guo and Binxiang Qian
Remote Sens. 2022, 14(21), 5624; https://doi.org/10.3390/rs14215624 - 07 Nov 2022
Viewed by 1508
Abstract
Accurate estimation of the maize leaf area index (LAI) and biomass is of great importance in guiding field management and early yield estimation. Physical models and traditional machine learning methods are commonly used for LAI and biomass estimation. However, these models and methods [...] Read more.
Accurate estimation of the maize leaf area index (LAI) and biomass is of great importance in guiding field management and early yield estimation. Physical models and traditional machine learning methods are commonly used for LAI and biomass estimation. However, these models and methods mostly rely on handcrafted features and theoretical formulas under idealized assumptions, which limits their accuracy. Deep neural networks have demonstrated great superiority in automatic feature extraction and complicated nonlinear approximation, but their application to LAI and biomass estimation has been hindered by the shortage of in situ data. Therefore, bridging the gap of data shortage and making it possible to leverage deep neural networks to estimate maize LAI and biomass is of great significance. Optical data cannot provide information in the lower canopy due to the limited penetrability, but synthetic aperture radar (SAR) data can do this, so the integration of optical and SAR data is necessary. In this paper, 158 samples from the jointing, trumpet, flowering, and filling stages of maize were collected for investigation. First, we propose an improved version of the mixup training method, which is termed mixup+, to augment the sample amount. We then constructed a novel gated Siamese deep neural network (GSDNN) based on a gating mechanism and a Siamese architecture to integrate optical and SAR data for the estimation of the LAI and biomass. We compared the accuracy of the GSDNN with those of other machine learning methods, i.e., multiple linear regression (MLR), support vector regression (SVR), random forest regression (RFR), and a multilayer perceptron (MLP). The experimental results show that without the use of mixup+, the GSDNN achieved a similar accuracy to that of the simple neural network MLP in terms of R2 and RMSE, and this was slightly lower than those of MLR, SVR, and RFR. However, with the help of mixup+, the GSDNN achieved state-of-the-art performance (R2 = 0.71, 0.78, and 0.86 and RMSE = 0.58, 871.83, and 150.76 g/m2, for LAI, Biomass_wet, and Biomass_dry, respectively), exceeding the accuracies of MLR, SVR, RFR, and MLP. In addition, through the integration of optical and SAR data, the GSDNN achieved better accuracy in LAI and biomass estimation than when optical or SAR data alone were used. We found that the most appropriate amount of synthetic data from mixup+ was five times the amount of original data. Overall, this study demonstrates that the GSDNN + mixup+ has great potential for the integration of optical and SAR data with the aim of improving the estimation accuracy of the maize LAI and biomass with limited in situ data. Full article
Show Figures

Figure 1

20 pages, 9276 KiB  
Article
Regional Patterns of Vegetation Dynamics and Their Sensitivity to Climate Variability in the Yangtze River Basin
by Qin Wang, Qin Ju, Yueyang Wang, Xiaolei Fu, Wenjie Zhao, Yiheng Du, Peng Jiang and Zhenchun Hao
Remote Sens. 2022, 14(21), 5623; https://doi.org/10.3390/rs14215623 - 07 Nov 2022
Cited by 6 | Viewed by 1462
Abstract
To better understand the mechanisms of the hydro-ecological cycle in the changing environments of the Yangtze River Basin (YZRB), it is valuable to investigate vegetation dynamics and their response to climate change. This study explored the spatial patterns of vegetation dynamics and the [...] Read more.
To better understand the mechanisms of the hydro-ecological cycle in the changing environments of the Yangtze River Basin (YZRB), it is valuable to investigate vegetation dynamics and their response to climate change. This study explored the spatial patterns of vegetation dynamics and the essential triggers of regional differences by analyzing vegetation variations in the 1982–2015 period at different time scales and the interannual variability of vegetation sensitivity to climate variability. The results showed that the normalized difference vegetation index (NDVI) increased significantly in the last three decades, but vegetation displayed great spatiotemporal variations at different time scales. The vegetation in the central part of the YZRB dominated by forests and shrublands was more sensitive to climate variability than vegetation in the source region of the YZRB, which was dominated by alpine meadows and tundra (AMT). The contribution of climate variables to the vegetation sensitivity index (VSI) had large spatial differences, but solar radiation and temperature were the dominant factors. Furthermore, 57.9% of the YZRB had increasing VSIs, especially in the south-central part. Consistent with the distributions of elevation and vegetation types, vegetation dynamics in the YZRB were divided into five spatial patterns, with the largest increasing NDVI trend in Region III and the largest VSI in Region IV. Moreover, the VSI exhibited fairly consistent dynamics in all subregions, but the contributions of climate variables to the VSI varied greatly among the different regions. Full article
Show Figures

Figure 1

25 pages, 25232 KiB  
Article
Change Alignment-Based Image Transformation for Unsupervised Heterogeneous Change Detection
by Kuowei Xiao, Yuli Sun and Lin Lei
Remote Sens. 2022, 14(21), 5622; https://doi.org/10.3390/rs14215622 - 07 Nov 2022
Cited by 1 | Viewed by 1926
Abstract
Change detection (CD) with heterogeneous images is currently attracting extensive attention in remote sensing. In order to make heterogeneous images comparable, the image transformation methods transform one image into the domain of another image, which can simultaneously obtain a forward difference map (FDM) [...] Read more.
Change detection (CD) with heterogeneous images is currently attracting extensive attention in remote sensing. In order to make heterogeneous images comparable, the image transformation methods transform one image into the domain of another image, which can simultaneously obtain a forward difference map (FDM) and backward difference map (BDM). However, previous methods only fuse the FDM and BDM in the post-processing stage, which cannot fundamentally improve the performance of CD. In this paper, a change alignment-based change detection (CACD) framework for unsupervised heterogeneous CD is proposed to deeply utilize the complementary information of the FDM and BDM in the image transformation process, which enhances the effect of domain transformation, thus improving CD performance. To reduce the dependence of the transformation network on labeled samples, we propose a graph structure-based strategy of generating prior masks to guide the network, which can reduce the influence of changing regions on the transformation network in an unsupervised way. More importantly, based on the fact that the FDM and BDM are representing the same change event, we perform change alignment during the image transformation, which can enhance the image transformation effect and enable FDM and BDM to effectively indicate the real change region. Comparative experiments are conducted with six state-of-the-art methods on five heterogeneous CD datasets, showing that the proposed CACD achieves the best performance with an average overall accuracy (OA) of 95.9% on different datasets and at least 6.8% improvement in the kappa coefficient. Full article
(This article belongs to the Special Issue Image Change Detection Research in Remote Sensing)
Show Figures

Figure 1

27 pages, 35878 KiB  
Article
Critical Climate Periods Explain a Large Fraction of the Observed Variability in Vegetation State
by Anikó Kern, Zoltán Barcza, Roland Hollós, Edina Birinyi and Hrvoje Marjanović
Remote Sens. 2022, 14(21), 5621; https://doi.org/10.3390/rs14215621 - 07 Nov 2022
Cited by 2 | Viewed by 1732
Abstract
Previous studies have suggested that a major part of the observed variability in vegetation state might be associated with variability in climatic drivers during relatively short periods within the year. Identification of such critical climate periods, when a particular climate variable most likely [...] Read more.
Previous studies have suggested that a major part of the observed variability in vegetation state might be associated with variability in climatic drivers during relatively short periods within the year. Identification of such critical climate periods, when a particular climate variable most likely has a pronounced influence on the vegetation state of a particular ecosystem, becomes increasingly important in the light of climate change. In this study, we present a method to identify critical climate periods for eight different semi-natural ecosystem categories in Hungary, in Central Europe. The analysis was based on the moving-window correlation between MODIS NDVI/LAI and six climate variables with different time lags during the period 2000–2020. Distinct differences between the important climate variables, critical period lengths, and direction (positive or negative correlations) have been found for different ecosystem categories. Multiple linear models for NDVI and LAI were constructed to quantify the multivariate influence of the environmental conditions on the vegetation state during the late summer. For grasslands, the best models for NDVI explained 65–87% variance, while for broad-leaved forests, the highest explained variance for LAI was up to 50%. The proposed method can be easily implemented in other geographical locations and can provide essential insight into the functioning of different ecosystem types. Full article
Show Figures

Graphical abstract

14 pages, 2498 KiB  
Article
Msplit Estimation Approach to Modeling Vertical Terrain Displacement from TLS Data Disturbed by Outliers
by Robert Duchnowski and Patrycja Wyszkowska
Remote Sens. 2022, 14(21), 5620; https://doi.org/10.3390/rs14215620 - 07 Nov 2022
Cited by 2 | Viewed by 966
Abstract
Terrestrial laser scanning (TLS) is a modern measurement technique that provides a point cloud in a relatively short time. TLS data are usually processed using different methods in order to obtain the final result (infrastructure or terrain models). Msplit estimation is a [...] Read more.
Terrestrial laser scanning (TLS) is a modern measurement technique that provides a point cloud in a relatively short time. TLS data are usually processed using different methods in order to obtain the final result (infrastructure or terrain models). Msplit estimation is a modern method successfully applied for such a purpose. This paper addresses the possible application of the method in processing TLS data from two different epochs to model a vertical displacement of terrain resulting, for example, from landslides or mining damages. Msplit estimation can be performed in two variants (the squared or absolute method) and two scenarios (two point clouds or one combined point cloud). One should understand that point clouds usually contain outliers of different origins. Therefore, this paper considers the contamination of TLS data by positive or/and negative outliers. The results based on simulated data prove that absolute Msplit estimation provides better results and overperforms conventional estimation methods (least-squares or robust M-estimation). In practice, the processing of point clouds separately seems to be a better option. This paper proved that Msplit estimation is a compelling alternative to conventional methods, as it can be applied to process TLS data disturbed by outliers of different types. Full article
Show Figures

Graphical abstract

23 pages, 10041 KiB  
Article
Efficient SfM for Large-Scale UAV Images Based on Graph-Indexed BoW and Parallel-Constructed BA Optimization
by Sikang Liu, San Jiang, Yawen Liu, Wanchang Xue and Bingxuan Guo
Remote Sens. 2022, 14(21), 5619; https://doi.org/10.3390/rs14215619 - 07 Nov 2022
Cited by 5 | Viewed by 2222
Abstract
Structure from Motion (SfM) for large-scale UAV (Unmanned Aerial Vehicle) images has been widely used in the fields of photogrammetry and computer vision. Its efficiency, however, decreases dramatically as well as with the memory occupation rising steeply due to the explosion of data [...] Read more.
Structure from Motion (SfM) for large-scale UAV (Unmanned Aerial Vehicle) images has been widely used in the fields of photogrammetry and computer vision. Its efficiency, however, decreases dramatically as well as with the memory occupation rising steeply due to the explosion of data volume and the iterative BA (bundle adjustment) optimization. In this paper, an efficient SfM solution is proposed to solve the low-efficiency and high memory consumption problems. First, an algorithm is designed to find UAV image match pairs based on a graph-indexed bag-of-words (BoW) model (GIBoW), which treats visual words as vertices and link relations as edges to build a small-world graph structure. The small-world graph structure can be used to search the nearest-neighbor visual word for query features with extremely high efficiency. Reliable UAV image match pairs can effectively improve feature matching efficiency. Second, a central bundle adjustment with object point-wise parallel construction of the Schur complement (PSCBA) is proposed, which is designed as the combination of the LM (Levenberg–Marquardt) algorithm with the preconditioned conjugate gradients (PCG). The PSCBA method can dramatically reduce the memory consumption in both error and normal equations, as well as improve efficiency. Finally, by using four UAV datasets, the effectiveness of the proposed SfM solution is verified through comprehensive analysis and comparison. The experimental results show that compared with Colmap-Bow and Dbow2, the proposed graph index BoW retrieval algorithm improves the efficiency of image match pair selection with an acceleration ratio ranging from 3 to 7. Meanwhile, the parallel-constructed BA optimization algorithm can achieve accurate bundle adjustment results with an acceleration ratio by 2 to 7 times and reduce memory occupation by 2 to 3 times compared with the BA optimization using Ceres solver. For large-scale UAV images, the proposed method is an effective and reliable solution. Full article
Show Figures

Figure 1

18 pages, 6669 KiB  
Article
Dark Spot Detection from SAR Images Based on Superpixel Deeper Graph Convolutional Network
by Xiaojian Liu, Yansheng Li, Xinyi Liu and Huimin Zou
Remote Sens. 2022, 14(21), 5618; https://doi.org/10.3390/rs14215618 - 07 Nov 2022
Cited by 4 | Viewed by 1921
Abstract
Synthetic Aperture Radar (SAR) is the primary equipment used to detect oil slicks on the ocean’s surface. On SAR images, oil spill regions, as well as other places impacted by atmospheric and oceanic phenomena such as rain cells, upwellings, and internal waves, appear [...] Read more.
Synthetic Aperture Radar (SAR) is the primary equipment used to detect oil slicks on the ocean’s surface. On SAR images, oil spill regions, as well as other places impacted by atmospheric and oceanic phenomena such as rain cells, upwellings, and internal waves, appear as dark spots. Dark spot detection is typically the initial stage in the identification of oil spills. Because the identified dark spots are oil slick candidates, the quality of dark spot segmentation will eventually impact the accuracy of oil slick identification. Although certain sophisticated deep learning approaches employing pixels as primary processing units work well in remote sensing image semantic segmentation, finding some dark patches with weak boundaries and small regions from noisy SAR images remains a significant difficulty. In light of the foregoing, this paper proposes a dark spot detection method based on superpixels and deeper graph convolutional networks (SGDCNs), with superpixels serving as processing units. The contours of dark spots can be better detected after superpixel segmentation, and the noise in the SAR image can also be smoothed. Furthermore, features derived from superpixel regions are more robust than those derived from fixed pixel neighborhoods. Using the support vector machine recursive feature elimination (SVM-RFE) feature selection algorithm, we obtain an excellent subset of superpixel features for segmentation to reduce the learning task difficulty. After that, the SAR images are transformed into graphs with superpixels as nodes, which are fed into the deeper graph convolutional neural network for node classification. SGDCN leverages a differentiable aggregation function to aggregate the node and neighbor features to form more advanced features. To validate our method, we manually annotated six typical large-scale SAR images covering the Baltic Sea and constructed a dark spot detection dataset. The experimental results demonstrate that our proposed SGDCN is robust and effective compared with several competitive baselines. This dataset has been made publicly available along with this paper. Full article
(This article belongs to the Special Issue Reinforcement Learning Algorithm in Remote Sensing)
Show Figures

Figure 1

18 pages, 12814 KiB  
Article
Efficient and Robust Feature Matching for High-Resolution Satellite Stereos
by Danchao Gong, Xu Huang, Jidan Zhang, Yongxiang Yao and Yilong Han
Remote Sens. 2022, 14(21), 5617; https://doi.org/10.3390/rs14215617 - 07 Nov 2022
Cited by 3 | Viewed by 1410
Abstract
Feature matching between high-resolution satellite stereos plays an important role in satellite image orientation. However, images of changed regions, weak-textured regions and occluded regions may generate low-quality matches or even mismatches. Furthermore, matching throughout the entire satellite images often has extremely high time [...] Read more.
Feature matching between high-resolution satellite stereos plays an important role in satellite image orientation. However, images of changed regions, weak-textured regions and occluded regions may generate low-quality matches or even mismatches. Furthermore, matching throughout the entire satellite images often has extremely high time cost. To compute good matching results at low time cost, this paper proposes an image block selection method for high-resolution satellite stereos, which processes feature matching in several optimal blocks instead of the entire images. The core of the method is to formulate the block selection into the optimization of an energy function, and a greedy strategy is designed to compute an approximate solution. The experimental comparisons on various satellite stereos show that the proposed method could achieve similar matching accuracy and much lower time cost when compared with some state-of-the-art satellite image matching methods. Thus, the proposed method is a good compromise between matching accuracy and matching time, which has great potential in large-scale satellite applications. Full article
Show Figures

Figure 1

22 pages, 27291 KiB  
Article
Assessing Changes in Boreal Vegetation of Kola Peninsula via Large-Scale Land Cover Classification between 1985 and 2021
by Ekaterina Sklyar and Gareth Rees
Remote Sens. 2022, 14(21), 5616; https://doi.org/10.3390/rs14215616 - 07 Nov 2022
Cited by 3 | Viewed by 1710
Abstract
The effective monitoring of boreal and tundra vegetation at different scales and environmental management at latitudes above 50 degrees North relies heavily on remote sensing. The vastness, remoteness and, in the case of Russia, the difficulty of access to boreal–tundra vegetation make it [...] Read more.
The effective monitoring of boreal and tundra vegetation at different scales and environmental management at latitudes above 50 degrees North relies heavily on remote sensing. The vastness, remoteness and, in the case of Russia, the difficulty of access to boreal–tundra vegetation make it an ideal technique for vegetation monitoring in the Kola peninsula, located predominantly beyond the Arctic circle in the European part of Russia. Since the 1930s, this area has been highly urbanised and exposed to strong influence by a number of different types of human impact, such as toxic pollutions, fires, mineral excavation, grazing, logging, etc. Extensive open archives of remote sensing imagery as well as recent advances in machine learning further enable the efficient use of remote sensing methods for assessing land cover changes. Here, we present the results of mapping northern vegetation land cover and changes in it over a large territory, in time and under human impact based on remote imagery from Landsat TM, ETM+ and OLI. We study the area of about 37,000 km2 located in the central part of the Kola peninsula in the boreal, pre-tundra and tundra between 1985 and 2021 with a time interval of approximately 5 years and confirm the correlations between the human pressure and the level of vegetation changes. We put those into the perspective of year-on-year changes in the temperature and precipitation regimes and describe the recovery of the damaged original boreal vegetation (dominated by spruce) through pine and deciduous vegetation. As a by-product of this study, we develop and test an approach for the semi-automated processing and classification of Landsat images using the novel TensorFlow machine learning technique (widely spread across other disciplines) that enables high-throughput classification, even on conventional hardware. Full article
(This article belongs to the Special Issue Remote Sensing of the Russian Boreal Forest)
Show Figures

Figure 1

26 pages, 20034 KiB  
Article
Adaptive Multi-Proxy for Remote Sensing Image Retrieval
by Xinyue Li, Song Wei, Jian Wang, Yanling Du and Mengying Ge
Remote Sens. 2022, 14(21), 5615; https://doi.org/10.3390/rs14215615 - 07 Nov 2022
Cited by 3 | Viewed by 1778
Abstract
With the development of remote sensing technology, content-based remote sensing image retrieval has become a research hotspot. Remote sensing image datasets not only contain rich location, semantic and scale information but also have large intra-class differences. Therefore, the key to improving the performance [...] Read more.
With the development of remote sensing technology, content-based remote sensing image retrieval has become a research hotspot. Remote sensing image datasets not only contain rich location, semantic and scale information but also have large intra-class differences. Therefore, the key to improving the performance of remote sensing image retrieval is to make full use of the limited sample information to extract more comprehensive class features. In this paper, we propose a proxy-based deep metric learning method and an adaptive multi-proxy framework. First, we propose an intra-cluster sample synthesis strategy with a random factor, which uses the limited samples in batch to synthesize more samples to enhance the network’s learning of unobvious features in the class. Second, we propose an adaptive proxy assignment method to assign multiple proxies according to the cluster of samples within a class, and to determine weights for each proxy according to the cluster scale to accurately and comprehensively measure the sample-class similarity. Finally, we incorporate a rigorous evaluation metric mAP@R and a variety of dataset partitioning methods, and conduct extensive experiments on commonly used remote sensing image datasets. Full article
(This article belongs to the Section Remote Sensing Image Processing)
Show Figures

Figure 1

32 pages, 13511 KiB  
Article
Atmospheric GNSS RO 1D-Var in Use at UCAR: Description and Validation
by Tae-Kwon Wee, Richard A. Anthes, Douglas C. Hunt, William S. Schreiner and Ying-Hwa Kuo
Remote Sens. 2022, 14(21), 5614; https://doi.org/10.3390/rs14215614 - 07 Nov 2022
Cited by 6 | Viewed by 1694
Abstract
This paper describes, along with some validation results, the one-dimensional variational method (1D-Var) that is in use at the University Corporation for Atmospheric Research (UCAR) to retrieve atmospheric profiles of temperature, pressure, and humidity from the observation of the Global Navigation Satellite System [...] Read more.
This paper describes, along with some validation results, the one-dimensional variational method (1D-Var) that is in use at the University Corporation for Atmospheric Research (UCAR) to retrieve atmospheric profiles of temperature, pressure, and humidity from the observation of the Global Navigation Satellite System (GNSS) radio occultation (RO). The retrieved profiles are physically consistent among the variables and statistically optimal as regards to a priori error statistics. Tests with idealized data demonstrate that the 1D-Var is highly effective in spreading the observational information and confirm that the method works as designed and expected, provided that correct input data are given. Tests for real-world data sets show that the retrieved profiles agree remarkably well with global weather analyses and collocated high vertical resolution radiosonde observations, and that the 1D-Var can produce value-added retrievals with respect to a priori profiles. We also find that the retrieved profiles are of exceptional long-term stability, suggesting that the 1D-Var can provide an excellent climate data record. Full article
Show Figures

Graphical abstract

21 pages, 11746 KiB  
Article
Spatio-Temporal Heterogeneity of Ecological Quality in Hangzhou Greater Bay Area (HGBA) of China and Response to Land Use and Cover Change
by Zhenjie Yang, Chao Sun, Junwei Ye, Congying Gan, Yue Li, Lingyu Wang and Yujun Chen
Remote Sens. 2022, 14(21), 5613; https://doi.org/10.3390/rs14215613 - 07 Nov 2022
Cited by 6 | Viewed by 2624
Abstract
Human activities have been stressing the ecological environment since we stepped into the Anthropocene Age. It is urgent to formulate a sustainable plan for balancing socioeconomic development and ecological conservation based on a thorough understanding of ecological environment changes. The ecological environment can [...] Read more.
Human activities have been stressing the ecological environment since we stepped into the Anthropocene Age. It is urgent to formulate a sustainable plan for balancing socioeconomic development and ecological conservation based on a thorough understanding of ecological environment changes. The ecological environment can be evaluated when multiple remote sensing indices are integrated, such as the use of the recently prevalent Remote Sensing-based Ecological Index (RSEI). Currently, most of the RSEI-related studies have focused on the ecological quality evolution in small areas. Less attention was paid to the spatio-temporal heterogeneity of ecological quality in large-scale urban agglomerations and the potential links with Land Use and Cover Change (LUCC). In this study, we monitored the dynamics of the ecological quality in the Hangzhou Greater Bay Area (HGBA) during 1995–2020, using the RSEI as an indicator. During the construction of the RSEI, a percentile de-noising normalization method was proposed to overcome the problem of widespread noises from large-scale regions and make the RSEI-based ecological quality assessment for multiple periods comparable. Combined with the land use data, the quantitative relationship between the ecological quality and the LUCC was revealed. The results demonstrated that: (1) The ecological quality of the HGBA degraded after first improving but was still good (averaged RSEI of 0.638). It was divergent for the prefecture-level cities of the HGBA, presenting degraded, improved, and fluctuant trends for the cities from north to south. (2) For ecological quality, the improved regions have larger area (57.5% vs. 42.5%) but less increment (0.141 vs. −0.195) than the degraded regions. Mountains, downtowns, and coastal wetlands were the hot spots for the improvement and urbanization, and reclamation processes were responsible for the degradation. (3) The ecological quality was improved for forests and urban areas (△RSEI > 0.07) but degraded for farmland (∆RSEI = −0.03). As a result, the ecological cost was reduced among human-dominant environments (e.g., farmland, urban areas) while enlarged for the conversion from nature-(e.g., forests) to human-dominant environments. Full article
Show Figures

Graphical abstract

22 pages, 9929 KiB  
Article
Comparison on Quantitative Analysis of Olivine Using MarSCoDe Laser-Induced Breakdown Spectroscopy in a Simulated Martian Atmosphere
by Xiangfeng Liu, Weiming Xu, Luning Li, Xuesen Xu, Hai Qi, Zhenqiang Zhang, Fan Yang, Zhixin Yan, Chongfei Liu, Rujun Yuan, Xiong Wan and Rong Shu
Remote Sens. 2022, 14(21), 5612; https://doi.org/10.3390/rs14215612 - 07 Nov 2022
Cited by 2 | Viewed by 1566
Abstract
A Mars Surface Composition Detector (MarSCoDe) instrument mounted on Zhurong rover of Tianwen-1, adopts Laser-Induced Breakdown Spectroscopy (LIBS), with no sample preparation or dust and coatings ablation required, to conduct rapid multi-elemental analysis and characterization of minerals, rocks and soils on the surface [...] Read more.
A Mars Surface Composition Detector (MarSCoDe) instrument mounted on Zhurong rover of Tianwen-1, adopts Laser-Induced Breakdown Spectroscopy (LIBS), with no sample preparation or dust and coatings ablation required, to conduct rapid multi-elemental analysis and characterization of minerals, rocks and soils on the surface of Mars. To test the capability of MarSCoDe LIBS measurement and quantitative analysis, some methods of multivariate analysis on olivine samples with gradient concentrations were inspected based on the spectra acquired in a Mars-simulated environment before the rover launch in 2020. Firstly, LIBS spectra need preprocessing, including background subtraction, random signal denoising, continuum baseline removal, spectral drift correction and wavelength calibration, radiation calibration, and multi-channel spectra subset merging. Then, the quantitative analysis with univariate linear regression (ULR) and multivariate linear regression (MLR) are performed on the characteristic lines, while principal component regression (PCR), partial least square regression (PLSR), ridge, least-absolute-shrinkage-and-selection-operator (LASSO) and elastic net, and nonlinear analysis with back-propagation (BP) are conducted on the entire spectral information. Finally, the performance on the quantitative olivine analyzed by MarSCoDe LIBS is compared with the mean spectrum and all spectra for each sample and evaluated by some statistical indicators. The results show that: (1) the calibration curve of ULR constructed by the characteristic line of magnesium and iron indicates the linear relationship between the spectral signal and the element concentration, and the limits of detection of forsterite and fayalite is 0.9943 and 2.0536 (c%) analyzed by mean spectra, and 2.3354 and 3.8883 (c%) analyzed by all spectra; (2) the R2 value on the calibration and validation of all the methods is close to 1, and the predicted concentration estimated by these calibration models is close to the true concentration; (3) the shrinkage or regularization technique of ridge, LASSO and elastic net perform better than the ULR and MLR, except for ridge overfitting on the testing sample; the best results can be obtained by the dimension reduction technique of PCR and PLSR, especially with PLSR; and BP is more applicable for the sample measured with larger spectral dataset. Full article
Show Figures

Graphical abstract

20 pages, 4894 KiB  
Article
Remote Sensing of the Seasonal and Interannual Variability of Surface Chlorophyll-a Concentration in the Northwest Pacific over the Past 23 Years (1997–2020)
by Shuangling Chen, Yu Meng, Sheng Lin and Jingyuan Xi
Remote Sens. 2022, 14(21), 5611; https://doi.org/10.3390/rs14215611 - 07 Nov 2022
Cited by 4 | Viewed by 1861
Abstract
Phytoplankton in the northwest Pacific plays an important role in absorbing atmospheric CO2 and promoting the ocean carbon cycle. However, our knowledge on the long-term interannual variabilities of the phytoplankton biomass in this region is quite limited. In this study, based on [...] Read more.
Phytoplankton in the northwest Pacific plays an important role in absorbing atmospheric CO2 and promoting the ocean carbon cycle. However, our knowledge on the long-term interannual variabilities of the phytoplankton biomass in this region is quite limited. In this study, based on the Chlorophyll-a concentration (Chl-a) time series observed from ocean color satellites of Sea-viewing Wide Field-of-view Sensor (SeaWiFS) and Moderate Resolution Imaging Spectroradiometer (MODIS) in the period of 1997–2020, we investigated the variabilities of Chl-a on both seasonal and interannual scales, as well as the long-term trends. The phytoplankton Chl-a showed large spatial dynamics with a general decreasing pattern poleward. The seasonal phytoplankton blooms dominated the seasonal characteristics of Chl-a, with spring and fall blooms identified in subpolar waters and single spring blooms in subtropical seas. On interannual scales, we found a Chl-a increasing belt in the subpolar oceans from the marginal sea toward the northeast open ocean waters, with positive trends (~0.02 mg m−3 yr−1, on average) in Chl-a at significant levels (p < 0.05). In the subtropical gyre, Chl-a showed slight but significant negative trends (i.e., <−0.0006 mg m−3 yr−1, at p < 0.05). The negative Chl-a trends in the subtropical waters tended to be driven by the surface warming, which could inhibit nutrient supplies from the subsurface and thus limit phytoplankton growth. For the subpolar waters, although the surface warming also prevailed over the study period, the in situ surface nitrate reservoir somehow showed significant increases in the targeted spots, indicating potential external nitrate supplies into the surface layer. We did not find significant connections between the Chl-a interannual variabilities and the climate indices in the study area. Environmental data with finer spatial and temporal resolutions will further constrain the findings. Full article
Show Figures

Figure 1

20 pages, 4579 KiB  
Article
Modelling Permafrost Characteristics and Its Relationship with Environmental Constraints in the Gaize Area, Qinghai-Tibet Plateau, China
by Yudan Wang, Hao Chen, Zhuotong Nan and Zhihai Shang
Remote Sens. 2022, 14(21), 5610; https://doi.org/10.3390/rs14215610 - 07 Nov 2022
Cited by 3 | Viewed by 1437
Abstract
The impact of environmental constraints on permafrost distribution and characteristics of the remote western Qinghai-Tibetan Plateau (QTP) were seldom reported. Using augmented Noah land surface model, this study aims to elaborate the permafrost characteristics and their relationship with key environmental constraints in the [...] Read more.
The impact of environmental constraints on permafrost distribution and characteristics of the remote western Qinghai-Tibetan Plateau (QTP) were seldom reported. Using augmented Noah land surface model, this study aims to elaborate the permafrost characteristics and their relationship with key environmental constraints in the Gaize, a transitional area with mosaic distribution of permafrost and seasonally frozen ground in the western QTP. There were two soil parameter schemes, two thermal roughness schemes, and three vegetation parameter schemes with optimal minimum stomatal resistance established using MODIS NDVI, turbulent flux, and field survey data. Forcing data were extracted from the China Meteorological Forcing Dataset (CMFD) and downscaled to 5 km × 5 km resolution. Results show that the error of simulated mean annual ground temperatures (MAGT) were less than 1.0 °C for nine boreholes. The Kappa coefficiency between three types of permafrost and three types of vegetation is 0.654, which indicates the close relationship between the presence of certain vegetation types and the occurrence of certain permafrost types in the Gaize. Permafrost distribution and characteristics of the Gaize are jointly influenced by both altitude and vegetation. The relationship of permafrost with environmental constraints over the Gaize is significantly different from that of the West Kunlun, a western, predominantly permafrost-distributed area. Full article
(This article belongs to the Special Issue Remote Sensing and Land Surface Process Models for Permafrost Studies)
Show Figures

Figure 1

15 pages, 4739 KiB  
Article
Sidelobes Suppression for Time Domain Anti-Jamming of Satellite Navigation Receivers
by Wenxiang Liu, Zukun Lu, Zhiying Wang, Xianghao Li, Zongnan Li, Wei Xiao, Xiaozhou Ye, Zhi Wang, Jie Song, Jia Qiao and Baiyu Li
Remote Sens. 2022, 14(21), 5609; https://doi.org/10.3390/rs14215609 - 07 Nov 2022
Cited by 5 | Viewed by 1557
Abstract
The global satellite navigation system represented by global position systems (GPS) has been widely used in civil and military fields, and has become an important cornerstone of space-time information services. However, the frequency band of satellite navigation signals is open, and the frequency [...] Read more.
The global satellite navigation system represented by global position systems (GPS) has been widely used in civil and military fields, and has become an important cornerstone of space-time information services. However, the frequency band of satellite navigation signals is open, and the frequency points overlap with some radars and communication systems, which brings challenges to the application of satellite navigation. Time-domain adaptive filtering technology is a typical anti-jamming method which can suppress the narrow-band interference faced by satellite navigation. However, in the process of suppressing narrow-band interference, the navigation signal will be distorted, which is mainly reflected in the distortion of the spectrum of the navigation signal, which will lead to the enhancement of the side lobes in the correlation function. In this paper, we focus on time-domain adaptive anti-jamming, study the mechanism of correlation function sidelobes lift caused by narrow-band interference suppression, and propose a correlation function sidelobes suppression method based on time-domain adaptive anti-jamming, which can be realized without losing anti-jamming performance. The simulation experiment verifies the validity of the mechanism analysis of the sidelobes lift of the correlation function and the effectiveness of the proposed method. The analysis results and the proposed method are of great significance, which is reflected in the improvement of the anti-jamming performance and acquisition performance of satellite navigation receivers. Full article
(This article belongs to the Section Satellite Missions for Earth and Planetary Exploration)
Show Figures

Figure 1

21 pages, 5537 KiB  
Article
UAV-Based Multi-Temporal Thermal Imaging to Evaluate Wheat Drought Resistance in Different Deficit Irrigation Regimes
by Weilong Qin, Jian Wang, Longfei Ma, Falv Wang, Naiyue Hu, Xianyue Yang, Yiyang Xiao, Yinghua Zhang, Zhencai Sun, Zhimin Wang and Kang Yu
Remote Sens. 2022, 14(21), 5608; https://doi.org/10.3390/rs14215608 - 07 Nov 2022
Cited by 9 | Viewed by 2533
Abstract
Deficit irrigation is a common approach in water-scarce regions to balance productivity and water use, whereas drought stress still occurs to various extents, leading to reduced physiological performance and a decrease in yield. Therefore, seeking a rapid and reliable method to identify wheat [...] Read more.
Deficit irrigation is a common approach in water-scarce regions to balance productivity and water use, whereas drought stress still occurs to various extents, leading to reduced physiological performance and a decrease in yield. Therefore, seeking a rapid and reliable method to identify wheat varieties with drought resistance can help reduce yield loss under water deficit. In this study, we compared ten wheat varieties under three deficit irrigation systems (W0, no irrigation during the growing season; W1, irrigation at jointing; W2, irrigation at jointing and anthesis). UAV thermal imagery, plant physiological traits [leaf area index (LAI), SPAD, photosynthesis (Pn), transpiration (Tr), stomatal conductance (Cn)], biomass and yield were acquired at different growth stages. Wheat drought resistance performance was evaluated through using the canopy temperature extracted from UAV thermal imagery (CT-UAV), in combination with hierarchical cluster analysis (HCA). The CT-UAV of W0 and W1 treatments was significantly higher than in the W2 treatment, with the ranges of 24.8–33.3 °C, 24.3–31.6 °C, and 24.1–28.9 °C in W0, W1 and W2, respectively. We found negative correlations between CT-UAV and LAI, SPAD, Pn, Tr, Cn and biomass under the W0 (R2 = 0.41–0.79) and W1 treatments (R2 = 0.22–0.72), but little relevance for W2 treatment. Under the deficit irrigation treatments (W0 and W1), UAV thermal imagery was less effective before the grain-filling stage in evaluating drought resistance. This study demonstrates the potential of ensuring yield and saving irrigation water by identifying suitable wheat varieties for different water-scarce irrigation scenarios. Full article
Show Figures

Figure 1

20 pages, 14640 KiB  
Article
Using Hyperspectral Remote Sensing to Monitor Water Quality in Drinking Water Reservoirs
by Clémence Goyens, Héloïse Lavigne, Antoine Dille and Han Vervaeren
Remote Sens. 2022, 14(21), 5607; https://doi.org/10.3390/rs14215607 - 07 Nov 2022
Cited by 11 | Viewed by 3162
Abstract
At the Blankaart Water Production Center, a reservoir containing 3 million m3 of raw surface water acts as a first biologic treatment step before further processing to drinking water. Over the past decade, severe algal blooms have occurred in the reservoir, hampering [...] Read more.
At the Blankaart Water Production Center, a reservoir containing 3 million m3 of raw surface water acts as a first biologic treatment step before further processing to drinking water. Over the past decade, severe algal blooms have occurred in the reservoir, hampering the water production. Therefore, strategies (e.g., the injection of algaecide) have been looked at to prevent these from happening or try to control them. In this context, the HYperspectral Pointable System for Terrestrial and Aquatic Radiometry (HYPSTAR), installed since early 2021, helps in monitoring the effectiveness of these strategies. Indeed, the HYPSTAR provides, at a very high temporal resolution, bio-optical parameters related to the water quality, i.e., Chlorophyll-a (Chla) concentrations and suspended particulate matter (SPM). The present paper shows how the raw in situ hyperspectral data (a total of 8116 spectra recorded between 2021-02-03 and 2022-08-03, of which 2988 spectra passed the quality check) are processed to find the water-leaving reflectance and how SPM and Chla are derived from it. Based on a limited number of validation data, we also discuss the potential of retrieving phycocyanin (an accessory pigment unique to freshwater cyanobacteria). The results show the benefits of the high temporal resolution of the HYPSTAR to provide near real-time water quality indicators. The study confirms that, in conjunction with a few water sampling data used for validation, the HYPSTAR can be used as a quick and cost-effective method to detect and monitor phytoplankton blooms. Full article
(This article belongs to the Special Issue Innovative Belgian Earth Observation Research for the Environment)
Show Figures

Figure 1

16 pages, 5364 KiB  
Article
Spatial Variability of Active Layer Thickness along the Qinghai–Tibet Engineering Corridor Resolved Using Ground-Penetrating Radar
by Shichao Jia, Tingjun Zhang, Jiansheng Hao, Chaoyue Li, Roger Michaelides, Wanwan Shao, Sihao Wei, Kun Wang and Chengyan Fan
Remote Sens. 2022, 14(21), 5606; https://doi.org/10.3390/rs14215606 - 07 Nov 2022
Cited by 2 | Viewed by 1660
Abstract
Active layer thickness (ALT) is a sensitive indicator of response to climate change. ALT has important influence on various aspects of the regional environment such as hydrological processes and vegetation. In this study, 57 ground-penetrating radar (GPR) sections were surveyed along the Qinghai–Tibet [...] Read more.
Active layer thickness (ALT) is a sensitive indicator of response to climate change. ALT has important influence on various aspects of the regional environment such as hydrological processes and vegetation. In this study, 57 ground-penetrating radar (GPR) sections were surveyed along the Qinghai–Tibet Engineering Corridor (QTEC) during 2018–2021, covering a total length of 58.5 km. The suitability of GPR-derived ALT was evaluated using in situ measurements and reference datasets, for which the bias and root mean square error were approximately −0.16 and 0.43 m, respectively. The GPR results show that the QTEC ALT was in the range of 1.25–6.70 m (mean: 2.49 ± 0.57 m). Observed ALT demonstrated pronounced spatial variability at both regional and fine scales. We developed a statistical estimation model that explicitly considers the soil thermal regime (i.e., ground thawing index, TIg), soil properties, and vegetation. This model was found suitable for simulating ALT over the QTEC, and it could explain 52% (R2 = 0.52) of ALT variability. The statistical model shows that a difference of 10 °C.d in TIg is equivalent to a change of 0.67 m in ALT, and an increase of 0.1 in the normalized difference vegetation index (NDVI) is equivalent to a decrease of 0.23 m in ALT. The fine-scale (<1 km) variation in ALT could account for 77.6% of the regional-scale (approximately 550 km) variation. These results provide a timely ALT benchmark along the QTEC, which can inform the construction and maintenance of engineering facilities along the QTEC. Full article
Show Figures

Graphical abstract

18 pages, 6407 KiB  
Article
A Spatial–Temporal Depth-Wise Residual Network for Crop Sub-Pixel Mapping from MODIS Images
by Yuxian Wang, Yuan Fang, Wenlong Zhong, Rongming Zhuo, Junhuan Peng and Linlin Xu
Remote Sens. 2022, 14(21), 5605; https://doi.org/10.3390/rs14215605 - 07 Nov 2022
Viewed by 1672
Abstract
To address the problem caused by mixed pixels in MODIS images for high-resolution crop mapping, this paper presents a novel spatial–temporal deep learning-based approach for sub-pixel mapping (SPM) of different crop types within mixed pixels from MODIS images. High-resolution cropland data layer (CDL) [...] Read more.
To address the problem caused by mixed pixels in MODIS images for high-resolution crop mapping, this paper presents a novel spatial–temporal deep learning-based approach for sub-pixel mapping (SPM) of different crop types within mixed pixels from MODIS images. High-resolution cropland data layer (CDL) data were used as ground references. The contributions of this paper are summarized as follows. First, we designed a novel spatial–temporal depth-wise residual network (ST-DRes) model that can simultaneously address both spatial and temporal data in MODIS images in efficient and effective manners for improving SPM accuracy. Second, we systematically compared different ST-DRes architecture variations with fine-tuned parameters for identifying and utilizing the best neural network architecture and hyperparameters. We also compared the proposed method with several classical SPM methods and state-of-the-art (SOTA) deep learning approaches. Third, we evaluated feature importance by comparing model performances with inputs of different satellite-derived metrics and different combinations of reflectance bands in MODIS. Last, we conducted spatial and temporal transfer experiments to evaluate model generalization abilities across different regions and years. Our experiments show that the ST-DRes outperforms the other classical SPM methods and SOTA backbone-based methods, particularly in fragmented categories, with the mean intersection over union (mIoU) of 0.8639 and overall accuracy (OA) of 0.8894 in Sherman County. Experiments in the datasets of transfer areas and transfer years also demonstrate better spatial–temporal generalization capabilities of the proposed method. Full article
Show Figures

Figure 1

16 pages, 6974 KiB  
Article
Analysis of the Microphysical Structure and Evolution Characteristics of a Typical Sea Fog Weather Event in the Eastern Sea of China
by Jianxin He, Xinyue Ren, Hao Wang, Zhao Shi, Fugui Zhang, Lijun Hu, Qiangyu Zeng and Xin Jin
Remote Sens. 2022, 14(21), 5604; https://doi.org/10.3390/rs14215604 - 06 Nov 2022
Cited by 3 | Viewed by 1739
Abstract
This study is the first to use the observation data of a fog monitor, a visibility meter, and an automatic weather station to carry out a comprehensive observation experiment from the perspective of microphysics on a severe sea fog process in Beilun District, [...] Read more.
This study is the first to use the observation data of a fog monitor, a visibility meter, and an automatic weather station to carry out a comprehensive observation experiment from the perspective of microphysics on a severe sea fog process in Beilun District, China, from 14 to 15 June 2021. The results show the following: (1) Temperature is closely related to nucleation, condensation growth, and other processes. The decrease (increase) in temperature is the main reason for the enhancement (weakening) of nucleation and the growth of condensation (evaporation of droplets), which leads to an increase (or decrease) in microphysical quantities, such as droplet number concentration and liquid water content. (2) The average droplet number spectral distribution roughly conforms to the Gamma distribution, and the spectral distribution of the fog process presents a ”multi-peak” structure, with peak diameters of 6 μm, 12 μm, 16 μm, 24 μm, and 44 μm. Droplets with a diameter of less than 16 μm account for 75% of the droplet size distribution. (3) During this sea fog process, three microphysical parameters, namely, number concentration, liquid water content, and average diameter, are all positively correlated in pairs, but the positive correlation between the number concentration and the average diameter is weak. This shows that the condensation nucleation and the condensation growth of droplets are the main processes in this sea fog process and that the collision process occurs but is not the dominant process. The sea fog comprehensive observation experiment provides an important demonstration of the microphysics research of sea fog in the eastern coastal areas of China and provides more reference information for sea fog research and equipment comparisons between different regions. At the same time, it also provides an essential scientific basis for the short-term forecast of sea fog in the future and for the optimization of the microphysical parameters of related models. Full article
Show Figures

Graphical abstract

15 pages, 10804 KiB  
Technical Note
Noised Phase Unwrapping Based on the Adaptive Window of Wigner Distribution
by Junqiu Chu, Xingling Liu, Haotong Ma, Xuegang Yu and Ge Ren
Remote Sens. 2022, 14(21), 5603; https://doi.org/10.3390/rs14215603 - 06 Nov 2022
Viewed by 1393
Abstract
A noised phase-unwrapping method is presented by using the Wigner distribution function to filter the phase noise and restore the gradient of the phase map. By using Poisson’s equation, the unwrapped phase map was obtained. Compared with the existing methods, the proposed method [...] Read more.
A noised phase-unwrapping method is presented by using the Wigner distribution function to filter the phase noise and restore the gradient of the phase map. By using Poisson’s equation, the unwrapped phase map was obtained. Compared with the existing methods, the proposed method is theoretically simple, provides a more accurate representation, and can be implemented in light-field hardware devices, such as Shack-Hartmann sensors. Full article
Show Figures

Figure 1

14 pages, 3345 KiB  
Article
Contribution of Sentinel-3A Radar Altimetry Data to the Study of the Water Level Variations in Lake Buyo (West of Côte d’Ivoire)
by Sékouba Oularé, Valère-Carin Jofack Sokeng, Koffi Fernand Kouamé, Christian Armel Kouassi Komenan, Jean Homian Danumah, Benoit Mertens, You Lucette Akpa, Thibault Catry and Benjamin Pillot
Remote Sens. 2022, 14(21), 5602; https://doi.org/10.3390/rs14215602 - 06 Nov 2022
Cited by 2 | Viewed by 1612
Abstract
The artificial Lake Buyo is an important water reservoir that ensures the availability of water for multiple purposes: drinking water supply, fishing, and energy. In the last five years, this lake has experienced extreme variations in its surface area and water levels, including [...] Read more.
The artificial Lake Buyo is an important water reservoir that ensures the availability of water for multiple purposes: drinking water supply, fishing, and energy. In the last five years, this lake has experienced extreme variations in its surface area and water levels, including very significant declines, which has impacted the supply of electricity. This study aimed to assess temporal variations in the water levels of Lake Buyo using radar altimetry. Altimetric data from the Sentinel-3A satellite on Lake Buyo (tracks 16 (orbit 8) and 743 (orbit 372)) were selected over the period from 31 May 2016 to 12 June 2021 and compared to the in situ measurements provided by the Direction de la Production de l’Electricité de Côte d’Ivoire (DPE-CI). The extraction of the time series of the Sentinel-3A altimetric water levels and their corrections (geophysical and environmental corrections) were carried out with the ALTiS software. The results showed an overall agreement between the altimetric water levels and the in situ measurements, with a correlation coefficient (R2) ranging from 0.98 to 0.99 obtained, as well as a Nash–Sutcliffe Efficiency (NSE) coefficient also between 0.98 and 0.99. Further, the bias (0.12 m and 0.13 m) and root mean square error (RMSE) (0.38 and 0.67 m) values showed that the results were acceptable. The analysis of the water levels time series allowed for the identification of two main periods: March to October and November to February. The first period corresponded to a high level period, recording a maximum level of 200.06 m. The second period, from November to March, was characterized by a drop in the water level, recording a minimum level of 187.42 m. The water levels time series provided by Sentinel-3 allowed us to appreciate the respective influences of seasonal and interannual variations on rainfall and the contributions of the Sassandra River tributaries to the water levels of Lake Buyo. Full article
(This article belongs to the Special Issue Remote Sensing of Water Resources Vulnerability)
Show Figures

Figure 1

19 pages, 5420 KiB  
Article
Distribution Characteristics of Cloud Types and Cloud Phases over China and Their Relationship with Cloud Temperature
by Hongke Cai, Yue Yang and Quanliang Chen
Remote Sens. 2022, 14(21), 5601; https://doi.org/10.3390/rs14215601 - 06 Nov 2022
Cited by 2 | Viewed by 1649
Abstract
The existence of clouds significantly increases or decreases the net radiation of the Earth. The influence of cloud type and cloud phase on radiation is as important as cloud amount, and the physical processes of different types of clouds are obviously different. In [...] Read more.
The existence of clouds significantly increases or decreases the net radiation of the Earth. The influence of cloud type and cloud phase on radiation is as important as cloud amount, and the physical processes of different types of clouds are obviously different. In this study, the occurrence frequency of different cloud types (low transparent, low opaque, stratocumulus, broken cumulus, altocumulus transparent, altostratus opaque, cirrus, and deep convective) and cloud phases (ice and water) over China and its surrounding areas (0–55°N, 70–140°E) are calculated based on cloud vertical feature mask products from the Cloud-Aerosol Lidar with Orthogonal Polarization (CALIOP). The results show significant spatial differences and seasonal variations in the distribution of different cloud types and cloud phases. There are four prevailing cloud types over the whole year, among which cirrus and altocumulus transparent are the most widely distributed and have the highest occurrence frequency. Cirrus clouds are mainly distributed at altitudes above 6 km north of 30°N and south of 20°N. Altocumulus transparent clouds are mainly distributed over the Qinghai–Tibet Plateau and at an altitude of 3–6 km to the north of 40°N, and they are more widely distributed in winter than in summer. Water clouds are mainly distributed in the latitude range of 20°N–40°N and are obviously influenced by the Qinghai–Tibet Plateau. Water clouds are widely distributed in autumn and winter. Ice clouds are mainly distributed in the areas south of 20°N and north of 40°N. Regardless of the choice of altitude between 3 km and 7 km, the boundary between ice cloud and water cloud is always near the −14 °C isotherm, and when the −14 °C isotherm moves southward, the ice-cloud distribution range expands southward. The probability density functions of the temperature in the cloud always show the distribution characteristics of two peaks and one valley, which is particularly obvious in the middle and high clouds, and the peak temperature is warmer than the sub-peak temperature. The valley temperature and its corresponding latitude of all cloud types are different: the cirrus valley temperature is not significantly affected by the Qinghai–Tibet Plateau, but the plateau has an effect on the latitude of the valley temperature distribution of other types of cloud. The above conclusions lay the foundation for further research on the radiation effects of different clouds on China and its surrounding areas and also have certain indicating significance for weather effects caused by various cloud physical processes. Full article
(This article belongs to the Section Atmospheric Remote Sensing)
Show Figures

Figure 1

23 pages, 13349 KiB  
Article
A Lightweight Multi-Level Information Network for Multispectral and Hyperspectral Image Fusion
by Mingming Ma, Yi Niu, Chang Liu, Fu Li and Guangming Shi
Remote Sens. 2022, 14(21), 5600; https://doi.org/10.3390/rs14215600 - 06 Nov 2022
Viewed by 1668
Abstract
The process of fusing the rich spectral information of a low spatial resolution hyperspectral image (LR-HSI) with the spatial information of a high spatial resolution multispectral image (HR-MSI) to obtain an HSI with the spatial resolution of an MSI image is called hyperspectral [...] Read more.
The process of fusing the rich spectral information of a low spatial resolution hyperspectral image (LR-HSI) with the spatial information of a high spatial resolution multispectral image (HR-MSI) to obtain an HSI with the spatial resolution of an MSI image is called hyperspectral image fusion (HIF). To reconstruct hyperspectral images at video frame rate, we propose a lightweight multi-level information network (MINet) for multispectral and hyperspectral image fusion. Specifically, we develop a novel lightweight feature fusion model, namely residual constraint block based on global variance fine-tuning (GVF-RCB), to complete the feature extraction and fusion of hyperspectral images. Further, we define a residual activity factor to judge the learning ability of the residual module, thereby verifying the effectiveness of GVF-RCB. In addition, we use cascade cross-level fusion to embed the different spectral bands of the upsampled LR-HSI in a progressive manner to compensate for lost spectral information at different levels and to maintain spatial high frequency information at all times. Experiments on different datasets show that our MINet outperforms the state-of-the-art methods in terms of objective metrics, in particular by requiring only 30% of the running time and 20% of the number of parameters. Full article
(This article belongs to the Special Issue Deep Learning for the Analysis of Multi-/Hyperspectral Images)
Show Figures

Graphical abstract

Previous Issue
Back to TopTop