Article

Apple LiDAR Sensor for 3D Surveying: Tests and Results in the Cultural Heritage Domain

by
Lorenzo Teppati Losè
,
Alessandra Spreafico
*,
Filiberto Chiabrando
and
Fabio Giulio Tonolo
LabG4CH, Department of Architecture and Design (DAD), Politecnico di Torino, 10125 Torino, Italy
*
Author to whom correspondence should be addressed.
Remote Sens. 2022, 14(17), 4157; https://doi.org/10.3390/rs14174157
Submission received: 14 July 2022 / Revised: 17 August 2022 / Accepted: 23 August 2022 / Published: 24 August 2022
(This article belongs to the Special Issue 3D Modeling and GIS for Archaeology and Cultural Heritage)

Abstract

:
The launch of the new iPad Pro by Apple in March 2020 generated high interest and expectations for different reasons; nevertheless, one of the new features that developers and users were interested in testing was the LiDAR sensor integrated into this device (and, later on, in the iPhone 12 and 13 Pro series). The implications of using this technology are mainly related to augmented and mixed reality applications, but its deployment for surveying tasks also seems promising. In particular, the potentialities of this miniaturized and low-cost sensor embedded in a mobile device have been assessed for documentation from the cultural heritage perspective—a domain where this solution may be particularly innovative. Over the last two years, an increasing number of mobile apps using the Apple LiDAR sensor for 3D data acquisition have been released. However, their performance and the 3D positional accuracy and precision of the acquired 3D point clouds have not yet been fully validated. Among the solutions available, as of September 2021, three iOS apps (SiteScape, EveryPoint, and 3D Scanner App) were tested. They were compared in different surveying scenarios, considering the overall accuracy of the sensor, the best acquisition strategies, the operational limitations, and the 3D positional accuracy of the final products achieved.

Graphical Abstract

1. Introduction

Activities related to cultural heritage (CH) documentation represent a challenging assignment, characterised by several constraints and specifications necessary to meet the requirements of heritage documentation, often dealing with limited resources. Thanks to technological developments in the last few decades, several instruments and techniques have become available that facilitate the completion of tasks associated with CH documentation. These topics have been a central research asset for the overall community of experts, especially in the geomatics field.
An important research theme, which has been stressed by several authors, is connected to the possibility of using low-cost and commercial off-the-shelf (COTS) sensors to tackle CH documentation, optimising the ratio between cost and effectiveness of the results (in terms of metric and geometric accuracy, level of detail, and overall quality of the acquired information). The optimization of resources has also been stressed by the commissioner of the documentation process [1,2], due to a general lack of resources in the CH domain, in terms of both funding and expertise. Accordingly, the need to develop more sustainable and effective solutions to complete the documentation process is both developer- and user-oriented.
Nevertheless, another aspect to be considered is related to the overall democratization of the documentation process, due to the broader involvement of non-expert users in the process.
Over the last few decades, the miniaturization of electro-mechanical components and sensors has been leveraged by systems with increased computational power. This sort of second digital revolution has been supported by various technological enhancements, resulting in a wider panorama of instruments and solutions for the documentation process in general, and in the CH domain in particular.
Furthermore, the general decrease in the retail price of these electronic components is another crucial factor for their diffusion. Finally, in the field of portable devices, the evolution mentioned above has also been paired with a constant growth of computational power and overall performance of smartphones and tablets, resulting in the enhancement of computer vision (CV) algorithms and general optimizations of the data processing workflow for these kind of applications.
In the field of 3D documentation, the use of commercial and low-cost solutions has been well-described in the previous literature; in which, different types of sensors have been tested, presenting diverse results.
A well-known experience in this sense was related to the “Project Tango”, released by Google LLC in 2014 and closed in 2017. The project foresaw the development of ad hoc devices capable of retrieving their position and orientation in a 3D environment for augmented reality (AR), motion tracking, and navigation purposes. Devices from “Project Tango” have been tested by several researchers in the broader spectrum of applications; for example, Tomaštík et al. [3] have evaluated the possibility of using Tango technology for forest inventory tasks to achieve results comparable with other 3D recording methods, such as terrestrial laser scanning (TLS) and photogrammetry, and showed that the results were highly influenced by the scanning methodology adopted during field acquisition. Hyyppä et al. [4] have performed similar tests for forest inventory, comparing the results achieved with Tango technology and Microsoft Kinect.
Several tests have also been performed using Tango technology for indoor and outdoor positioning. Nguyen and Luo [5] have assessed the positional accuracy of the Tango platform in indoor environments considering different scene conditions, with an accuracy in the range from centimetres to meters. Marques et al. [6] have proposed an enhanced extension of the Tango localization system, through the use of fiducial markers.
Concerning the use of Tango technology for indoor scanning, Zlatanova and Diakitè [7] and Froehlich et al. [8] have performed preliminary analyses regarding the possibilities offered by Tango devices for the creation of 3D models based on real-world environments.
On the other hand, the first version of Microsoft Kinect was released at the end of 2010, designed to be used for gaming purposes with the Xbox console series. It contains different embedded sensors, which are used to analyse and track the movements of players. Nevertheless, this device has also achieved widespread use for other purposes aside from the gaming world, especially in the fields of robotics, geomatics, and CV.
Part of the literature regarding the Kinect is dedicated to deeper analysis of this device, particularly in terms of its main specifications and the achievable accuracies. Smisek et al. [9] have analysed the resolution of the depth measurement of the Kinect and its accuracy and proposed a calibration procedure for the overall system. Khoshelham [10] has investigated the accuracy and the quality of Kinect depth data acquired with different strategies and at different distances from the object of interest.
The Kinect was considered a game-changer, especially in the fields of robotics and CV. A review of the use of Kinect for CV applications can be found in Han et al. [11]; while more information on its use for robotics applications can be found in the studies of El-Laithy et al. [12] and Fankhauser et al. [13]. Concerning its use for 3D documentation tasks, more information can be found in the studies of Mankoff and Russo [14], Lachat et al. [15], Fankhauser et al. [13], and Kersten et al. [16].
The technology developed with the Kinect converged in the Microsoft HoloLens project, which was first released for developers in March 2016. The Microsoft HoloLens is a pair of smart glasses developed for use in mixed reality applications. Despite its primary use for mixed reality applications, Microsoft HoloLens can also be deployed for the acquisition of 3D reality-based models. Trotta et al. [17] have tested different solutions for enhancement of the 3D data acquired by HoloLens and evaluated the accuracy of the achieved models; Weinmann et al. [18] have compared the accuracy of HoloLens with a TLS down-sampled data set for indoor 3D mapping, confirming the possibility of using this device for fast surveying application. Furthermore, the same research group [19] has recently published a detailed review of the possibilities provided by the HoloLens for the completion of these tasks.
Another promising sensor that has been tested by several research groups is related to the generation of point clouds using the so-called time-of-flight (ToF) cameras [20,21]. These devices are typically characterized by just a few thousand pixels, a maximum unambiguous measurement range of up to thirty meters, and small dimensions. Their main advantages, with respect to other 3D measurement techniques, include the possibility of acquiring data at video frame rates and to obtain 3D point clouds without scanning and from just one point of view. ToF cameras usually deliver a range image and an amplitude image with infrared modulation intensities at video frame rates: the range image (or depth image) contains, for each pixel, the measured radial distance between the considered pixel and its projection onto the observed object, while the amplitude image contains the strength of the reflected signal by the object for each pixel. In some cases, an intensity image is also delivered, which represents the mean of the total light incident on the sensor (i.e., reflected modulated signal and background light of the observed scene). As reported in [21], these sensors have been employed successfully for 3D documentation, presenting satisfactory results in terms of the final products and related accuracy. At present, the main applications of ToF cameras are related to robot navigation [22], security and monitoring [23], and logistics [24].
A wider analysis of the possibilities offered by the use of personal devices in the production of metric 3D data has also been conducted within the context of an interesting European Union-founded project: the REPLICATE project [25].
Finally, in 2020, Apple released two products embedding new LiDAR sensors, representing a novelty in the world of personal devices: the iPad Pro and the iPhone 12 pro.
The integration of LiDAR into a consumer-grade personal device generated a lot of hype both among consumer and professional operators. However, at the time of writing, only a few technical articles have been published concerning the use of these two devices for fast surveying applications; therefore, the achievable accuracy using these devices is yet to be confirmed. Vogt et al. [26] have tested the possibility offered by the latest Apple devices for industrial 3D scanning, focusing both on the LiDAR system and the frontal TrueDepth camera. The authors tested the two sensors on small objects (LEGO bricks) and compared the results with an industrial 3D scanning system. In particular, they focused on the impact of the colour of the selected bricks during the scanning process and the overall scanning accuracy. The authors concluded that, at the actual state of advancement, the possibility offered by these devices may not be sufficient for most industrial applications; however, they may fit specific applications with lower requirements, in terms of accuracy.
Murtiyoso et al. [27] have presented an initial assessment regarding the use of Apple LiDAR for heritage documentation purposes. Two applications enabling the acquisition of point clouds with the iPad Pro were tested in three different scenarios: (i) Small–medium objects; (ii) building exterior façades; and (iii) indoor mapping. In all three scenarios, the data acquired with the Apple device were compared with a TLS or close range photogrammetry (CRP) reference data set. The authors highlighted that one of the main issues connected with this solution for heritage documentation is related to the high noise of the acquired point cloud; however, with ad hoc strategies, the use of Apple LiDAR in this field can lead to promising results.
Gollob et al. [28] have proposed some considerations regarding the use of Apple LiDAR for forest inventory purposes. Three different applications were tested implementing an ad hoc acquisition strategy, and the results were compared with other, more consolidated range-based techniques and traditional measurement approaches for tree diameter estimation. The authors concluded that the iPad LiDAR can provide faster and more flexible techniques, compared to conventional measurement approaches; however, in this case, high accuracies and spatial resolutions are yet to be achieved.
Luetzenburg et al. [29] have evaluated the use of the iPhone 12 Pro, through exploiting different apps for the 3D survey of rocks and cliffs for geological purposes, stressing the high potential and competitiveness of the miniaturized technology integrated into a smartphone. The authors of previous research work dedicated to the preliminary assessment of the Apple LiDAR capabilities have agreed on the fact that the implementation of this technology in consumer-grade personal devices represents a ground-breaking innovation and that promising developments are to be expected in the near future, confirming the outcomes of a preliminary assessment of Apple devices equipped with LiDAR sensors carried out by the same research group that authored this manuscript [30].
King et al. [31] have tested the ability of iPhone 12 Pro LiDAR for monitoring snow depth changes over time in small areas (up to 5 m2); they analysed the effectiveness of the LiDAR device under low-temperature conditions (−20 °C), in comparison with ruler measurements, stressing the low-cost aspect and portability of the device.
Tavani et al. [32] have evaluated the iPhone 12 Pro’s global navigation satellite system (GNSS) accuracy, inertial measurement unit (IMU) and magnetometer effectiveness, photo and video capabilities, and LiDAR sensor for geological studies. The iPhone 12 Pro GNSS receiver is able to capture measurements with accuracy within a few metres within seconds, demonstrating it to be competitive, in comparison to the same accuracies achieved in minutes by other mobile devices. Regarding the LiDAR module, the 3D Scanner App, EveryPoint, and Pix4Dcatch were tested for the mapping of indoor and outdoor test areas and in a real-case scenario for surveying a rock cliff, stressing the advantage of user-friendly iOS applications for metric survey and portability of the device in the field; however, they also reported drawbacks with respect to the online processing of some apps (e.g., Pix4Dcatch), requiring that the data be uploaded to the cloud, and reported a ‘doming effect’ in the geometric reconstruction of the scene.
Díaz-Vilariño et al. [33] have observed the capability of the LiDAR sensor embedded in the iPad Pro for 3D modelling in two consecutive rooms and an outdoor scenario, comparing the Apple point clouds with TLS and building information modelling (BIM) models considering surface coverage, as well as local and global precision. They stressed the LiDAR Apple’s devices inability with small-scale objects, as well as its suitability only for small environments; furthermore, they reported that the LiDAR is not influenced by lightning conditions.
Balado et al. [34] have tested the performance of the iPad Pro LiDAR, in comparison to two other LiDAR sensors, for surveying CH in the open air; the authors stressed the good compromise between low cost and achievable results for the iPad Pro, even if the obtained point cloud was found not to be suitable for stone individualization on the basis of curvature analysis and connected components algorithm.
The LiDAR embedded in the iPhone 12 Pro has also been tested for human body measurements [35], stressing the potentiality of this technology in manifold domains.

2. Materials and Methods

The research presented in this work aims to test two different Apple devices: the iPad Pro (4th generation), released in March 2020, and the iPhone 12 Pro, released seven months later in October 2020. The devices employed for the tests presented in this publication were equipped as follows. The iPad Pro [36] weights 684 g and is characterised by a 12.9′′ Retina display, an A12Z Bionic chip with 64-bit architecture, 8-core GPU, 8-core CPU, 16-core Neural Engine, 8 GB RAM, 512 GB capacity, and iOS 14.4.2 software version; it is equipped with two RGB rear cameras—a 12 MP wide camera and a 10 MP ultra-wide camera—and a LiDAR sensor. The iPhone 12 Pro [37] has a 6.1′′ screen, an A14 Bionic chip (5 nm dimension) with 6-core CPU, 4-core GPU, 16-core Neural Engine, 6 GB RAM, 256 GB memory, and iOS 14.7.1 software version; it has three RGB 12 MP rear cameras—wide, ultra-wide, and zoom camera—and a LiDAR sensor, with a total weight of 187 g. In particular, the A14 Bionic chip and 16-core Neural Engine integrated into the iPhone 12 Pro improve its performance, in terms of speed, while also allowing it to save energy. Being personal devices, both of these platforms are portable and lightweight but present a few noticeable differences in specifications. The iPad Pro has a bigger screen, allowing one to better observe the acquisition process in real-time, while the iPhone 12 Pro is lighter and the A14 Bionic chip performs better than the A12Z mounted on the iPad Pro. As far as the price range is concerned, the cost of the iPad Pro is around EUR 1700 for the Long-Term Evolution (LTE) version, while the iPhone 12 Pro costs around EUR 1100 (as of January 2022).
Only a few official technical specifications are available for the laser sensors embedded in the latest Apple products; however, according to a literature review (e.g., Murtyioso et al. [27]), the sensor is a solid-state LiDAR (SSL), a type of LiDAR that, in contrast with traditional LiDAR systems, avoids the use of mechanical motorized parts to ensure higher scalability and reliability, especially for autonomous vehicle and robotics applications [38,39]. As described by Aijazi et al. [40], 3D SSL is a new technology that relies on silicon chips without moving parts, characterized by a longer operational life and smaller sizes than traditional LiDAR, which uses rotating mechanisms. More specifically, different authors ([27,28,29]) have suggested that the LiDAR embedded in Apple devices uses an emitter composed of a vertical-cavity surface-emitting laser (VCSEL) sending laser pulses with a diffraction optics element (DOE), enabling miniaturization of the sensor; meanwhile, the receiver is a single-photon avalanche diode (SPAD). The LiDAR is based on a direct time-of-flight (dToF) technology with a near infra-red (NIR) complementary metal-oxide semiconductor (CMOS) image sensor (CIS) for the SPADs. Each sensor can directly measure the time between the emission of the light and the detection of the received light [41]. The Sony CIS combined with the VCSEL from Lumentum—integrated into both the iPhone 12 Pro and iPad Pro—features a global matrix composed of 576 points, emitted alternately in 4 different arrays, each of which consists of 144 points; the global matrix is composed of 9 sub-matrices, each of them with 8 dots per column and 8 dots per row [29,42]. The points measured by the LiDAR sensor combine information acquired by the cameras and motion sensors integrated into Apple devices, supported by the CV algorithm of the Bionic chip [43]. The declared range of the LiDAR sensor is 5 m, and Luetzenburg et al. [29] have concluded that there are no differences between the LiDAR sensors embedded in the iPad and iPhone.

2.1. Available Applications for Metric Survey Purposes

Thanks to Apple’s ARKit [44], the depth information obtained from the LiDAR sensor is converted into points. These data are used in combination with the motion tracking sensors and data coming from the camera (as orientation and position) for different uses enabled by different apps, including for measurements (Measure), improvement of camera auto-focus in low-light conditions (Camera), entertainment and gaming (e.g., Hello LiDAR: Pro AR Filters, Playground AR), medical purposes (e.g., Complete Anatomy Platform 2020, Seeing AI), interior design (e.g., Ikea Place), or survey operations (e.g., Magicplan, RoomScan, Canvas: Pocket 3D Room Scanner). In all of these applications, the LiDAR assists in the positioning of AR objects in the framed real scene in AR apps or provides measurements of real objects framed by the RGB camera.
The Apple store has listed an increasing number of applications exploiting the LiDAR sensor, but few are dedicated to retrieving 3D point clouds (Appendix A, Table A1), which can be exported and further processed for surveying. Especially after the launch of the iPad Pro and the iPhone 12 Pro on the market, several applications have been designed and released to exploit the possibilities offered by the sensors integrated into these mobile devices to measure 3D scenes and provide coloured 3D models, not only relying on the LiDAR sensors embedded in these devices but also exploiting the data derived from other embedded sensors. Some applications are solely based on a photogrammetric approach, using the back-facing camera of the devices (e.g., Scanner 3D Qlone), others use the TrueDepth front-facing camera (e.g., 3D Scan Anything), while a considerable number of applications are based on the LiDAR sensor (e.g., SiteScape—LiDAR 3D Scanner, EveryPoint, Sakura 3D SCAN, Scaniverse—LiDAR 3D Scanner, Modelar—3D LiDAR Scanner, Pix4Dcatch: 3D scanner, Polycam—LiDAR & 3D Scanner, Heges 3D Scanner, Lidar Scanner 3D, 3D Scanner App, RTAB-Map—3D LiDAR Scanner, and Forge—LiDAR 3D Scanner). Therefore, deep research on the Apple Store was carried out in September 2021 (keeping in mind that the development of these solutions is relatively rapid and constantly evolving), in order to find all the applications using the integrated LiDAR to produce 3D models for metric documentation purposes. These applications were then installed and tested to assess their main characteristics and, finally, a selected number of apps were tested more in-depth. These applications are reported in Appendix A, Table A1. Various parameters were considered in the analysis of the available applications, including:
  • Licensing (free, open-source, commercial);
  • Type of acquired data (point cloud, 3D meshes, etc.);
  • Ease of use;
  • Level of user’s control on the acquisition settings (number of customizable parameters).
The underlying algorithm adopted by each application is not always reported in its description on the online store or related documentation, as well as the different products that can be generated. Nevertheless, a relevant group of applications claims to exploit the LiDAR sensor to generate 3D models, but the role of the LiDAR sensor is not always clear and specific tests are required to assess how these applications work. All of them seem to exploit the LiDAR sensor to register the geometric data and the RGB camera to colorize the 3D model/point cloud, but some of them rely on a photogrammetric approach (e.g., Pix4Dcatch and Polycam) and, therefore, can also be used on other devices without requiring an Apple device with integrated LiDAR sensor. Regarding the camera position and attitude estimation of the device while reconstructing the 3D model, only RTAB-Map—3D LiDAR Scanner (https://introlab.github.io/rtabmap/, accessed on 14 January 2022) declares to be based on a simultaneous localization and mapping (SLAM) algorithm. All of the listed applications (except for Heges 3D Scanner) were released starting from 2020, when the iPad Pro and iPhone 12 Pro with integrated LiDAR sensor were released, and are subject to constant updates, indicating the high interest in this new technology. Most of them are free of charge and support the most common interoperable file extensions for 3D models, such as .e57, .ply, .obj, and .las.
After some preliminary tests, we decided to focus on three selected iOS applications to further evaluate the performances of the LiDAR sensors: SiteScape version 1.0.12 by SiteScape Inc. [45], EveryPoint version 2.9 by URC Ventures Inc. [46], and 3D Scanner App version 1.9.5 by Laan Labs [47]. These applications were selected as they meet specific criteria related to CH documentation: The user license is free (CH documentation generally benefits from limited funding), customisable acquisition settings (it is possible to have more control from the user side), and they generate 3D models as point clouds (the availability of the raw data set, rather than a derivative product, grants wider control on the metric and geometric quality of the final product).

Overview of the Three Selected Applications

The selected iOS applications, which were installed both on the iPad Pro and iPhone 12 Pro, offer various acquisition settings, which can be customized according to the operator’s needs.
I.
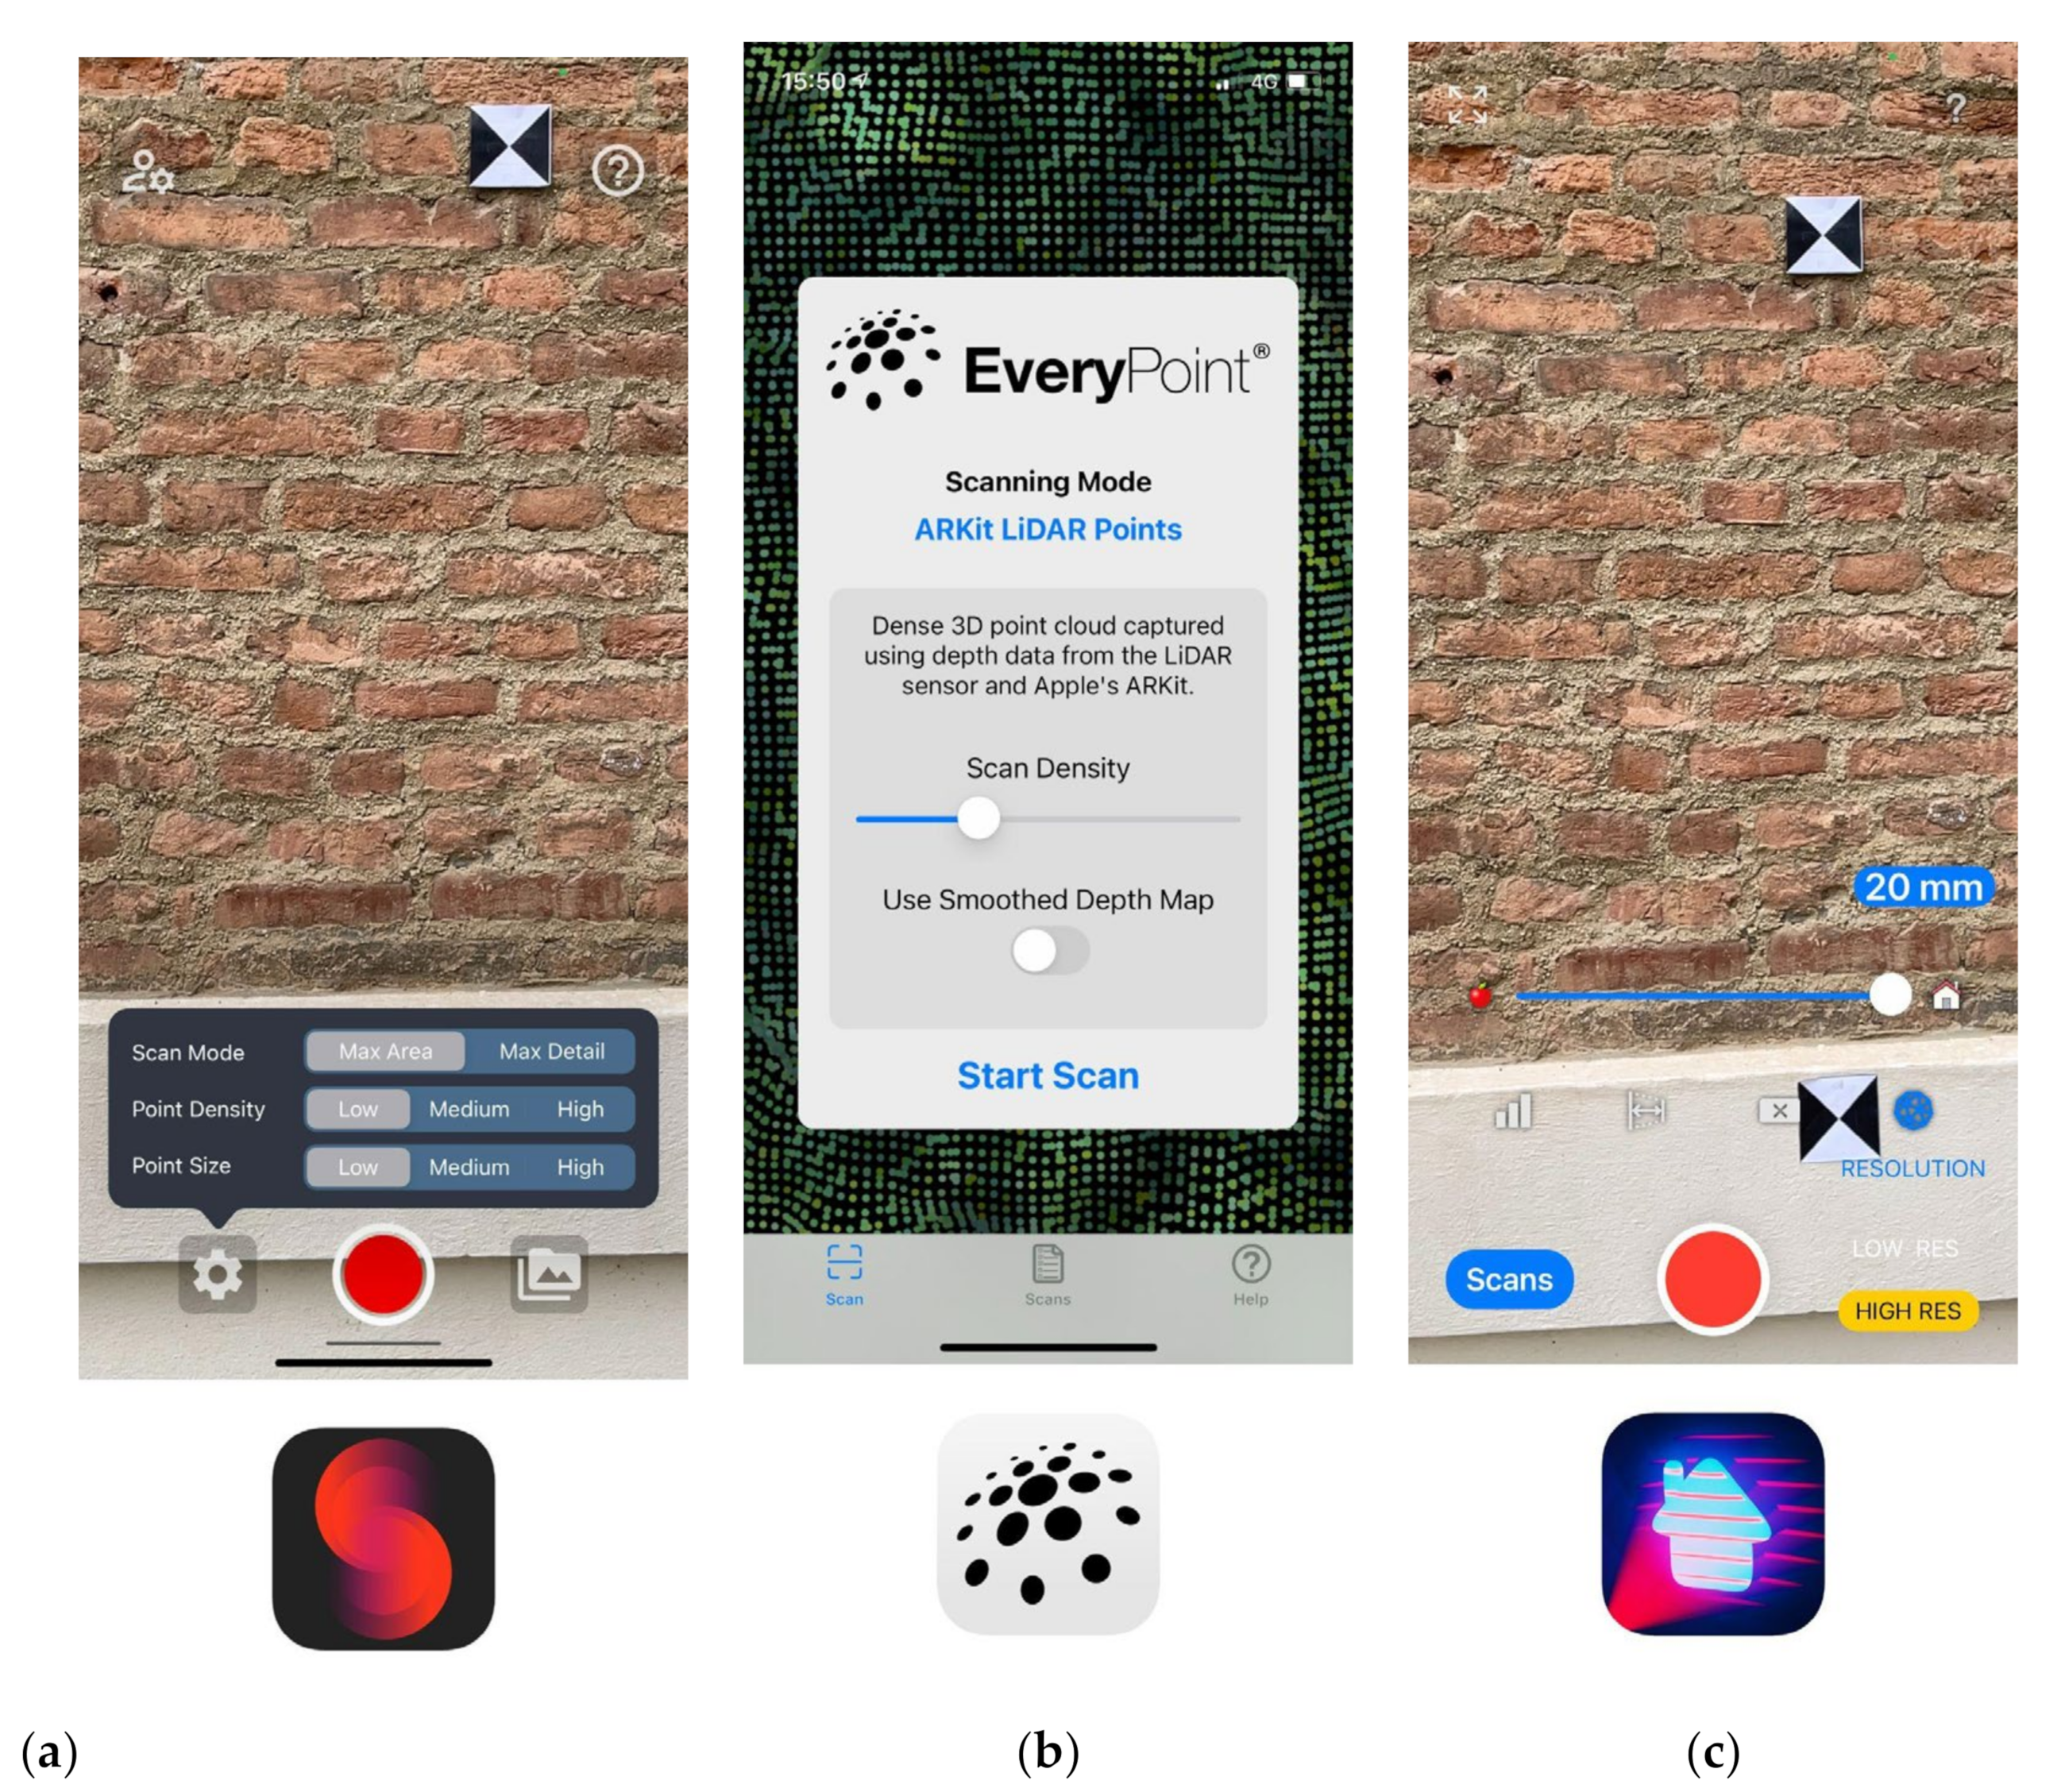
SiteScape allows for customisation of the “scan mode” (“max area” or “max detail”), “point density” (“low”, “medium”, or “high”), and “point size” (“low”, “medium”, or “high) (Figure 1a). The “max area” scanning mode lets the operator acquire longer scans than the “max detail” mode, which, to the contrary, limits the scanning time but acquires a point cloud that is eight times denser. The “point density” defines the acquired number of points, where the “medium”/“high” quality corresponds to two/four times, respectively, the number of points obtained in the “low” quality mode. Finally, the “point size” influences only the dimensions of points visible in real-time, not the acquired data set itself.
II.
EveryPoint (Figure 1b) provides three scanning modes: “EveryPoint LiDAR Fusion” mixes ARKit data with data coming from the LiDAR sensor and a photogrammetric algorithm developed by EveryPoint; “ARKit LiDAR Points” uses only data obtained by the LiDAR sensor and ARKit; and “ARKit LiDAR Mesh” generates a 3D mesh surface calculated with ARKit based on the LiDAR data. Regarding the “ARKit LiDAR Points” mode, a bar allows the operator to set the scan density but without providing a corresponding value to the scale bar; meanwhile, if the option “Use Smoothed Depth Map” is enabled, a smoothing tool is applied to generate a point cloud with a lower level of noise.
III.
3D Scanner app (Figure 1c) provides two scanning modes, named “low res” and “high res”. The “low res” has no parameters to set, it provides the simplest mode to capture a 3D scene, which is suggested to be used for large scans. The “high res” allows the operator to produce a better scan, offering four different settings: “max depth” (ranging between 0.3 m and 5.0 m with a step of 0.1 m), “resolution” (ranging from 5 mm to 20 mm with a step of 1 mm), “confidence” (“low”, “medium”, or “high”), and “masking” (“none”, “object”, “person”). The “max depth” permits reducing the 5 m maximum scanning distance of the surveyed object from the device, such that the operator can decrease the distance down to 0.3 m to avoid undesired objects in the scanning. The “resolution” parameter defines the density of the point cloud, where 5 mm represents the highest resolution, while 20 mm is the lowest. The “confidence” parameter limits the data acquired by the LiDAR sensor, where the “high” value registers only the best quality data but decreases the amount of registered data; for example, through deleting the farthest points from the device. The “masking” setting allows for definition of which elements to measure: if the “none” value is selected, the app acquires all the scene visible from the LiDAR sensor; with the “person” value, the app tries to identify the shape of a person and acquires only the geometry of a human body excluding the rest; and, with the “object” value, the app tries to identify an element in the foreground, attempting to avoid the recording of the background.
Regarding the data acquisition phase, SiteScape [48] recommends maintaining a distance between 1 and 4 m from the surveyed object. The EveryPoint app suggests moving freely, avoiding fast movements, and keeping the camera pointed towards the scene to survey. 3D Scanner App [49] reminds the user that quick movements can affect the quality of the result and advises that re-scanning the same portion within one scan cannot improve the outcome (advice that is probably limited to this specific application). No further information about the best path to follow is provided, such as up and down patterns or closed loops around an object. None of the three apps declare the limit on the time available to perform a scan. The time and the maximum number of points for each scan are related to the scan settings, mainly in terms of scan density. SiteScape provides a bar to indicate the available space to conclude a scan; EveryPoint shows the number of points acquired during the acquisition, without stopping the scan at a certain point; and 3D Scanner App does not provide any information about limits during acquisition. After examining the available settings, the iOS app settings tested in the present research are reported in Table 1.

2.2. Experimental Setup for Sensor Performance Evaluations

The work presented in this contribution is mainly divided into two parts: An assessment of the sensor characteristics and performances, and a second part dedicated to using Apple LiDAR in real-case scenarios of built and cultural heritage asset surveying.
The first step was achieved by completing an extensive evaluation of the sensor and assessing its behaviour under different operational conditions. Data acquisition tests were carried out by changing different variables that can affect the sensor’s performances: static and dynamic configurations were both considered, as well as both indoor and outdoor scenarios and varying materials and dimensions of the surveyed objects. In fact, besides distance from the object and operator movements, external factors, such as illumination, reflectance, texture, colour, and shape may also influence the scan quality [26].
The first set of tests was also aimed at assessing any possible differences between the performance of the iPad Pro and the iPhone 12 Pro LiDAR, in order to define how to further proceed with additional acquisition in real-case scenarios.
The second step of the work is dedicated to real case applications considering objects with different scales and shapes. As will be detailed in the following sections, the acquisitions in this second phase were carried out using only one device, according to the outcome of the first phase. Three different CH assets were considered in the second phase, as described in Section 2.2.3.

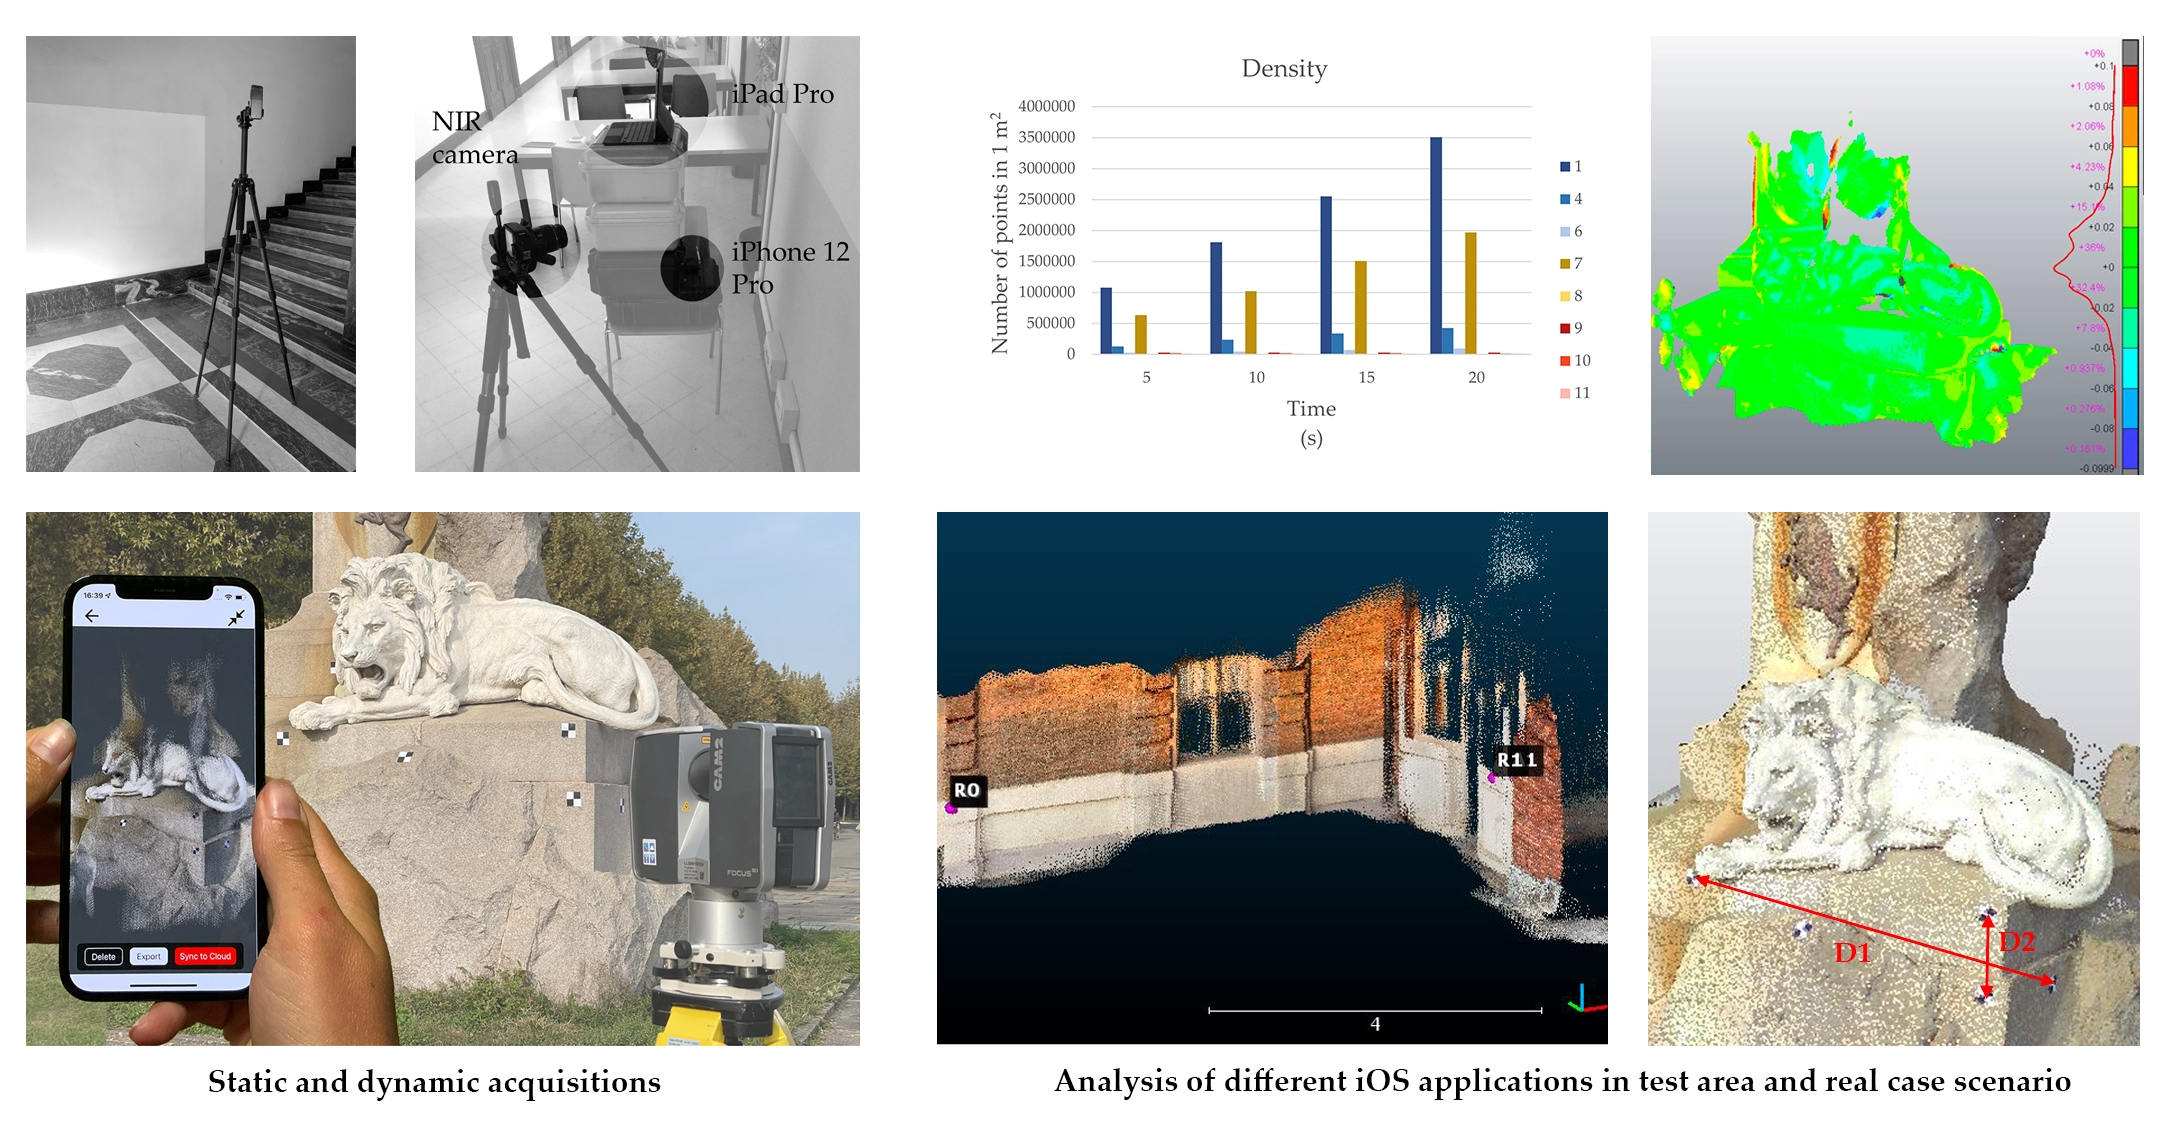
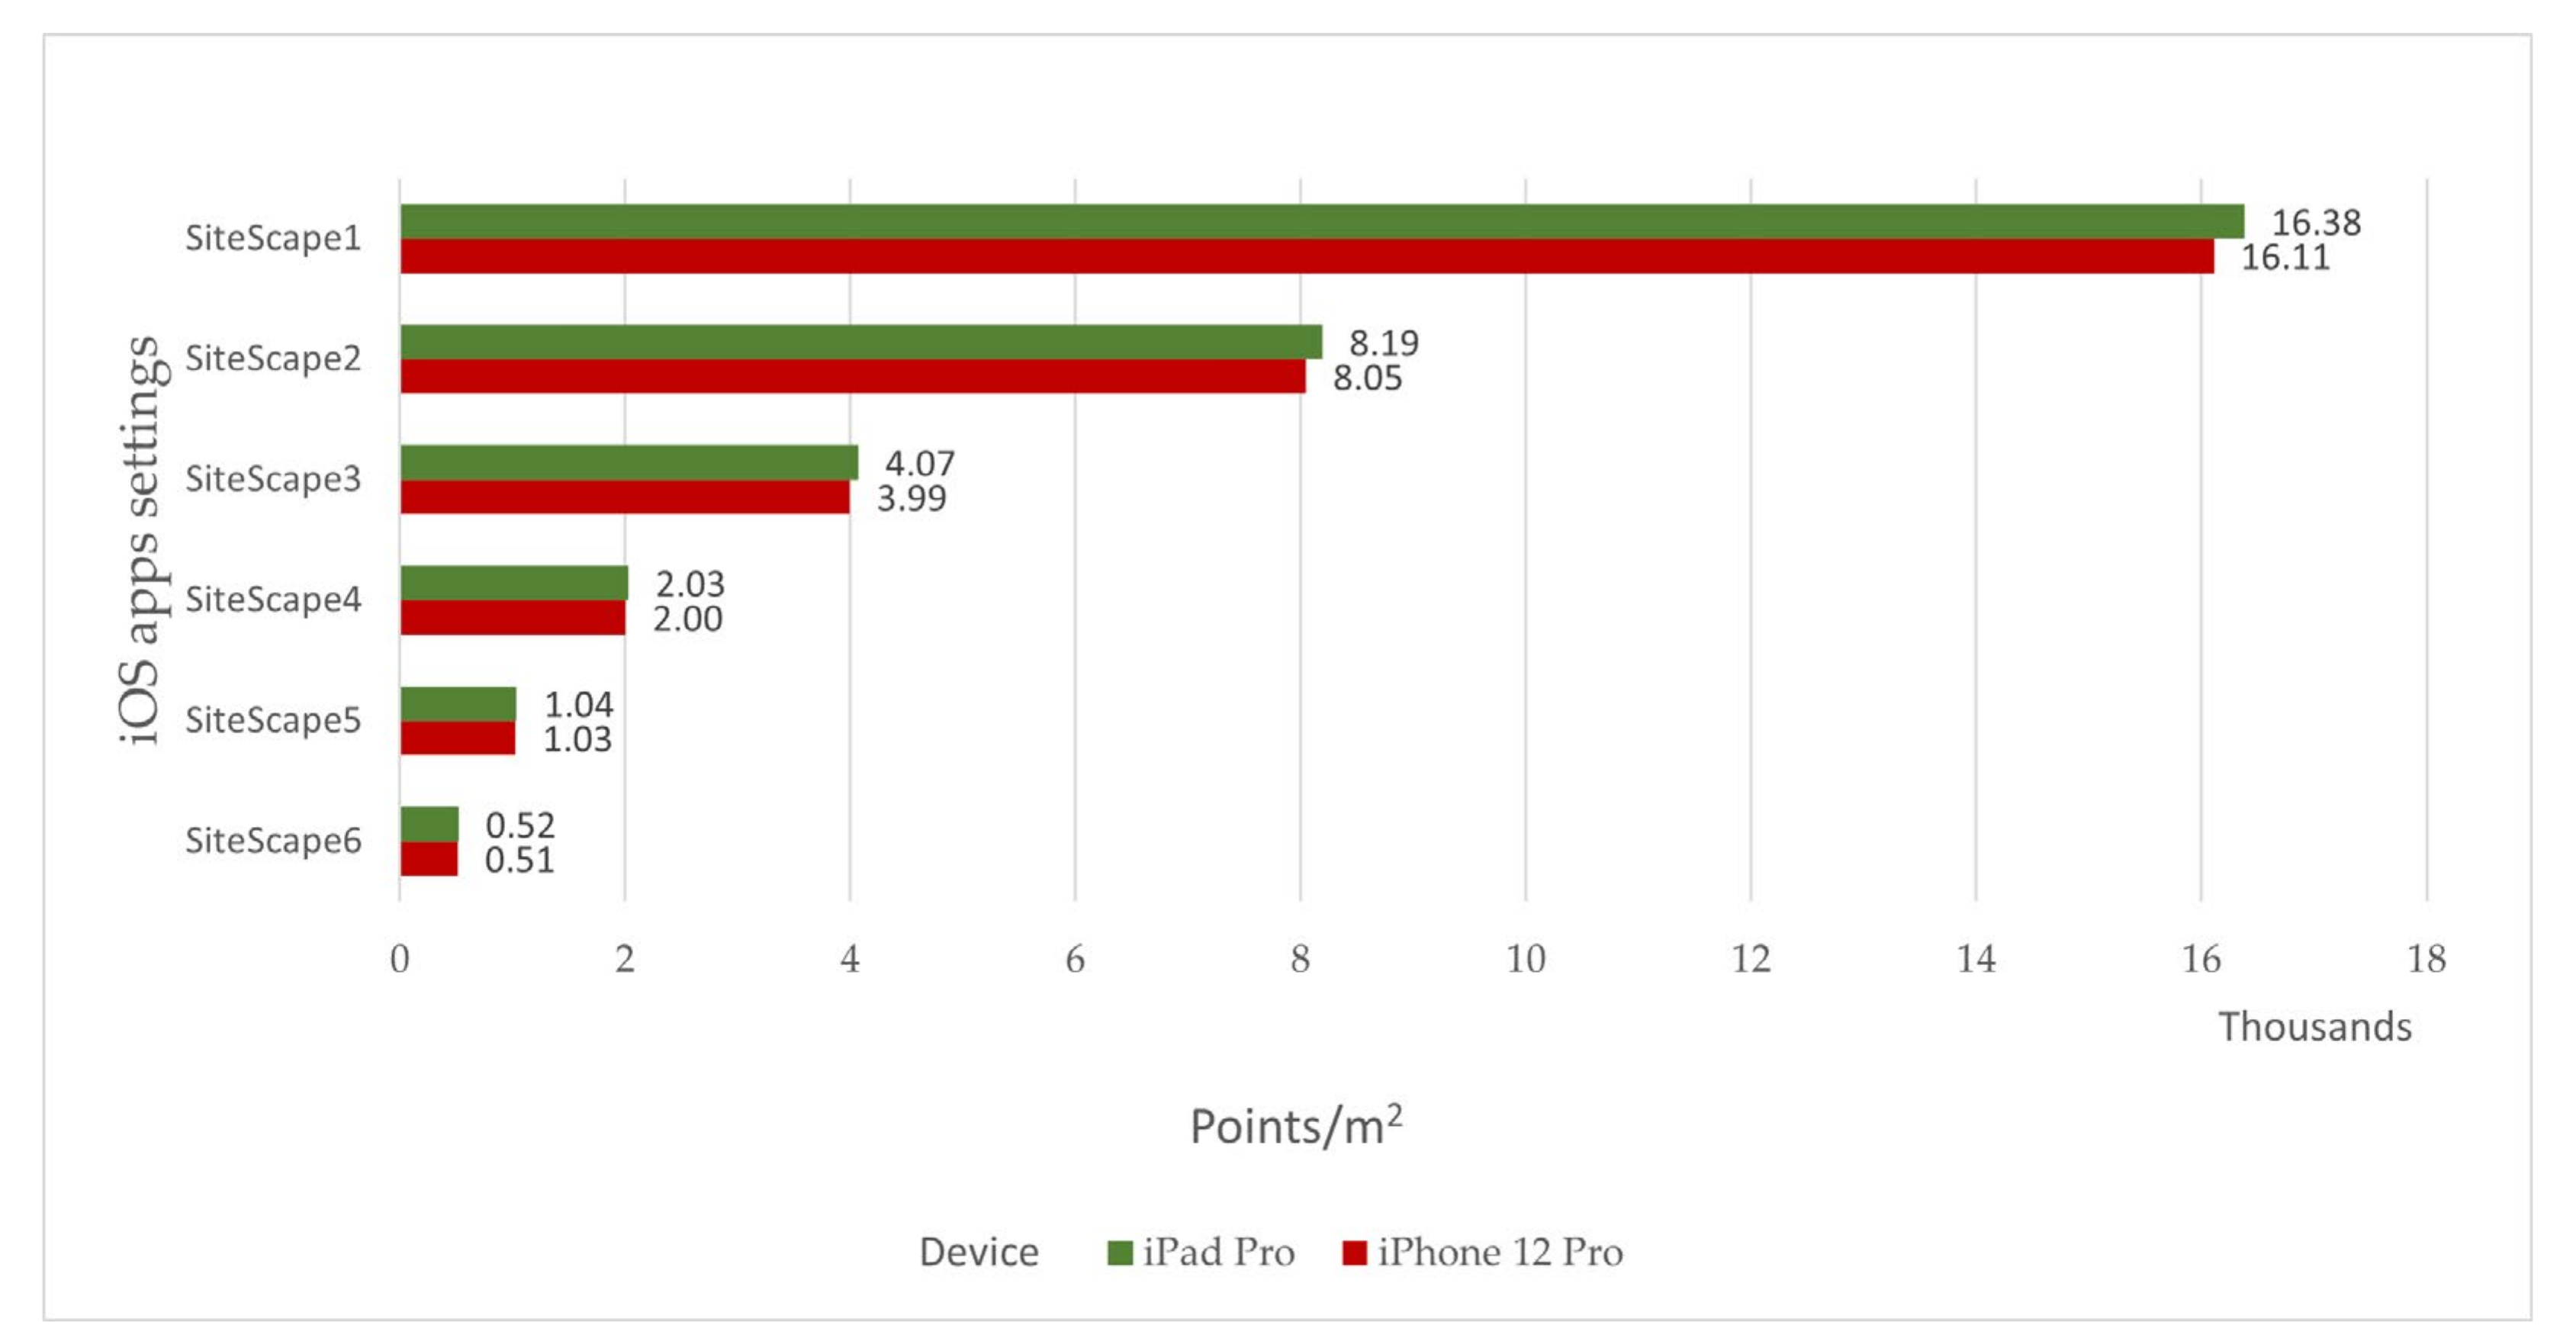
2.2.1. Static Acquisitions

Two tests were proposed to compare the iPad Pro and iPhone 12 Pro LiDAR sensors, in order to verify whether they embed the same sensor. In the first test, the two devices were positioned in front of a vertical surface, one above the other (landscape orientation). Then, in order to acquire the data, the three selected applications were used, changing the parameters offered by each app according to the following iOS apps settings: SiteScape1, SietScape2, SiteScape3, SiteScape4, SiteScape5, SiteScape6, EveryPoint1, EveryPoint2, 3D Scanner App1, 3D Scanner App2, and 3D Scanner App3 (see Table 1). For each iOS app setting, a video was registered using a modified DSLR CANON EOS SL1, which is capable of capturing the NIR spectrum with a wavelength range between 700 and 1100 nm. The emitted VCSEL matrix of dots visible in each video was analysed by counting the number and pattern of dots. In the second test, the iPhone 12 Pro was mounted on a tripod, and a set of static point clouds at 1, 2, 3, and 4 m were acquired with the following iOS app settings: SiteScape1, SiteScape2, SiteScape3, SiteScape4, SiteScape5, SiteScape6 (see Table 1), as has already been performed with the iPad Pro by Spreafico et al. [30]. This test was performed only with the SiteScape app, as EveryPoint and 3D Scanner App do not allow for acquisition in static mode. Acquisitions were rapid and performed without moving the device from its position. The total number of points composing the matrix and the distance between two adjacent points were evaluated and compared to those recorded by the iPad Pro using the same acquisition set-up.

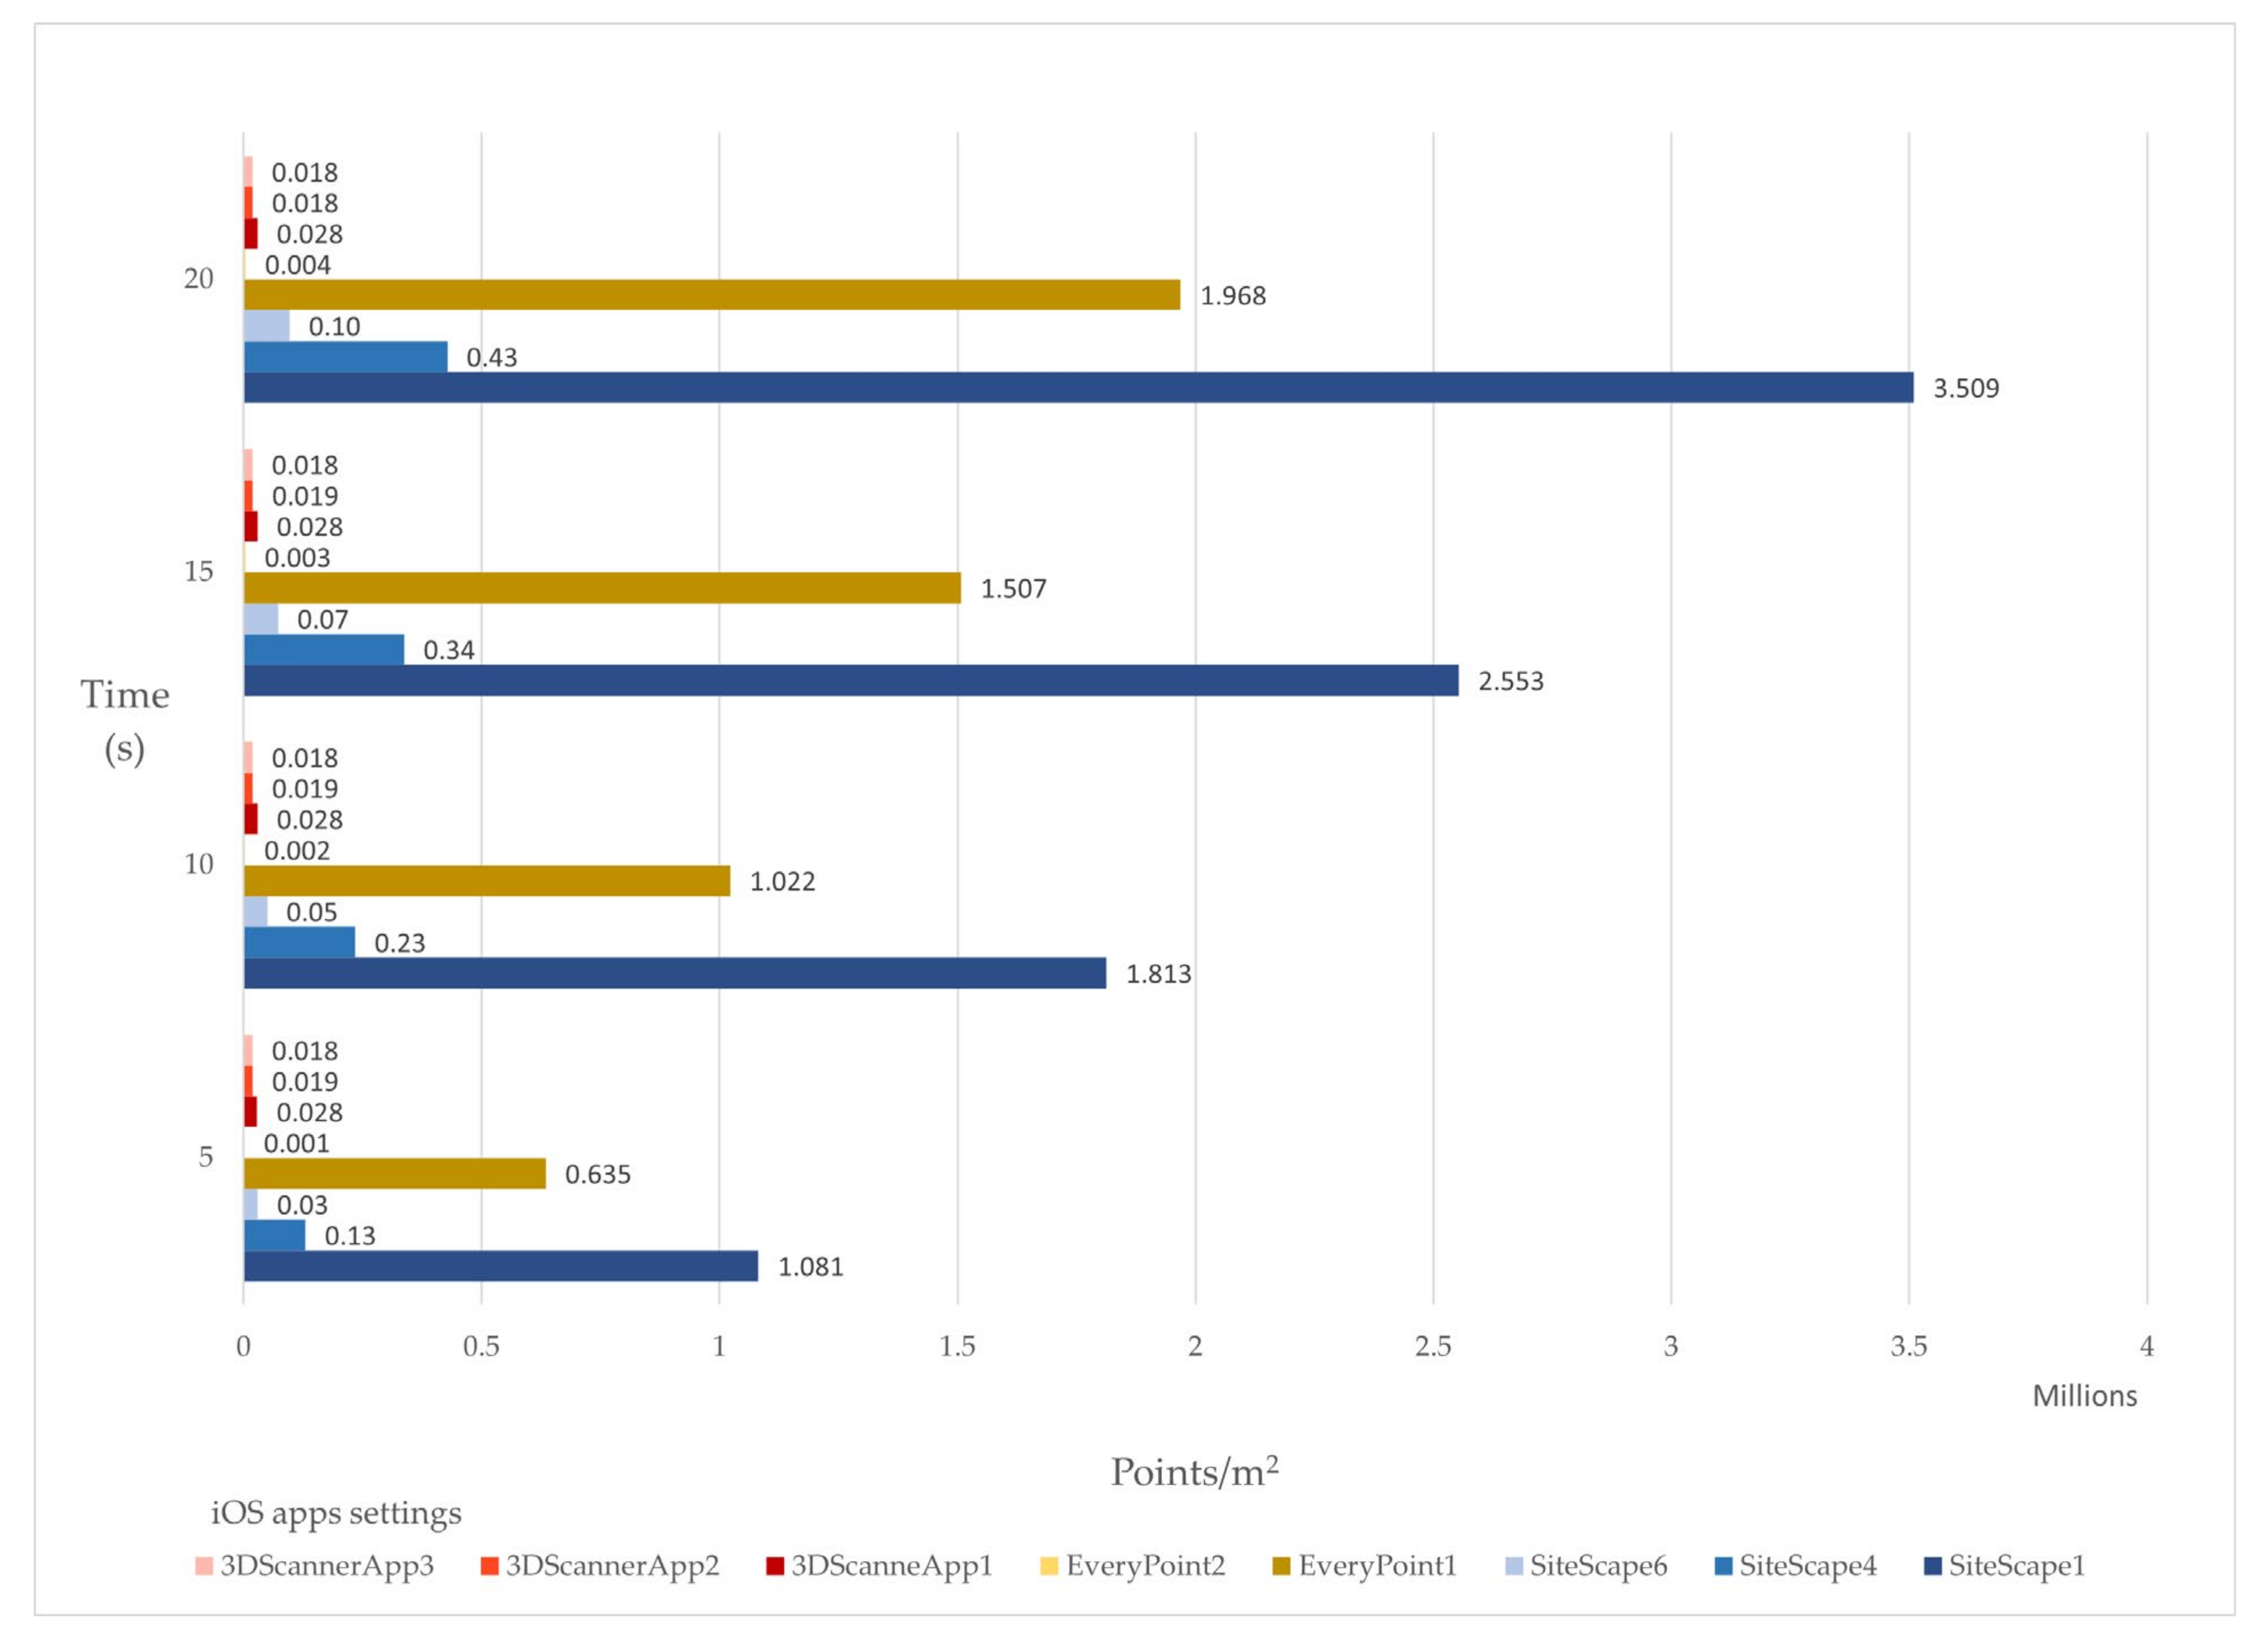
2.2.2. Dynamic Acquisition: Performance on Sample Areas

For dynamic acquisitions, only the iPhone 12 Pro was tested, using SiteScape, EveryPoint, and 3D Scanner Apps with the following settings: SiteScape1, SiteScape4, SiteScape6, EveryPoint1, EveryPoint2, 3D Scanner App1, 3D Scanner App2, and 3D Scanner App3 (see Table 1). For the SiteScape app, only three settings were considered: one with the highest resolution (SiteScape1), one with medium resolution (SiteScape4), and one with the lowest resolution (SiteScape6). Three different tests were performed to compare the three apps, with the aim of assessing the influence of overlapping acquisitions on the same part of the acquired object, the influence of sunlight, and the impact of different materials. For the first indoor test, the operator held the device, moving it slowly from one side to another at a distance of 1 m from a vertical white plaster wall with four coded artificial markers. A data set with two acquisition strategies for each of the iOS app settings was recorded, for a total of 32 acquisitions; one consisting of a single swipe (5 s), and one with overlapped swipes (10, 15, and 20 s).
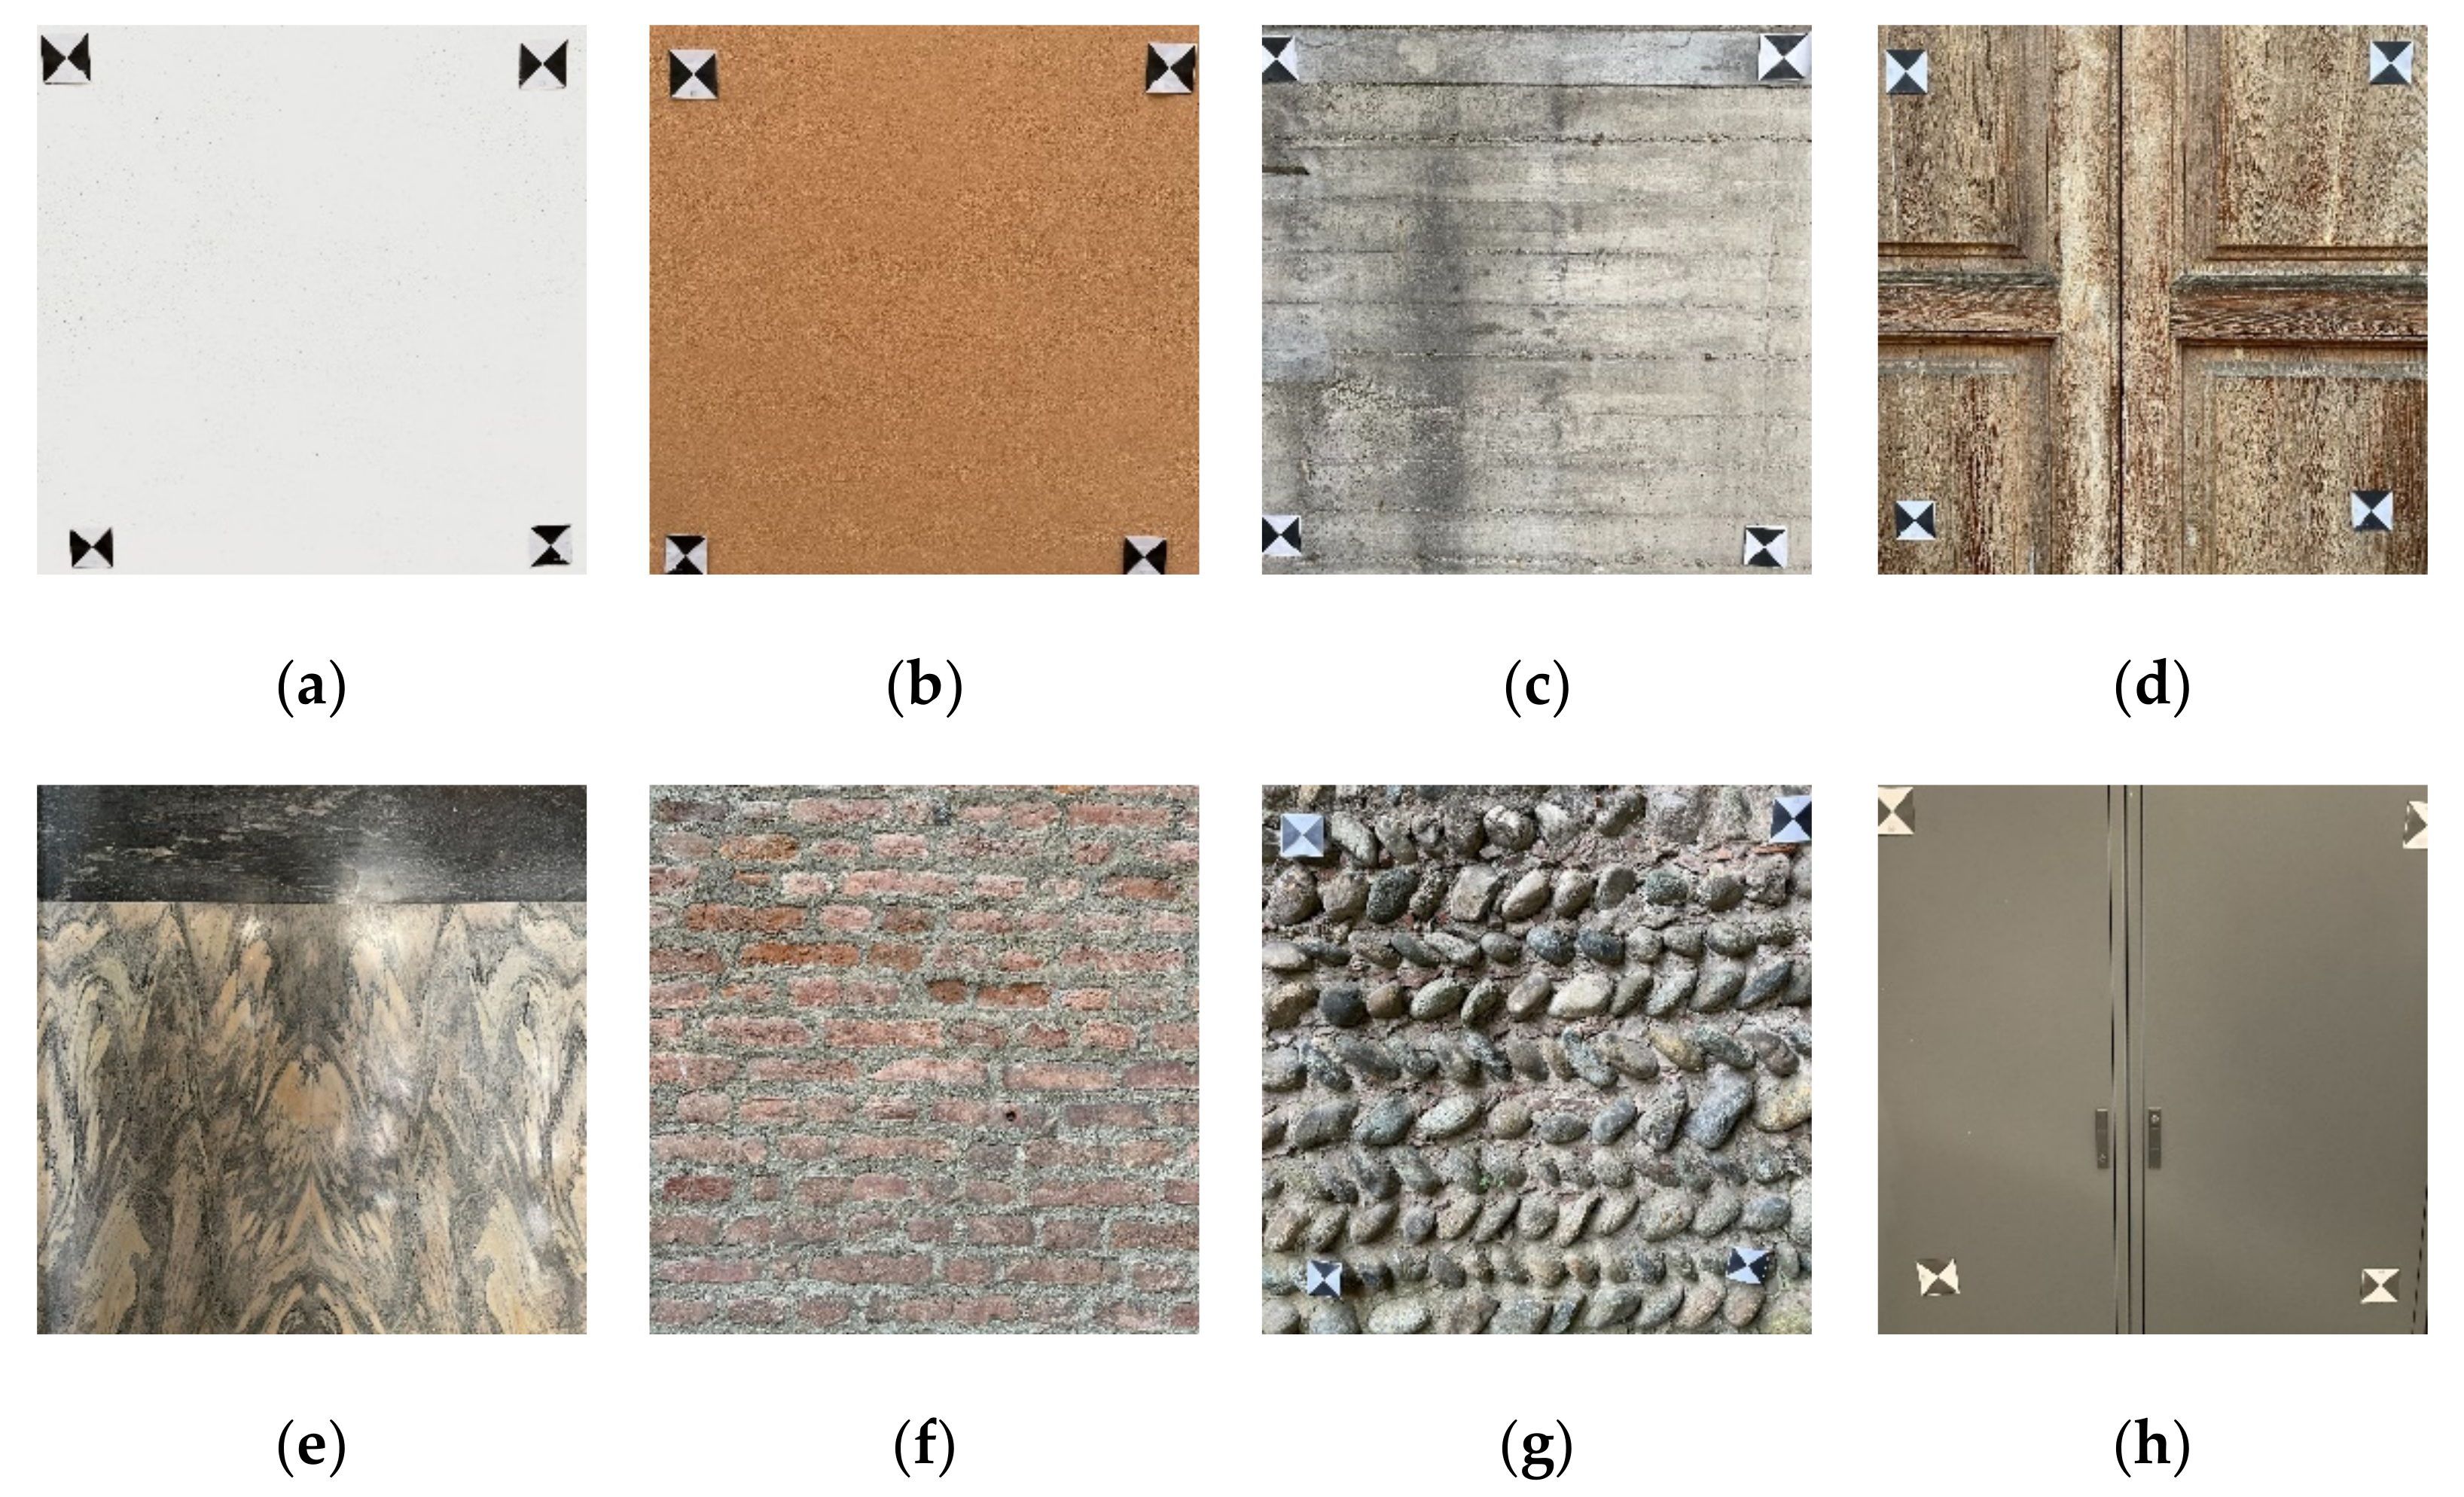
The second test considered the same portion of an outdoor pink plaster wall, surveyed according to the last acquisition schema in the previous list. A first acquisition was performed with direct sun on the wall, and a second was conducted under shadow conditions, in order to evaluate the influence of sunlight. The third test was performed to assess the performance of the iPhone LiDAR on eight different materials: white plaster, pink plaster, concrete, raw wood, polished stone, brick, river stone, and black opaque metal (Figure 2). For this test, the operator followed the abovementioned acquisition strategy lasting 20 s.
For the three tests, the scans were co-registered in the same coordinate system using four artificial markers. Then, for each scan, the following parameters were computed on the same area (1 m2) using the CloudCompare software: the total number of points, number of neighbours in a sphere of radius of 5 cm, and roughness (with a kernel radius of 5 cm).

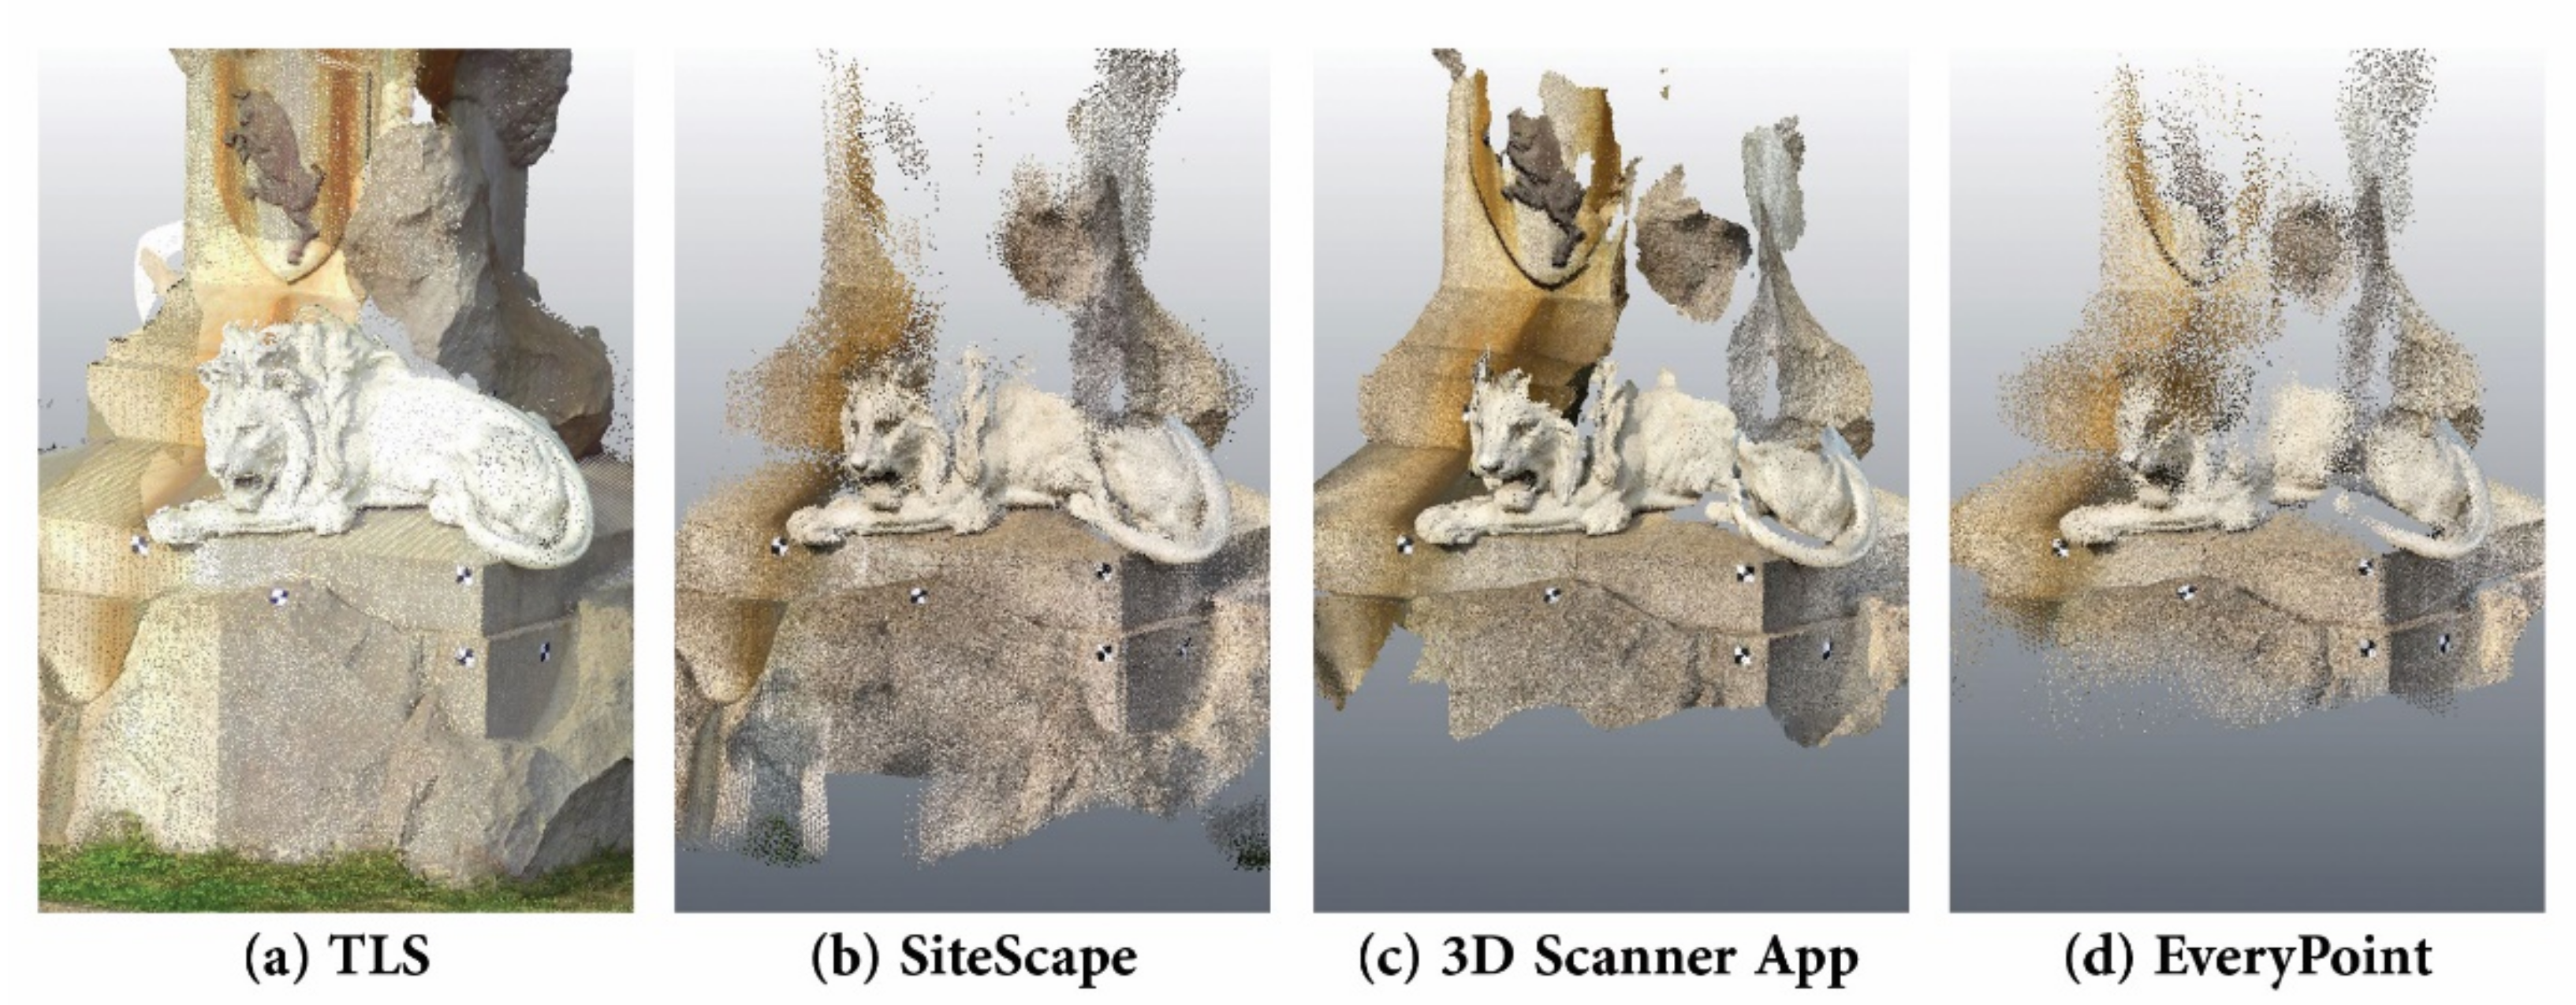
2.2.3. Selected Case Studies and Experimental Setup

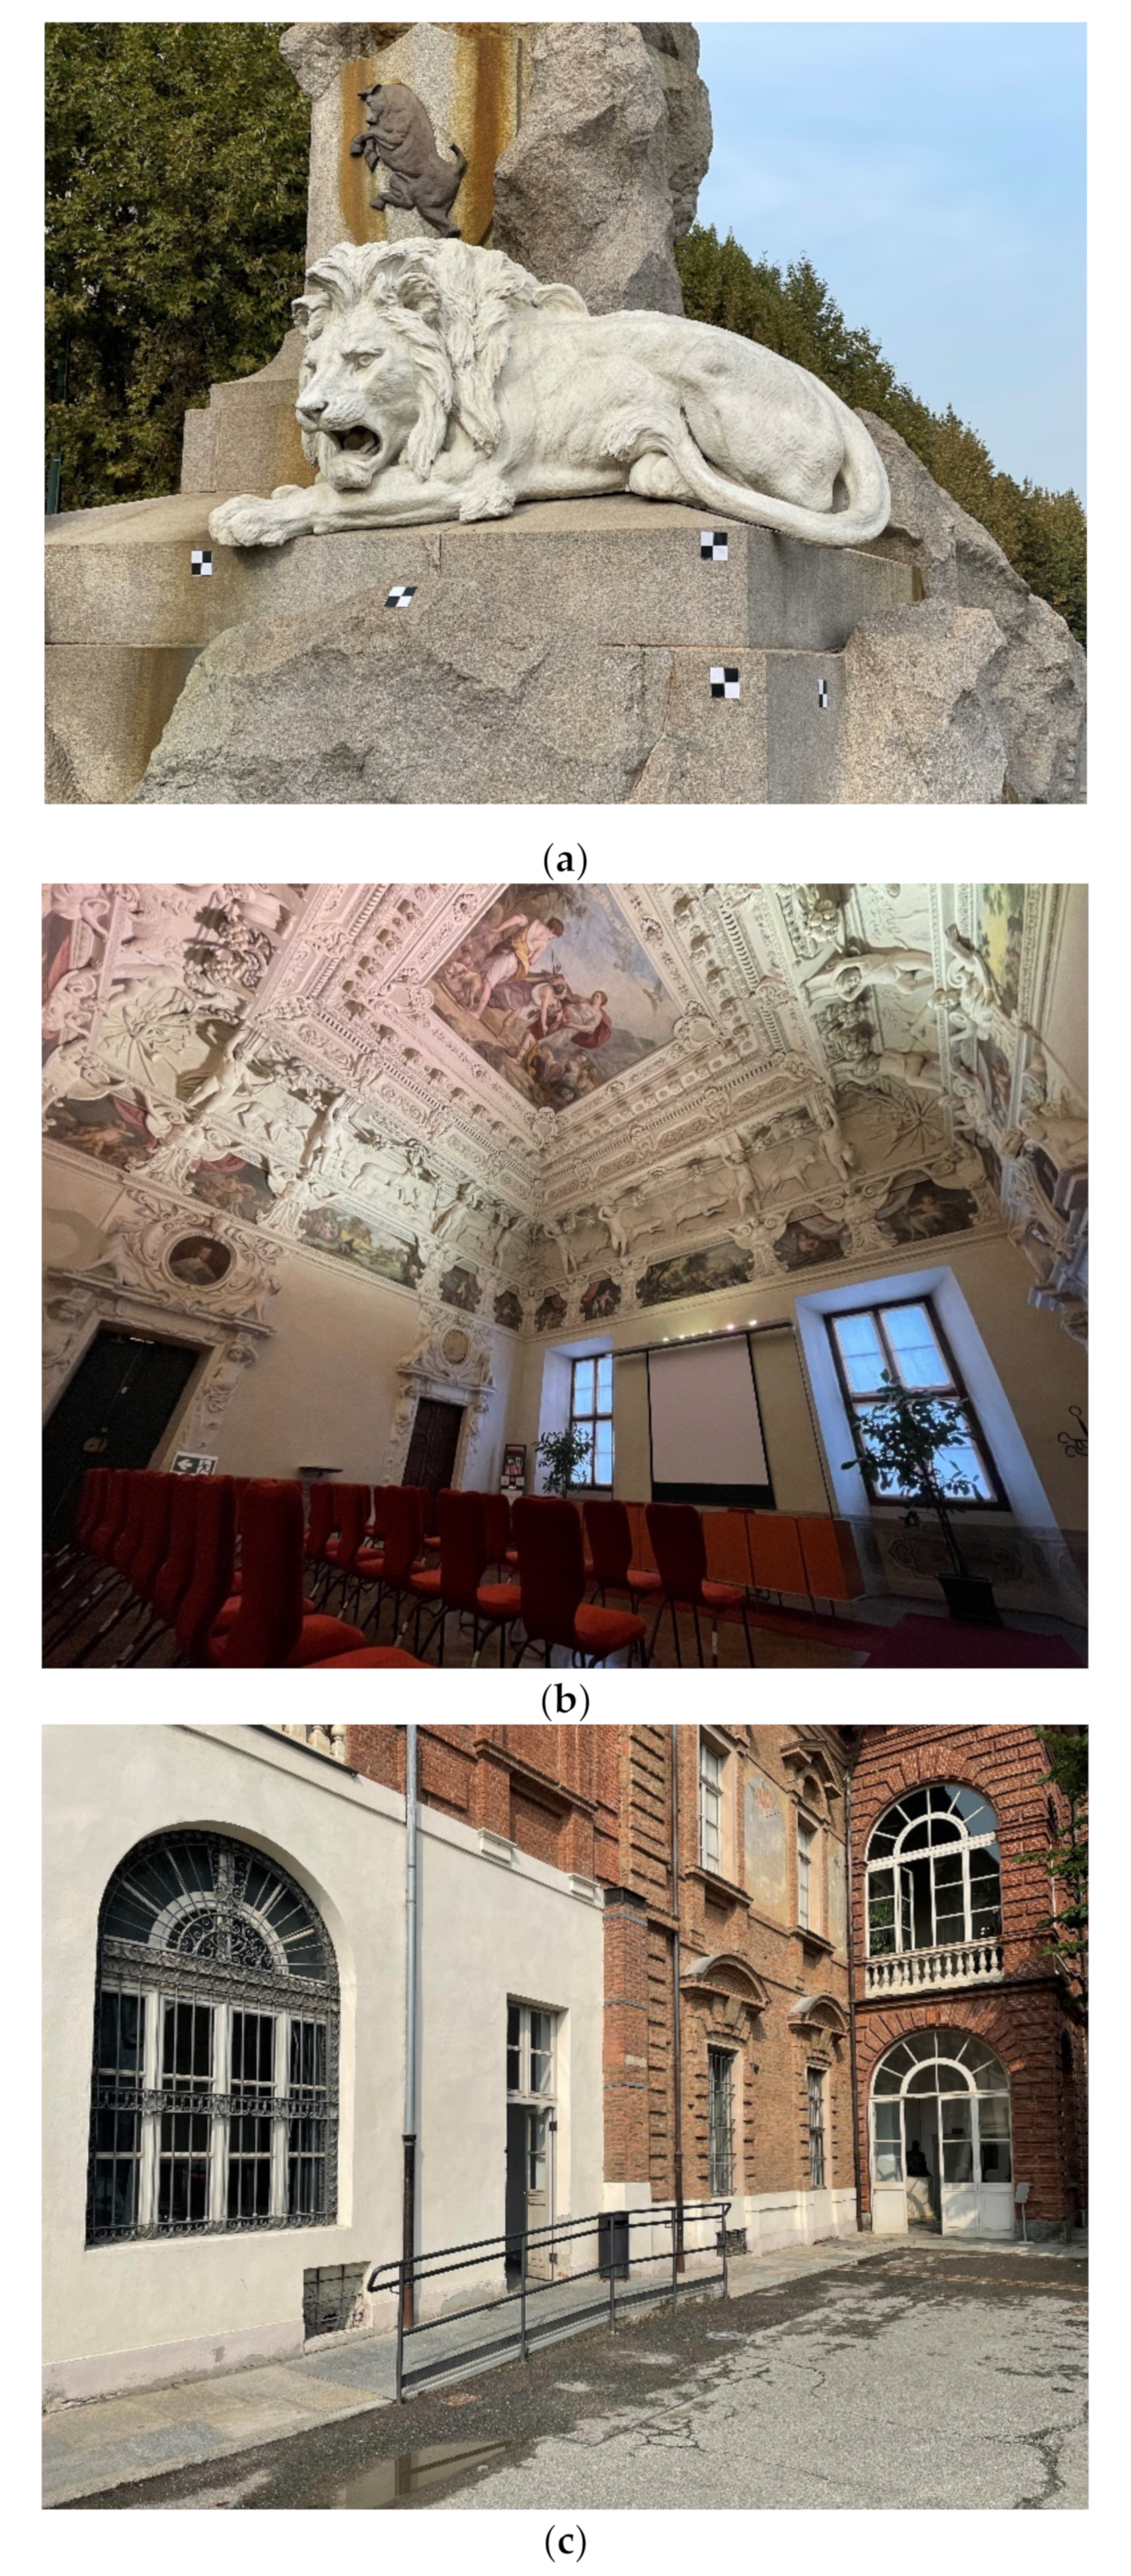
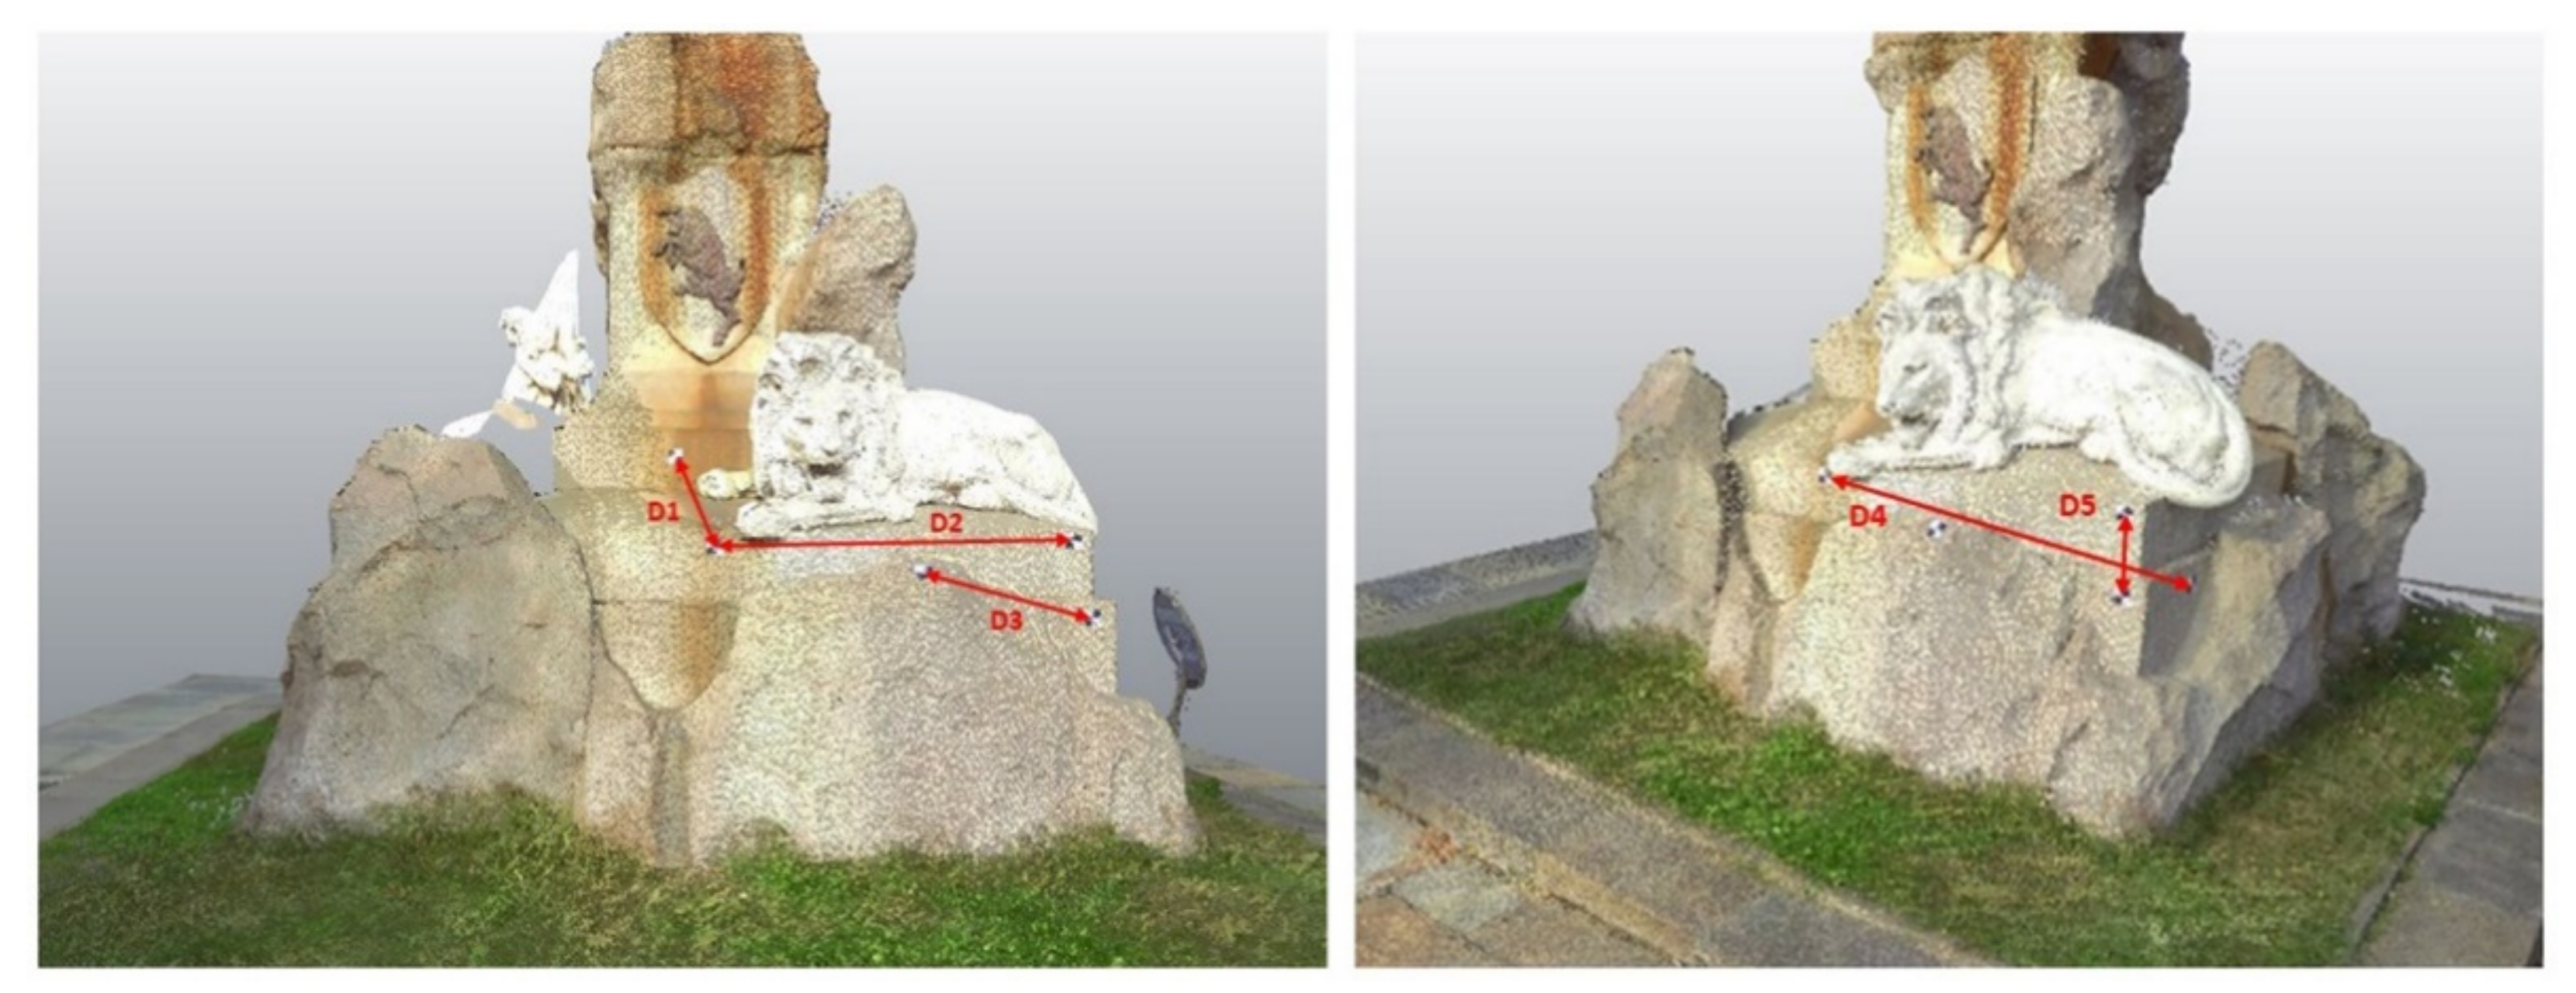
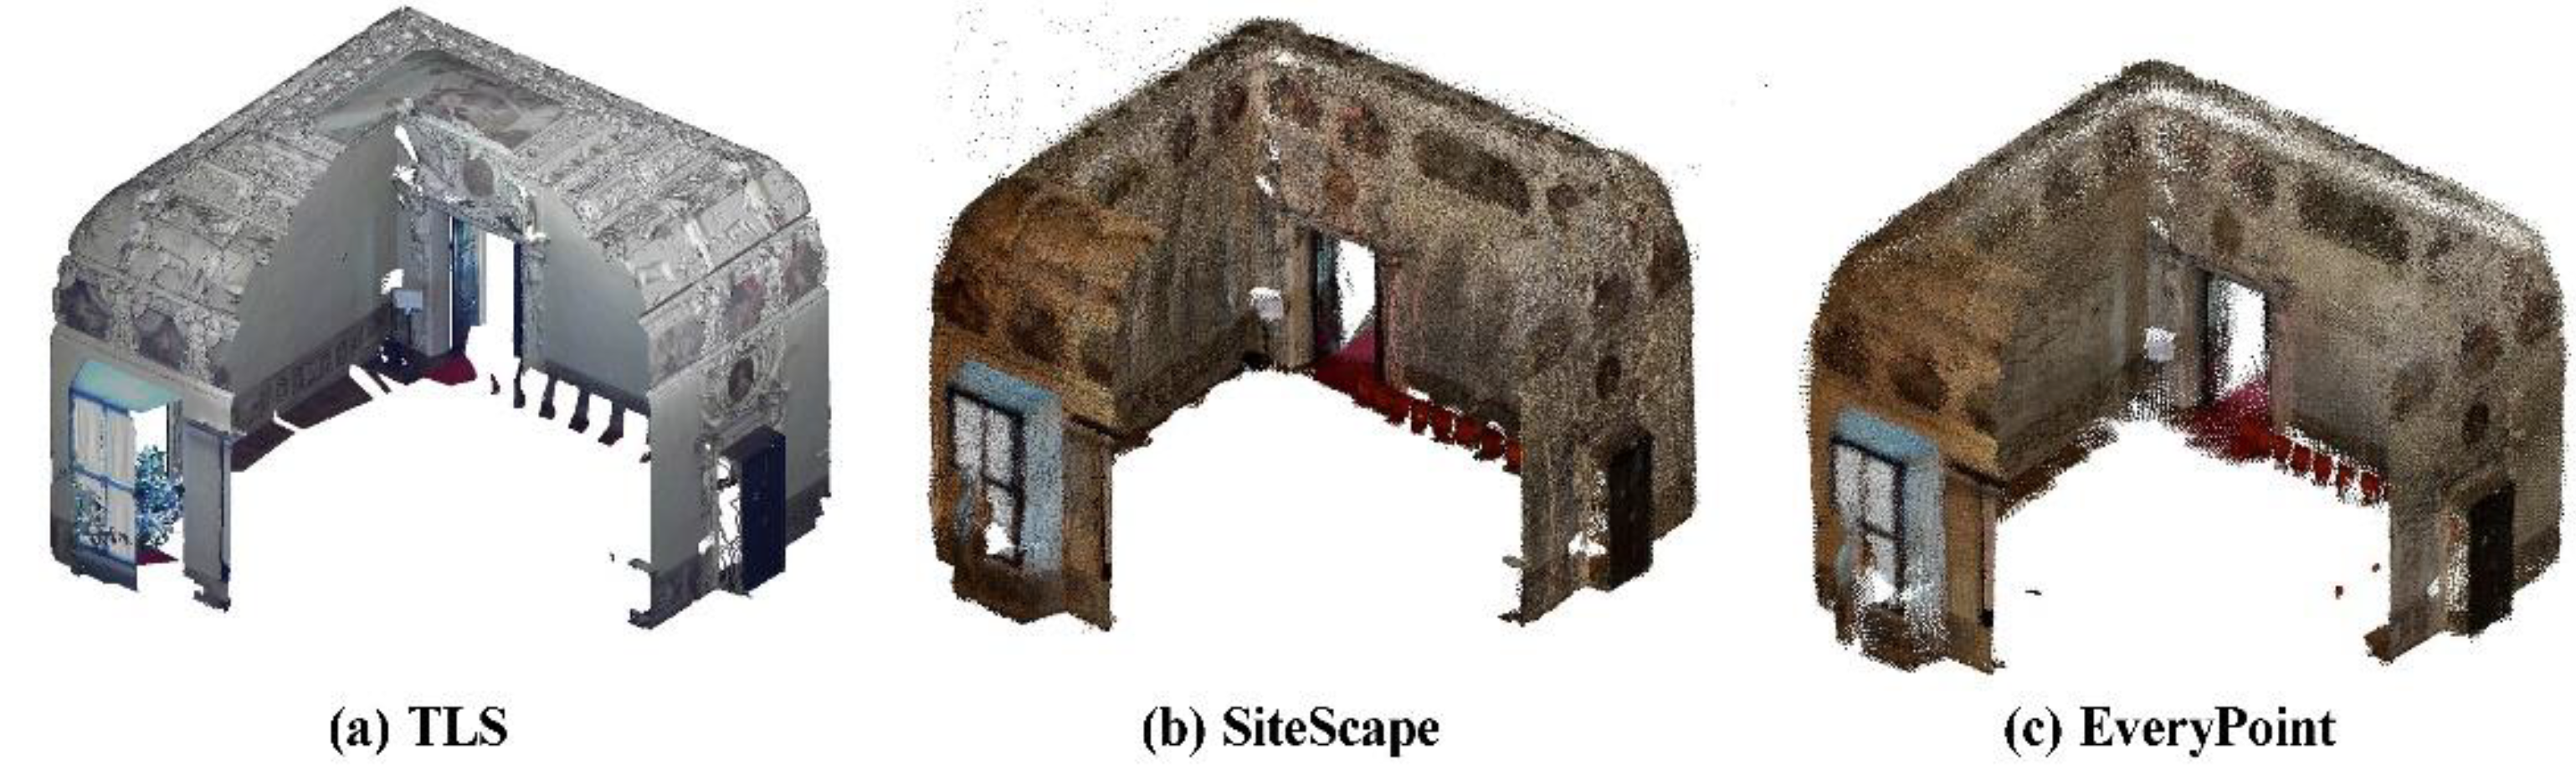
To better evaluate the performance of the Apple LiDAR in the field of heritage documentation, we decided to focus on three different application scales: Single medium-size objects (e.g., statues and decorative elements), interior medium-scale assets (e.g., rooms or medium/small spaces), and outdoor medium-scale asset (e.g., façades or portions of buildings).
For each application scale, a specific case study was selected (Figure 3): Case study A was a statue (single medium-size object), Case Study B was a decorated room (interior medium-scale), and Case Study C was a portion of an exterior façade.
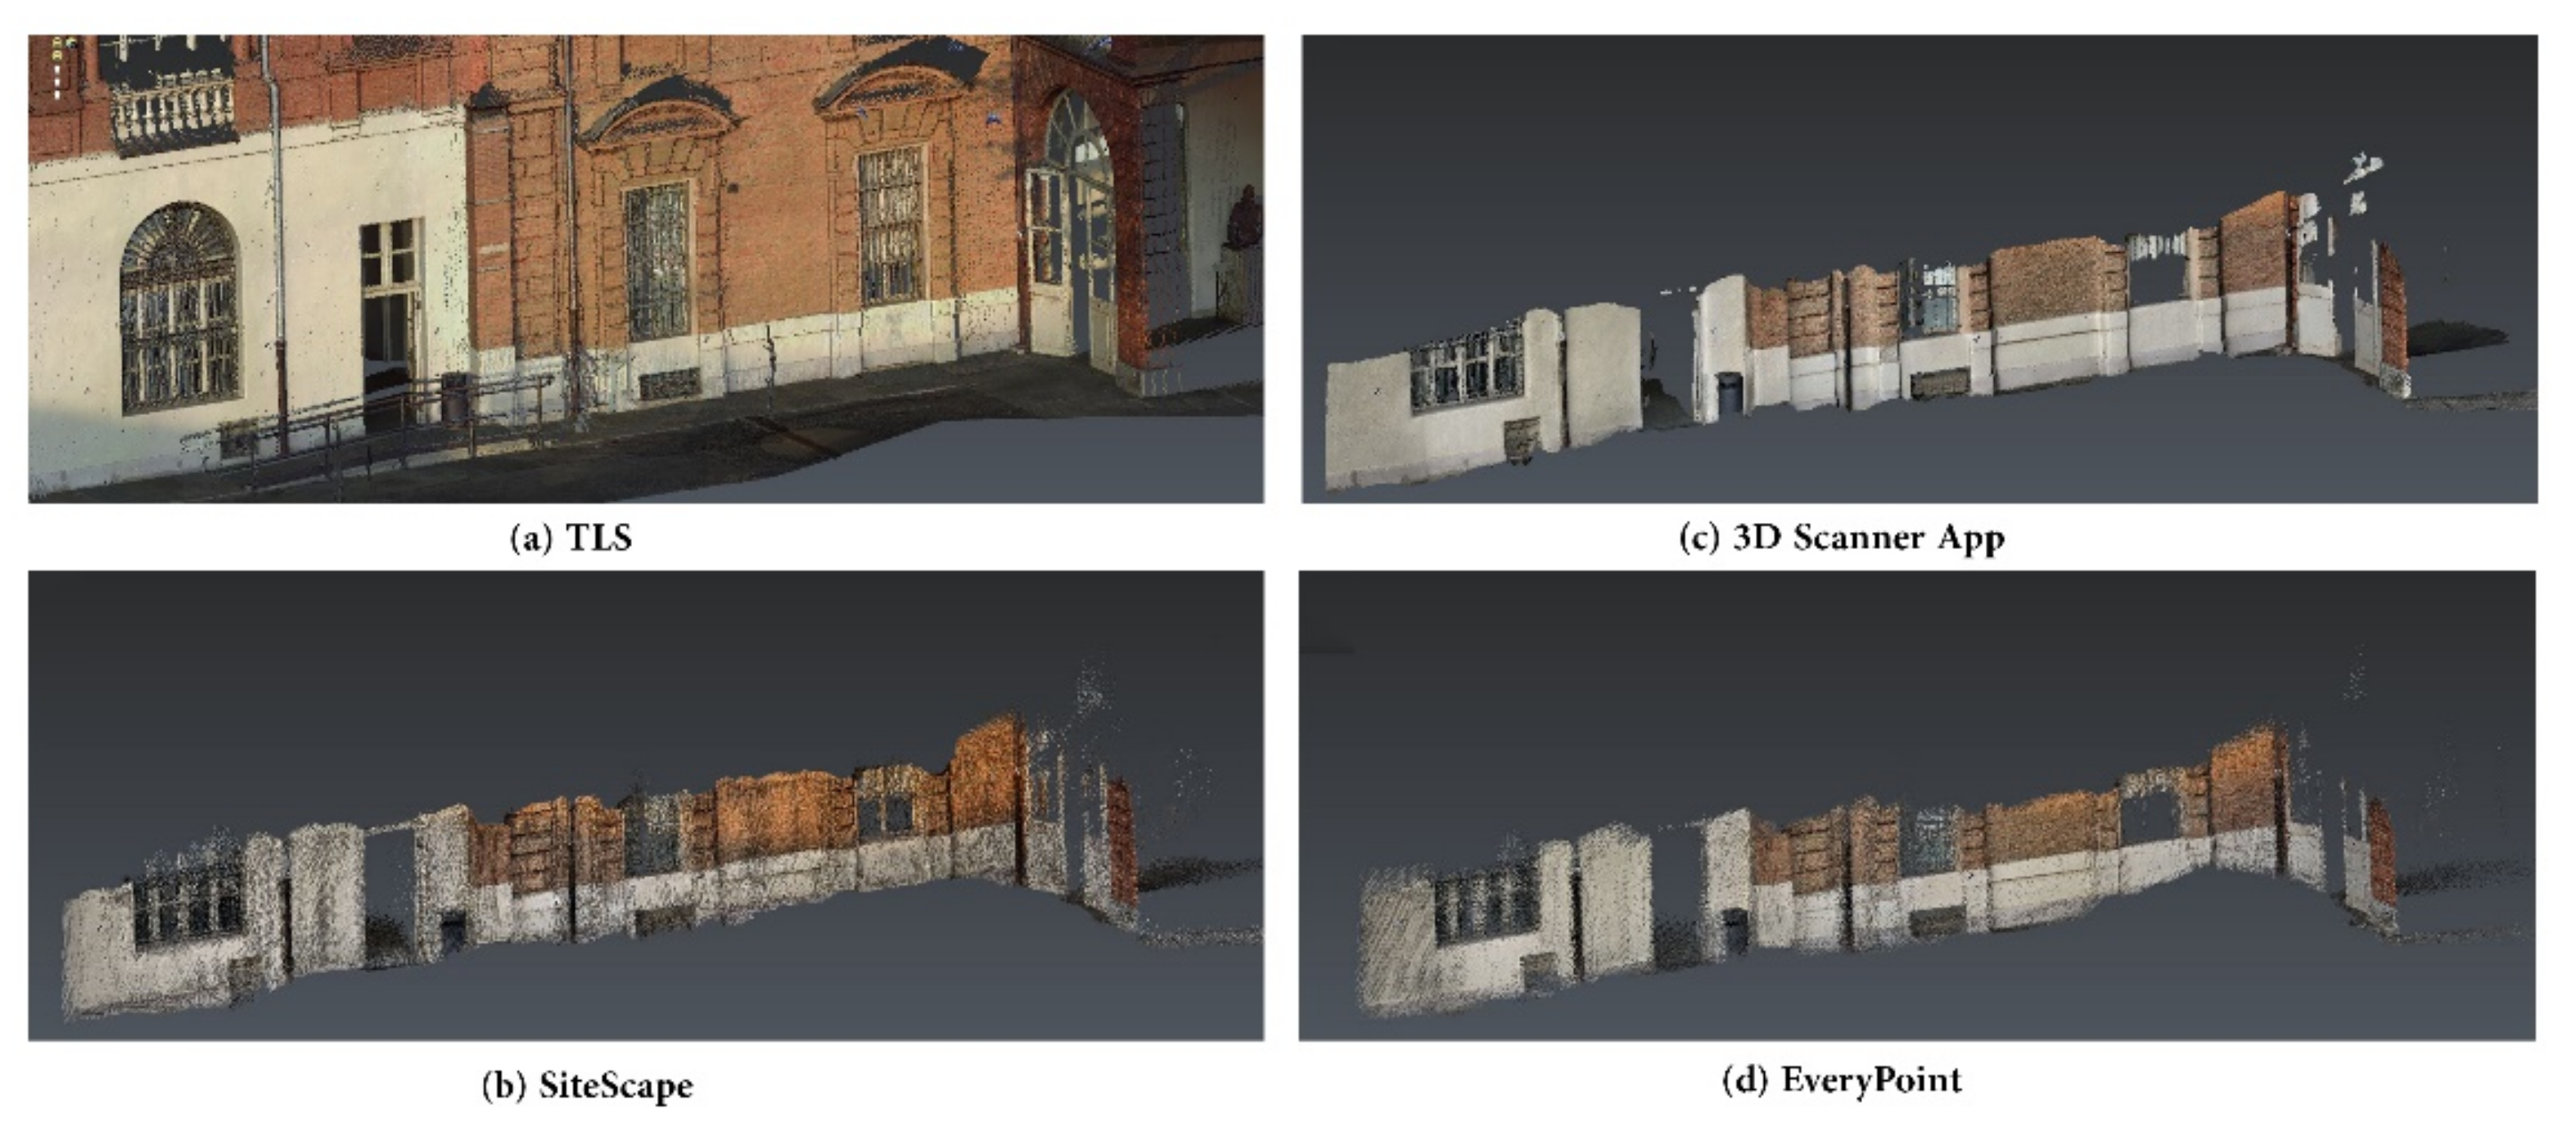
Acquisitions were carried out with SiteScape, EveryPoint, and the 3D scanner app installed on the iPhone device. At the same time, ground reference data were also acquired. TLS scans were recorded to obtain 3D models for validation purposes. For the TLS acquisition, a Faro Focus3D X330 was used, the main specifications of which are reported in Table 2.
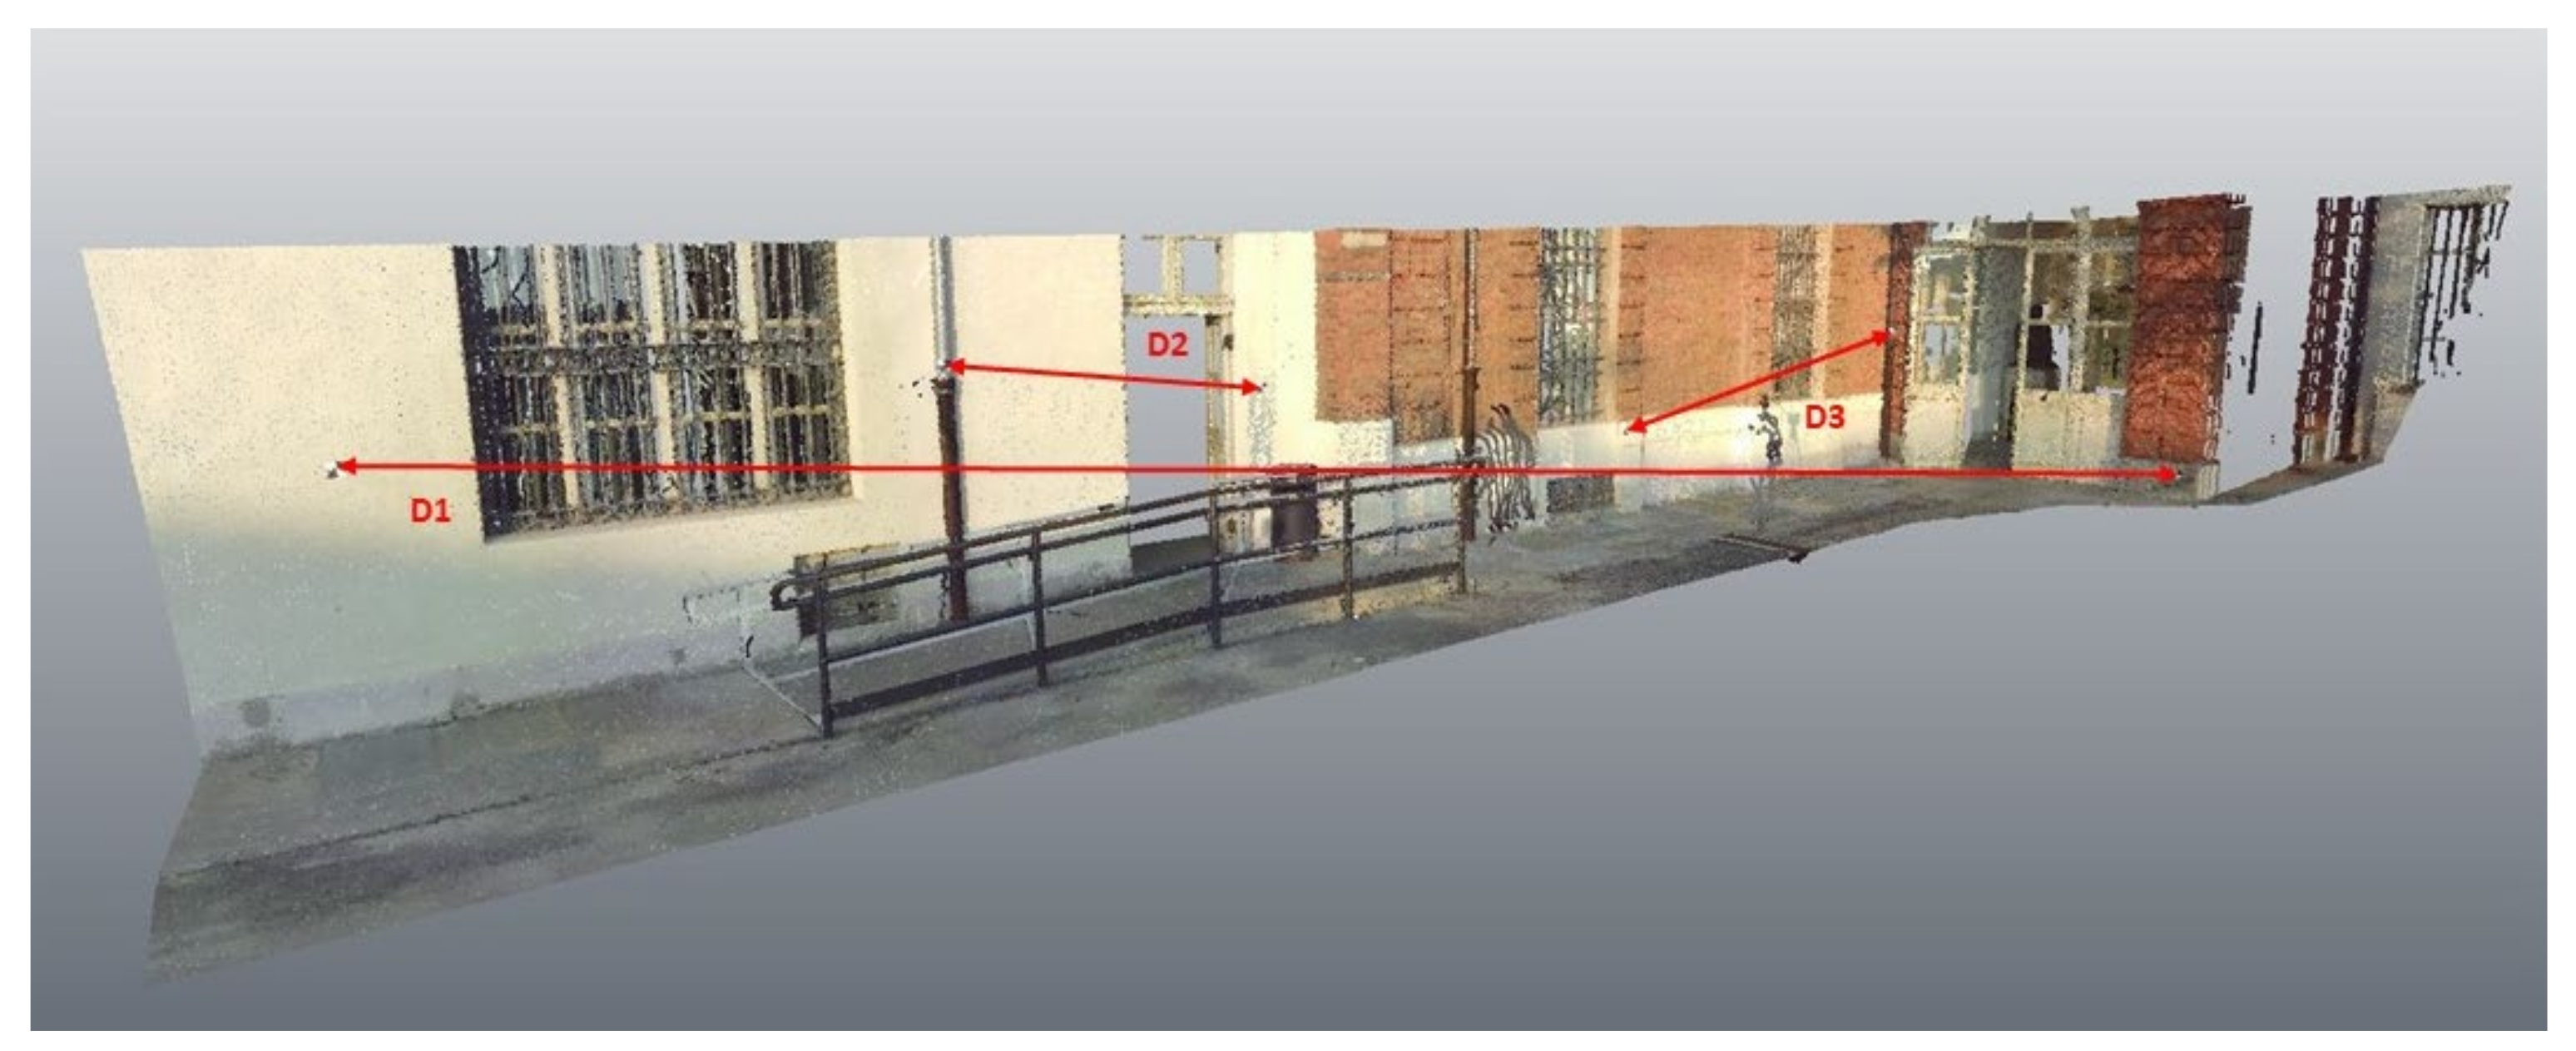
Case Studies A and C were surveyed with a single scan in portrait orientation, each lasting about 1 min, and moving the device horizontally from left to right at a distance of around 1 m from the object. Case Study B was completed in approximately 3 min with a single scan, starting and closing the scan in the same corner of the room, moving according to a continuous strip, and repeating the following movements in sequence until reaching the closing point: from up to down, then moving to the right, going from down to up, then moving to the right. The distance from the object was around 2 m. For the three case studies, the iOS apps settings used were SiteScape1, EveryPoint1, and 3D Scanner App1. Data collected with the iPhone were processed inside the mobile device, following a dedicated pipeline for each application, and then exported in an interoperable format (.las) for further processing and analyses. Before data validation, the iPhone LiDAR data were georeferenced in the same reference system of the TLS reference data set. Firstly, point-based registration was carried out, followed by a refined co-registration using iterative closest point (ICP) registration.

3. Results

3.1. Static Acquisitions

The first test, performed with both the iPad and iPhone, enabled us to observe and compare the matrix of points generated by the LiDAR sensors of the two tested devices. In the first test, the observation of the 2D array of emitted points with an NIR camera (Figure 4) highlighted that the iPad Pro and iPhone 12 Pro employed the same matrix of 24 × 24 points, arranged in 9 sectors of 8 × 8 points, in agreement with [29,42].
The same matrix, containing a total number of 576 points, was registered under all the iOS app settings (Table 1). Therefore, the emitted array was equal for the three apps and independent of the available settings. As no differences in the LiDAR sensor of the iPad Pro and the iPhone 12 Pro were observed, as has also been reported by Luetzenburg et al. [29], it is reasonable to suppose that the integrated sensor is the same.
Analysing the data of the second static acquisition, it is possible to notice that the iPhone 12 Pro registered an exponentially increasing amount of points, according to the resolution settings of the SiteScape app (Figure 5): 513 points for the lowest resolution (SiteScape6), then increasing by factors of 2 (SiteScape5), 4 (SiteScape4), 8 (SiteScape3), 16 (SiteScape2), 32 (SiteScape1). Furthermore, the distance between two consecutive points decreased with an almost linear proportion, as shown in Table 3. The observed values registered with the iPhone 12 Pro (Figure 5, greenish colour) were very similar to the values achieved with the iPad Pro (Figure 5, reddish colours), as has previously been reported by Spreafico et al. [30]. The difference between measures observed with the iPhone 12 Pro and iPad Pro were calculated for each of the iOS app settings, and the distances are reported in Table 3. The maximum difference was 2.3 cm for the lowest resolution (SiteScape6) at a distance of 4 m from the wall, where the difference increased according to the distance and decreasing the spatial resolution. The differences measured between the iPad Pro and iPhone 12 Pro are ascribable to the inexact positioning of the iPhone Pro, with respect to the position of the iPad Pro, and not to the difference in sensors. These results support the assumption that the sensors integrated in these two devices are the same.
All of these tests confirm what was already highlighted by Luetzenburg et al. [29]: the LiDAR sensors integrated into the iPhone and iPad are the same. For this reason, we decided to complete the acquisitions at sample areas in real case scenarios using only one device. In our case, the best solution was the iPhone, which, compared to the iPad, is more portable and allows for extra flexibility; nevertheless, the two devices can be used interchangeably.

3.2. Dynamic Acquisitions: Performances on Sample Areas

Regarding repeated acquisition on the same portion, the characteristics of the point clouds obtained with the SiteScape1, SiteScape4, SiteScape6, EveryPoint1, EveryPoint2, 3D Scanner App1, 3D Scanner App2, and 3D Scanner App3 iOS app settings are reported in Appendix A, Table A2. For the SiteScape and EveryPoint apps, repeated acquisition on the same portion increased the number of points observed in 1 m2 and the related density; meanwhile, for the 3D Scanner App, the repetition did not influence the acquired number of points. SiteScape was capable of acquiring the highest number of points (3,509,313/m2 for SiteScape1, lasting 20 s; Figure 6) and, consequently, the highest 3D density (27,466 points in a sphere of radius 5 cm). Observing the roughness, the lowest values (0.2 mm in a sphere of radius 5 cm) were related to the 3D Scanner App1, 3D Scanner App2, and 3D Scanner App3 settings; as the value reported was the same, it is reasonable to assume that the 3D Scanner App applies an automatic filter to remove noise and outliers.
Regarding the influence of illumination conditions, the characteristics of the point clouds acquired under the SiteScape1, SiteScape4, SiteScape6, EveryPoint1, EveryPoint2, 3D Scanner App1, 3D Scanner App2, and 3D Scanner App3 iOS app settings are reported in Appendix A, Table A3 for direct sun and shaded conditions. In all the acquisitions, the values differed slightly, especially for the number of points in 1 m2 (Appendix A, Table A3 and Figure 7); therefore, it seems that direct sun on the surveyed object does not influence the acquisition for the selected type of material and colour (pink plaster). However, different behaviours with other types of material and colour cannot be excluded.
Concerning the analysis related to different materials (Appendix A, Table A4), all of the tested iOS app settings (SiteScape1, SiteScape4, SiteScape6, EveryPoints1, EveryPoints2, 3D Scanner App1, 3D Scanner App2, and 3D Scanner App3) led to results consistent with the previous test, generally showing no specific impact of the surface material on the LiDAR-based acquisitions. As already stressed in the analysis of the repetition on the same portion, the 3D Scanner App always provided 0.2 mm as the roughness value (except for bricks and river stone, for which it was slightly higher). Therefore, again, it is reasonable to assume that the 3D Scanner App applies an automatic filter to remove outliers and noise. The overall comparison between the iOS app settings indicated that the values were similar for all materials; SiteScape1 registered the highest number of points (on the order of millions of points) and EveryPoint2, the lowest (on the order of thousands of points), while 3D Scanner App1 and 3D Scanner App2 registered similar values (on the order of tens of thousands of points).

3.3. Results of the Analyses in Real Case Scenarios

3.3.1. Case Study A

Concerning Case Study A, all of the different iOS applications succeeded in delivering a complete point cloud of the considered object (Figure 8). As expected, the TLS point cloud was far more complete and detailed among the four; however, three scans were necessary to achieve this result, with a total acquisition time of around 30 min. In contrast, all the acquisitions with the iPhone were completed within 1 min.
From a cursory qualitative inspection, it is clear that the three iPhone point clouds were quite different, in terms of point density and completeness of the information, when dealing with realistic scenarios. All four point clouds were, thus, thoroughly analysed; using the same bounding box for each cloud, a density analysis was carried out using with the Leica Cyclone 3DR software. The results are reported in Table 4.
It is interesting to observe that 3D Scanner App and EveryPoint acquired almost the same number of points, while SiteScape generated nearly five times the number of points, compared to the other two apps, possibly due to the aggregation of the acquired 3D points, rather than substitution/interpolation, when sensing the same area. This number is more than double the points acquired with the TLS for the same portion of the monument. It is, therefore, essential to stress that the number of acquired points is related to the adopted iOS application and, aside from the intrinsic hardware limitation, this aspect plays a crucial role.
A cloud-to-cloud distance (C2C) analysis was also carried out, using the TLS data set as reference (the maximum allowed distance analysis was set as 0.1 m, in order to exclude possible outliers). The choice of threshold adopted for this analysis was related to the general accuracy requested in the CH survey. For Case Study A, the number of points excluded from the C2C analysis was low: 0.6% for SiteScape, 3% for 3D Scanner App, and 4% for EveryPoints.
The results of this analysis are reported in Figure 9 and Table 5.
Visual inspection of the C2C analysis allowed for a systematic deviation to be identified for the acquisitions performed with SiteScape (b) and EveryPoint (d). In both cases, higher residuals were observed in the right part of the images. The acquisition started from the left and moved toward the right part of the monuments; thus, this deviation can be ascribed to drift error occurring during the acquisition, which can be expected when not adopting a SLAM approach.
On the other hand, the results for the 3D Scanner App were different: in this case, the residuals presented a normal distribution and were more homogeneously spatially distributed.
Looking at the distribution percentages reported in Table 5, it is possible to remark that all the values were within the range of a few centimetres, confirming the overall excellent precision and accuracy of the Apple Lidar. Among the three applications considered, SiteScape (b) achieved the best results: more than 80% of points had deviation lower than 2 cm, despite the systematic deviation on the right portion of the statue.
To further evaluate the precision of the acquired point clouds, a set of distances was measured and compared with those extracted from the TLS. The distances measured for this analysis are shown in Figure 10, while the results are reported in Table 6.
The results were generally in line with the C2C analyses, with some differences. The data set characterised by lower residuals (<3 cm) was, again, the one generated by SiteScape, while higher deviations (up to 12 cm) were presented in the other two Apple LiDAR data sets. In general, higher residuals were related to longer distances (D2 and D4) for both EveryPoint and 3D Scanner App, again suggesting an inhomogeneous precision of the point cloud, possibly due to drift effects.

3.3.2. Case Study B

Case Study B was related to one of the decorated rooms of the Castello del Valentino (Turin, Italy), which, from 1977, has been part of the list of UNESCO World Heritage Sites. This room presents a complex palimpsest of stuccoes and frescoes (see Figure 11).
First, a density analysis was carried out on the different acquired point clouds. In this specific case, the 3D Scanner App could not complete the post-processing of the acquired data; more specifically, the point cloud colorization phase failed and, thus, it was impossible to perform co-registration of the different data sets and the subsequent analyses. As for Case Study A, the result of the point density analyses (Table 7) showed a higher number of points for the SiteScape app, with respect to the other tested iOS apps.
As detailed in the following sections, the C2C analysis highlighted and confirmed some issues in the overall point clouds acquired by the different iOS applications. It should be reported that, in this case, the number of points excluded (when setting up the threshold of 0.01 m) was higher than in the other two case studies: 50% for EveryPoint and 40% for SiteScape. These higher percentages are related to drift error in the acquisition, as confirmed by the other completed analyses. The results of C2C analysis are reported in Figure 12 and Table 8.
For Case Study B, an indoor architectural scale case study, we decided to perform a specific analysis to evaluate the capabilities of the iPhone LiDAR sensor coupled with a specific iOS app to reconstruct the room surfaces, through assessing the related precision and accuracy. The three point clouds available for this data set were imported in Autodesk AutoCAD, and two different section planes were set. The same horizontal and vertical sections were manually extracted for each point cloud and then compared. Vertical and horizontal 2D profiles are shown in Figure 13 and Figure 14, respectively.
A non-uniform deviation between the TLS reference data set and the other two LiDAR point clouds is clearly visible for both horizontal and vertical sections. As the main difference noticeable in the horizontal section, the point cloud derived from SiteScape performed slightly better, compared with that of EveryPoint; meanwhile, in the vertical section, the deviation of the two Apple LiDAR point clouds with respect to the TLS point cloud was almost identical. In both profiles, however, it is clear that the errors were proportional to the time elapsed after the start of the acquisition and, therefore, related to drift error during acquisition, as observed in Case Study A. Finally, for Case Study B, it was not possible to conduct distance analysis, due to the high noise registered in the LiDAR point cloud, which did not allow for precise identification and measurement of the artificial targets used to define the different distances.

3.3.3. Case Study C

Case Study C considered an external wall of the Castello del Valentino (Figure 15). In this case, all three scans performed with the Apple LiDAR apps were successful, and it was possible to proceed with comparison with the TLS data set, setting up the same bounding box for each data set.
First, a point density analysis was carried out. As can be seen from Table 9, the results confirmed that SiteScape acquired the highest number of points. In contrast, EveryPoint acquired the lowest number of points.
The results for the C2C analysis are shown in Figure 16 and detailed in Table 10. In this case, the distances between the TLS data set and the Apple LiDAR data sets presented a similar trend. More specifically, the major differences were located at the two extremities of the acquisition (i.e., at the beginning and ending). Although the errors at the end of the acquisition followed the trend already identified in the other two case studies, those at the beginning could be related to the initialization of the scanning operation; however, further tests in a broader sample of data sets are needed to better describe this phenomenon.
Analysing the values in Table 10, the iOS app with slightly lower performance was EveryPoint, considering that different areas of the point cloud had a deviation higher than the threshold chosen for this analysis (0.1 m), which were thus excluded from the data sampled in this case. This issue is also observable for SiteScape; however, this error was almost entirely located in the external area at the ending of the acquisition path. On the other hand, the 3D Scanner App data analysis highlighted that the major deviations were equally distributed at the extremities of the point cloud, and most residuals were within the range of a few centimetres.
For Case Study C, the number of points excluded by the threshold was lower than that in Case Study B and higher than that in Case Study A: 17.9% for 3D Scanner App, 10% for SiteScape, and 27% for EveryPoint.
The three distances calculated for the distance analysis are depicted in Figure 17, while the results of the comparisons are reported in Table 11.
The results confirmed what was already underlined in the C2C analysis: the EveryPoint application presented the worst performance, while SiteScape and 3D scanner app generally presented lower deviations. Distance D1 (affected by the larger residual) was the longest one, connecting two points at the extremities of the point cloud; notably, these were the areas that were affected by more significant errors in the C2C analysis.
This data set was acquired to test the performances of the Apple LiDAR apps in the case of larger surveys requiring a longer acquisition time. Analysis of the residuals with respect to the TLS reference data set seemed to confirm the relation between the overall acquisition time and residual errors.

4. Discussion

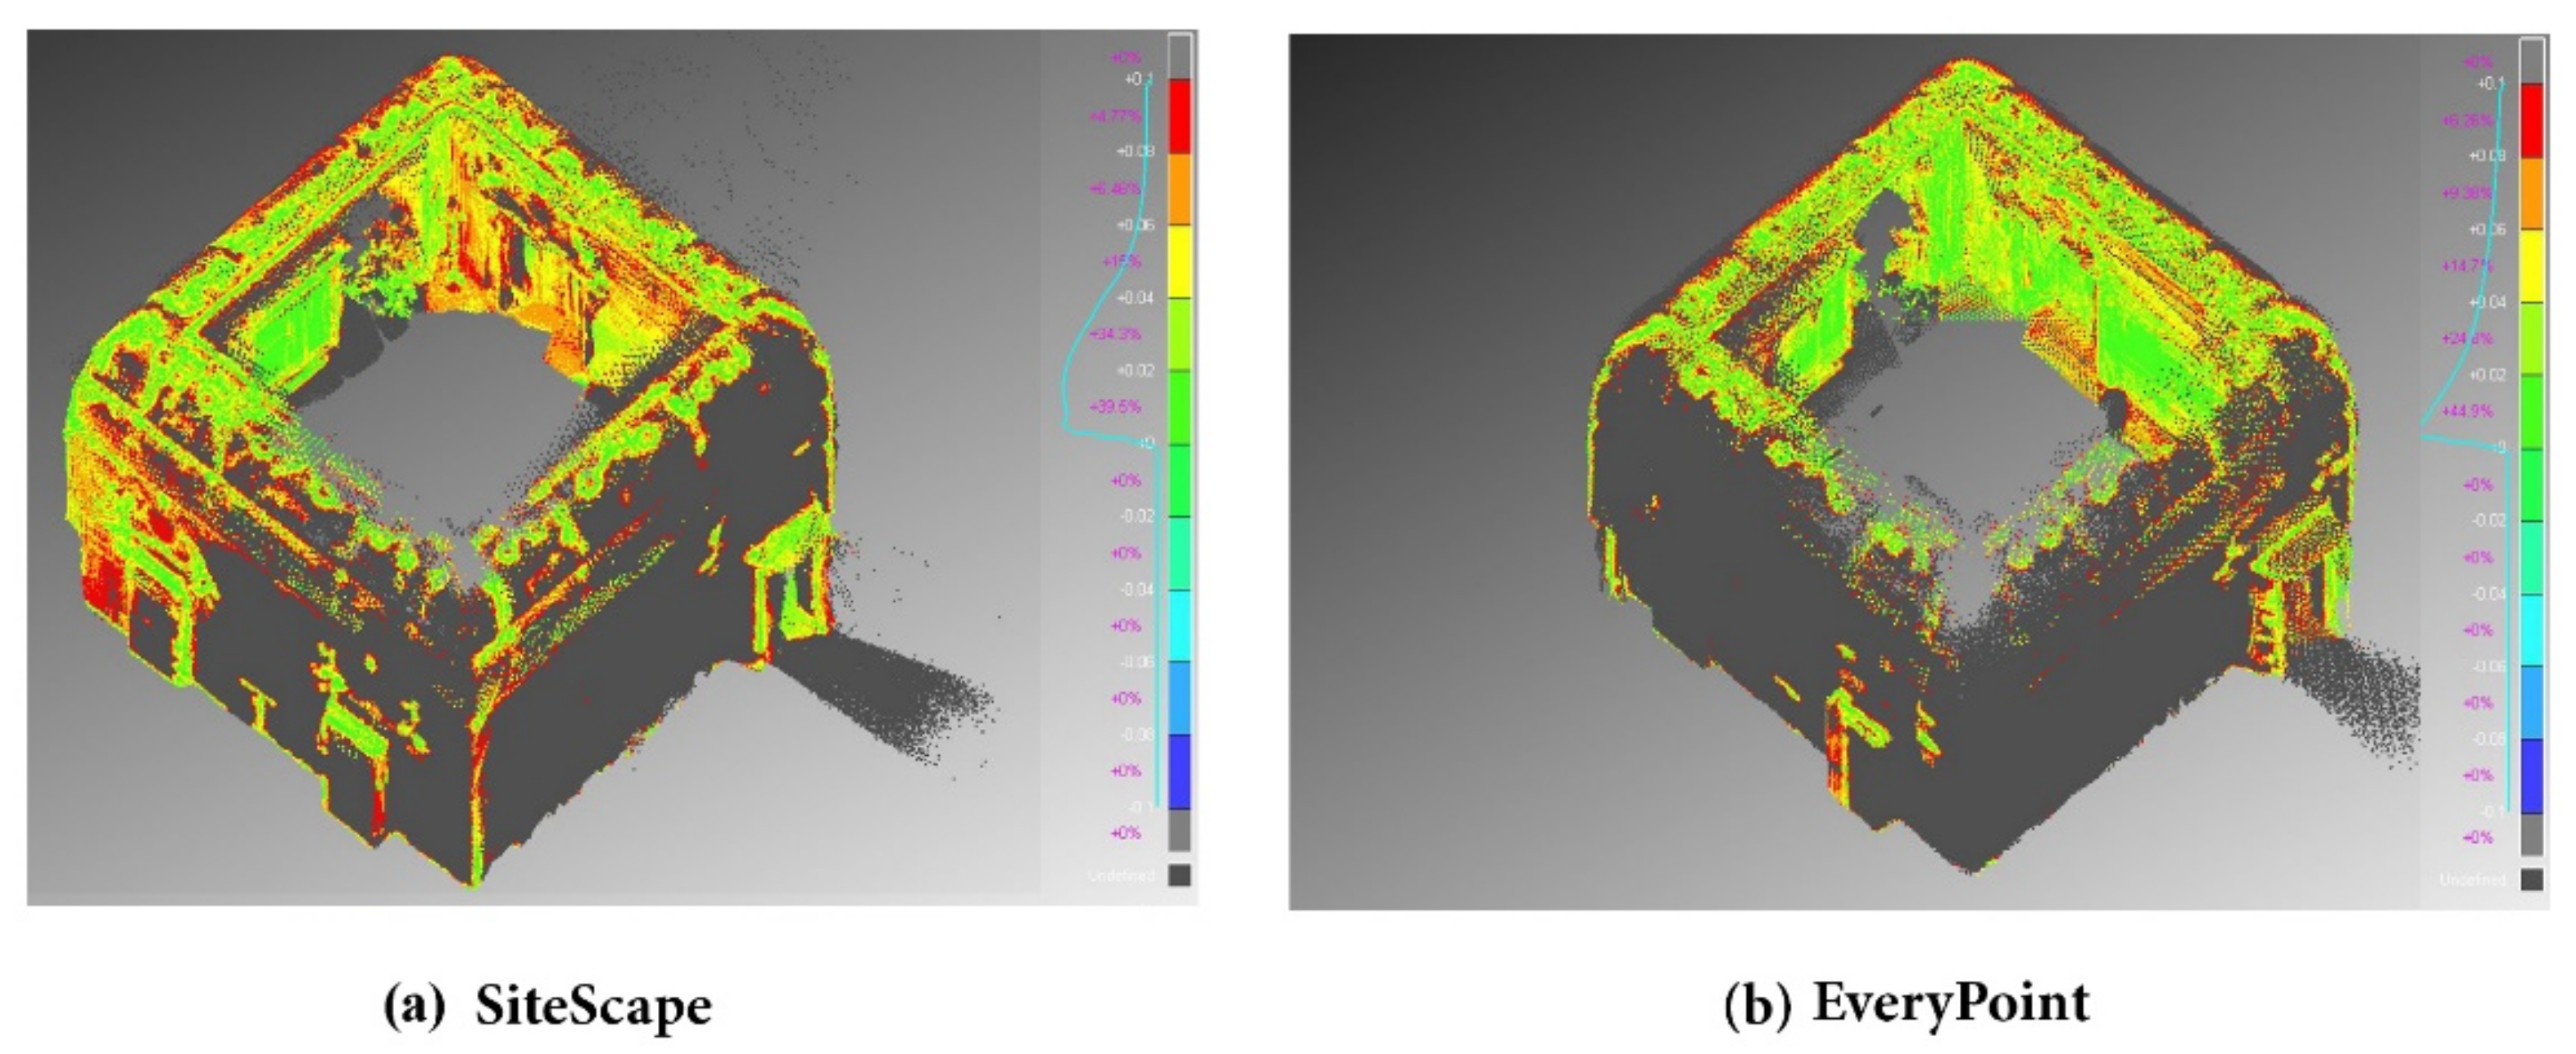
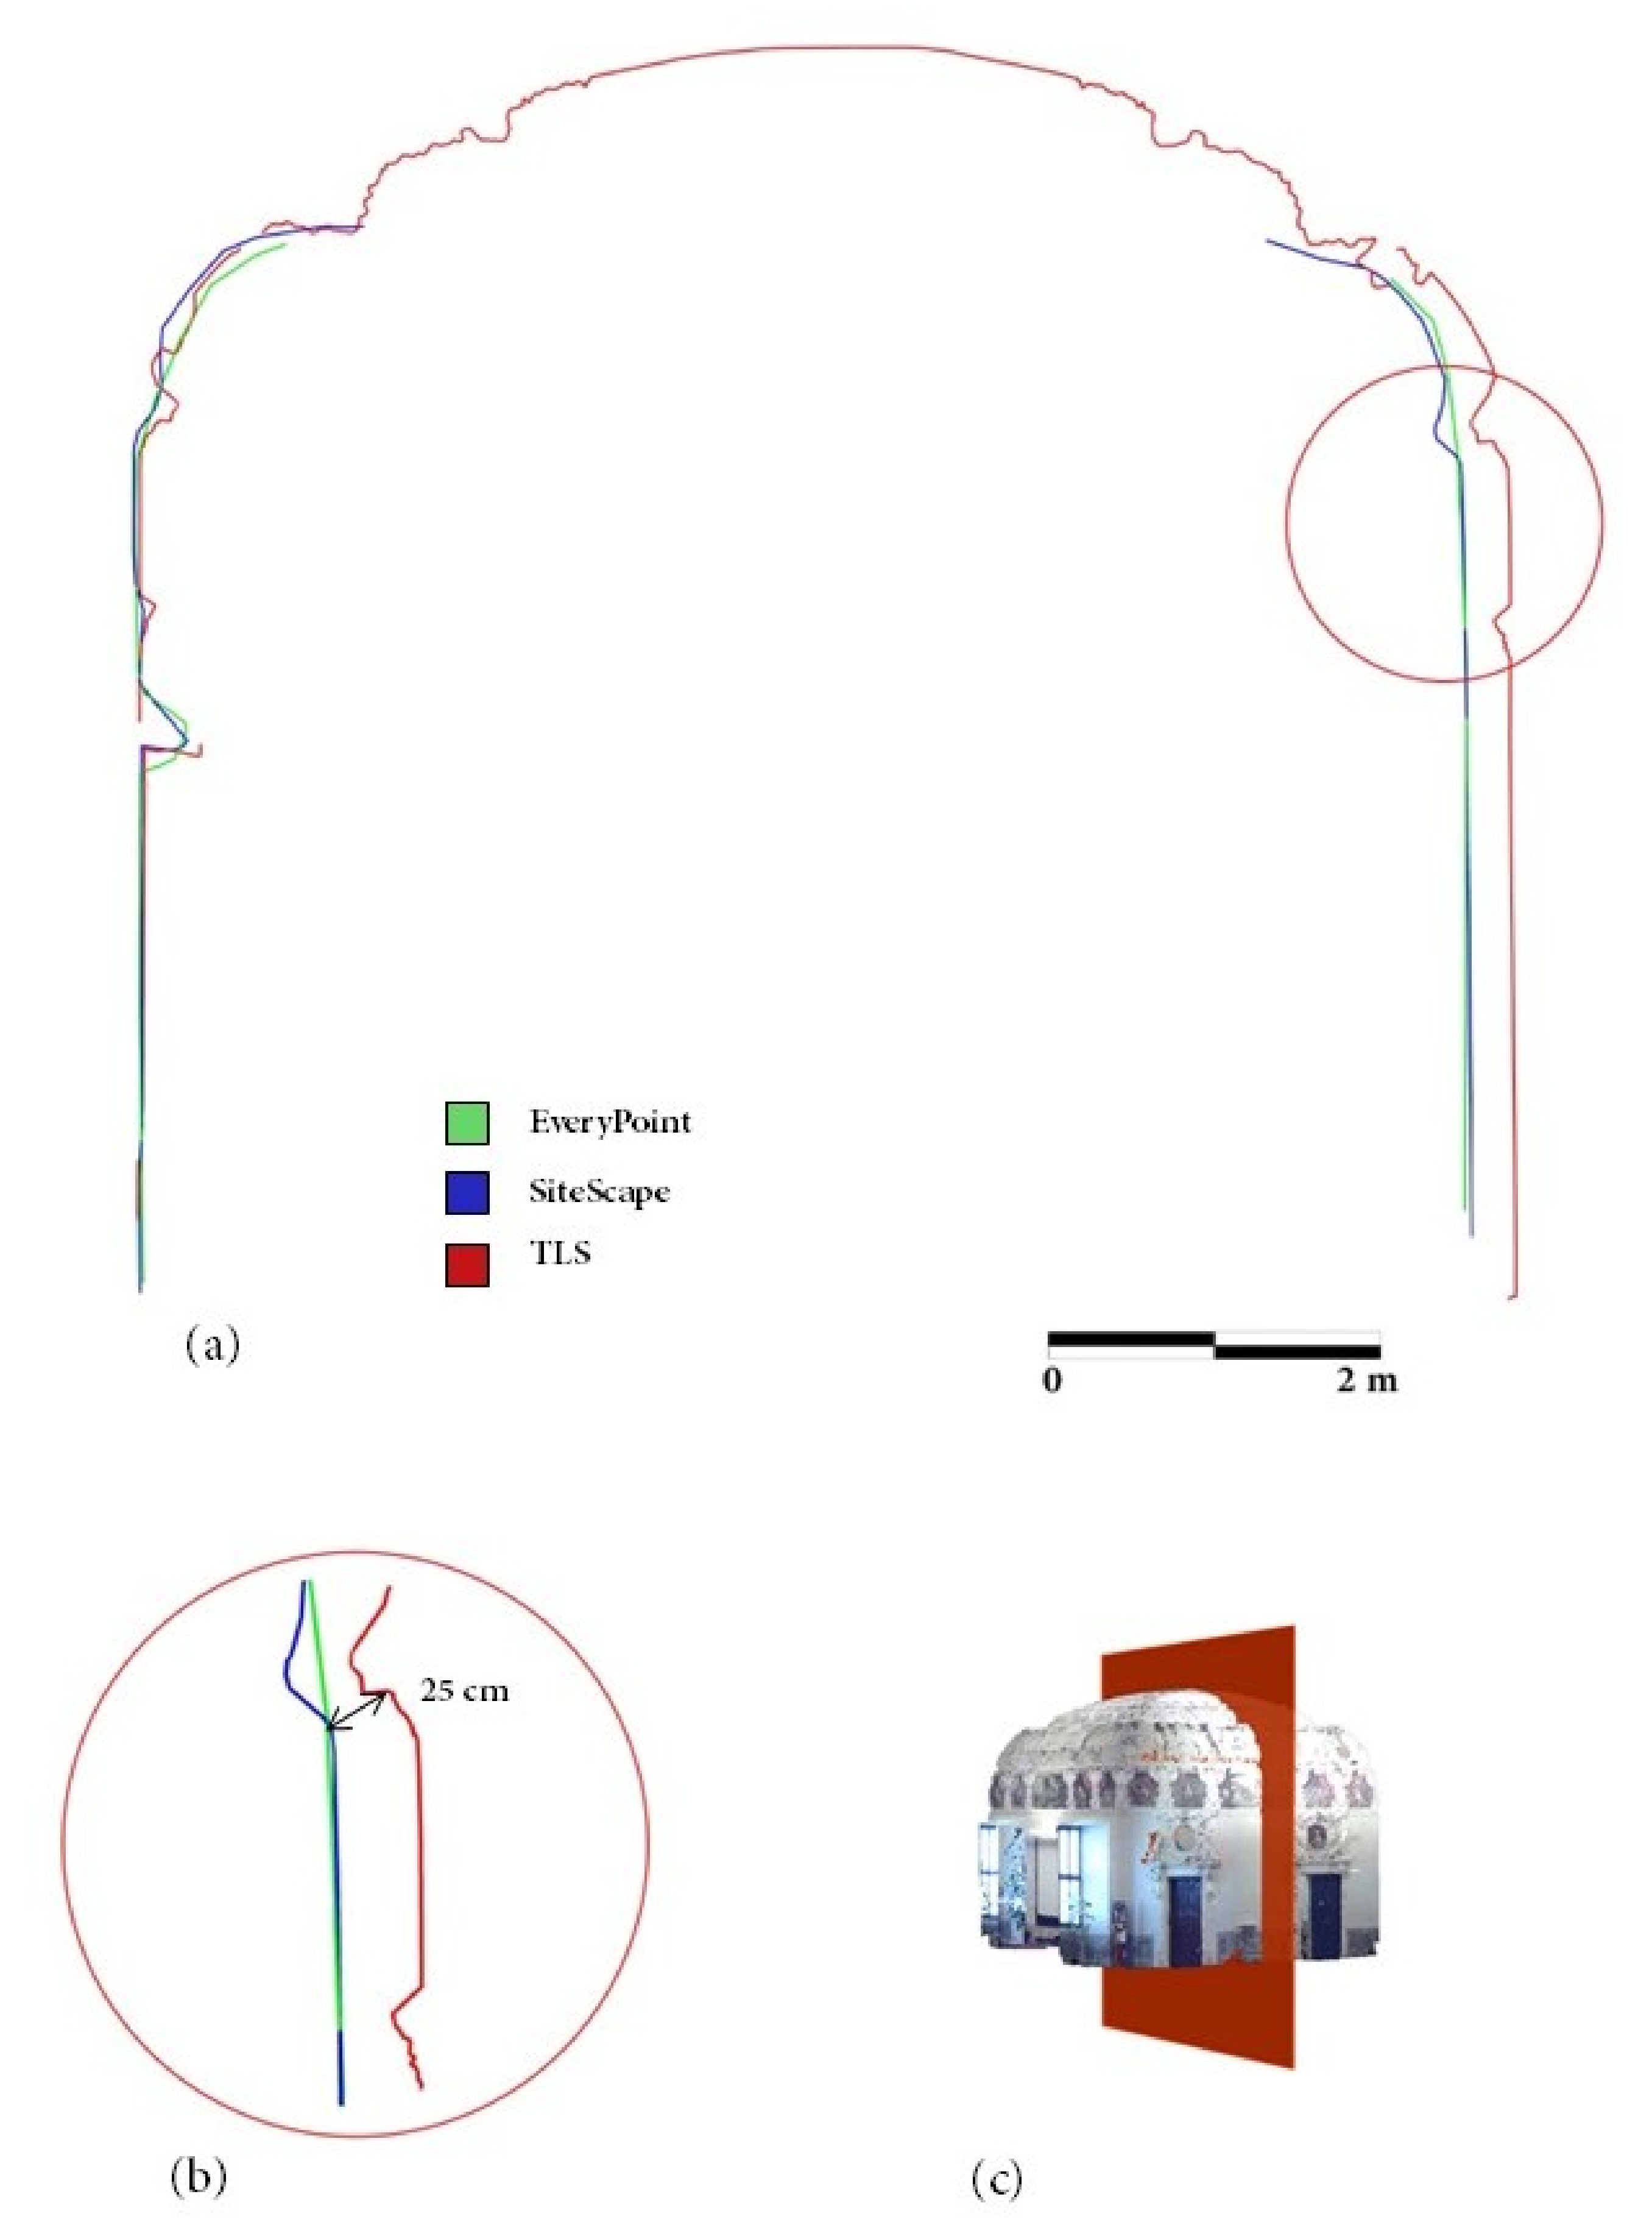
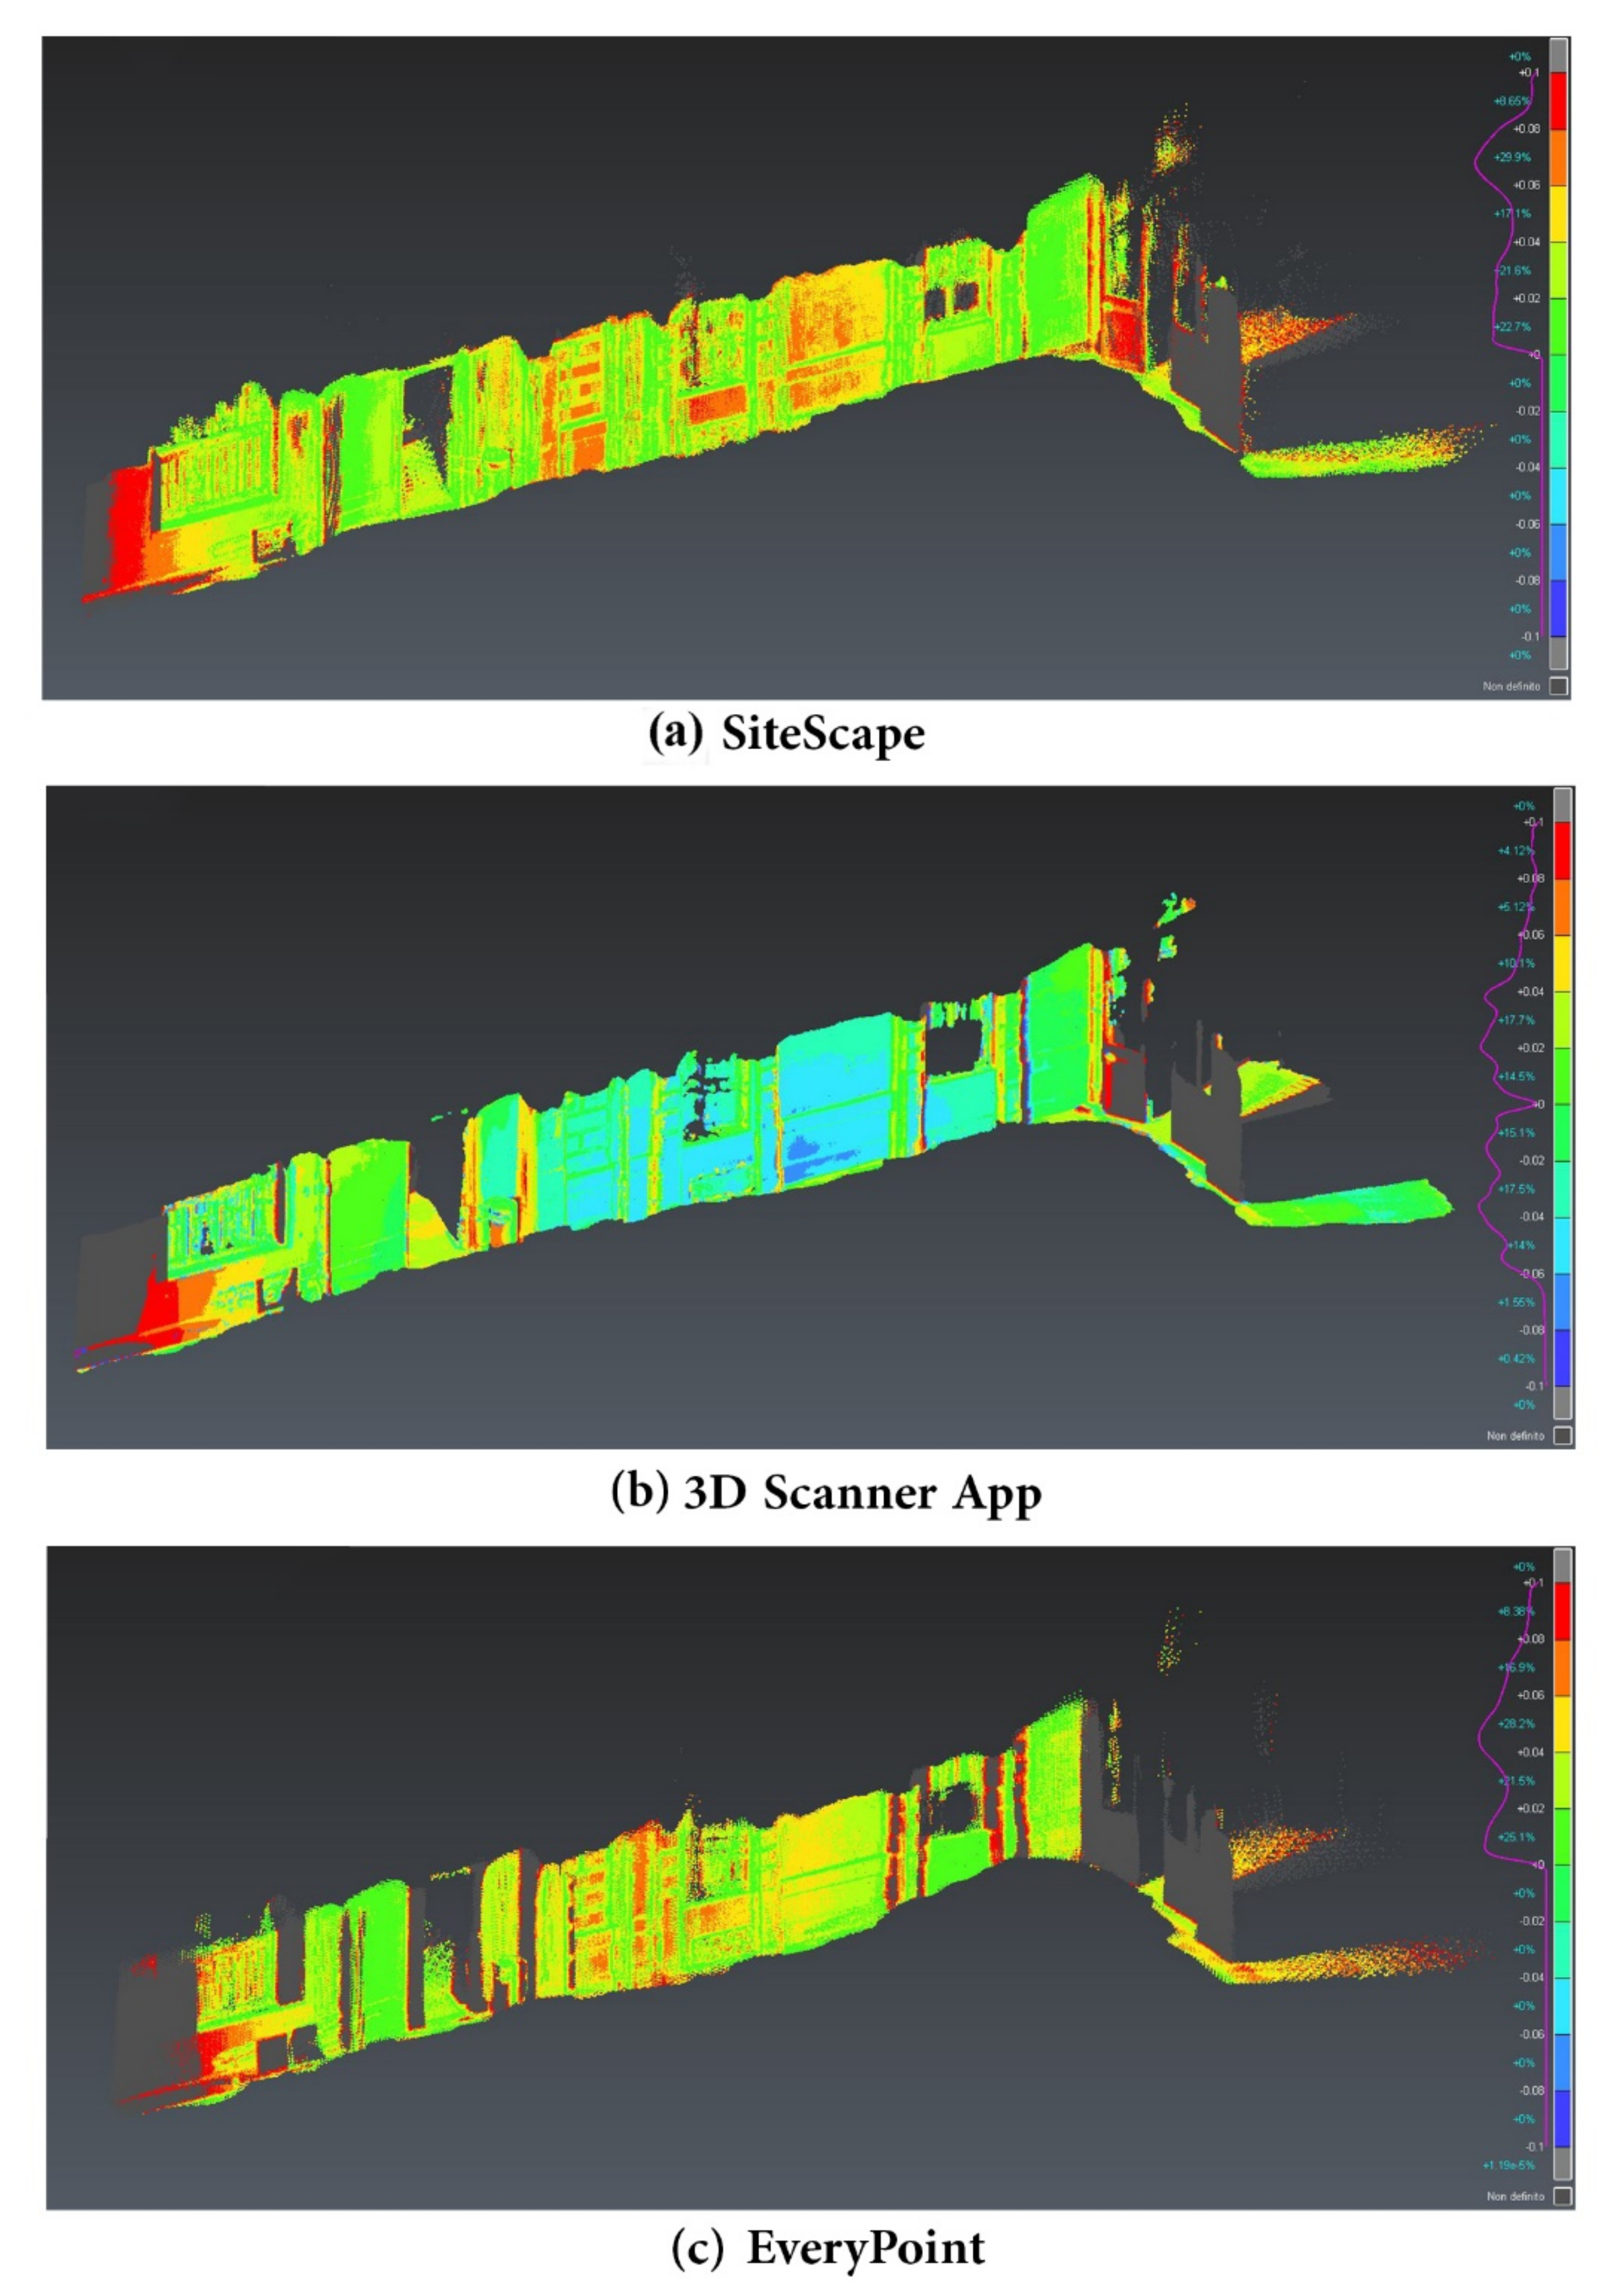
The research presented in this work evaluated the performance of the LiDAR sensors embedded in the new series of Apple personal devices: iPad Pro and iPhone 12 Pro. The tests aimed to explore the possibilities offered by this solution within the framework of CH documentation, focusing on three different representation scales and determining the precision and accuracy of the derived 3D point clouds (which has only been partially tackled by other research groups in the available scientific literature). The different iOS apps available to exploit the survey capabilities of the LiDAR sensor were analysed, and three were selected for further testing, first in ad hoc tests to evaluate the main characteristics of the sensors and then to analyse their operational workflow in outdoor and indoor environments under different lighting conditions and on different materials.
The analysis outcome suggested that the iPad Pro and iPhone 12 Pro utilize the same LiDAR sensor. Nevertheless, each tested application (SiteScape, EveryPoint, and 3D Scanner App) provided different results, highlighting the crucial role of the software component when exploiting the same hardware setup. Each iOS app allows a few parameters to be set, customizing the scanning point density in the range from 200 (3D Scanner App) to 2,000,000 (SiteScape) points/m2 at 1 m distance on the surveyed surface. Generally, SiteScape permits us to acquire a higher number of points, in comparison to 3D Scanner App and EveryPoint; meanwhile, the 3D Scanner App does not increase the number of points if the operator scans more than one time the same area, leading to a less noisy point cloud. This is most probably related to a better point cloud post-processing and filtering, which, nevertheless, can impact the level of detail.
The tests carried out in shaded and sunlight conditions and on different materials suggested that the sensor is not highly influenced by either the illumination or the material.
The tests performed, considering three different real case studies characterized by different mapping scales, were crucial to highlight the operational limitations of tested iOS apps coupled with the LiDAR sensor, depending mainly on the dimensions and characteristics of the object (and, consequently, the overall acquisition time). This analysis highlighted that the quality of the acquired data also depends on the iOS application, mainly related to precision and accuracy, geometric reconstruction, maximum acquisition time and, consequently, the maximum size of the acquired object.
It is likely that the algorithms for the device positioning and 3D data acquisition implemented in these applications are different, and that each application exploits and integrates the data available from the other sensors of the smartphone (e.g., gyroscope, camera, GNSS, and so on) in different ways.
The continuous enhancement and updating of the available applications are a clear sign that CV algorithms exploiting SLAM and photogrammetric approaches are still being developed and further adapted. The optimization of these algorithms and their performances is important, considering the limited hardware resources of the mobile devices (including the battery capacity), which, despite the growing rate over the last years, still pose limitations when managing big data sets, such as 3D LiDAR point clouds.
All of the performed analyses confirmed the actual potentialities and limitations of the Apple LiDAR for real 3D surveying applications. At the actual state of development, it is possible to state that this sensor (coupled with the available iOS apps, to be appropriately tested and selected according to the user’s requirements) can be successfully used for the documentation of small and medium-size objects (e.g., statues, museum objects, small rooms or small parts of buildings, decorative architectural elements, and so on) with a precision of few centimetres and a high level of detail. For the surveying of larger buildings or sites, it is necessary to develop iOS apps embedding SLAM algorithms (possibly also exploiting visible cameras), which are capable of estimating the position and attitude of the sensor during the survey with higher accuracy. Nevertheless, in the case of fast documentation approaches at smaller nominal map scales, the current solutions already meet the requirements.
Concerning the acquisition phase, it was noticed that acquiring the same portion of objects multiple times did not necessarily improve the quality of the data acquired (depending on the iOS app), and that a quite fast acquisition can be performed with the aim of covering all the object surface, paying some attention to avoiding abrupt movements.
Given the crucial role of the software component, it would be highly beneficial to include an advanced modality enabling fine-tuning of the acquisition parameters for skilled users aimed at optimizing the quantity and quality of the derived 3D models. No customization of the processing phase is currently available, and no technical information is provided regarding the type of automatically applied post-processing algorithms. Finally, it would be helpful to add a re-processing option for the acquired data that—as for most of the available SLAM solutions on the market—allows for the correction of drift error and significant deviations.

5. Conclusions

The expectations for the following years are promising from two perspectives: device development and software development. From the device development side, it is relevant to report that Apple has chosen to release the iPhone 13 Pro with a LiDAR sensor, again proving the interest for this technology in low-cost (in comparison to TLS) devices for mass consumers. From the software development side, the potential market related to the use of mobile devices for 3D metric survey is already emerging, considering that software houses are releasing surveying software specifically aimed at exploiting the Apple LiDAR device: to name one, Dotproduct LLC [50] has announced the beta version release of DOT3D for iOS.
Finally, another critical technical feature of the Apple LiDAR sensor that was not evaluated in this study—but which the research group deems worthy of further exploitation for surveying—is the frame rate, which enables the acquisition of multi-temporal 3D point clouds to acquire and measure moving objects in 3D.

Author Contributions

Conceptualization, L.T.L., A.S., F.C., F.G.T.; methodology, L.T.L., A.S., F.C., F.G.T.; validation, L.T.L., A.S.; formal analysis, L.T.L., A.S.; writing—original draft preparation, L.T.L., A.S.; writing—review and editing, L.T.L., A.S., F.C., F.G.T.; supervision, F.C., F.G.T. All authors have read and agreed to the published version of the manuscript.

Funding

This research received no external funding.

Conflicts of Interest

The authors declare no conflict of interest.

Appendix A

Table A1. List of applications that allows generating 3D models of the real world available on the Apple store (updated in September 2021).
NameLicenseOutputSupported
File
Formats
First
Release
Latest Version 1Developer
Point CloudMesh
SiteScape—LiDAR 3D Scannerfreeyesyes.e57, .ply20201.0.10SiteScape Inc.
EveryPointfreeyesno.e57, .ply20202.8URC Ventures Inc.
Sakura 3D SCANFree/by chargeyesyes.asc, .txt, .obj, .stl20202.13.0Armonicos Co., Ltd.
Scaniverse—LiDAR 3D Scannerfreeyesyes.fbx, .obj, .glb, .usdz, .stl, .ply, .las20211.4.9Toolbox AI
Modelar—3D LiDAR Scannerfreeyesyes.obj, .stl, .usdz, .ply, .20211.1.0Modelar Technologies
Pix4Dcatch: 3D scannerRequires Pix4Dcloud or Pix4Dmapperyesyesgeolocalized images20201.5.0Pix4D
Polycam—LiDAR & 3D ScannerBy chargeyesyes.dae, .fbx, .usdz, .stl, .dxf, .ply, .xyz, .las, .pts, images20212.0.4Polycam Inc.
Heges 3D ScannerBy chargeInformation not providedyes.ply, .stl, .glb20181.5Marek Simonik
Lidar Scanner 3DBy chargeInformation not providedyes.ply, .stl, .obj, .usdz20201.2Marek Simonik
3D Scanner Appfreeyesyes.e57, .ply, .las, .pts, .xyz, .pcd, .stl, .glb, .gltf, .obj, .usdz, .dae, .fbx, .p3d, images20201.9.5Laan Labs
TAB-Map—3D LiDAR Scannerfreeyesyes.ply, .obj20210.20.12Mathieu Labbe
Forge—LiDAR 3D ScannerBy chargeyesyes.fbx, .obj, .glTF, .laz, .ply20211.3.0Abound Labs Inc.
1 As of September 2021.
Table A2. Characteristics of point clouds acquired with iPhone 12 Pro on the same portion for different iOS apps settings.
iOS Apps SettingsTime (s) Points/m2Number of Neighbours (Radius 5 cm)Roughness (Radius 5 cm)
MeanStandard DeviationMean (mm)
SiteScape151,081,156865821782.0
101,812,54113,82327074.2
152,552,87019,82042243.1
203,509,31327,46658722.0
SiteScape45130,03010412612.0
10234,64918283681.8
15337,61926315502.2
20427,99333567191.8
SiteScape6529,674234582.2
1049,377386881.9
1572,3955621172.1
2096,6417471623.0
EveryPoint15634,547502612423.4
101,022,065801918433.5
151,507,39511,79926773.6
201,968,49015,43034793.1
EveryPoint2512781142.5
1022641754.0
1530172364.5
2037332972.6
3D Scanner App1528,253213260.2
1028,483216290.2
1528,483216280.2
2028,449216280.2
3D Scanner App2518,618140170.2
1018,552140170.2
1518,782142180.2
2018,463139170.2
3D Scanner App3518,207137160.2
1018,157137170.2
1518,152136170.2
2018,011136170.2
Table A3. Characteristics of point clouds acquired in direct sun and in shadow with iPhone 12 Pro for different iOS apps settings.
Configuration Points/m2 Number of Neighbours
(Radius 5 cm)
Roughness (Radius 5 cm)
MeanStandard
Deviation
Mean (mm)
SiteScape1Sun3,447,34727,17563022.2
Shadow3,675,08128,94037901.7
SiteScape4Sun453,52935367342.0
Shadow476,30837909211.9
SiteScape6Sun73,5425721272.3
Shadow125,0309872301.7
EveryPoint1Sun2,065,09615,96433493.0
Shadow2,430,21518,25637975.8
EveryPoint2Sun48753582.7
Shadow564944102.7
3D Scanner App1Sun29,460223260.2
Shadow28,955220300.2
3D Scanner App2Sun18,838142170.2
Shadow18,611140170.2
3D Scanner App3Sun18,293138170.2
Shadow18,017136170.2
Table A4. Characteristics of point clouds acquired on different materials (a-h) with iPhone 12 Pro for different iOS apps settings.
MaterialConfigurationNumber of Points
in 1 m2
Number of Neighbours
(Radius 5 cm)
Roughness (Radius 5 cm)
MeanStandard DeviationMean (mm)
aSiteScape13,509,31327,46658722.0
SiteScape4427,99333567191.8
SiteScape696,6417471623.0
EveryPoint11,968,49015,43034793.1
EveryPoint237332972.6
3D Scanner App128,449216280.2
3D Scanner App218,463139170.2
3D Scanner App318,011136170.2
bSiteScape13,675,08128,94063831.7
SiteScape2476,30837909211.9
SiteScape3125,0309872301.7
EveryPoint12,430,21518,25637975.8
EveryPoint2564944102.7
3D Scanner App128,9552202200.2
3D Scanner App218,6111401400.2
3D Scanner App318,0171361360.2
cSiteScape13,321,98927,05569703.0
SiteScape2411,76734129263.0
SiteScape396,2357821963.2
EveryPoint12,273,29518,65748621.6
EveryPoint2435135101.7
3D Scanner App129,010219260.2
3D Scanner App219,313146190.3
3D Scanner App318,749142190.3
dSiteScape12,558,63420,16151052.9
SiteScape2352,09128488242.8
SiteScape388,0907112052.6
EveryPoint11,788,08214,81245292.7
EveryPoint2409635122.7
3D Scanner App130,579228291.5
3D Scanner App219,440144181.3
3D Scanner App318,709139171.0
eSiteScape13,239,81425,84964372.2
SiteScape2356,59728306752.2
SiteScape388,6646861392.7
EveryPoint11,716,41613,60932852.4
EveryPoint241473273.5
3D Scanner App132,765247290.2
3D Scanner App218,503139170.3
3D Scanner App318,366139170.2
fSiteScape12,928,95222,99452292.6
SiteScape2380,61429856542.0
SiteScape393,0307281562.0
EveryPoint11,702,89413,46730871.7
EveryPoint233272552.4
3D Scanner App132,015243310.2
3D Scanner App218,568140170.3
3D Scanner App318,293138170.3
gSiteScape12,433,47217,53445346.0
SiteScape2320,46823005836.1
SiteScape387,0216271656.0
EveryPoint11,690,78212,11831976.4
EveryPoint233472466.4
3D Scanner App136,976258334.5
3D Scanner App221,503152194.0
3D Scanner App320,245145183.3
hSiteScape12,586,16218,36653099.2
SiteScape2372,99329697091.8
SiteScape386,9846781412.0
EveryPoint11,799,28213,16536926.2
EveryPoint240423086.5
3D Scanner App131,709239290.2
3D Scanner App219,024143170.2
3D Scanner App318,167137170.2

References

  1. Remondino, F.; Stylianidis, E. (Eds.) 3D Recording, Documentation and Management of Cultural Heritage; Whittles Publishing: Caithness, UK, 2016. [Google Scholar]
  2. Letellier, R. RECORDIM: Guiding Principles & Illustrated Examples; The Getty Conservation Institute: Los Angeles, CA, USA, 2007. [Google Scholar]
  3. Tomaštík, J.; Saloň, Š.; Tunák, D.; Chudý, F.; Kardoš, M. Tango in forests—An initial experience of the use of the new Google technology in connection with forest inventory tasks. Comput. Electron. Agric. 2017, 141, 109–117. [Google Scholar] [CrossRef]
  4. Hyyppä, J.; Virtanen, J.P.; Jaakkola, A.; Yu, X.; Hyyppä, H.; Liang, X. Feasibility of Google Tango and kinect for crowdsourcing forestry information. Forests 2017, 9, 6. [Google Scholar] [CrossRef]
  5. Nguyen, K.A.; Luo, Z. On assessing the positioning accuracy of google tango in challenging indoor environments. In Proceedings of the 2017 International Conference on Indoor Positioning and Indoor Navigation, IPIN 2017, Sapporo, Japan, 18–21 September 2017; Volume 2017, pp. 1–8. [Google Scholar] [CrossRef]
  6. Marques, B.; Carvalho, R.; Dias, P.; Oliveira, M.; Ferreira, C.; Santos, B.S. Evaluating and enhancing google tango localization in indoor environments using fiducial markers. In Proceedings of the 18th IEEE International Conference on Autonomous Robot Systems and Competitions, ICARSC 2018, Torres Vedras, Portugal, 25–27 April 2018; pp. 142–147. [Google Scholar] [CrossRef]
  7. Diakité, A.A.; Zlatanova, S. First experiments with the tango tablet for indoor scanning. ISPRS Ann. Photogramm. Remote Sens. Spatial Inf. Sci. 2016, III–4, 67–72. [Google Scholar] [CrossRef]
  8. Froehlich, M.; Azhar, S.; Vanture, M. An Investigation of Google Tango ® Tablet for Low Cost 3D Scanning. 2017. Available online: https://www.iaarc.org/publications/2017_proceedings_of_the_34rd_isarc/an_investigation_of_google_tango_tablet_for_low_cost_3d_scanning.html (accessed on 5 November 2021).
  9. Smisek, J.; Jancosek, M.; Pajdla, T. 3D with Kinect. In Consumer Depth Cameras for Computer Vision; Springer: London, UK, 2013; pp. 3–25. [Google Scholar] [CrossRef]
  10. Khoshelham, K. Accuracy Analysis of Kinect Depth Data. Int. Arch. Photogramm. Remote Sens. Spatial Inf. Sci. 2012, XXXVIII-5/W12, 133–138. [Google Scholar] [CrossRef]
  11. Han, J.; Shao, L.; Xu, D.; Shotton, J. Enhanced computer vision with Microsoft Kinect sensor: A review. IEEE Trans. Cybern. 2013, 43, 1318–1334. [Google Scholar] [CrossRef]
  12. El-Laithy, R.A.; Huang, J.; Yeh, M. Study on the use of Microsoft Kinect for robotics applications. In Proceedings of the 2012 IEEE/ION Position, Location and Navigation Symposium, Myrtle Beach, SC, USA, 23–26 April 2012; pp. 1280–1288. [Google Scholar] [CrossRef]
  13. Fankhauser, P.; Bloesch, M.; Rodriguez, D.; Kaestner, R.; Hutter, M.; Siegwart, R. Kinect v2 for mobile robot navigation: Evaluation and modeling. In Proceedings of the 17th International Conference on Advanced Robotics, ICAR 2015, Istanbul, Turkey, 27–31 July 2015; pp. 388–394. [Google Scholar] [CrossRef] [Green Version]
  14. Mankoff, K.D.; Russo, T.A. The Kinect: A low-cost, high-resolution, short-range 3D camera. Earth Surf. Processes Landf. 2013, 38, 926–936. [Google Scholar] [CrossRef]
  15. Lachat, E.; Macher, H.; Landes, T.; Grussenmeyer, P. Assessment and calibration of a RGB-D camera (Kinect v2 Sensor) towards a potential use for close-range 3D modeling. Remote Sens. 2015, 7, 13070–13097. [Google Scholar] [CrossRef]
  16. Kersten, T.P.; Omelanowsky, D.; Lindstaedt, M. Investigations of low-cost systems for 3D reconstruction of small objects. In Lect. Notes Comput. Sci. 2016, 10058 LNCS, 521–532. [Google Scholar] [CrossRef]
  17. Trotta, G.F.; Mazzola, S.; Gelardi, G.; Brunetti, A.; Marino, N.; Bevilacqua, V. Reconstruction, Optimization and Quality Check of Microsoft HoloLens-Acquired 3D Point Clouds. In Smart Innovation, Systems and Technologies; Springer: Singapore, 2020; Volume 151, pp. 83–93. [Google Scholar] [CrossRef]
  18. Weinmann, M.; Jäger, M.A.; Wursthorn, S.; Jutzi, B.; Weinmann, M.; Hübner, P. 3D Indoor Mapping with the Microsoft Hololens: Qualitative and Quantitative Evaluation by Means of Geometric Features. ISPRS Ann. Photogramm. Remote Sens. Spatial Inf. Sci. 2020, 5, 165–172. [Google Scholar] [CrossRef]
  19. Weinmann, M.; Wursthorn, S.; Weinmann, M.; Hübner, P. Efficient 3D Mapping and Modelling of Indoor Scenes with the Microsoft HoloLens: A Survey. PFG—J. Photogramm. Remote Sens. Geoinf. Sci. 2021, 89, 319–333. [Google Scholar] [CrossRef]
  20. Lichti, D.D.; Kim, C. A Comparison of Three Geometric Self-Calibration Methods for Range Cameras. Remote Sens. 2011, 3, 1014–1028. [Google Scholar] [CrossRef]
  21. Chiabrando, F.; Chiabrando, R.; Piatti, D.; Rinaudo, F. Sensors for 3D Imaging: Metric Evaluation and Calibration of a CCD/CMOS Time-of-Flight Camera. Sensors 2009, 9, 10080–10096. [Google Scholar] [CrossRef]
  22. Guidi, G.; Bianchini, C. TOF laser scanner characterization for low-range applications. Videometrics IX 2007, 6491, 649109. [Google Scholar] [CrossRef]
  23. Scherer, M. The 3d-tof-camera as an innovative and low-cost tool for recording, surveying and visualisation-a short draft and some first experiences. In Proceedings of the CIPA Symposium, Kyoto, Japan, 11–15 October 2009. [Google Scholar]
  24. Jang, C.H.; Kim, C.S.; Jo, K.C.; Sunwoo, M. Design factor optimization of 3D flash lidar sensor based on geometrical model for automated vehicle and advanced driver assistance system applications. Int. J. Automot. Technol. 2016, 18, 147–156. [Google Scholar] [CrossRef]
  25. Nocerino, E.; Lago, F.; Morabito, D.; Remondino, F.; Porzi, L.; Poiesi, F.; Rota Bulò, S.; Chippendale, P.; Locher, A.; Havlena, M.; et al. A smartphone-based 3D pipeline for the creative industry—The replicate eu project. Int. Arch. Photogramm. Remote Sens. Spatial Inf. Sci.—ISPRS Arch. 2017, 42, 535–541. [Google Scholar] [CrossRef]
  26. Vogt, M.; Rips, A.; Emmelmann, C. Comparison of iPad Pro®’s LiDAR and TrueDepth Capabilities with an Industrial 3D Scanning Solution. Technologies 2021, 9, 25. [Google Scholar] [CrossRef]
  27. Murtiyoso, A.; Grussenmeyer, P.; Landes, T.; Macher, H. First assessments into the use of commercial-grade solid state lidar for low cost heritage documentation. Int. Arch. Photogramm. Remote Sens. Spatial Inf. Sci. 2021, XLIII-B2-2, 599–604. [Google Scholar] [CrossRef]
  28. Gollob, C.; Ritter, T.; Kraßnitzer, R.; Tockner, A.; Nothdurft, A. Measurement of Forest Inventory Parameters with Apple iPad Pro and Integrated LiDAR Technology. Remote Sens. 2021, 13, 3129. [Google Scholar] [CrossRef]
  29. Luetzenburg, G.; Kroon, A.; Bjørk, A.A. Evaluation of the Apple iPhone 12 Pro LiDAR for an Application in Geosciences. Sci. Rep. 2021, 11, 22221. [Google Scholar] [CrossRef]
  30. Spreafico, A.; Chiabrando, F.; Losè, L.T.; Tonolo, F.G. The ipad pro built-in lidar sensor: 3d rapid mapping tests and quality assessment. Int. Arch. Photogramm. Remote Sens. Spatial Inf. Sci. 2021, XLIII-B1-2021, 63–69. [Google Scholar] [CrossRef]
  31. King, F.; Kelly, R.; Fletcher, C.G. Evaluation of LiDAR-Derived Snow Depth Estimates From the iPhone 12 Pro. IEEE Geosci. Remote Sens. Lett. 2022, 19, 7003905. [Google Scholar] [CrossRef]
  32. Tavani, S.; Billi, A.; Corradetti, A.; Mercuri, M.; Bosman, A.; Cuffaro, M.; Seers, T.; Carminati, E. Smartphone assisted fieldwork: Towards the digital transition of geoscience fieldwork using LiDAR-equipped iPhones. Earth-Sci. Rev. 2022, 227, 103969. [Google Scholar] [CrossRef]
  33. Díaz-Vilariño, L.; Tran, H.; Frías, E.; Balado, J.; Khoshelham, K. 3D mapping of indoor and outdoor environments using apple smart devices. Int. Arch. Photogramm. Remote Sens. Spatial Inf. Sci. 2022, XLIII-B4-2022, 303–308. [Google Scholar] [CrossRef]
  34. Balado, J.; Frías, E.; González-Collazo, S.M.; Díaz-Vilariño, L. New Trends in Laser Scanning for Cultural Heritage. New Technol. Build. Constr.; Springer: Singapore, 2022; Volume 258, pp. 167–186. [Google Scholar] [CrossRef]
  35. Mikalai, Z.; Andrey, D.; Hawas, H.S.; Tetiana, H.; Oleksandr, S. Human body measurement with the iPhone 12 Pro LiDAR scanner. AIP Conf. Proc. 2022, 2430, 090009. [Google Scholar] [CrossRef]
  36. iPad Pro 12.9-Inch (4th Generation)—Technical Specifications. Available online: https://support.apple.com/kb/SP815?viewlocale=en_US&locale=it_IT (accessed on 28 January 2022).
  37. iPhone 12 Pro—Technical Specifications. Available online: https://support.apple.com/kb/SP831?viewlocale=en_US&locale=it_IT (accessed on 28 January 2022).
  38. García-Gómez, P.; Royo, S.; Rodrigo, N.; Casas, J.R. Geometric model and calibration method for a solid-state LiDAR. Sensors 2020, 20, 2898. [Google Scholar] [CrossRef]
  39. Wang, D.; Watkins, C.; Xie, H. MEMS mirrors for LiDAR: A review. Micromachines 2020, 11, 456. [Google Scholar] [CrossRef]
  40. Aijazi, A.K.; Malaterre, L.; Trassoudaine, L.; Checchin, P. Systematic evaluation and characterization of 3d solid state lidar sensors for autonomous ground vehicles. Int. Arch. Photogramm. Remote Sens. Spatial Inf. Sci. 2020, XLIII-B1-2020, 199–203. [Google Scholar] [CrossRef]
  41. Tontini, A.; Gasparini, L.; Perenzoni, M. Numerical model of spad-based direct time-of-flight flash lidar CMOS image sensors. Sensors 2020, 20, 5203. [Google Scholar] [CrossRef]
  42. Apple LIDAR Demystified: SPAD, VCSEL, and Fusion. Available online: https://4da.tech/?p=582 (accessed on 28 January 2022).
  43. Apple Unveils New iPad Pro with Breakthrough LiDAR Scanner and Brings Trackpad Support to iPadOS. Available online: https://www.apple.com/newsroom/2020/03/apple-unveils-new-ipad-pro-with-lidar-scanner-and-trackpad-support-in-ipados/ (accessed on 28 January 2022).
  44. Visualizing and Interacting with a Reconstructed Scene. Available online: https://developer.apple.com/documentation/arkit/content_anchors/visualizing_and_interacting_with_a_reconstructed_scene (accessed on 28 January 2022).
  45. SiteScape. Available online: www.sitescape.ai (accessed on 28 January 2022).
  46. EveryPoint. Available online: https://everypoint.io/ (accessed on 28 January 2022).
  47. 3D Scanner App. Available online: https://3dscannerapp.com/ (accessed on 28 January 2022).
  48. SiteScape Users Guide. Available online: https://support.sitescape.ai/hc/en-us/articles/4419890619284-User-Guide (accessed on 31 January 2022).
  49. 3D Scanner App Users Guide. Available online: https://docs.3dscannerapp.com/howtos/how-to-scan (accessed on 31 January 2022).
  50. Dotproduct. Available online: https://www.dotproduct3d.com/ (accessed on 31 January 2022).
Figure 1. Graphical user interfaces of the selected applications and an example of the available settings: (a) SiteScape; (b) EveryPoint; and (c) 3D Scanner App.
Remotesensing 14 04157 g001
Figure 2. Samples of the tested materials: (a) white plaster, (b) pink plaster, (c) concrete, (d) raw wood, (e) polished stone, (f) brick, (g) river stone, and (h) black opaque metal.
Remotesensing 14 04157 g002
Figure 3. The three different case studies: (a) statue, (b) decorated room, and (c) external façade.
Remotesensing 14 04157 g003
Figure 4. The iPhone 12 Pro emitted a matrix of points composed of 9 sectors of 8 × 8 points, captured with a NIR camera.
Remotesensing 14 04157 g004
Figure 5. Number of points acquired with iPhone 12 Pro (red) and iPad Pro (green), according to the resolution set in the SiteScape app.
Remotesensing 14 04157 g005
Figure 6. Density chart showing the number of points in 1 m2 acquired with iPhone 12 Pro on the same portion for different iOS apps settings versus time (5, 10, 15, or 20 s).
Remotesensing 14 04157 g006
Figure 7. Density chart showing the number of points in 1 m2 acquired in direct sun and shadow with iPhone 12 Pro for different iOS app settings.
Remotesensing 14 04157 g007
Figure 8. Point clouds derived from the different acquisitions performed on Case Study A.
Remotesensing 14 04157 g008
Figure 9. C2C analysis for Case Study A (TLS used as reference).
Remotesensing 14 04157 g009
Figure 10. The different 3D distances analysed for Case Study A.
Remotesensing 14 04157 g010
Figure 11. Point clouds derived from the different acquisitions performed on Case Study B. 3D Scanner App failed to deliver a complete point cloud.
Remotesensing 14 04157 g011
Figure 12. C2C analysis for Case Study B (TLS used as reference).
Remotesensing 14 04157 g012
Figure 13. 2D horizontal sections derived from the three point clouds acquired for Case Study B: Section plane position (c), sections derived by the different point clouds (a), and detailed view of the displacements (b).
Remotesensing 14 04157 g013
Figure 14. 2D vertical sections derived from the three point clouds acquired for Case Study B: Section plane position (c), overview of the different sections (a), and detailed view of the displacements (b).
Remotesensing 14 04157 g014
Figure 15. Point clouds derived from the different acquisitions performed on Case Study C.
Remotesensing 14 04157 g015
Figure 16. C2C analysis for Case Study C. TLS data set used as reference.
Remotesensing 14 04157 g016
Figure 17. The different distances analysed for data set C.
Remotesensing 14 04157 g017
Table 1. iOS app settings tested in the research.
ID_APPParameters
SiteScape1max detail, high resolution
SiteScape2max detail, medium resolution
SiteScape3max detail, low resolution
SiteScape4max area, high resolution
SiteScape5max area, medium resolution
SiteScape6max area, low resolution
EveryPoint1ARKit points, maximum density, smoothed depth map option disabled
EveryPoint2ARKit points, minimum density, smoothed depth map option disabled
3DScannerApp120 mm high resolution, high confidence, masking disabled
3DScannerApp25 mm high resolution, high confidence, masking disabled
3DScannerApp3low resolution
Table 2. Faro Focus3D X330 main technical specifications.
RangeMeasurement SpeedRanging ErrorField of View
(Vertical/Horizontal)
Faro Focus3D X3300.6–330 m~976,000 points/second±2 mm300°/360°
Table 3. Horizontal/vertical distances between two consecutive points acquired by iPad Pro (already published in Spreafico et al. [30]), according to the settings and distance from the object.
Distance From the Object (m)
1234
iOS App Settings Point Distances (cm)
SiteScape1iPad Pro0.91.92.63.3
iPhone 12 Pro1.01.92.83.8
Difference0.10.00.20.5
SiteScape2iPad Pro1.32.63.54.6
iPhone 12 Pro1.42.74.05.4
Difference0.10.10.50.8
SiteScape3iPad Pro1.83.64.96.6
iPhone 12 Pro2.03.85.67.6
Difference0.20.20.71.0
SiteScape4iPad Pro2.64.97.59.6
iPhone 12 Pro2.85.37.910.7
Difference0.20.40.41.1
SiteScape5iPad Pro3.77.110.113.8
iPhone 12 Pro4.07.611.215.2
Difference0.30.51.11.4
Sitescape6iPad Pro5.29.914.319.1
iPhone 12 Pro5.610.715.821.4
Difference0.40.81.52.3
Table 4. Point density analysis for Case Study A.
DatasetN° of Points
TLS593,780
SiteScape 1,303,614
3D Scanner App266,474
EveryPoint282,756
Table 5. C2C analyses on Case Study A. For each data set, values are reported as percentages in a selection of ranges.
C2C<−0.04(−0.04)–(−0.02)(−0.2)–00–0.020.02–0.04>0.04
TLS/SiteScape (b)0%0%0%81.9%15.1%3%
TLS/EveryPoint (d)0%0%0%50.7%15.9%33.4%
TLS/3D Scanner App (c)1.4%7.8%32.4%36%15.1%7.3%
Table 6. 3D distances for Case Study A. The TLS data set was used as reference for assessing the accuracy of the other data sets.
DistanceTLS (m)SiteScape (m) 1EveryPoint (m) 13D Scanner App (m) 1
D11.1971.196 (−0.001)1.197 (0)1.199 (+0.002)
D22.1092.085 (−0.024)2.021 (−0.088)2.180 (+0.071)
D31.1281.118 (−0.010)1.093 (−0.035)1.146 (+0.018)
D42.4292.423 (−0.006)2.306 (−0.123)2.519 (+0.090)
D50.4580.456 (−0.002)0.449 (0.009)0.456 (−0.002)
1 Residuals from TLS in brackets.
Table 7. Density analysis for Case Study B.
Point CloudPoint Number
TLS20,534,000
SiteScape 8,641,919
3D Scanner App
EveryPoint1,806,988
Table 8. C2C analysis for Case Study B. For each data set, values are reported as percentages in a selection of ranges.
C2C<−0.04(−0.04)–(−0.02)(−0.2)–00–0.020.02–0.04>0.04
TLS/SiteScape 0%0%0%39.5%34.3 %26.2%
TLS/EveryPoint 0%0%0%44.9%24.8%30.3%
Table 9. Density analyses for Case Study C.
Point CloudPoint Number
(a)TLS 6,925,000
(b)SiteScape 3,634,000
(c)3D Scanner App 1,780,000
(d)EveryPoint 714,000
Table 10. C2C analyses on Case Study A. For each dataset values are reported as percentages in a selection of ranges.
C2C<−0.04(−0.04)–(−0.02)(−0.2)–00–0.020.02–0.04>0.04
TLS/SiteScape 0%0%0%22.7%21.6%55.7%
TLS/EveryPoint 0%0%0%25.1%21.5%53.4%
TLS/3D Scanner App 16%17.5%15.1%14.5%17.7%19.2%
Table 11. 3D distances for data set C. The TLS data set was used as a reference for assessing the accuracy of the other data sets.
DistanceTLS (m)SiteScape (m) 1EveryPoint (m) 13D Scanner App (m) 1
D118.30417.935 (0.369)17.215 (1.089)17.825 (0.749)
D23.0122.931 (0.081)2.782 (0.23)2.946 (0.066)
D36.1216.109 (0.012)5.933 (0.188)6.083 (0.038)
1 TLS residuals in brackets.
Publisher’s Note: MDPI stays neutral with regard to jurisdictional claims in published maps and institutional affiliations.

