
Mapping Multi-Decadal Mangrove Extent in the Northern Coast of Vietnam Using Landsat Time-Series Data on Google Earth Engine Platform

 , ,
, ,  , and
, and
Abstract
:1. Introduction
2. Materials and Methods
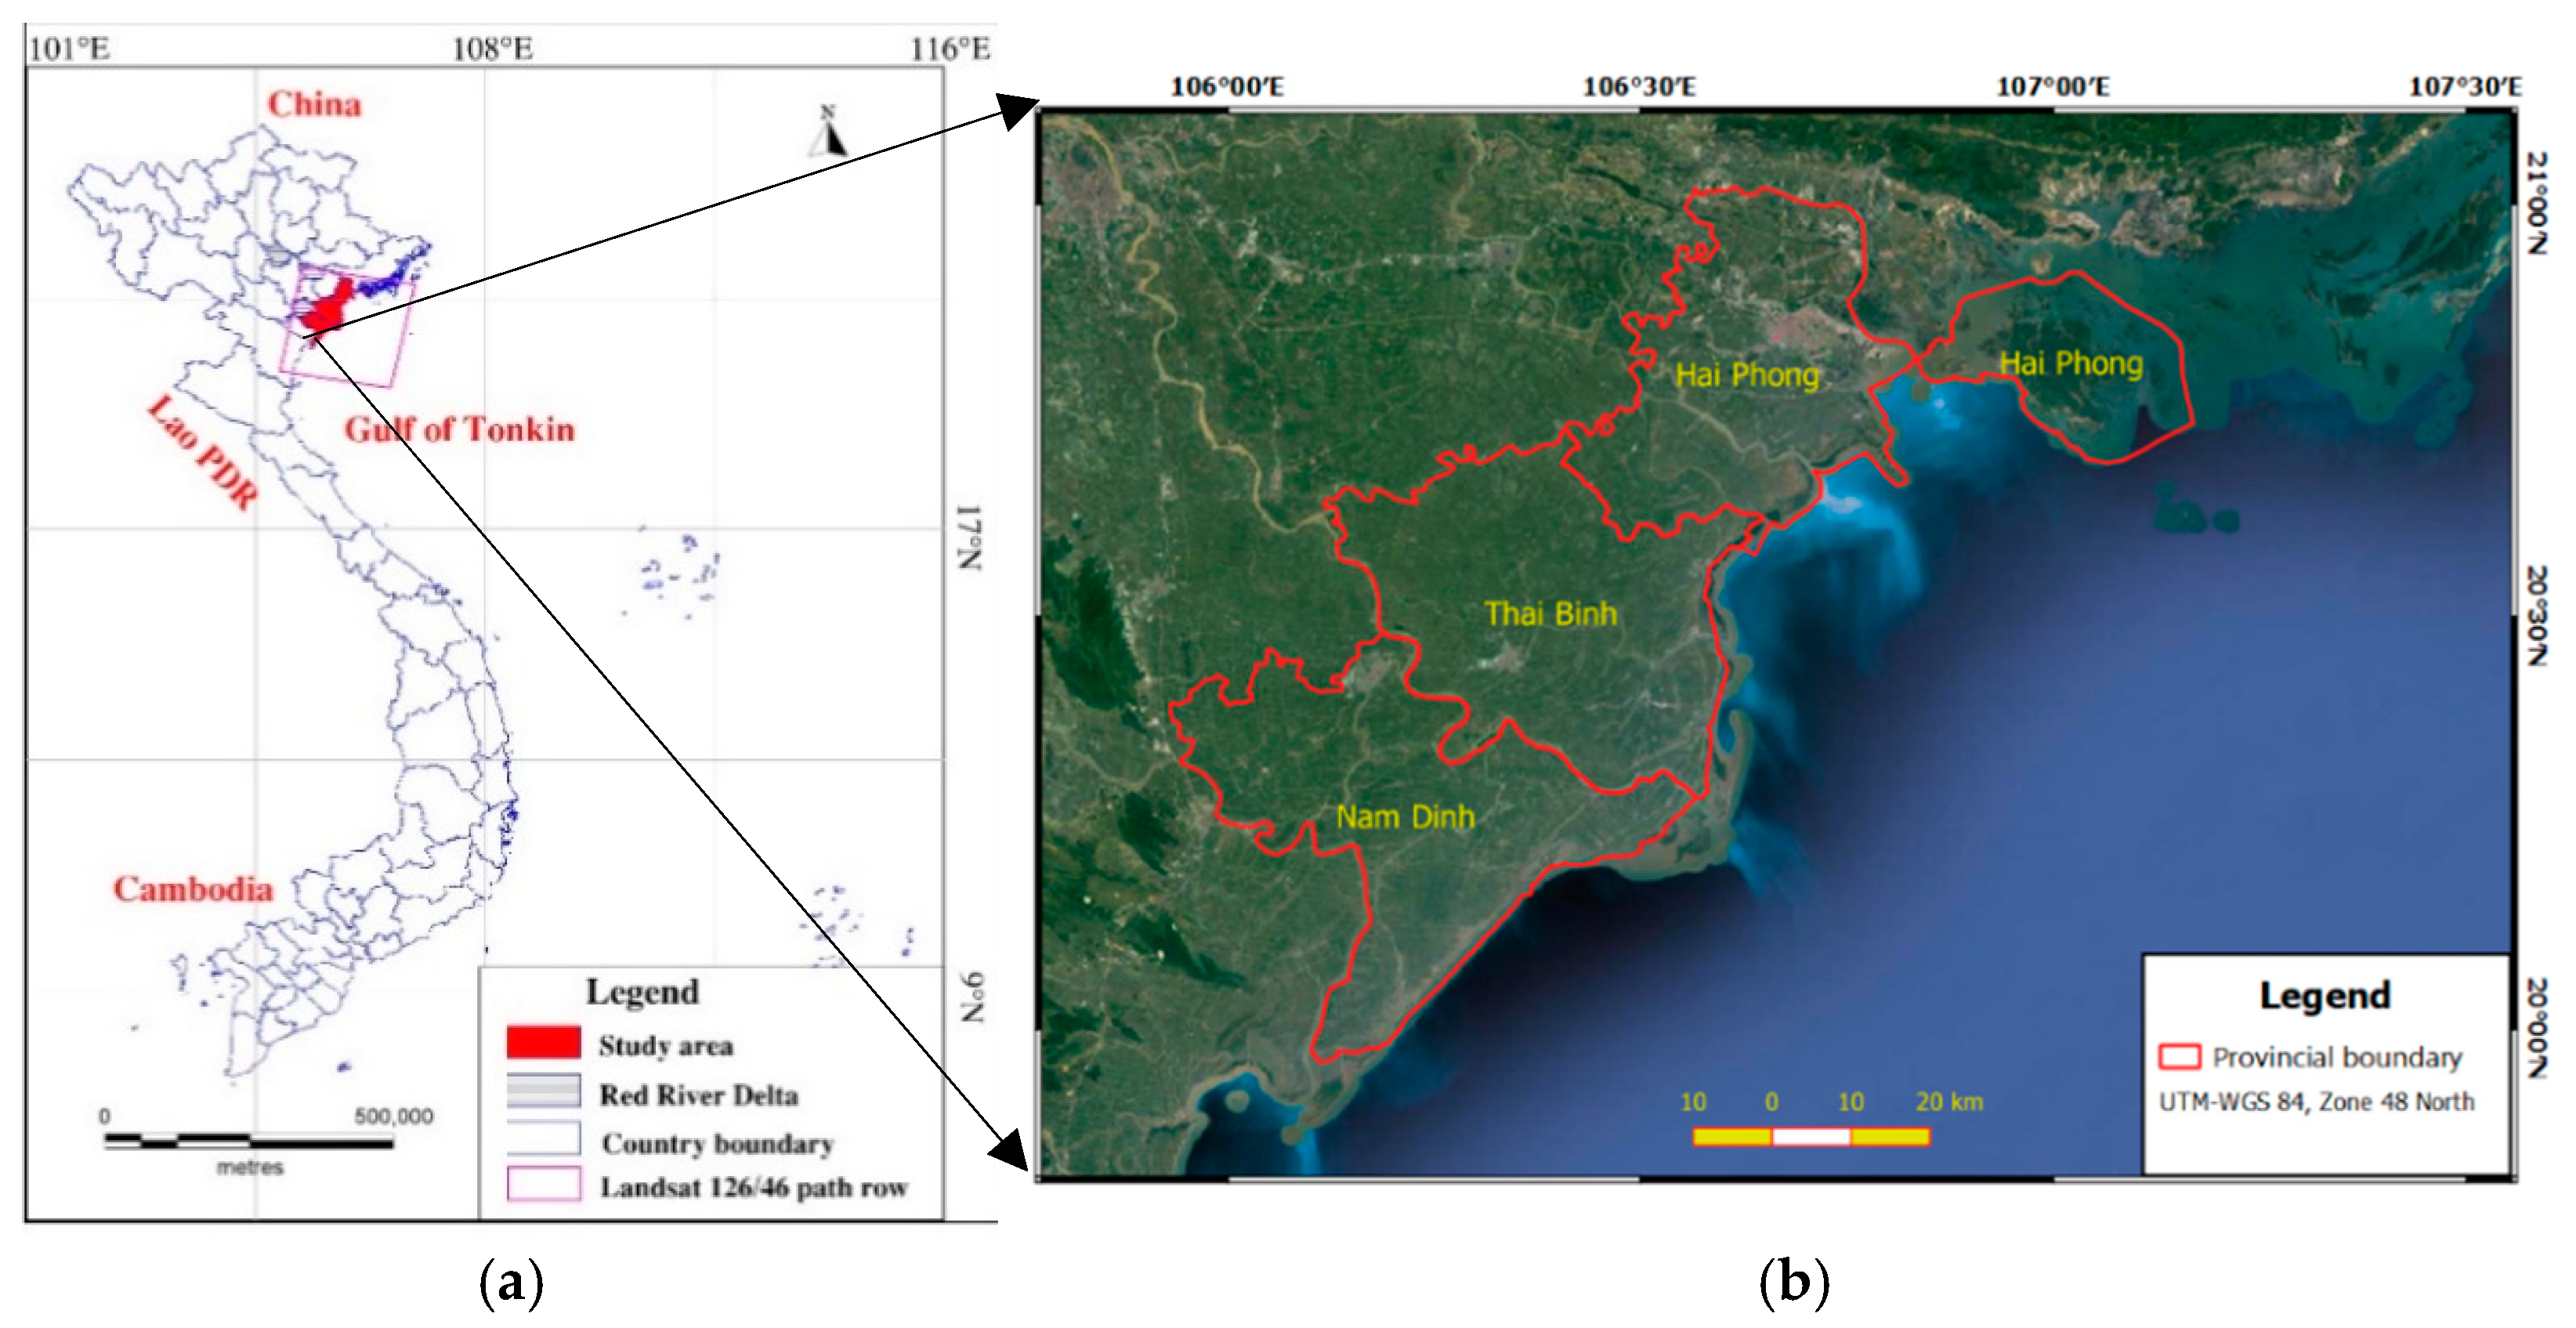
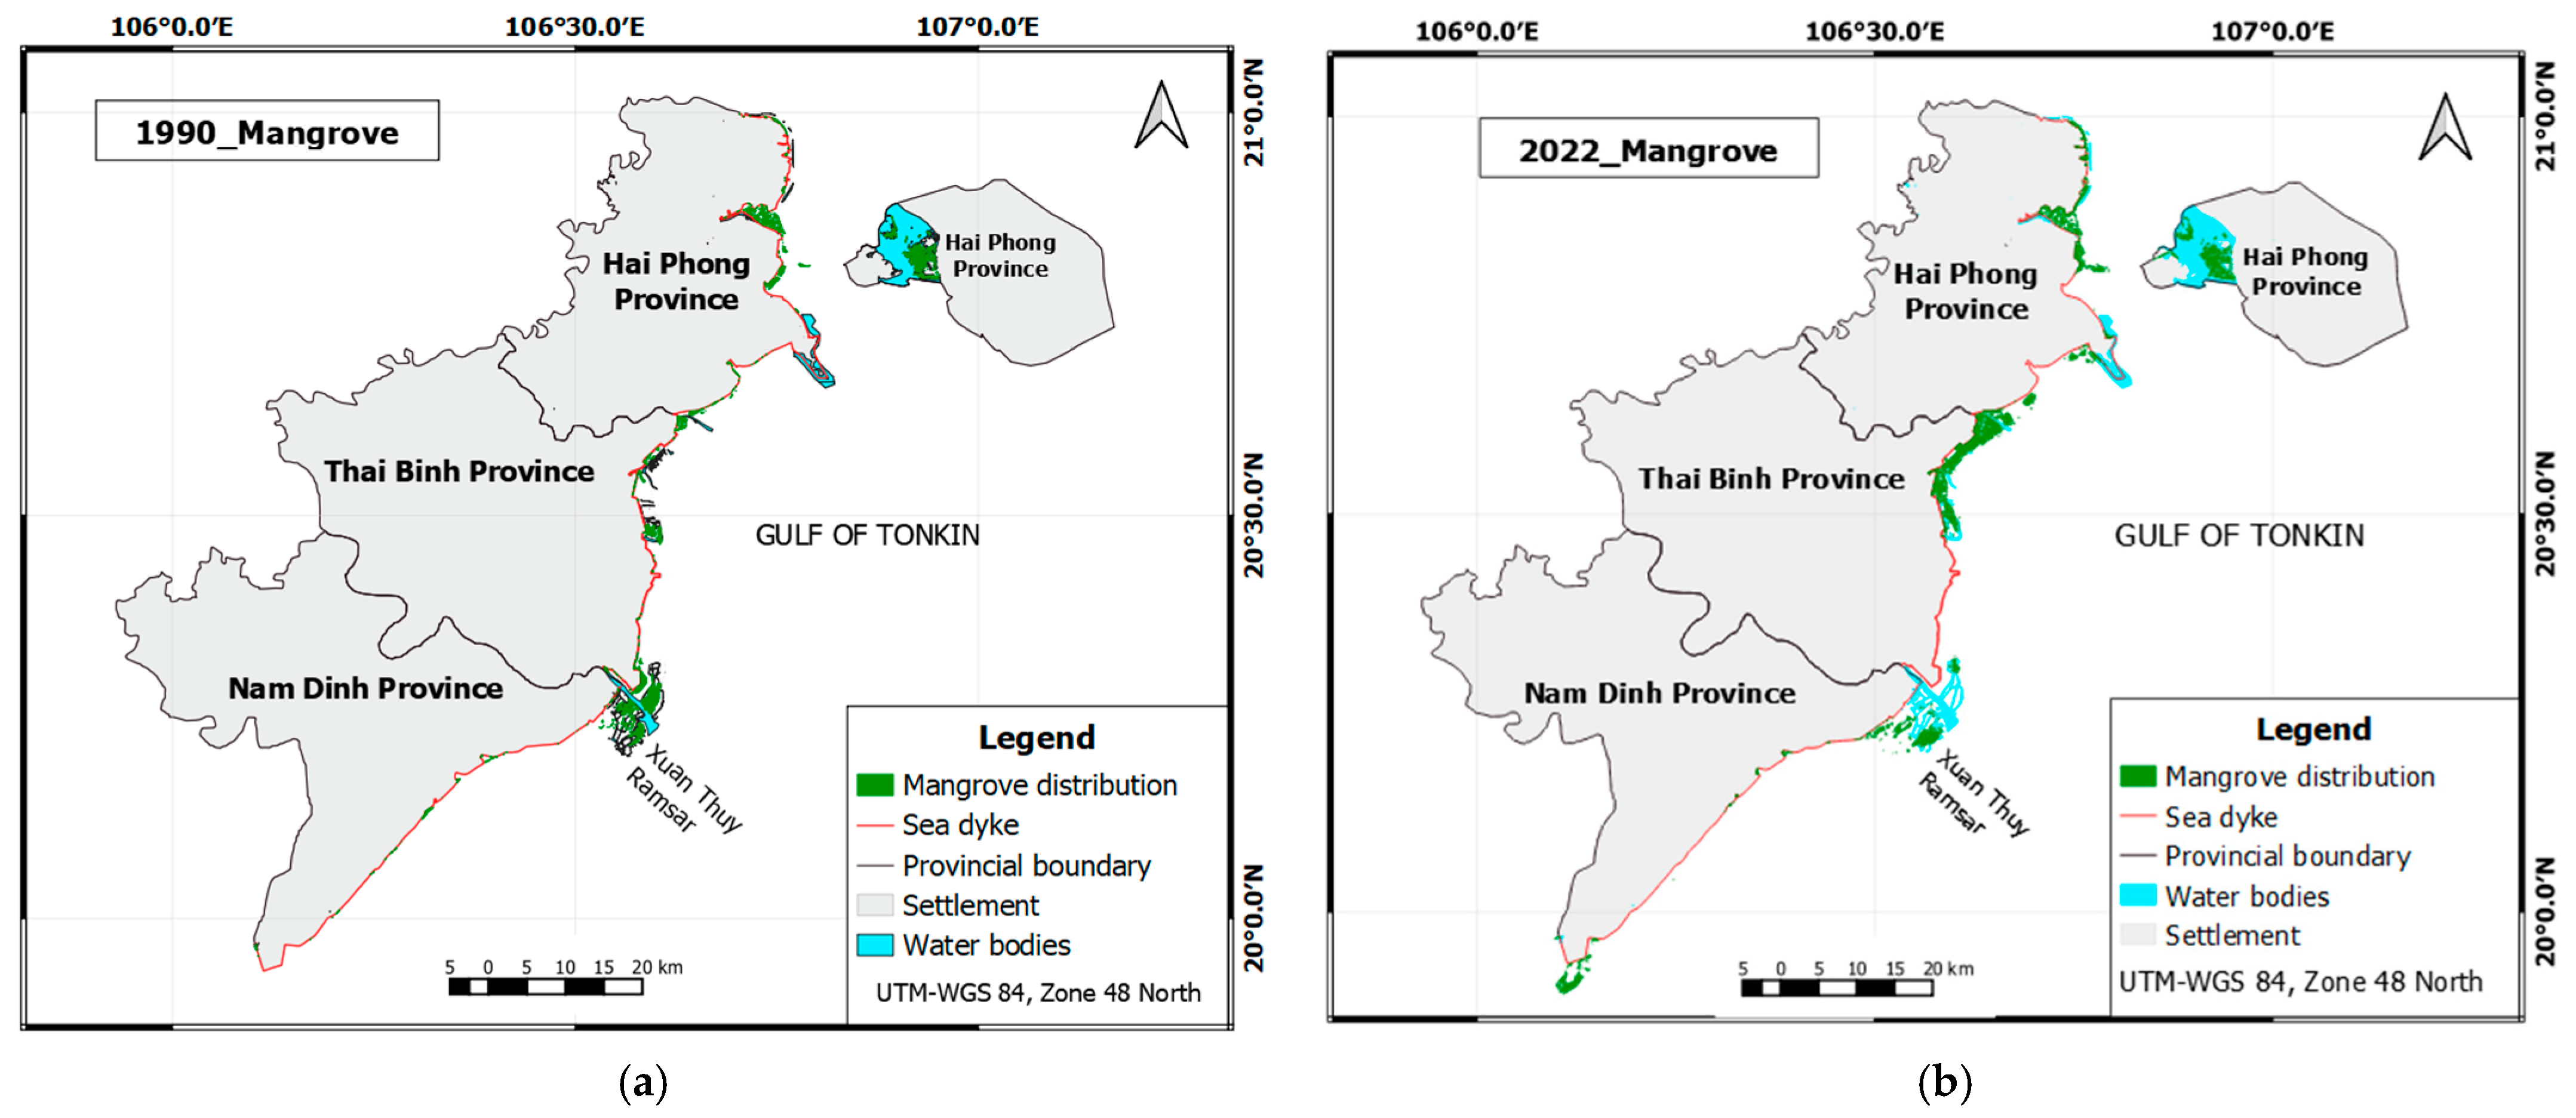
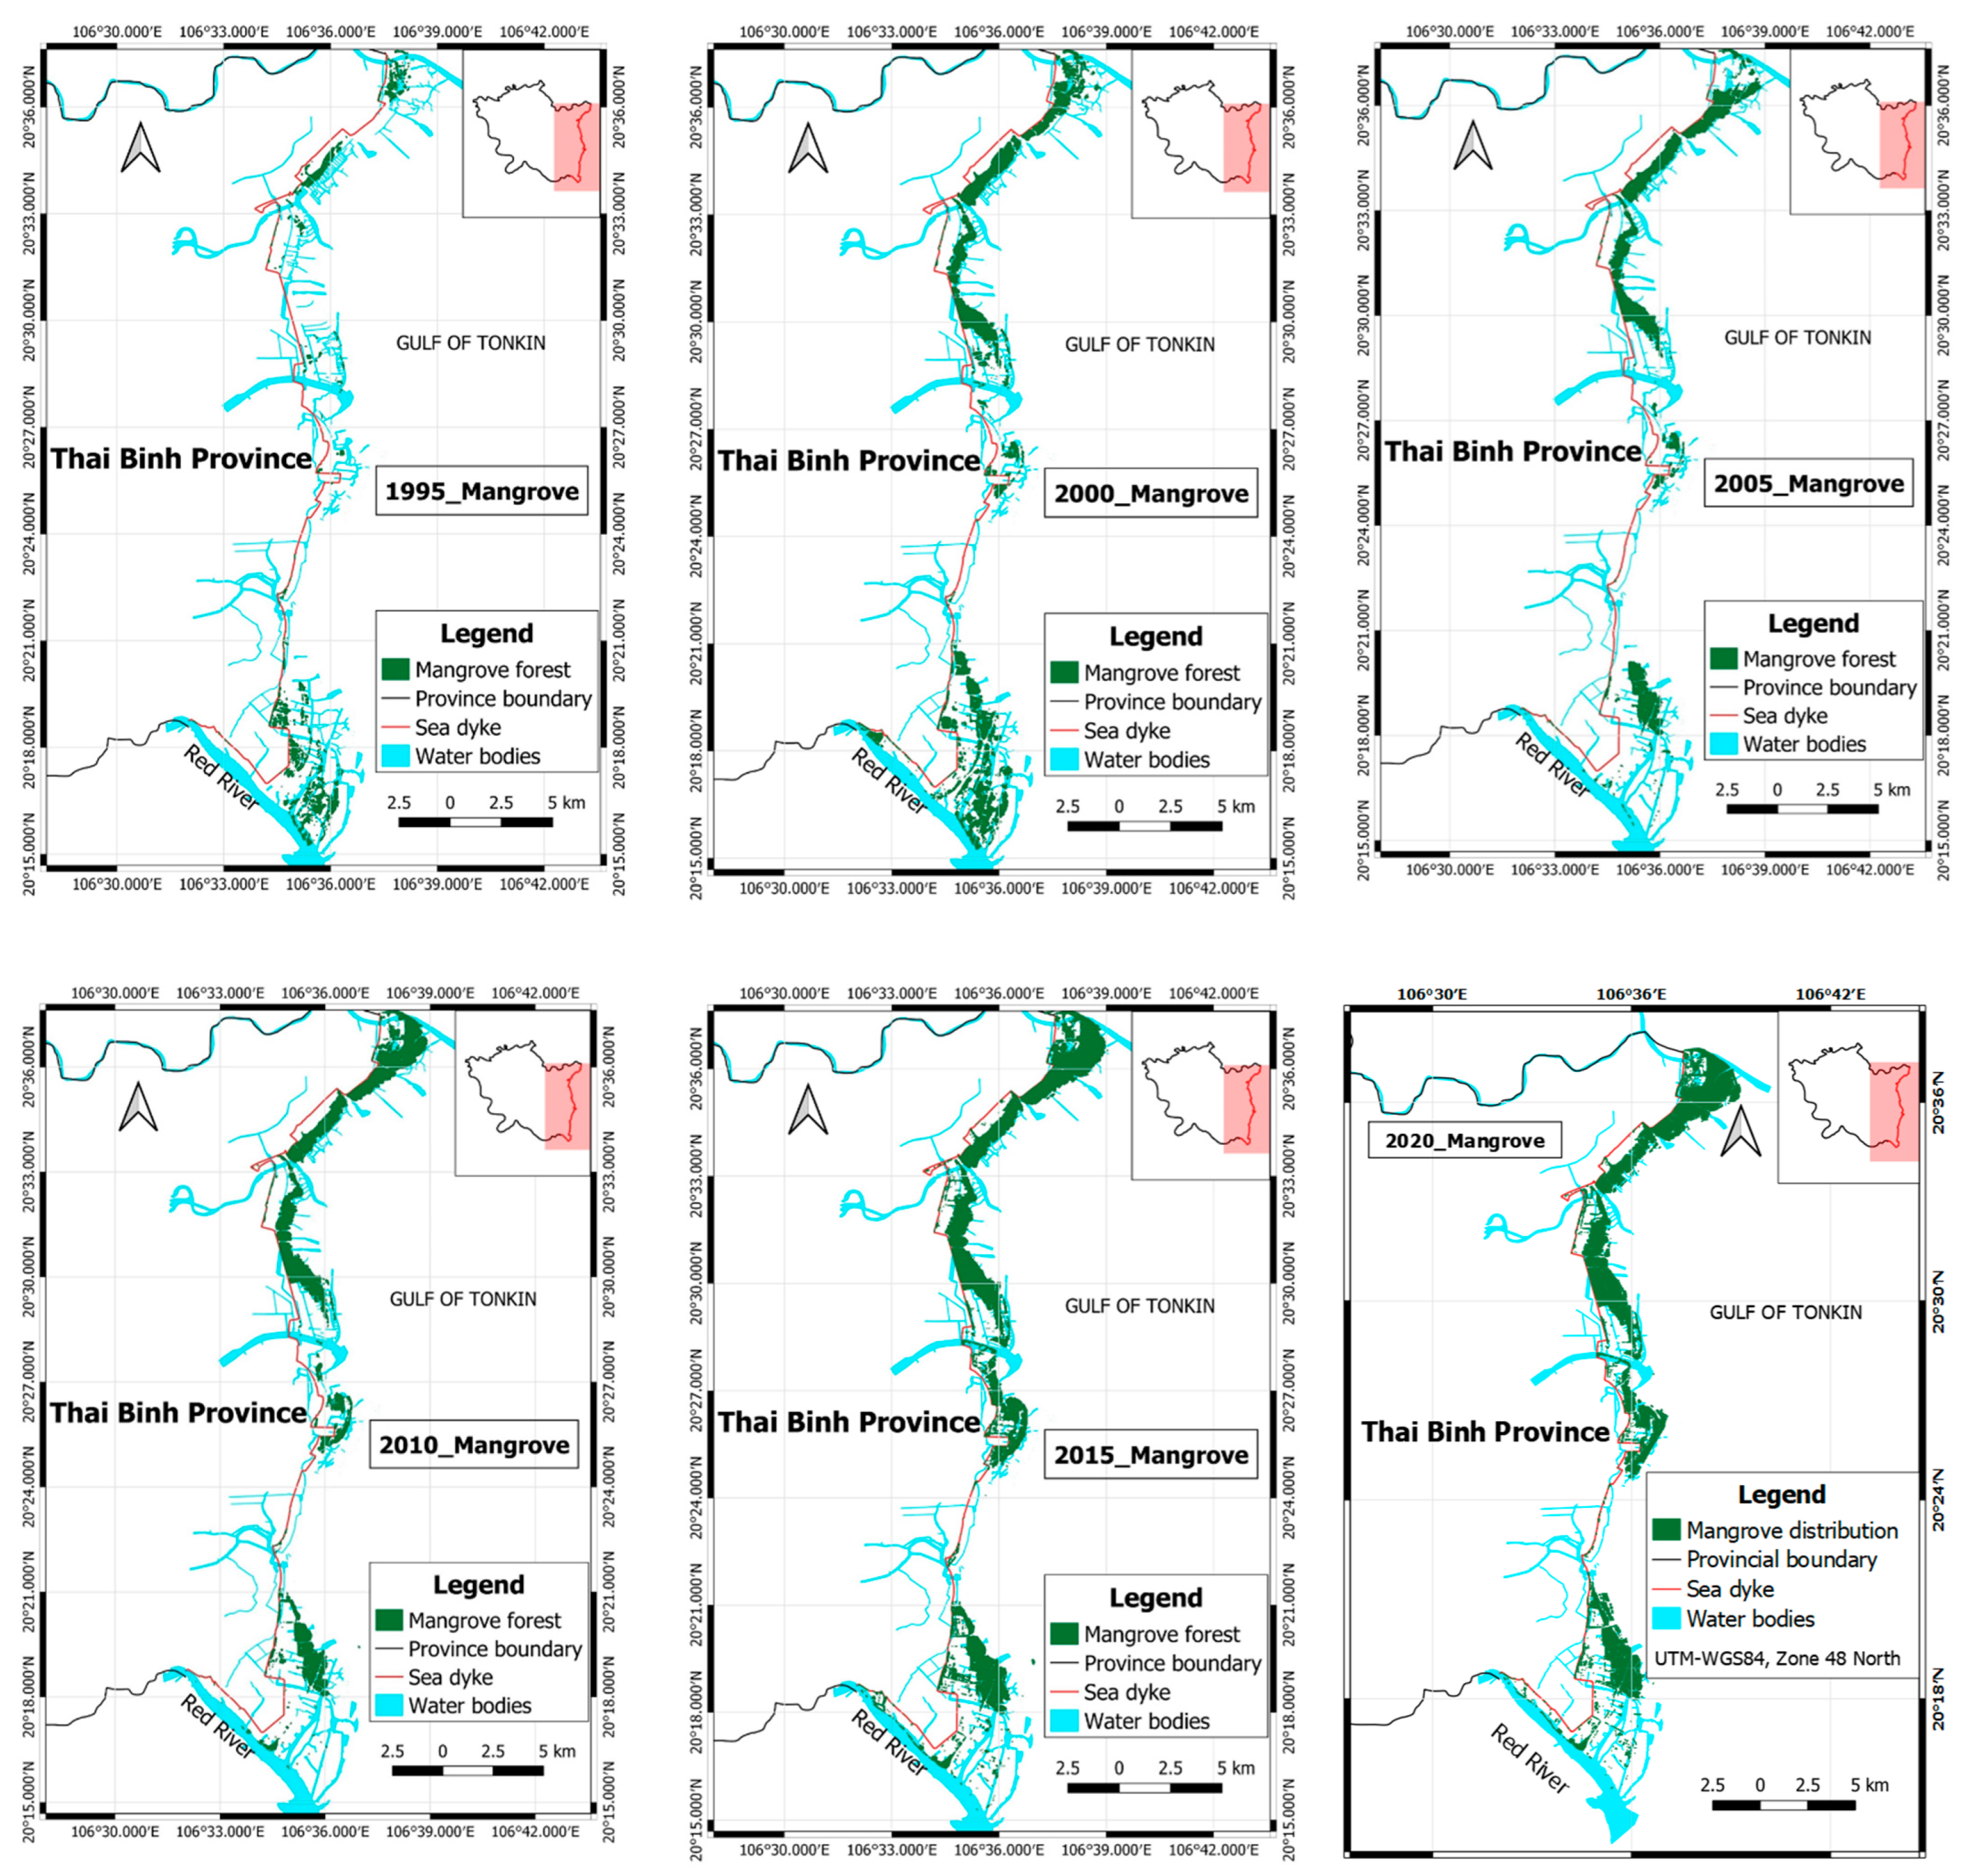
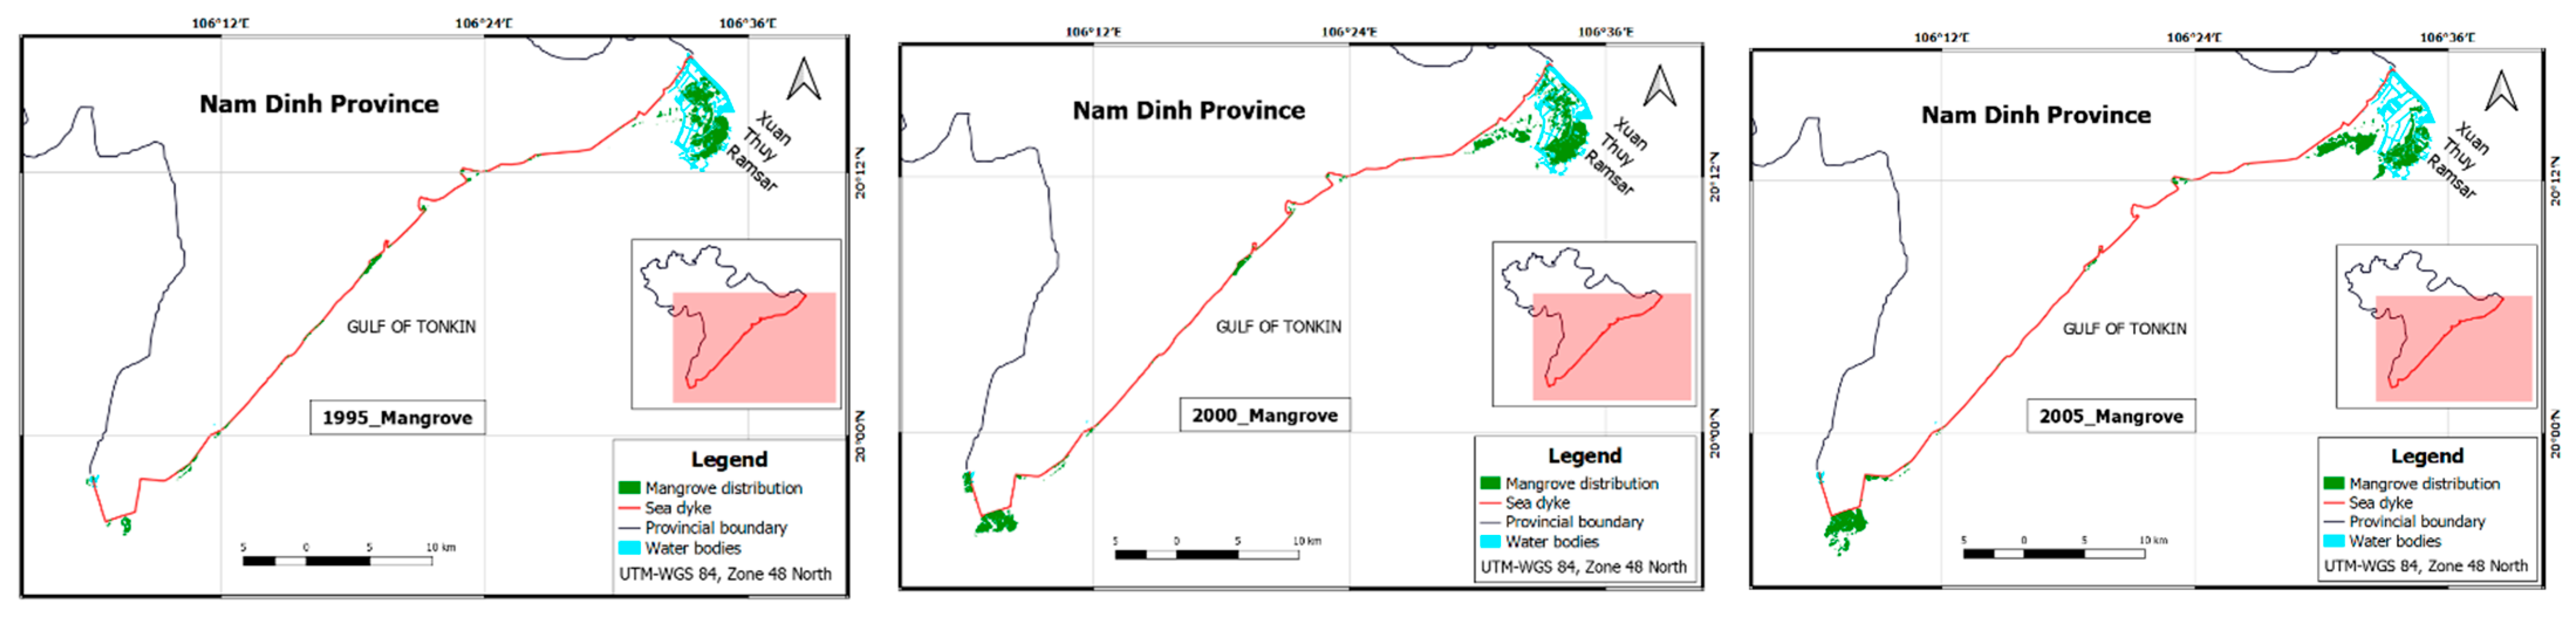
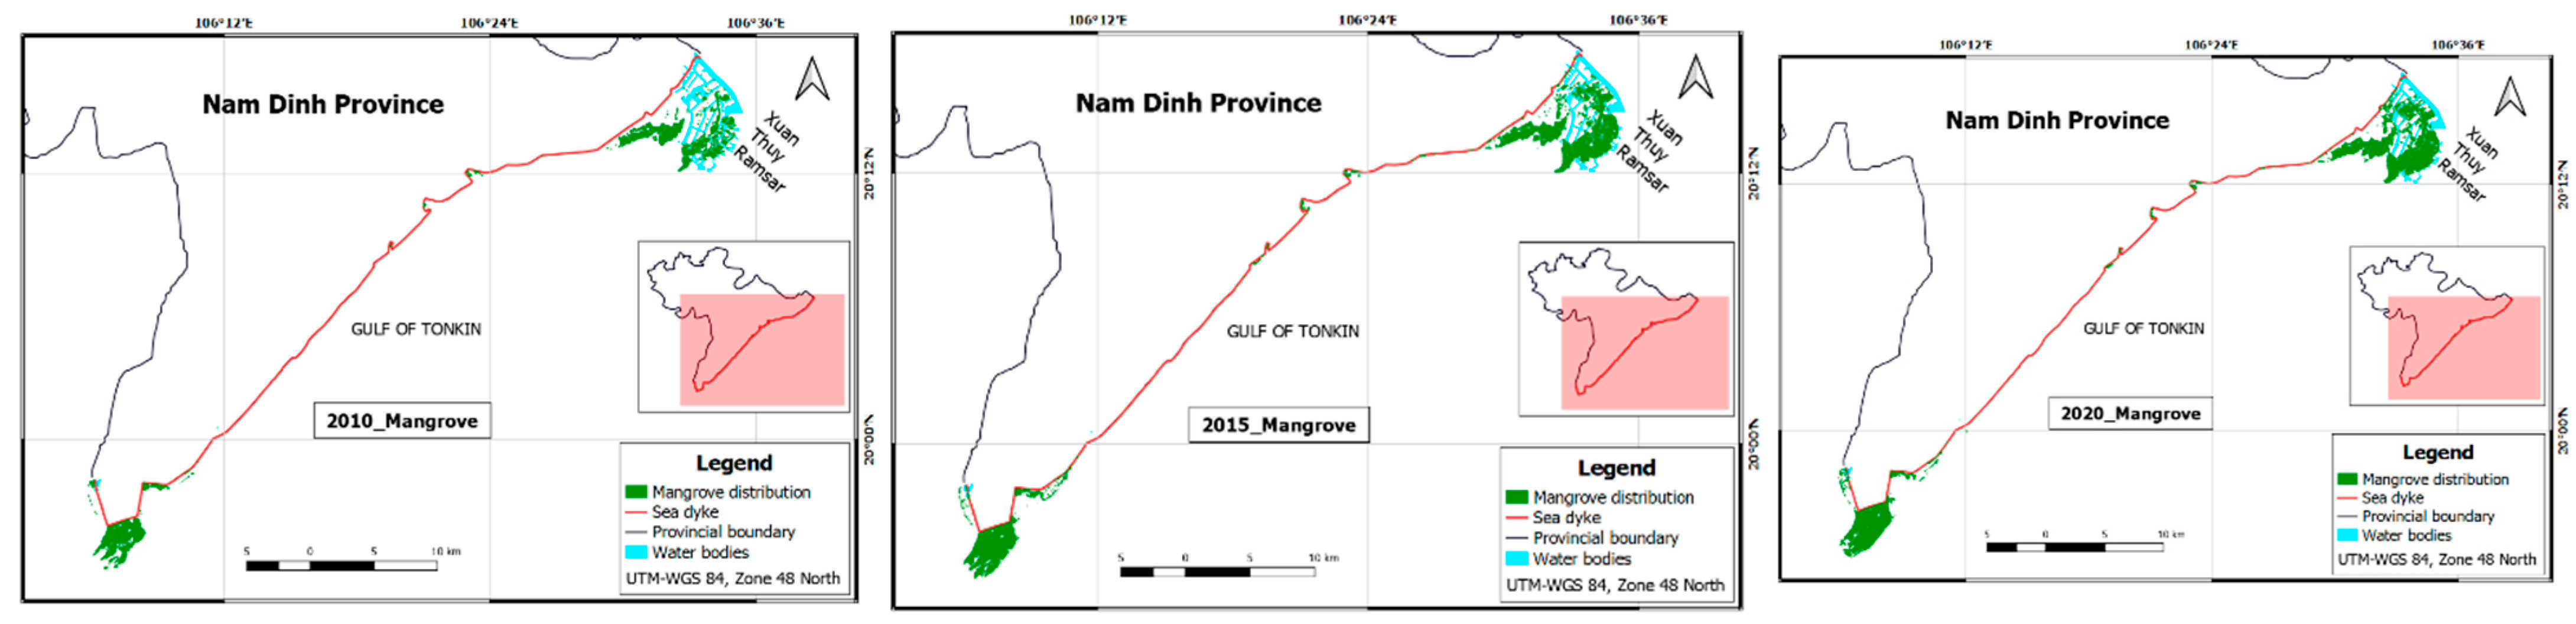
2.1. Study Area
2.2. Materials
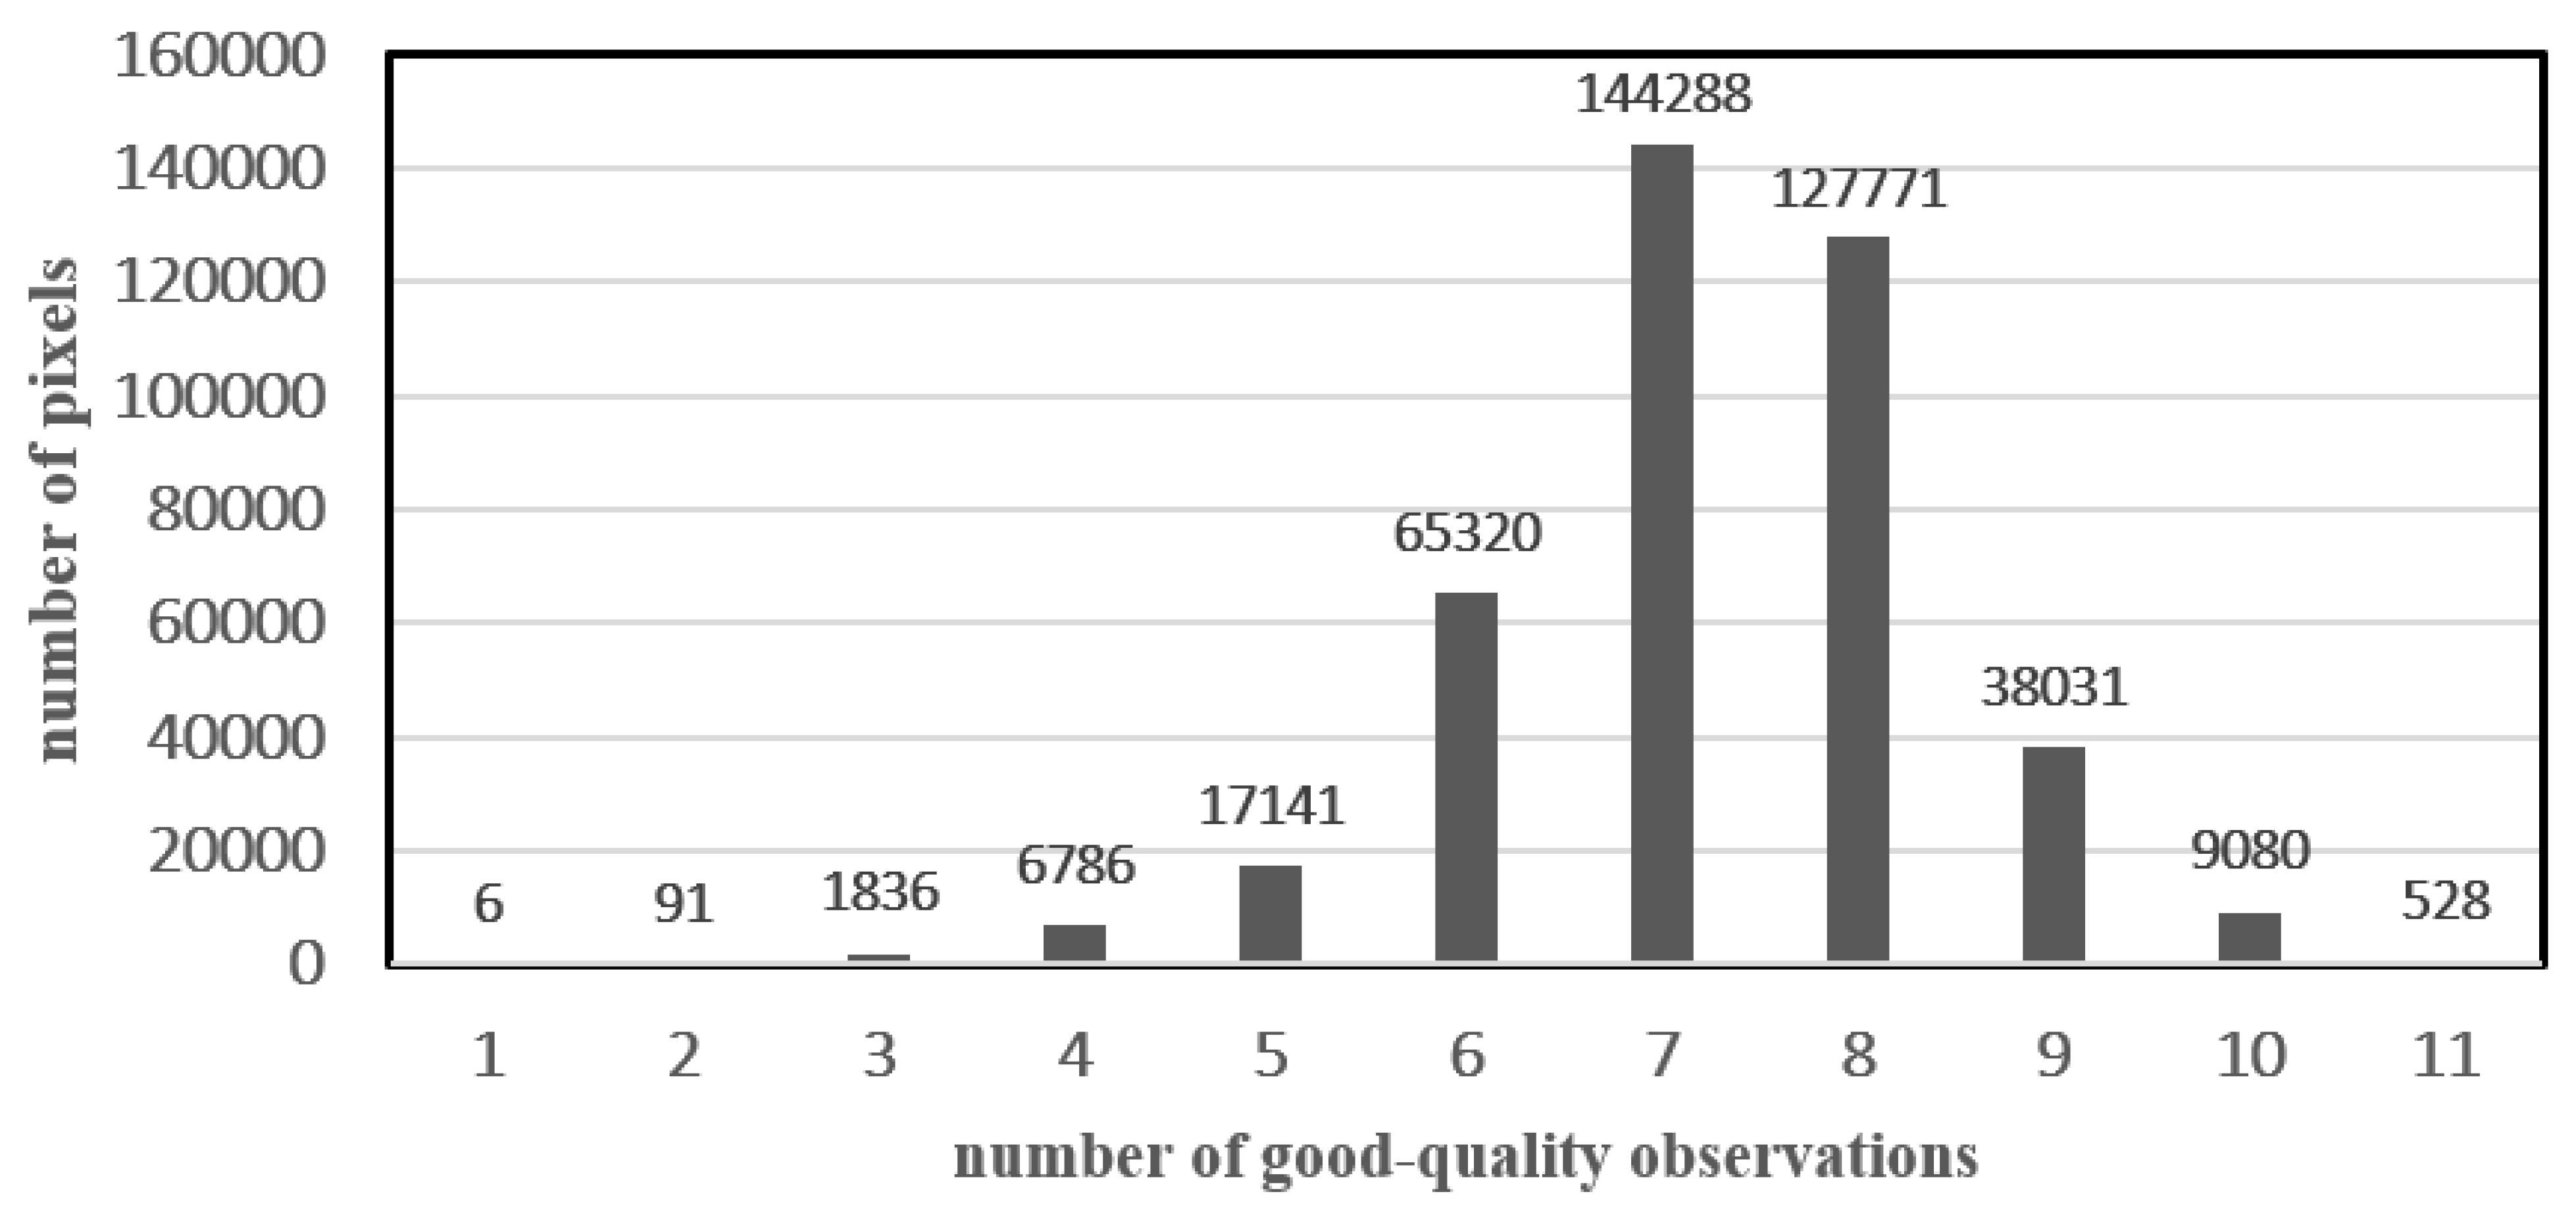
Satellite Data
2.3. Methods
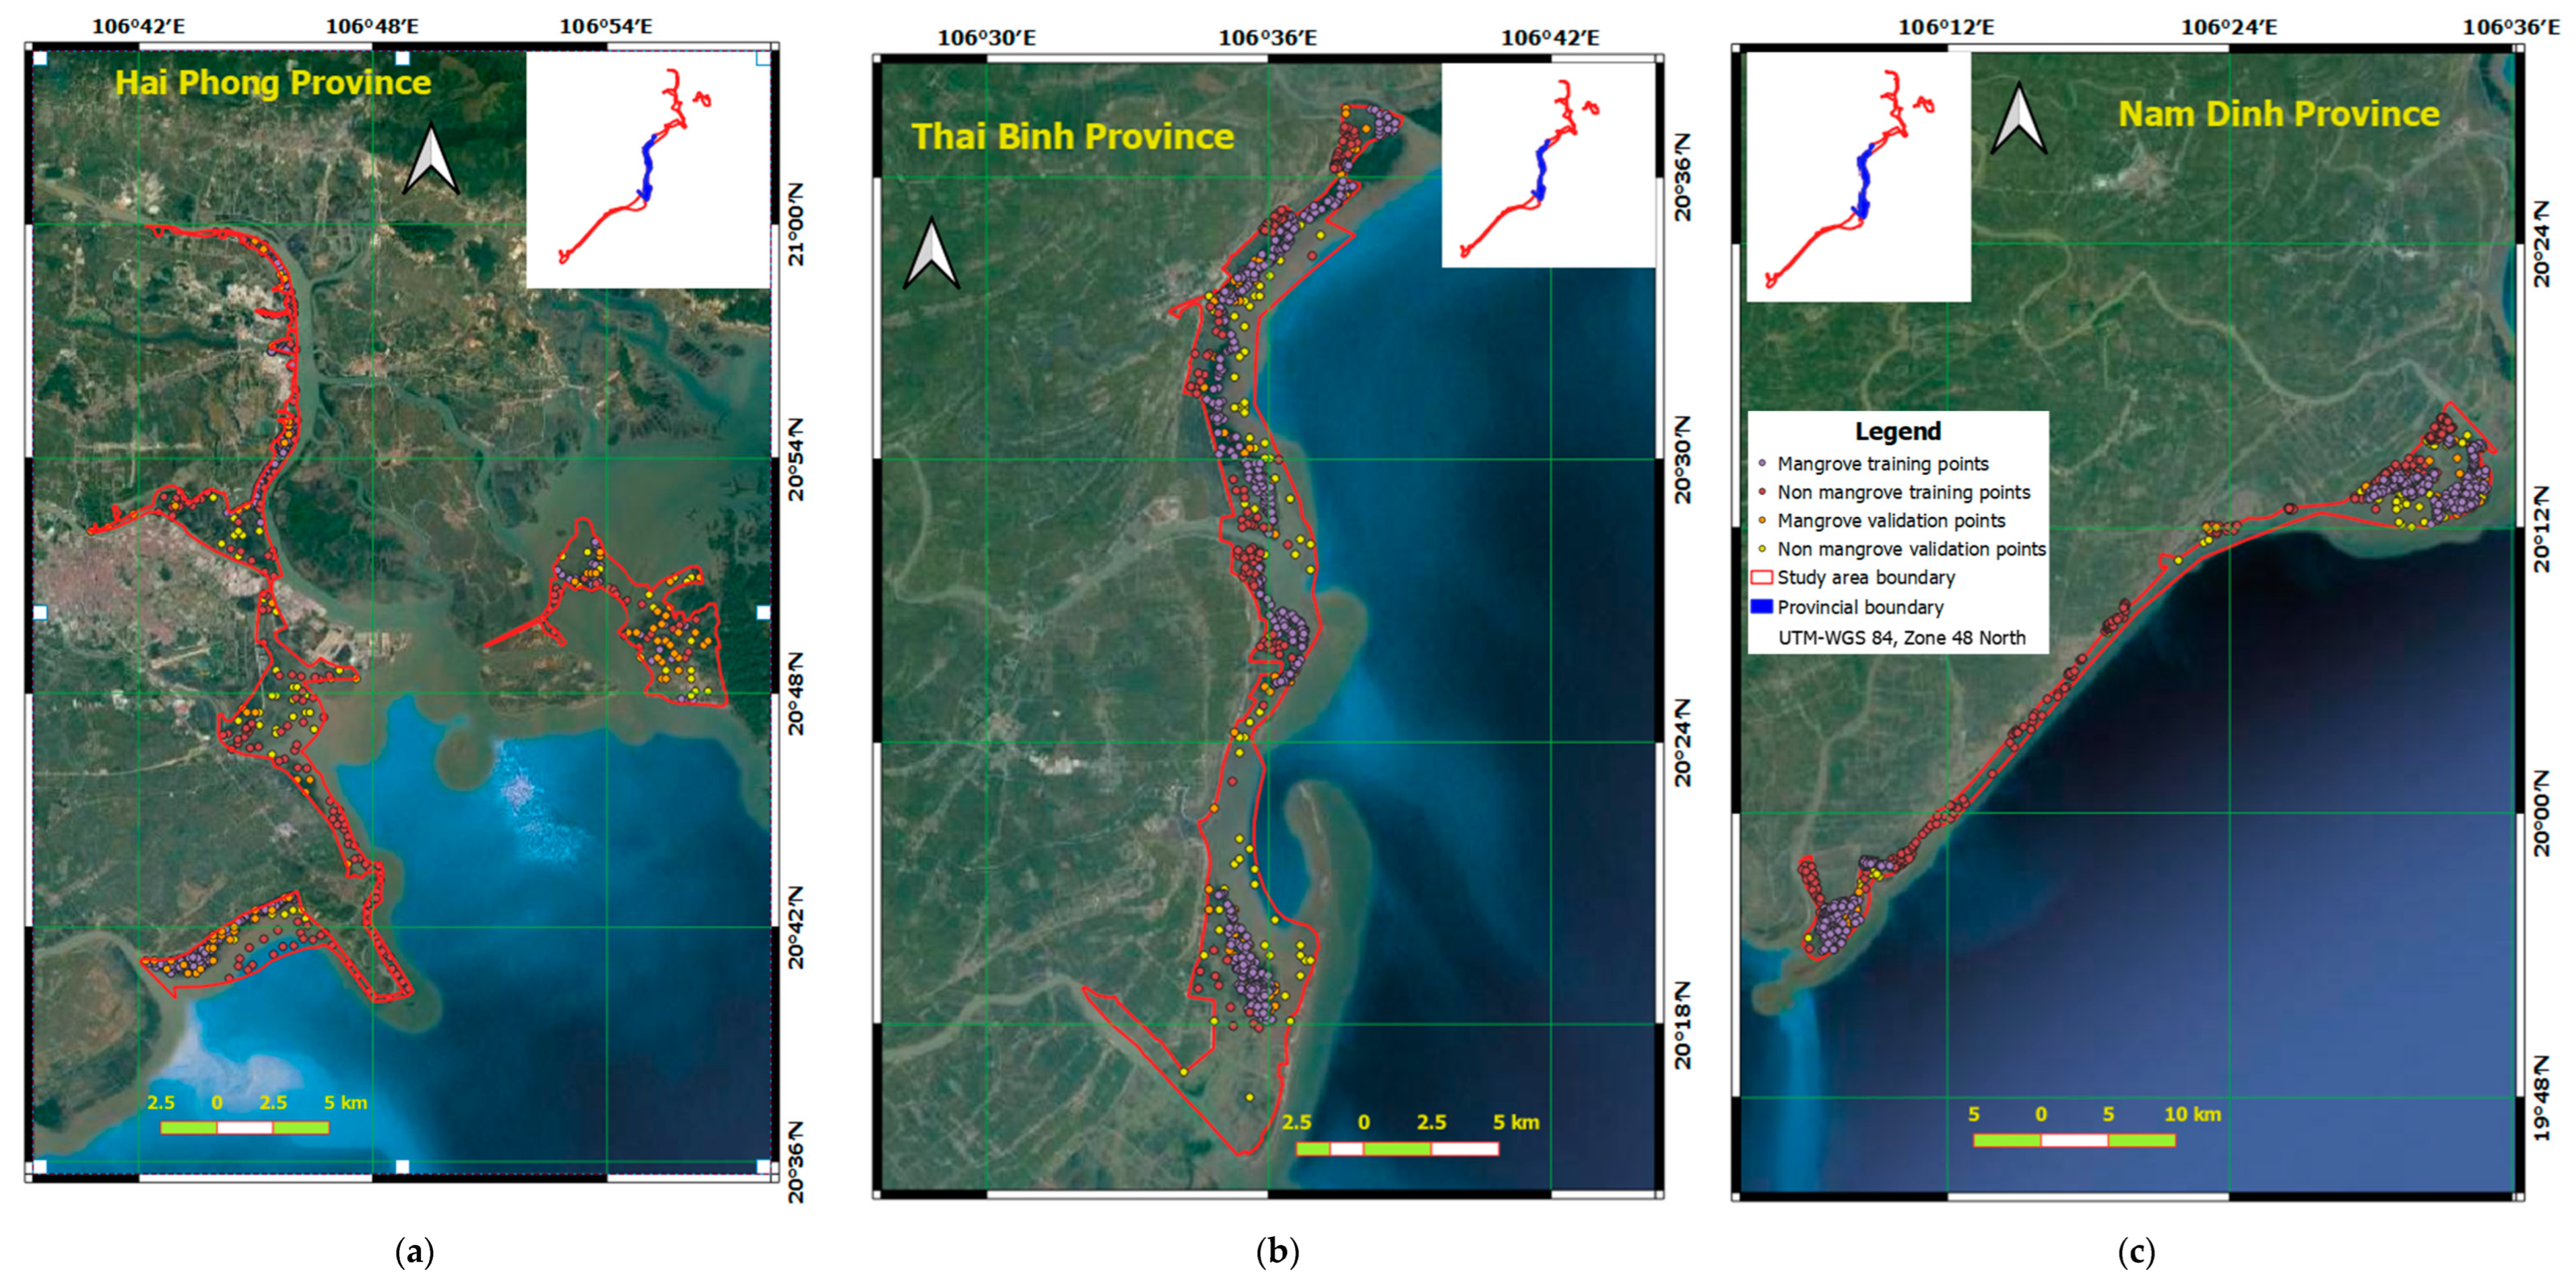
2.3.1. Generation of Training and Validation Datasets for the Study Area
2.3.2. Computation of Spectral Indices
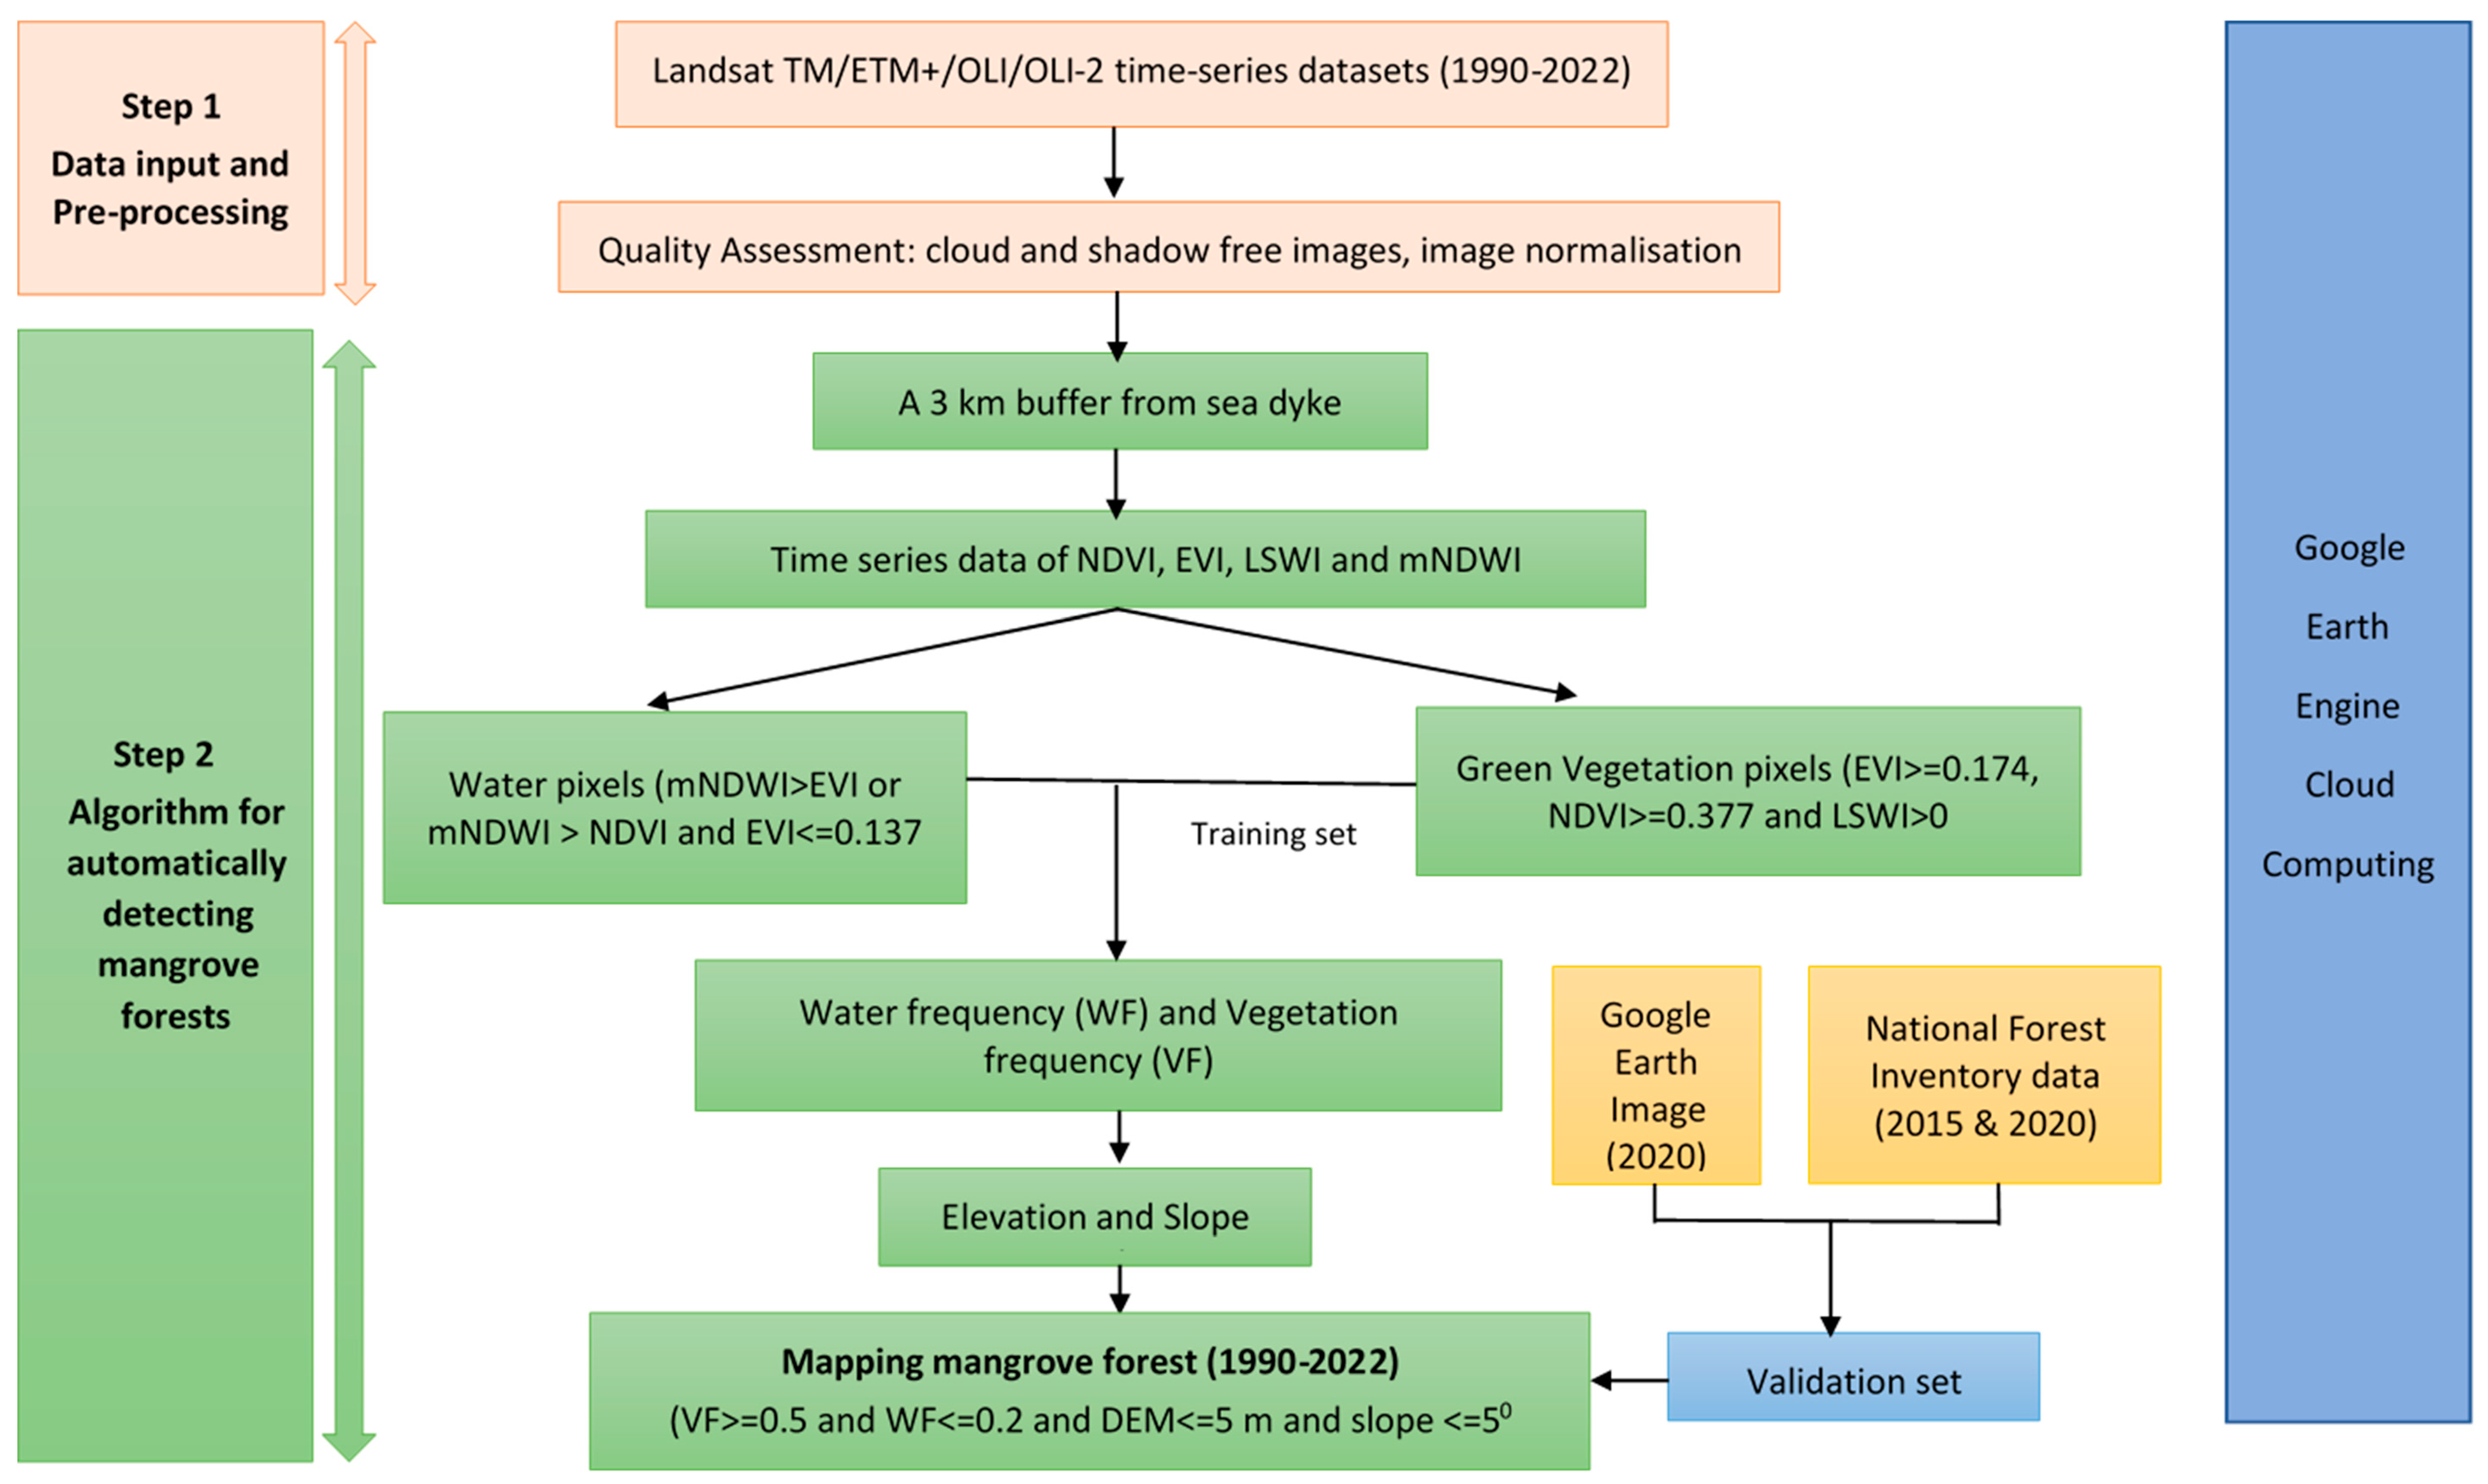
2.3.3. Mangrove Mapping Algorithm
- -
- Pixels of surface water body: EVI ≤ 0.137 and (mNDWI > EVI or mNDWI > NDVI);
- -
- Pixels of green vegetation: EVI ≥ 0.174, NDVI ≥ 0.377 and LSWI > 0.
2.3.4. Annual Maps of Mangrove Forest
2.3.5. Accuracy Assessment
2.3.6. Analysis and Statistical Method
3. Results
3.1. Mangrove Classification and Accuracy Assessment
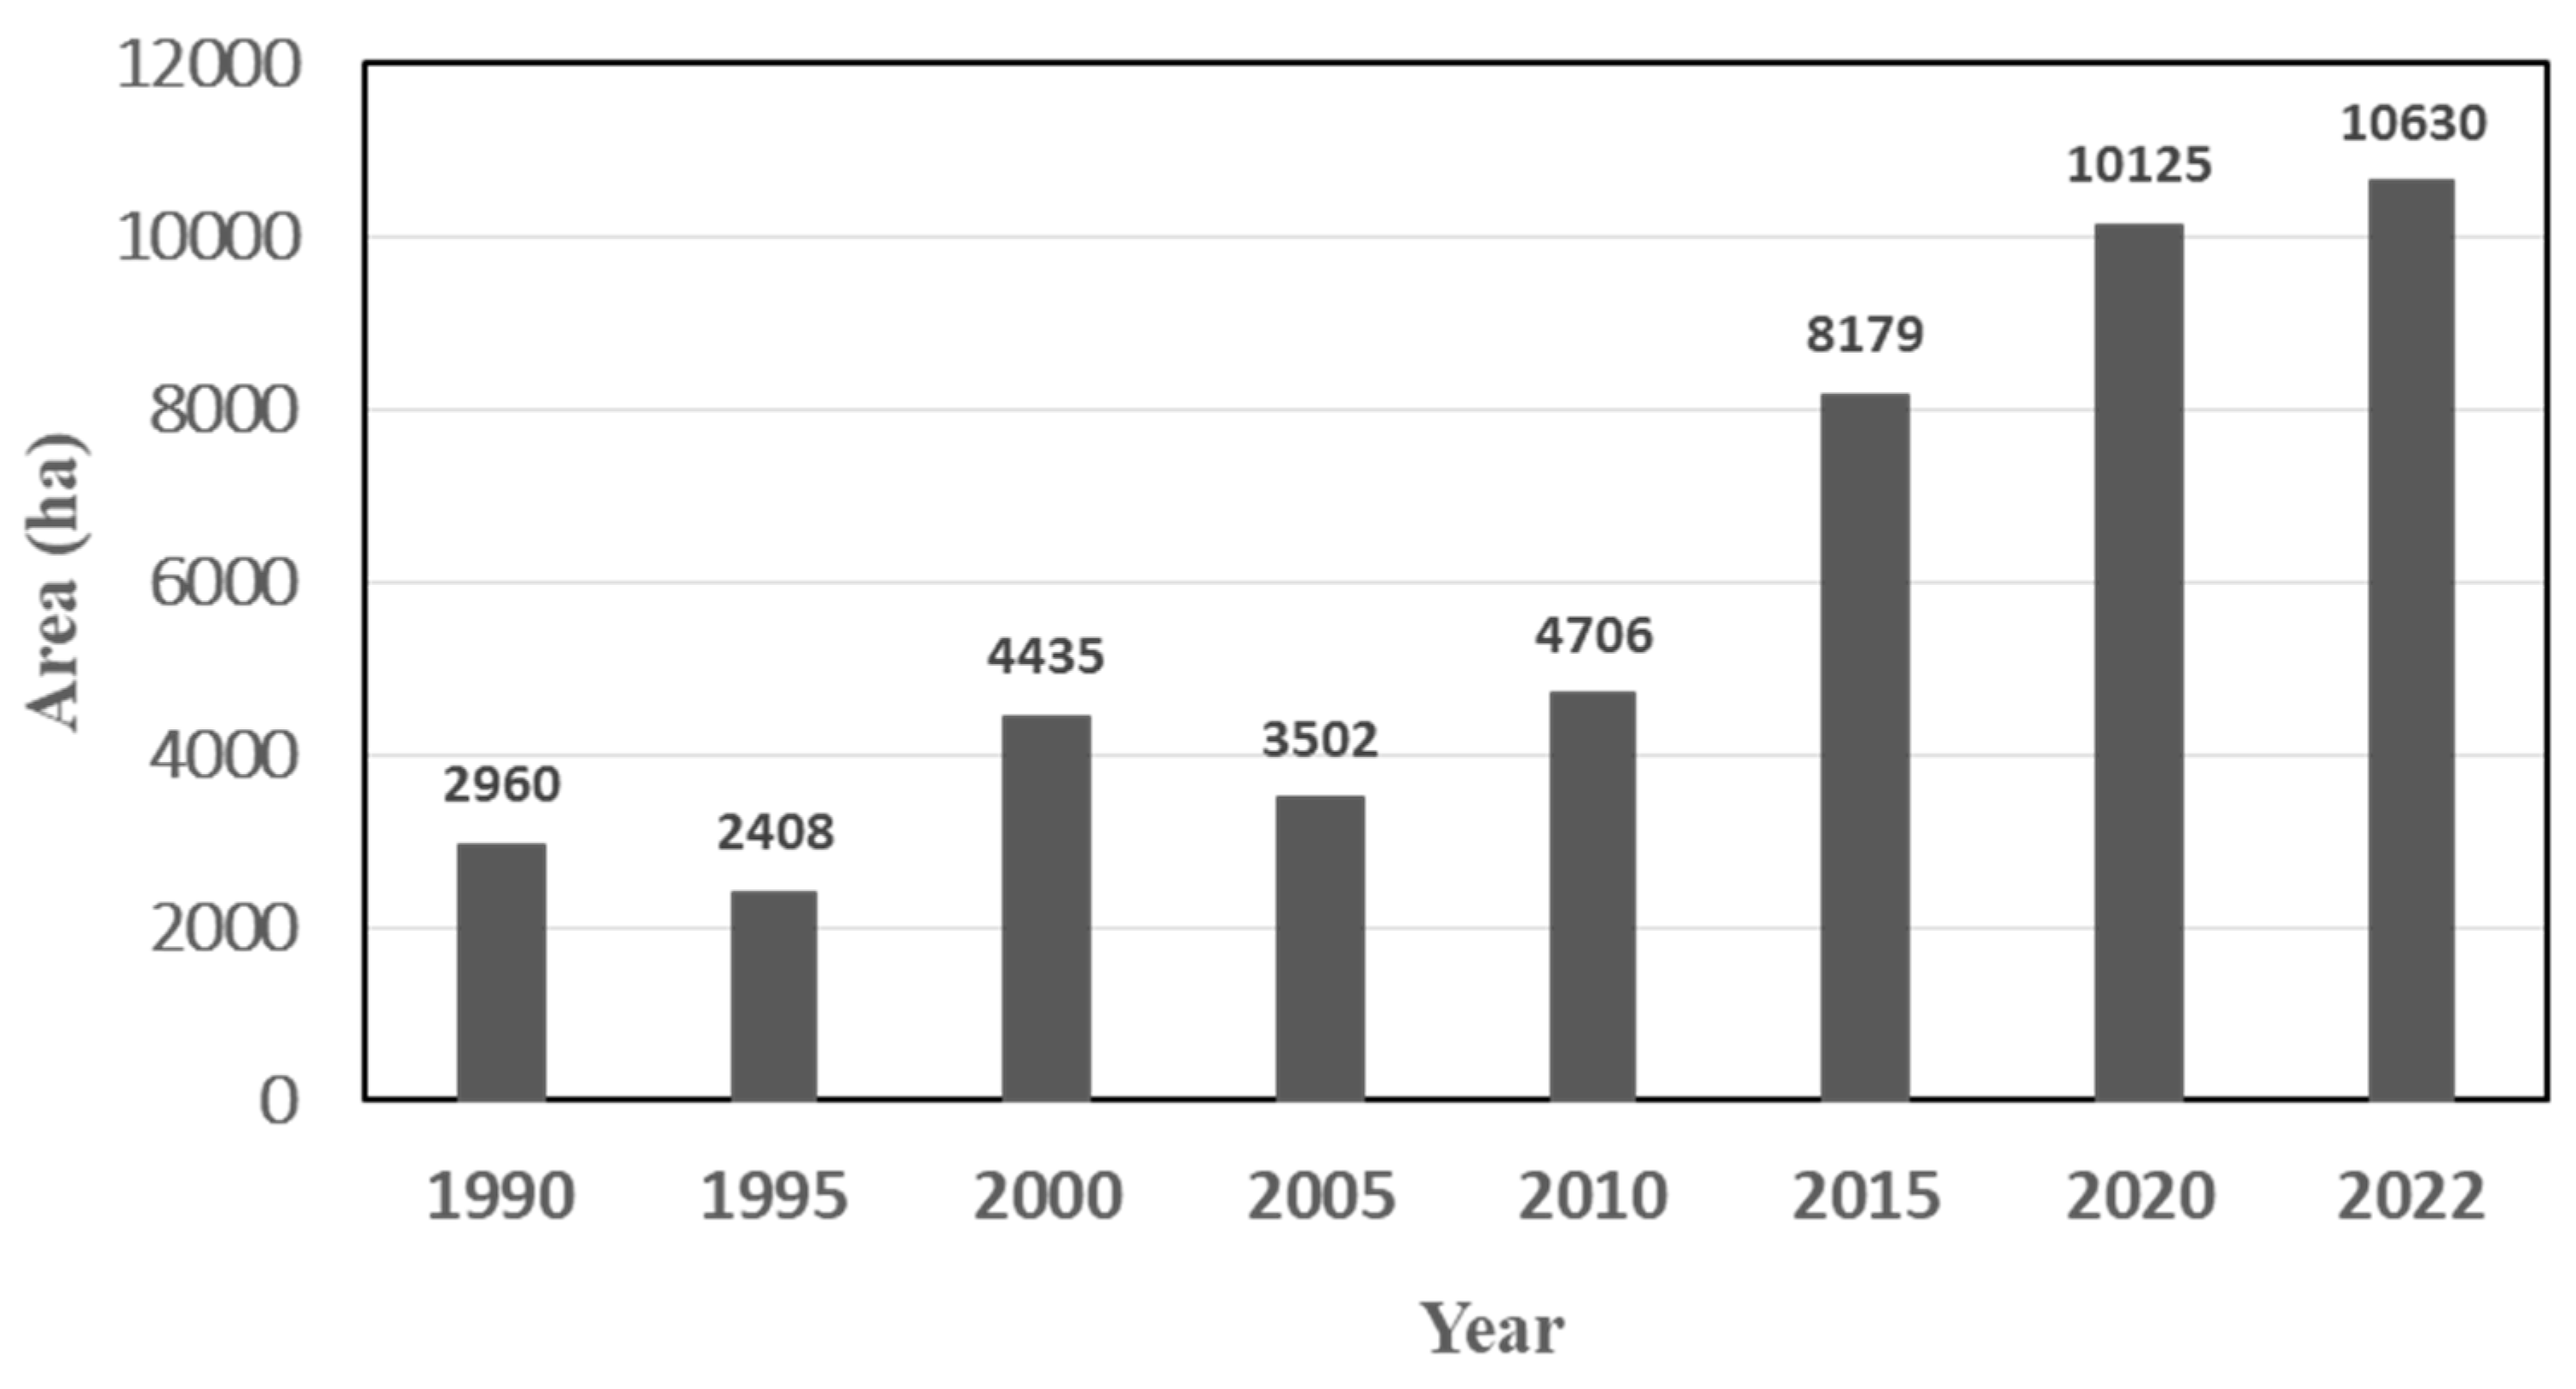
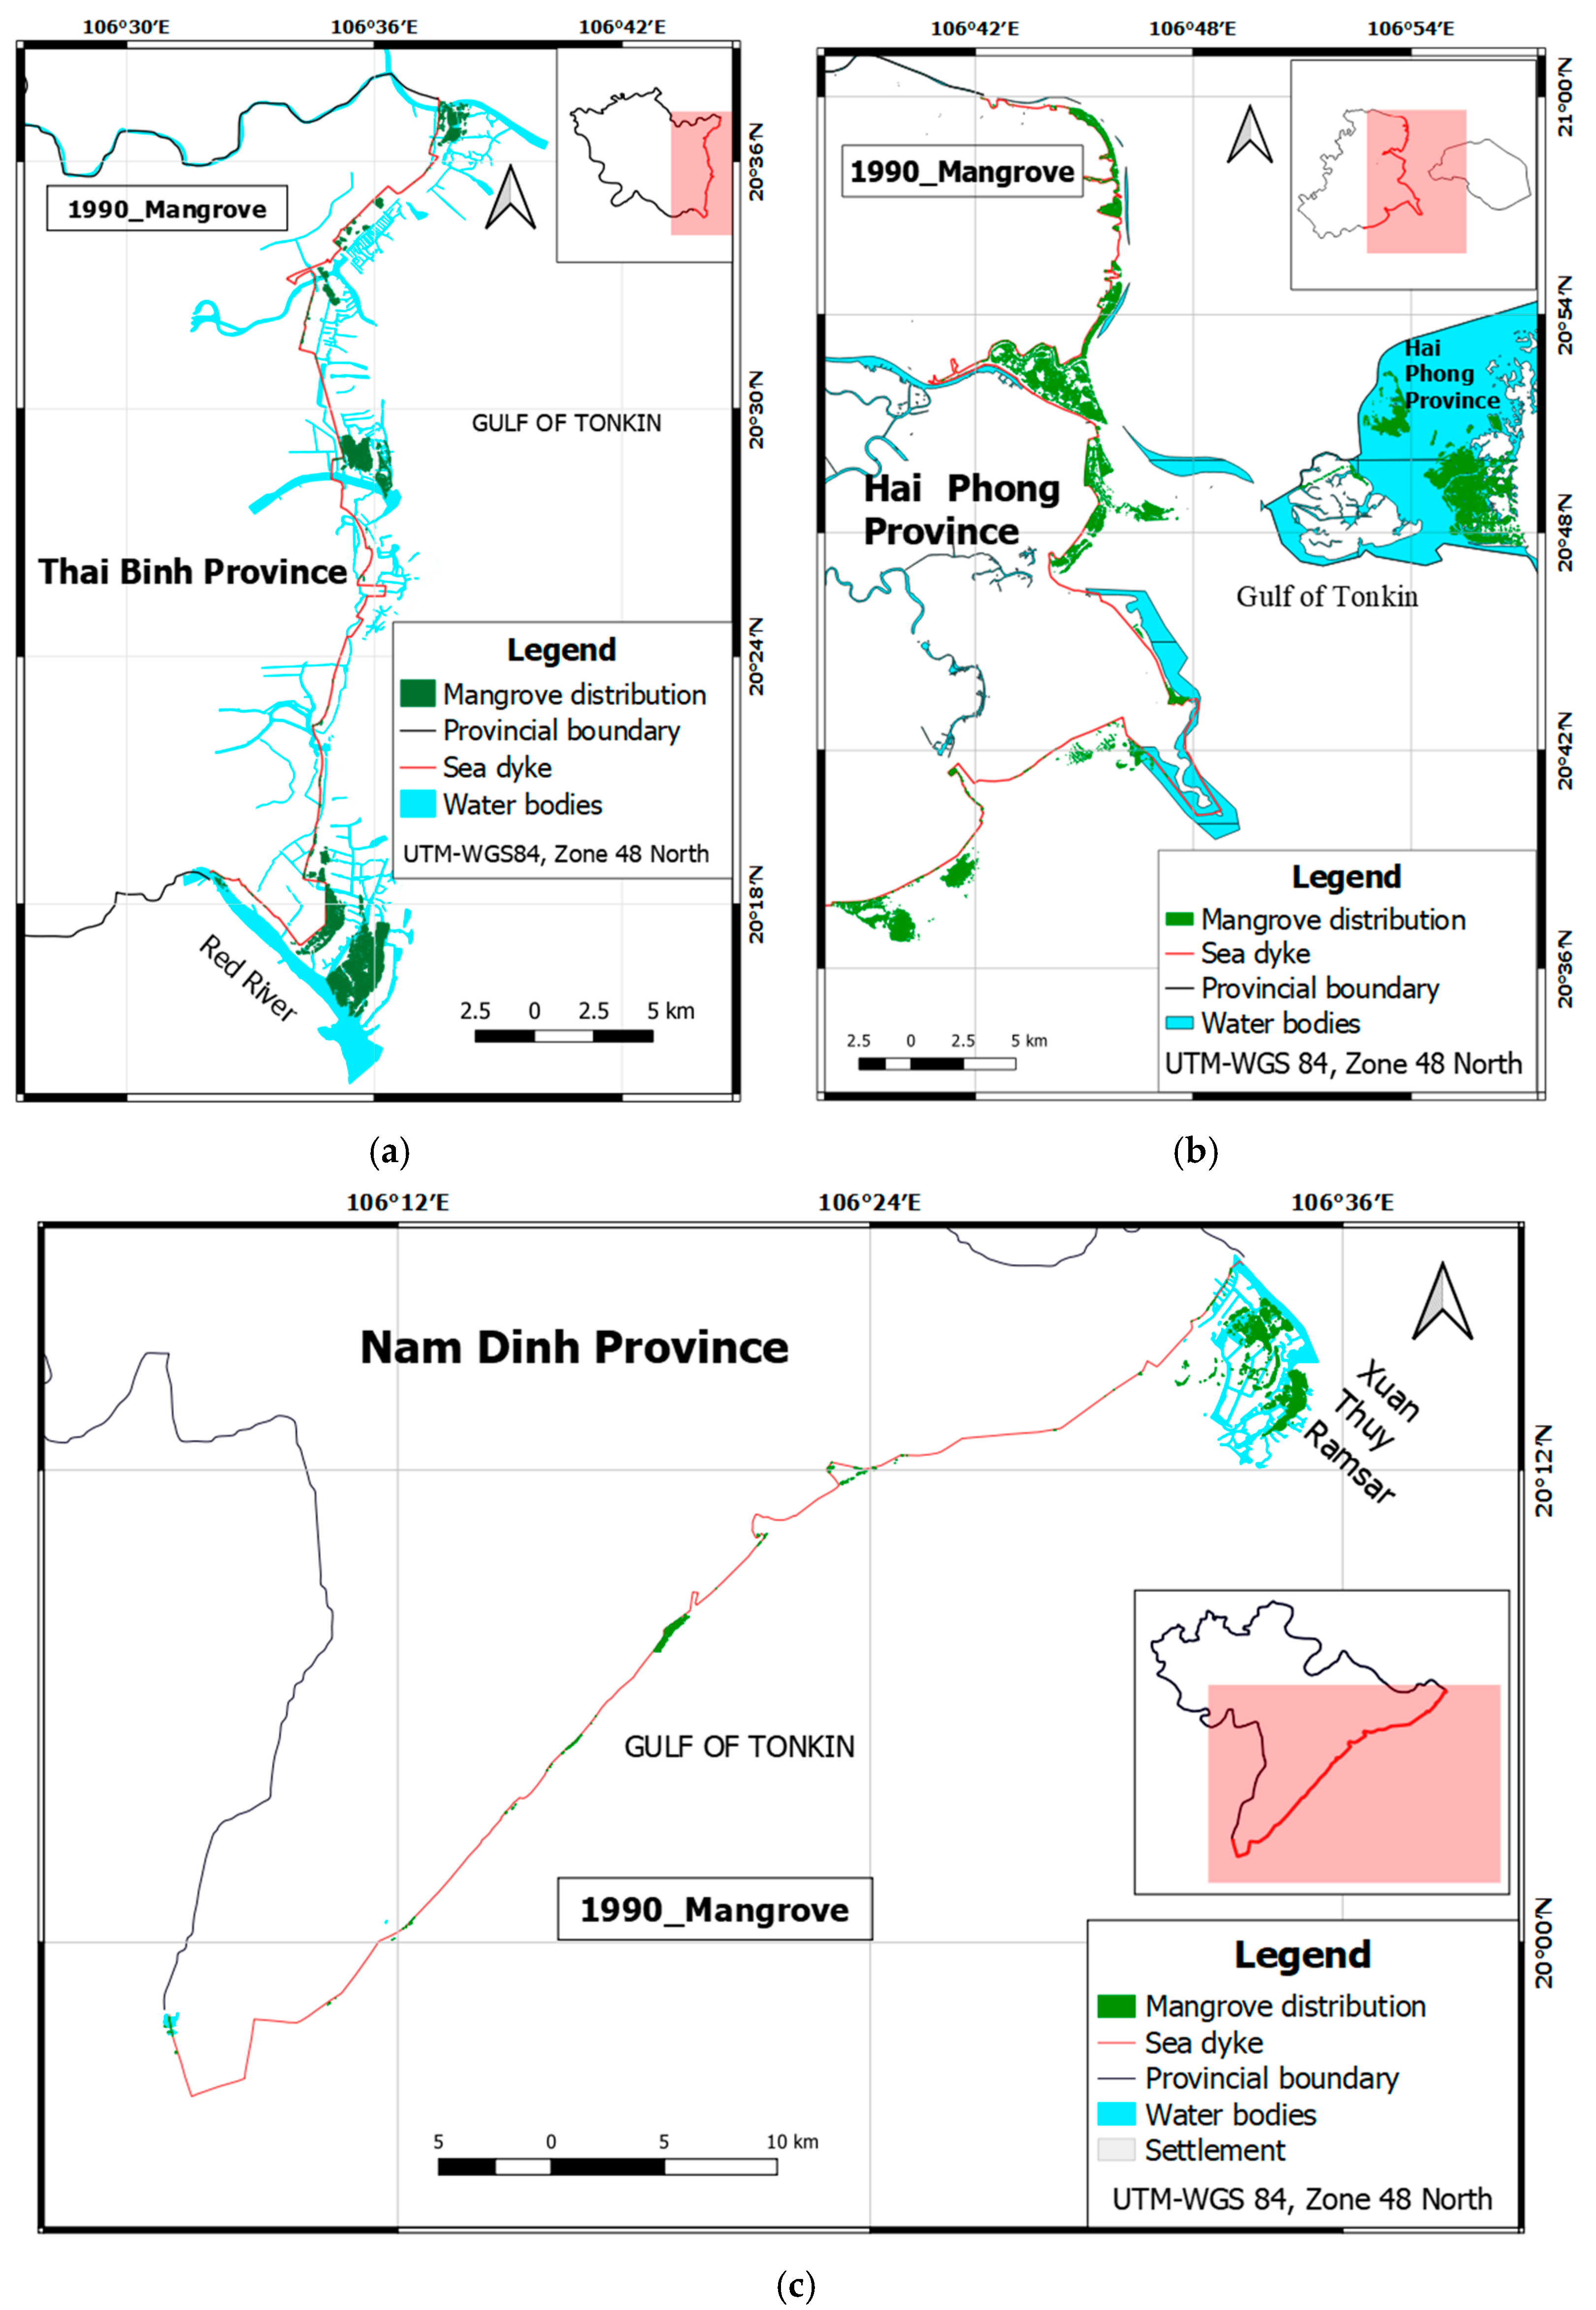
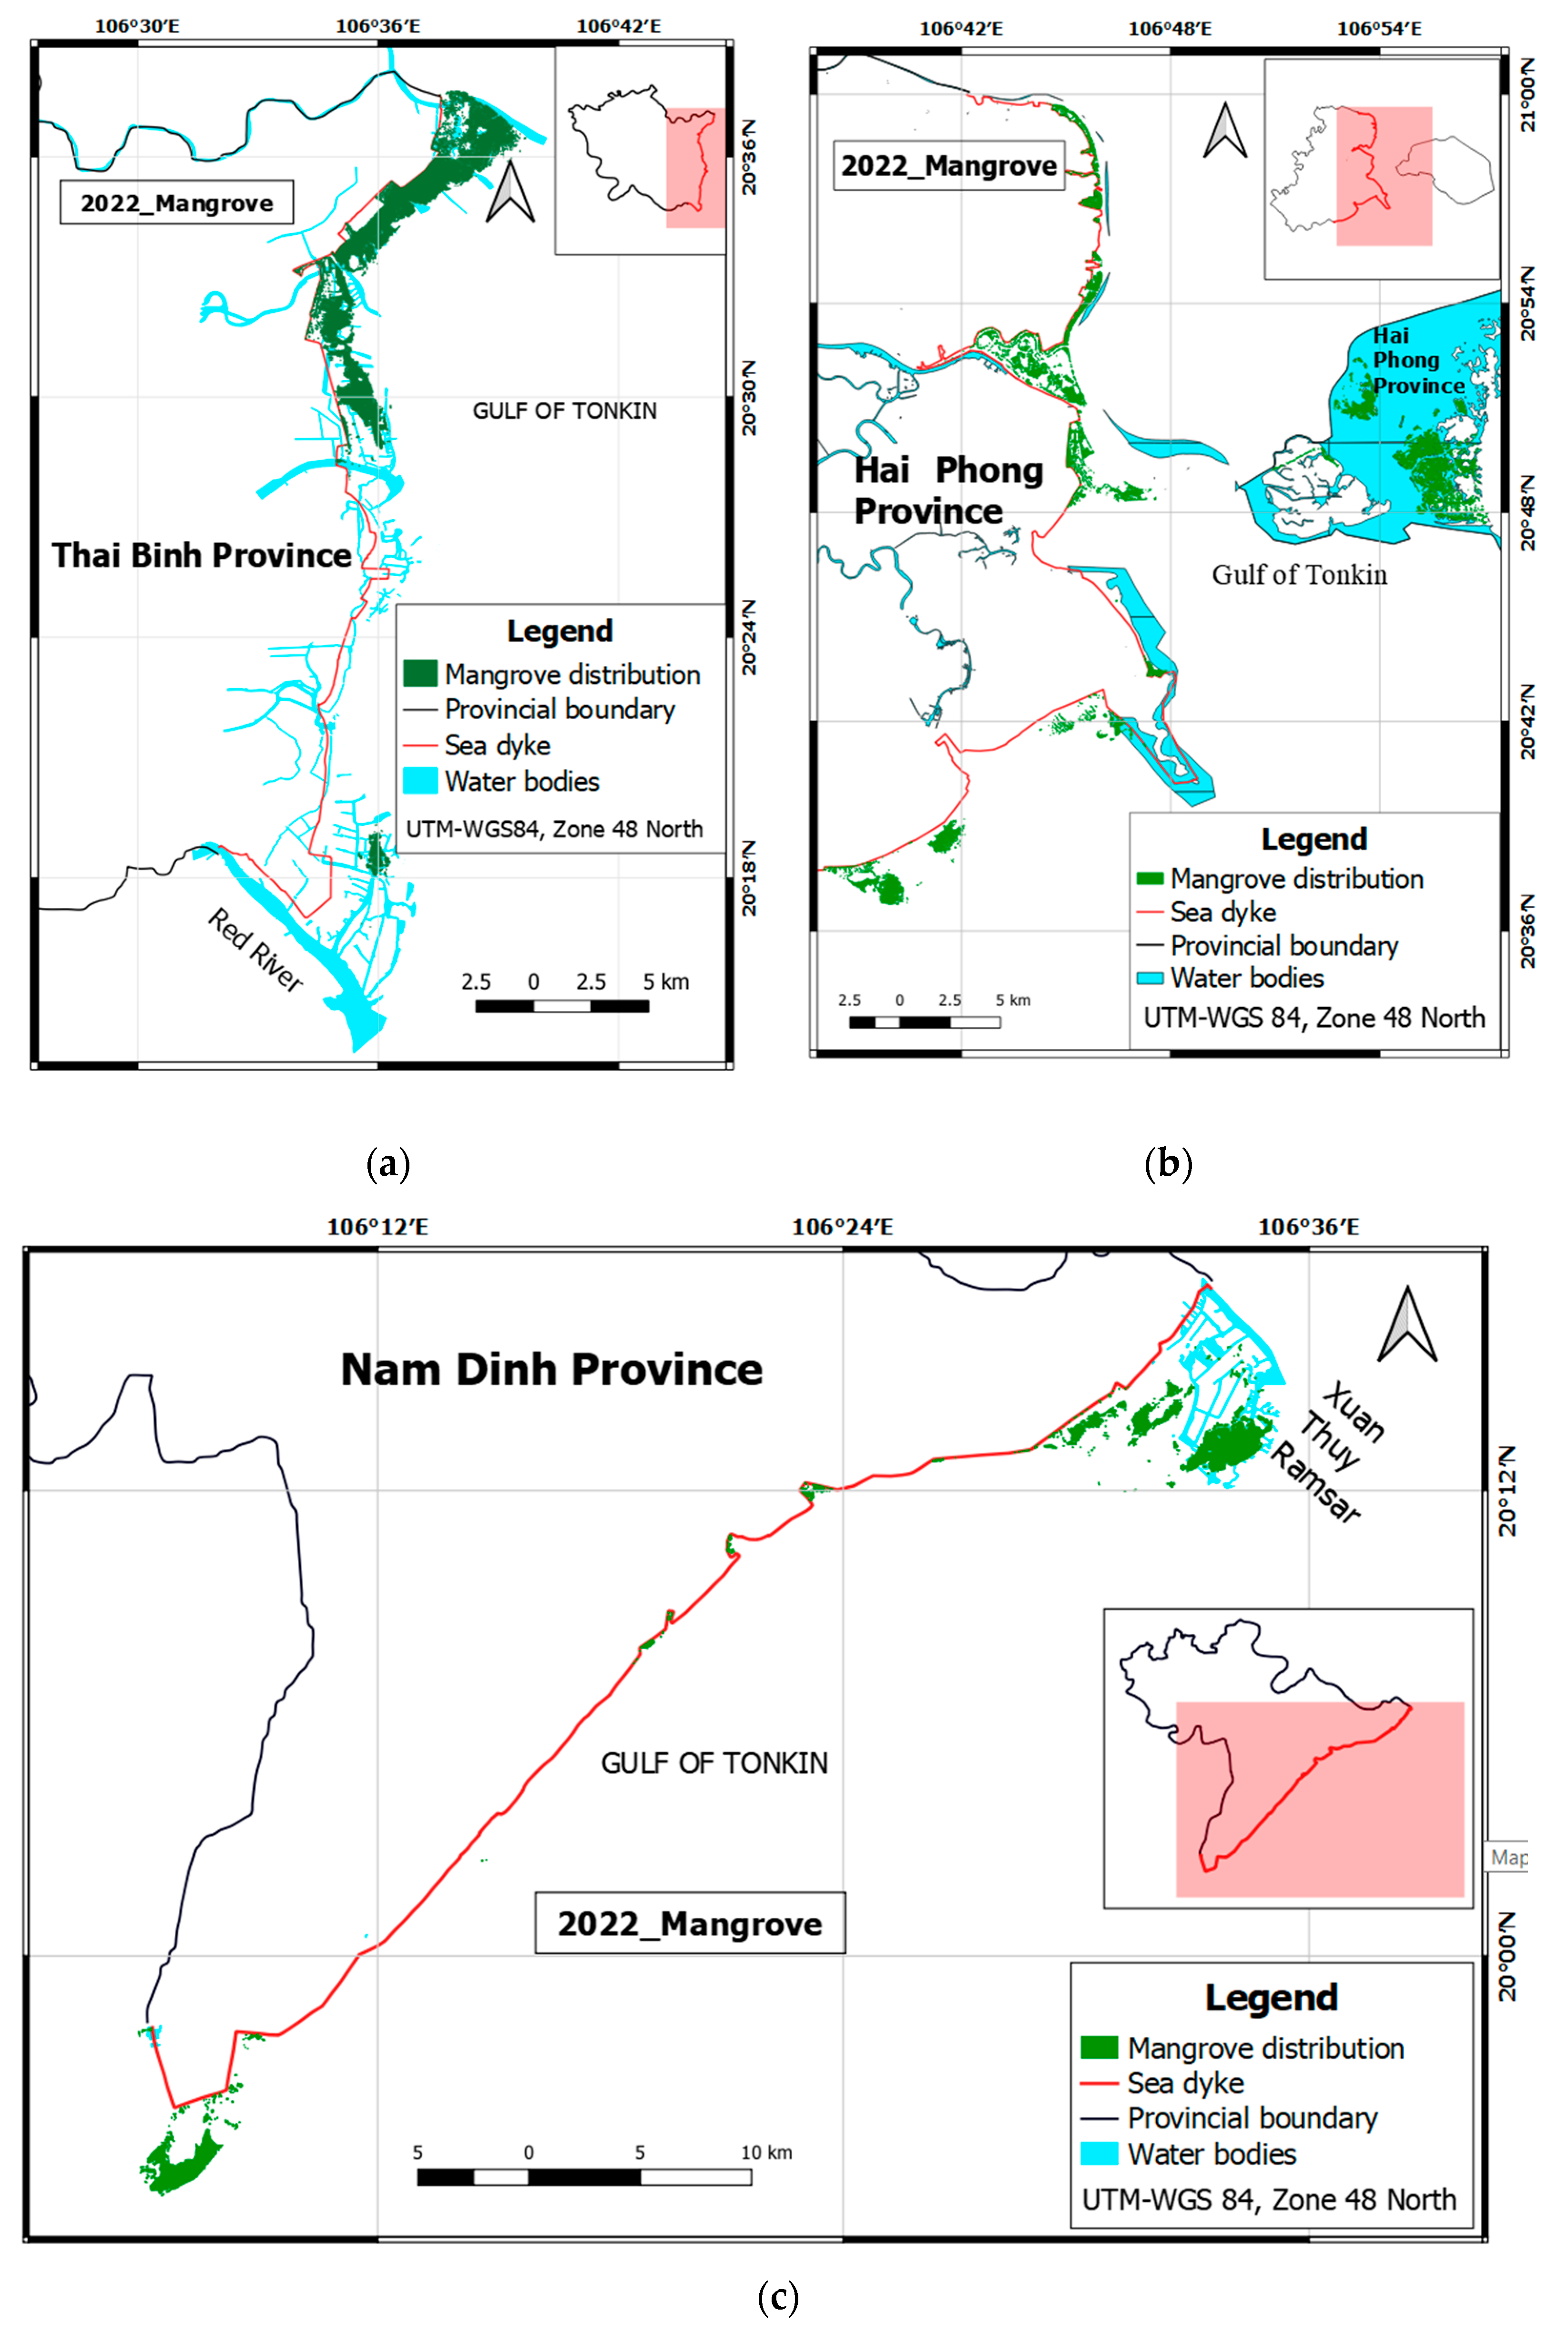
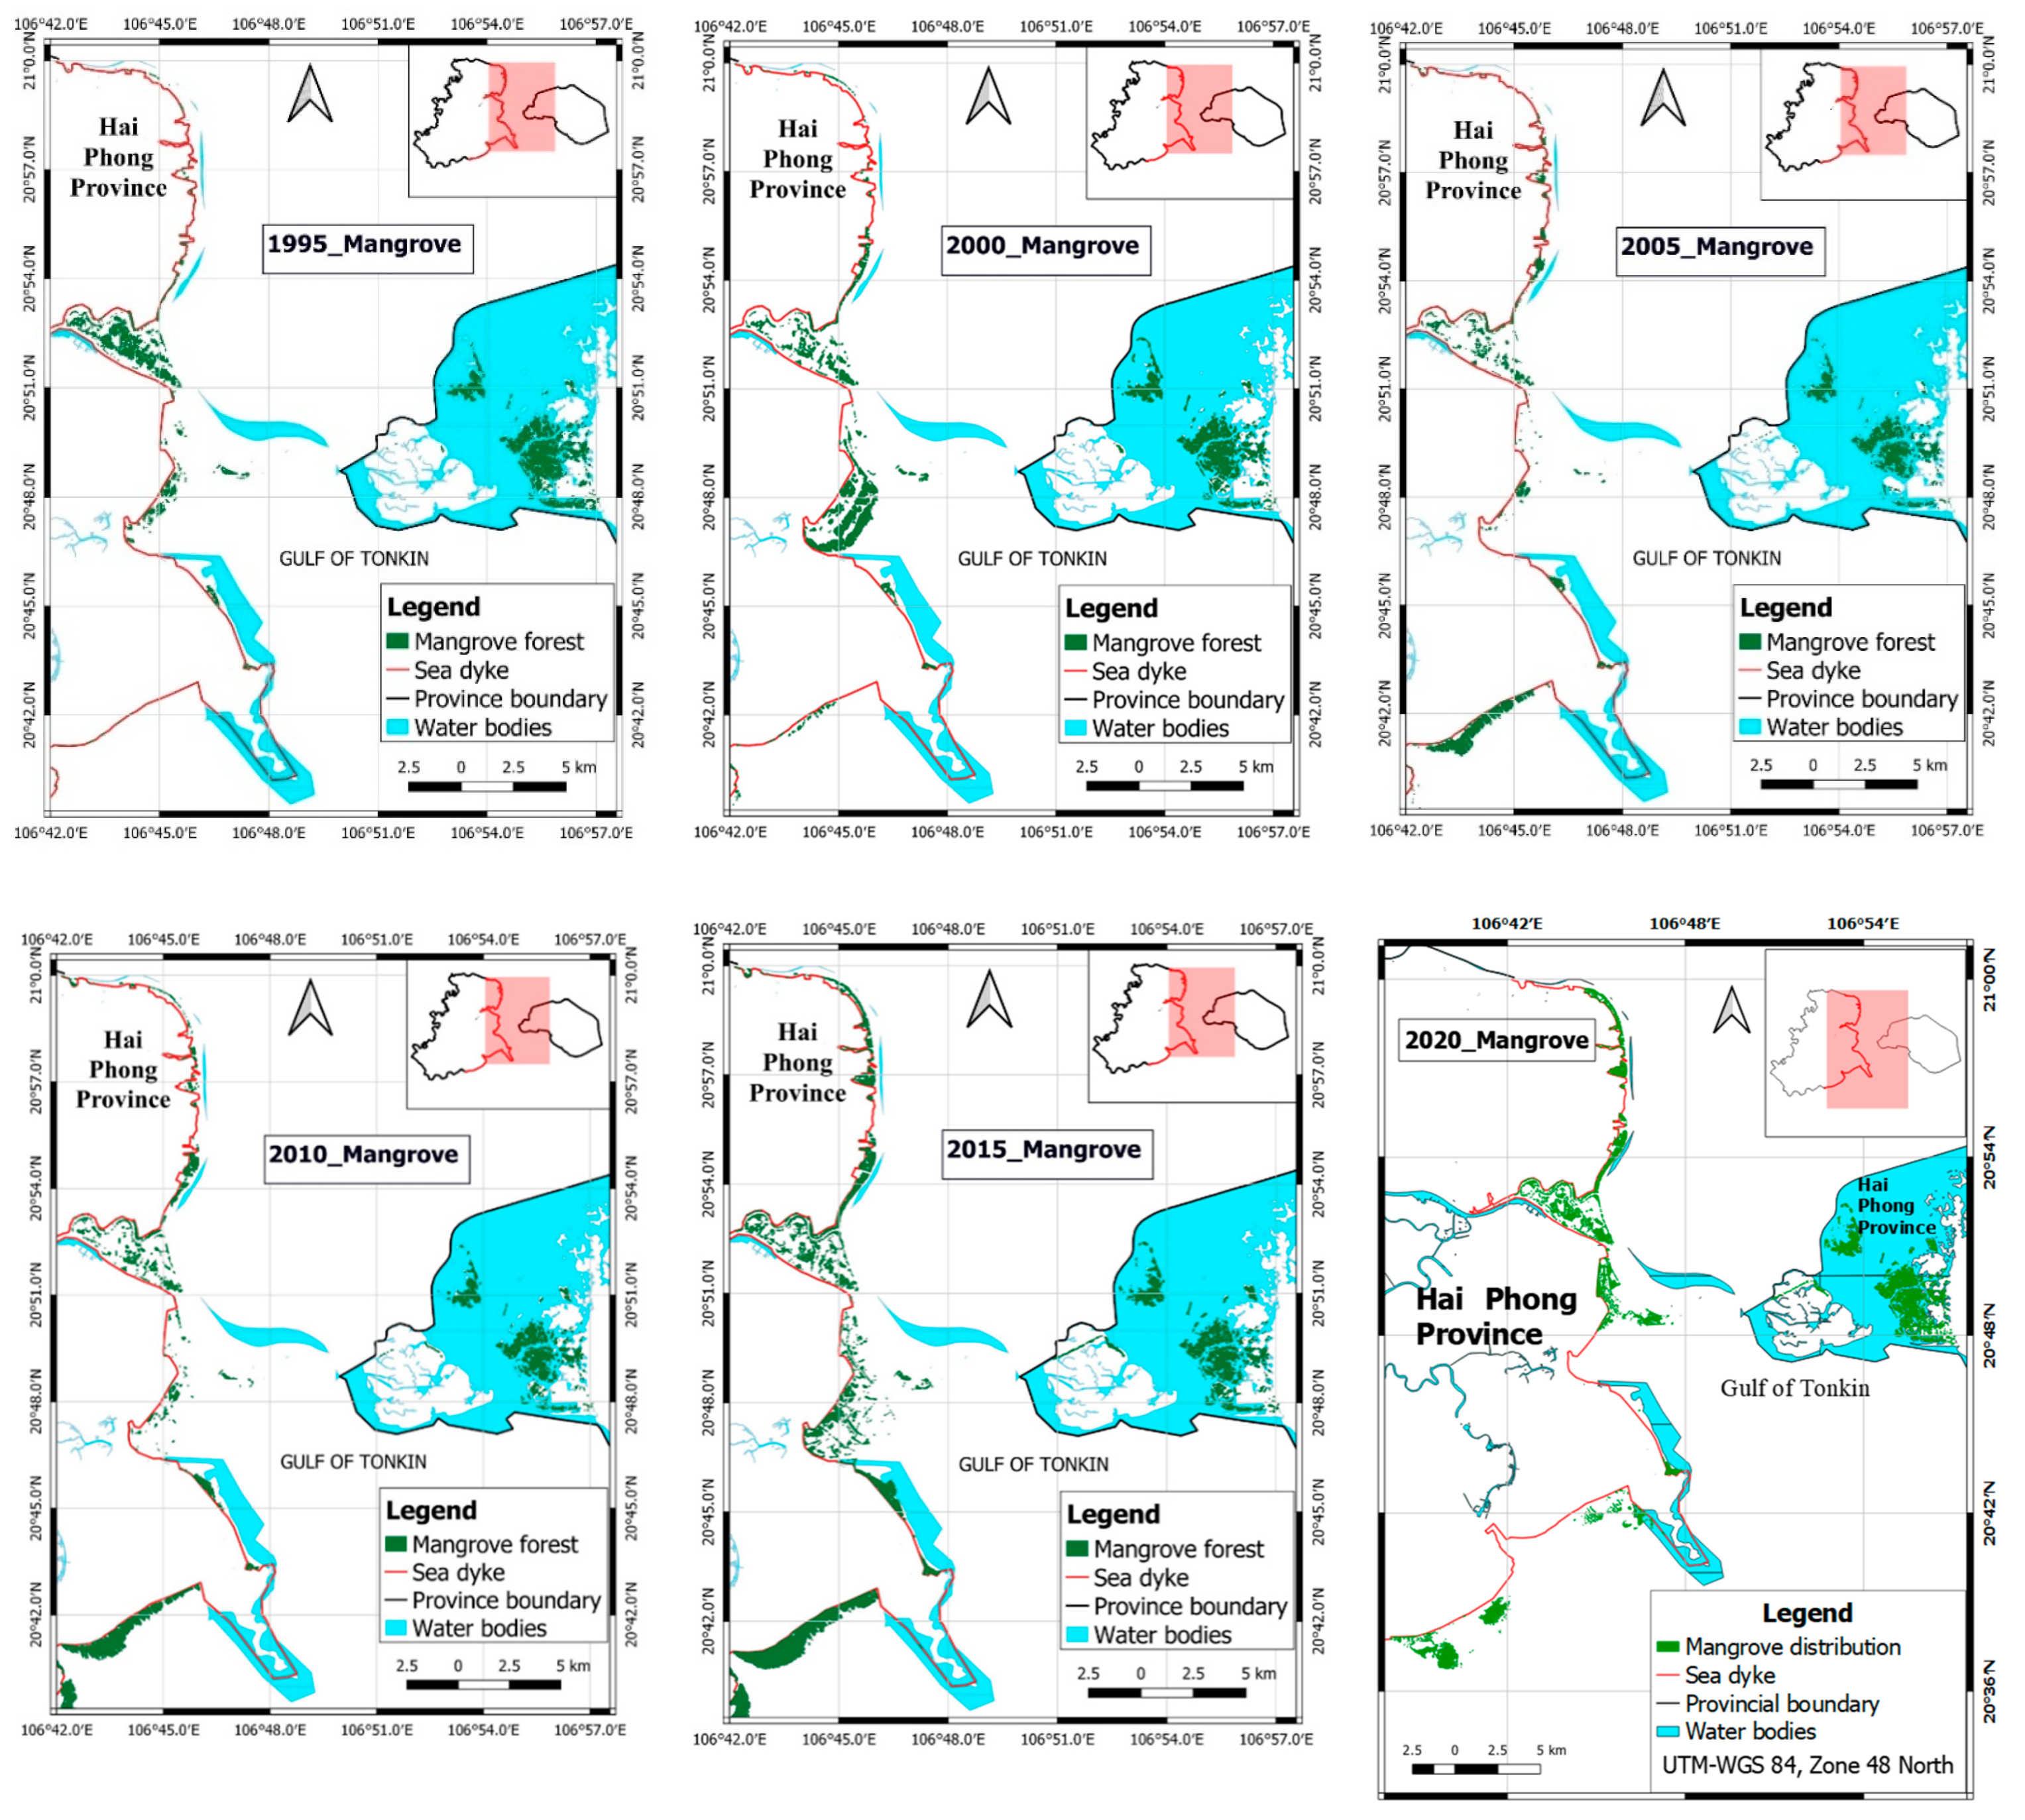
3.2. Mangrove Dynamics from 1990 to 2022
4. Discussion
4.1. Uncertainty of Mangrove Mapping and Change Detection
4.2. Driving Factors for Mangrove Dynamic in Three Provinces from 1990 to 2022
5. Conclusions
Author Contributions
Funding
Data Availability Statement
Acknowledgments
Conflicts of Interest
Appendix A


References
- Saintilan, N.; Khan, N.S.; Ashe, E.; Kelleway, J.J.; Rogers, K.; Woodroffe, C.D.; Horton, B.P. Thresholds of mangrove survival under rapid sea level rise. Science 2020, 368, 1118. [Google Scholar] [CrossRef] [PubMed]
- Friess, D.A.; Rogers, K.; Lovelock, C.E.; Krauss, K.W.; Hamilton, S.E.; Lee, S.Y.; Lucas, R.; Primavera, J.; Rajkaran, A.; Shi, S. The State of the World’s Mangrove Forests: Past, Present, and Future. Annu. Rev. Environ. Resour. 2019, 44, 89–115. [Google Scholar] [CrossRef]
- Goldberg, L.; Lagomasino, D.; Thomas, N.; Fatoyinbo, T. Global declines in human-driven mangrove loss. Glob. Change Biol. 2020, 26, 5844–5855. [Google Scholar] [CrossRef] [PubMed]
- Saintilan, N.; Asbridge, E.; Lucas, R.; Rogers, K.; Wen, L.; Powell, M.; Colloff, M.J.; Rodriguez, J.F.; Saco, P.M.; Sandi, S.; et al. Australian forested wetlands under climate change: Collapse or proliferation? Mar. Freshw. Res. 2021, 73, 1255–1262. [Google Scholar] [CrossRef]
- Saintilan, N.; Wilson, N.C.; Rogers, K.; Rajkaran, A.; Krauss, K.W. Mangrove expansion and salt marsh decline at mangrove poleward limits. Glob. Change Biol. 2014, 20, 147–157. [Google Scholar] [CrossRef]
- Hong, P.N.; San, H.T. Mangroves of Vietnam; IUCN: Bangkok, Thailand, 1993; p. 173. [Google Scholar]
- Warner, R.; Kaidonis, M.; Dun, O.; Rogers, K.; Shi, Y.; Nguyen, T.T.X.; Woodroffe, C.D. Opportunities and challenges for mangrove carbon sequestration in the Mekong River Delta in Vietnam. Sustain. Sci. 2016, 11, 661–677. [Google Scholar] [CrossRef]
- Veettil, B.K.; Ward, R.D.; Quang, N.X.; Trang, N.T.T.; Giang, T.H. Mangroves of Vietnam: Historical development, current state of research and future threats. Estuar. Coast. Shelf Sci. 2019, 218, 212–236. [Google Scholar] [CrossRef]
- Hong, H.T.C.; Avtar, R.; Fujii, M. Monitoring changes in land use and distribution of mangroves in the southeastern part of the Mekong River Delta, Vietnam. Trop. Ecol. 2019, 60, 552–565. [Google Scholar] [CrossRef]
- Pham, T.D.; Yoshino, K. Mangrove Mapping and Change Detection Using Multi-temporal Landsat imagery in Hai Phong city, Vietnam. In Proceedings of the International Symposium on Cartography in Internet and Ubiquitous Environments 2015, Tokyo, Japan, 17–19 March 2015. [Google Scholar]
- Tran, L.X.; Fischer, A. Spatiotemporal changes and fragmentation of mangroves and its effects on fish diversity in Ca Mau Province (Vietnam). J. Coast. Conserv. 2017, 21, 355–368. [Google Scholar] [CrossRef]
- Nguyen-Thanh, S.; Chen, C.-F.; Chang, N.-B.; Chen, C.-R.; Chang, L.-Y.; Bui, X.-T. Mangrove Mapping and Change Detection in Ca Mau Peninsula, Vietnam, Using Landsat Data and Object-Based Image Analysis. IEEE J. Sel. Top. Appl. Earth Obs. Remote Sens. 2015, 8, 503–510. [Google Scholar] [CrossRef]
- Pham, L.T.H.; Brabyn, L. Monitoring mangrove biomass change in Vietnam using SPOT images and an object-based approach combined with machine learning algorithms. ISPRS J. Photogramm. Remote Sens. 2017, 128, 86–97. [Google Scholar] [CrossRef]
- Pham, T.D.; Yoshino, K. Monitoring Mangrove Forest using Multi-temporal Satellite Data in the Northern Coast of Vietnam. In Proceedings of the 32nd Asian Conference on Remote Sensing, Taipei, Taiwan, 3–7 October 2011. [Google Scholar]
- Lymburner, L.; Bunting, P.; Lucas, R.; Scarth, P.; Alam, I.; Phillips, C.; Ticehurst, C.; Held, A. Mapping the multi-decadal mangrove dynamics of the Australian coastline. Remote Sens. Environ. 2020, 238, 111185. [Google Scholar] [CrossRef]
- Long, J.B.; Giri, C. Mapping the Philippines’ Mangrove Forests Using Landsat Imagery. Sensors 2011, 11, 2972–2981. [Google Scholar] [CrossRef]
- Giri, C.; Ochieng, E.; Tieszen, L.L.; Zhu, Z.; Shingh, A.; Loveland, T. Status and distribution of mangrove forests of the world using earth observation satellite data. Glob. Ecol. Biogeogr. 2011, 20, 154–159. [Google Scholar] [CrossRef]
- Giri, C.; Pengra, B.; Zhu, Z.; Singh, A.; Tieszen, A.L.L. Monitoring mangrove forest dynamics of the Sundarbans in Bangladesh and India using multi-temporal satellite data from 1973 to 2000. Estuar. Coast. Shelf Sci. 2007, 73, 91–100. [Google Scholar] [CrossRef]
- Pham, T.D.; Yokoya, N.; Bui, D.T.; Yoshino, K.; Friess, D.A. Remote Sensing Approaches for Monitoring Mangrove Species, Structure, and Biomass: Opportunities and Challenges. Remote Sens. 2019, 11, 230. [Google Scholar] [CrossRef]
- Pham, T.D.; Xia, J.; Ha, N.T.; Bui, D.T.; Le, N.N.; Takeuchi, W. A Review of Remote Sensing Approaches for Monitoring Blue Carbon Ecosystems: Mangroves, Seagrassesand Salt Marshes during 2010–2018. Sensors 2019, 19, 1933. [Google Scholar] [CrossRef]
- Yancho, J.M.M.; Jones, T.G.; Gandhi, S.R.; Ferster, C.; Lin, A.; Glass, L. The Google Earth Engine Mangrove Mapping Methodology (GEEMMM). Remote Sens. 2020, 12, 3758. [Google Scholar] [CrossRef]
- Wang, X.; Xiao, X.; Zou, Z.; Hou, L.; Qin, Y.; Dong, J.; Doughty, R.B.; Chen, B.; Zhang, X.; Chen, Y.; et al. Mapping coastal wetlands of China using time series Landsat images in 2018 and Google Earth Engine. ISPRS J. Photogramm. Remote Sens. 2020, 163, 312–326. [Google Scholar] [CrossRef]
- Mahdianpari, M.; Brisco, B.; Granger, J.E.; Mohammadimanesh, F.; Salehi, B.; Banks, S.; Homayouni, S.; Bourgeau-Chavez, L.; Weng, Q. The Second Generation Canadian Wetland Inventory Map at 10 Meters Resolution Using Google Earth Engine. Can. J. Remote Sens. 2020, 46, 360–375. [Google Scholar] [CrossRef]
- Chen, B.; Xiao, X.; Li, X.; Pan, L.; Doughty, R.; Ma, J.; Dong, J.; Qin, Y.; Zhao, B.; Wu, Z.; et al. A mangrove forest map of China in 2015: Analysis of time series Landsat 7/8 and Sentinel-1A imagery in Google Earth Engine cloud computing platform. ISPRS J. Photogramm. Remote Sens. 2017, 131, 104–120. [Google Scholar] [CrossRef]
- Masek, J.G.; Wulder, M.A.; Markham, B.; McCorkel, J.; Crawford, C.J.; Storey, J.; Jenstrom, D.T. Landsat 9: Empowering open science and applications through continuity. Remote Sens. Environ. 2020, 248, 111968. [Google Scholar] [CrossRef]
- Pham, T.D.; Yokoya, N.; Nguyen, T.T.T.; Le, N.N.; Ha, N.T.; Xia, J.; Takeuchi, W.; Pham, T.D. Improvement of Mangrove Soil Carbon Stocks Estimation in North Vietnam Using Sentinel-2 Data and Machine Learning Approach. GISci. Remote Sens. 2021, 58, 68–87. [Google Scholar] [CrossRef]
- Pham, T.D.; Yokoya, N.; Xia, J.; Ha, N.T.; Le, N.N.; Nguyen, T.T.T.; Dao, T.H.; Vu, T.T.P.; Pham, T.D.; Takeuchi, W. Comparison of Machine Learning Methods for Estimating Mangrove Above-Ground Biomass Using Multiple Source Remote Sensing Data in the Red River Delta Biosphere Reserve, Vietnam. Remote Sens. 2020, 12, 1334. [Google Scholar] [CrossRef]
- Seto, K.C.; Fragkias, M. Mangrove conversion and aquaculture development in Vietnam: A remote sensing-based approach for evaluating the Ramsar Convention on Wetlands. Glob. Environ. Change 2007, 17, 486–500. [Google Scholar] [CrossRef]
- Halls, A. Wetlands, Biodiversity and the Ramsar Convention: The Role of the Convention on Wetlands in the Conservation and Wise Use of Biodiversity; Ramsar Convention Bureau: Gland, Switzerland, 1997. [Google Scholar]
- Xia, J.; Yokoya, N.; Pham, T.D. Probabilistic Mangrove Species Mapping with Multiple-Source Remote-Sensing Datasets Using Label Distribution Learning in Xuan Thuy National Park, Vietnam. Remote Sens. 2020, 12, 3834. [Google Scholar] [CrossRef]
- Mai, C.V.; Stive, M.J.F.; Gelder, P.H. Coastal Protection Strategies for the Red River Delta. J. Coast. Res. 2009, 25, 105–116. [Google Scholar] [CrossRef]
- Quartel, S.; Kroon, A.; Augustinus, P.G.E.F.; Van Santen, P.; Tri, N.H. Wave attenuation in coastal mangroves in the Red River Delta, Vietnam. J. Asian Earth Sci. 2007, 29, 576–584. [Google Scholar] [CrossRef]
- Thomas, N.; Bunting, P.; Lucas, R.; Hardy, A.; Rosenqvist, A.; Fatoyinbo, T. Mapping Mangrove Extent and Change: A Globally Applicable Approach. Remote Sens. 2018, 10, 1466. [Google Scholar] [CrossRef]
- Bunting, P.; Rosenqvist, A.; Hilarides, L.; Lucas, R.M.; Thomas, N. Global Mangrove Watch: Updated 2010 Mangrove Forest Extent (v2.5). Remote Sens. 2022, 14, 1034. [Google Scholar] [CrossRef]
- Pham, T.D.; Xia, J.; Baier, G.; Le, N.N.; Yokoya, N. Mangrove Species Mapping Using Sentinel-1 and Sentinel-2 Data in North Vietnam. In Proceedings of IGARSS 2019—2019 IEEE International Geoscience and Remote Sensing Symposium, Yokohama, Japan, 28 July–2 August 2019; pp. 6102–6105. [Google Scholar]
- Rouse, J.W., Jr.; Haas, R.; Schell, J.; Deering, D. Monitoring Vegetation Systems in the Great Plains with ERTS; NASA Special Publication: Washington, DC, USA, 1974. [Google Scholar]
- Liu, H.Q.; Huete, A. A feedback based modification of the NDVI to minimize canopy background and atmospheric noise. IEEE Trans. Geosci. Remote Sens. 1995, 33, 457–465. [Google Scholar] [CrossRef]
- Xiao, X.; Boles, S.; Liu, J.; Zhuang, D.; Liu, M. Characterization of forest types in Northeastern China, using multi-temporal SPOT-4 VEGETATION sensor data. Remote Sens. Environ. 2002, 82, 335–348. [Google Scholar] [CrossRef]
- Xu, H. Modification of normalised difference water index (NDWI) to enhance open water features in remotely sensed imagery. Int. J. Remote Sens. 2006, 27, 3025–3033. [Google Scholar] [CrossRef]
- Ha, N.T.; Manley-Harris, M.; Pham, T.D.; Hawes, I. A Comparative Assessment of Ensemble-Based Machine Learning and Maximum Likelihood Methods for Mapping Seagrass Using Sentinel-2 Imagery in Tauranga Harbor, New Zealand. Remote Sens. 2020, 12, 355. [Google Scholar] [CrossRef]
- Quang, N.H.; Quinn, C.H.; Stringer, L.C.; Carrie, R.; Hackney, C.R.; Van Hue, L.T.; Van Tan, D.; Nga, P.T.T. Multi-Decadal Changes in Mangrove Extent, Age and Species in the Red River Estuaries of Viet Nam. Remote Sens. 2020, 12, 2289. [Google Scholar] [CrossRef]
- Nguyen, H.-H.; Tran, L.T.N.; Le, A.T.; Nghia, N.H.; Duong, L.V.K.; Nguyen, H.T.T.; Bohm, S.; Premnath, C.F.S. Monitoring Changes in Coastal Mangrove Extents Using Multi-Temporal Satellite Data in Selected Communes, Hai Phong City, Vietnam. For. Soc. 2020, 4, 256–270. [Google Scholar] [CrossRef]
- Hauser, L.T.; An Binh, N.; Viet Hoa, P.; Hong Quan, N.; Timmermans, J. Gap-Free Monitoring of Annual Mangrove Forest Dynamics in Ca Mau Province, Vietnamese Mekong Delta, Using the Landsat-7-8 Archives and Post-Classification Temporal Optimization. Remote Sens. 2020, 12, 3729. [Google Scholar] [CrossRef]
- Phan, D.C.; Trung, T.H.; Truong, V.T.; Sasagawa, T.; Vu, T.P.T.; Bui, D.T.; Hayashi, M.; Tadono, T.; Nasahara, K.N. First comprehensive quantification of annual land use/cover from 1990 to 2020 across mainland Vietnam. Sci. Rep. 2021, 11, 9979. [Google Scholar] [CrossRef]
- Truong, V.T.; Hoang, T.T.; Cao, D.P.; Hayashi, M.; Tadono, T.; Nasahara, K.N. JAXA Annual Forest Cover Maps for Vietnam during 2015–2018 Using ALOS-2/PALSAR-2 and Auxiliary Data. Remote Sens. 2019, 11, 2412. [Google Scholar] [CrossRef]
- Pham, T.D.; Yoshino, K. Impacts of mangrove management systems on mangrove changes in the Northern Coast of Vietnam. Tropics 2016, 24, 141–151. [Google Scholar] [CrossRef] [Green Version]
- Phuong, N.C.; Richard, J. Economic Transition and Accounting System Reform in Vietnam. Eur. Account. Rev. 2011, 20, 693–725. [Google Scholar] [CrossRef]
- Leslie, M.; Nguyen, S.T.; Nguyen, T.K.D.; Pham, T.T.; Cao, T.T.N.; Le, T.Q.; Dang, T.T.; Nguyen, T.H.T.; Nguyen, T.B.N.; Le, H.N.; et al. Bringing social and cultural considerations into environmental management for vulnerable coastal communities: Responses to environmental change in Xuan Thuy National Park, Nam Dinh Province, Vietnam. Ocean. Coast. Manag. 2018, 158, 32–44. [Google Scholar] [CrossRef]
- Hai, N.T.; Dell, B.; Phuong, V.T.; Harper, R.J. Towards a more robust approach for the restoration of mangroves in Vietnam. Ann. For. Sci. 2020, 77, 18. [Google Scholar] [CrossRef]
- Nguyen, H.T.; Yoneda, R.; Ninomiya, I.; Harada, K.; Dao, T.V.; Sy, T.M.; Phan, H.N. The effects of stand-age and inundation on carbon accumulation in mangrove plantation soil in Namdinh, Northern Vietnam. Tropics 2004, 14, 21–37. [Google Scholar] [CrossRef]
- Powell, N.; Osbeck, M.; Tan, S.B.; Toan, V.C. Mangrove restoration and rehabilitation for climate change adaptation in Vietnam. In World Resources Report Case Study; World Resources Report; World Resources: Washington, DC, USA, 2011; Available online: http://www.worldresourcesreport.org (accessed on 25 November 2021).
- Nguyen, T.P.; Van Tam, N.; Quoi, L.P.; Parnell, K.E. Community perspectives on an internationally funded mangrove restoration project: Kien Giang province, Vietnam. Ocean. Coast. Manag. 2016, 119, 146–154. [Google Scholar] [CrossRef]
- Pham, T.T.; Vu, T.P.; Hoang, T.L.; Dao, T.L.C.; Nguyen, D.T.; Pham, D.C.; Dao, L.H.T.; Nguyen, V.T.; Hoang, N.V.H. The Effectiveness of Financial Incentives for Addressing Mangrove Loss in Northern Vietnam. Front. For. Glob. Change 2022, 4, 709073. [Google Scholar] [CrossRef]


| Sensor | Spatial Resolution (m) | Path/Row | Year | Band Used |
|---|---|---|---|---|
| Landsat-5 TM | 30 | 126/46 | 1990, 1995, 2005, 2010 | Blue, Green, Red, NIR, SWIR |
| Landsat-7 ETM+ | 30 | 126/46 | 2000 | |
| Landsat-8 OLI | 30 | 126/46 | 2015, 2020 | |
| Landsat-9 OLI-2 | 30 | 126/26 | 2022 |
| Reference Pixels | |||||
|---|---|---|---|---|---|
| Predicted pixels | Class | Mangrove | Non-mangrove | Total | User’s accuracy |
| Mangrove | 221 | 22 | 243 | 90.95% | |
| Non-mangrove | 2 | 229 | 231 | 99.13% | |
| Total | 223 | 251 | 474 | ||
| Producer’s Accuracy | 99.10% | 88.18% | |||
| Overall accuracy | 94.94% | ||||
| Kappa coefficient | 0.90 | ||||
| Reference Pixels | |||||
|---|---|---|---|---|---|
| Predicted pixels | Class | Mangrove | Non-mangrove | Total | User’s accuracy |
| Mangrove | 210 | 33 | 243 | 86.42% | |
| Non-mangrove | 5 | 226 | 231 | 97.84% | |
| Total | 215 | 259 | 474 | ||
| Producer’s Accuracy | 97.70% | 87.26% | |||
| Overall accuracy | 91.98% | ||||
| Kappa coefficient | 0.84 | ||||
| Year/Province | Hai Phong (ha) | Nam Dinh (ha) | Thai Binh (ha) | Total (ha) |
|---|---|---|---|---|
| 1990 | 1433 | 459 | 1068 | 2960 |
| 1995 | 1190 | 776 | 442 | 2408 |
| 1990–1995 | −243 | 317 | −626 | −552 |
| 2000 | 1495 | 1335 | 1605 | 4435 |
| 1995–2000 | 305 | 559 | 1163 | 2027 |
| 2005 | 1061 | 1287 | 1154 | 3502 |
| 2000–2005 | −434 | −48 | −451 | −933 |
| 2010 | 1628 | 1564 | 1514 | 4706 |
| 2005–2010 | 567 | 277 | 360 | 1204 |
| 2015 | 3065 | 2781 | 2333 | 8179 |
| 2010–2015 | 1437 | 1217 | 819 | 3473 |
| 2020 | 3790 | 3325 | 3010 | 10,125 |
| 2015–2020 | 725 | 544 | 677 | 1946 |
| 2022 | 3934 | 3591 | 3195 | 10,630 |
| 2020–2022 | 144 | 176 | 185 | 505 |
Publisher’s Note: MDPI stays neutral with regard to jurisdictional claims in published maps and institutional affiliations. |
© 2022 by the authors. Licensee MDPI, Basel, Switzerland. This article is an open access article distributed under the terms and conditions of the Creative Commons Attribution (CC BY) license (https://creativecommons.org/licenses/by/4.0/).
Share and Cite
Vu, T.T.P.; Pham, T.D.; Saintilan, N.; Skidmore, A.; Luu, H.V.; Vu, Q.H.; Le, N.N.; Nguyen, H.Q.; Matsushita, B. Mapping Multi-Decadal Mangrove Extent in the Northern Coast of Vietnam Using Landsat Time-Series Data on Google Earth Engine Platform. Remote Sens. 2022, 14, 4664. https://doi.org/10.3390/rs14184664
Vu TTP, Pham TD, Saintilan N, Skidmore A, Luu HV, Vu QH, Le NN, Nguyen HQ, Matsushita B. Mapping Multi-Decadal Mangrove Extent in the Northern Coast of Vietnam Using Landsat Time-Series Data on Google Earth Engine Platform. Remote Sensing. 2022; 14(18):4664. https://doi.org/10.3390/rs14184664
Chicago/Turabian StyleVu, Thuy Thi Phuong, Tien Dat Pham, Neil Saintilan, Andrew Skidmore, Hung Viet Luu, Quang Hien Vu, Nga Nhu Le, Huu Quang Nguyen, and Bunkei Matsushita. 2022. "Mapping Multi-Decadal Mangrove Extent in the Northern Coast of Vietnam Using Landsat Time-Series Data on Google Earth Engine Platform" Remote Sensing 14, no. 18: 4664. https://doi.org/10.3390/rs14184664