
Multiscale Diagnosis of Mangrove Status in Data-Poor Context Using Very High Spatial Resolution Satellite Images: A Case Study in Pichavaram Mangrove Forest, Tamil Nadu, India

 , , , , , , ,
Abstract
:1. Introduction
2. Materials and Methods
2.1. Study Area
2.2. Data
2.2.1. VHSR Satellite Imagery
2.2.2. In Situ Water Quality
2.2.3. Meteorological Observations
2.3. Methods
2.3.1. Supervised Classification
2.3.2. Land-Cover Change Detection
2.3.3. Mangrove Cover Change in Fishbone Plantations
2.3.4. Delineation of Dieback Areas
3. Results
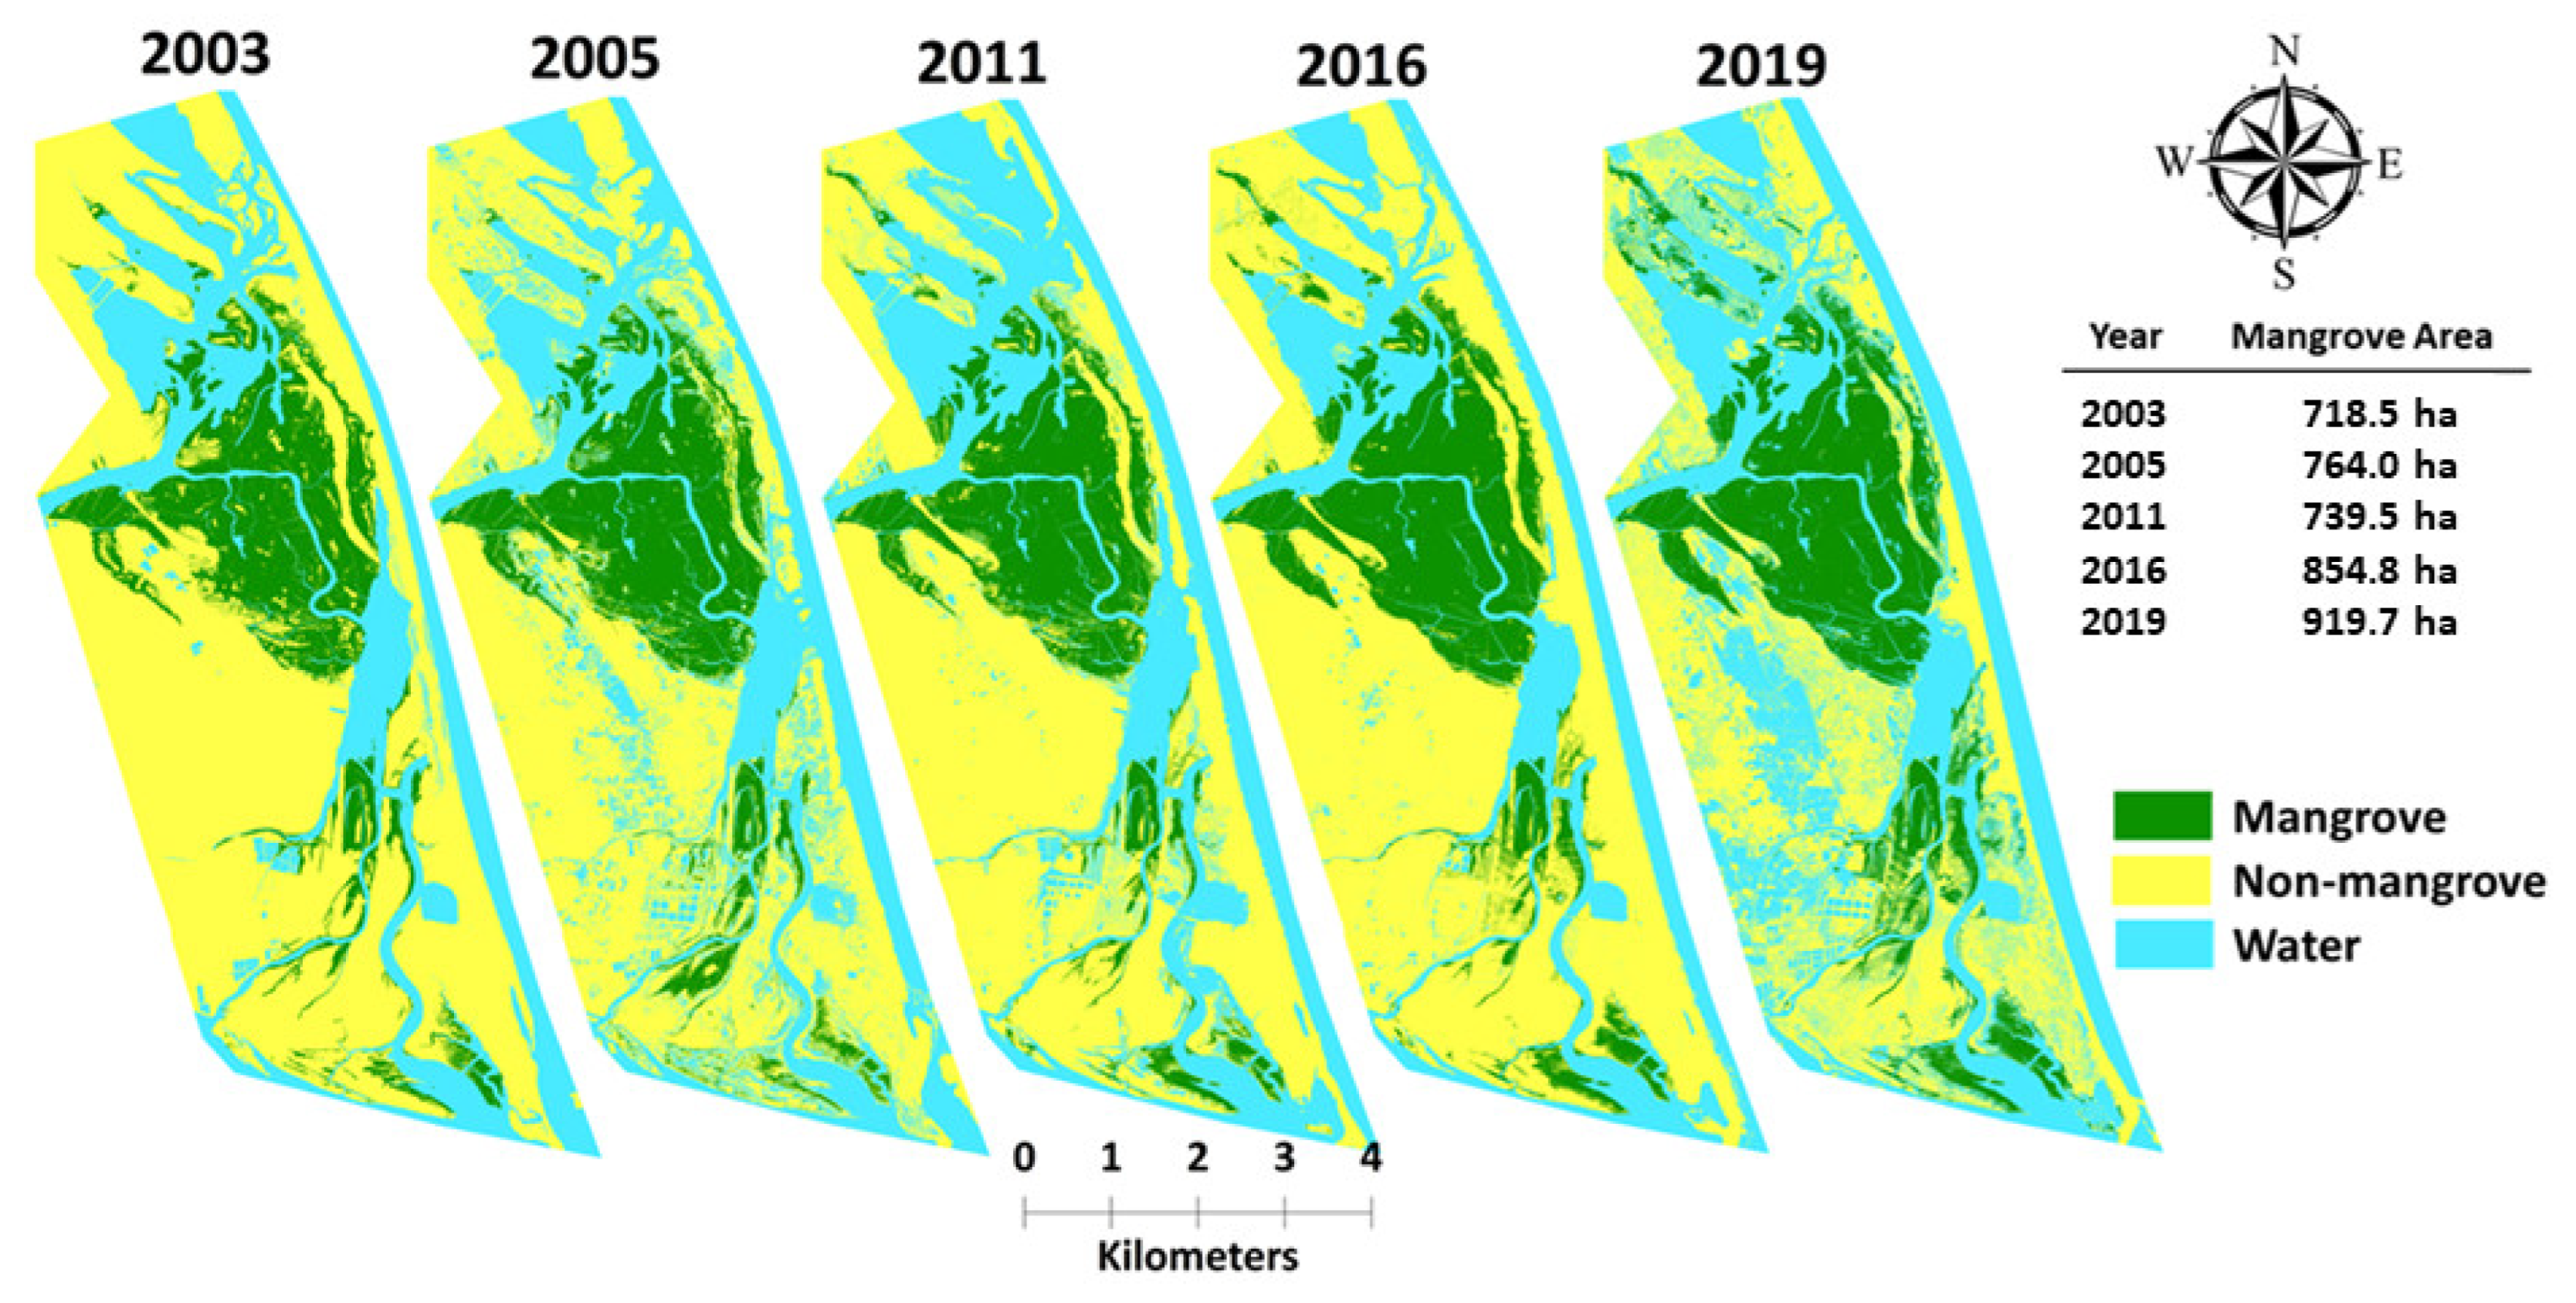
3.1. Supervised Classification
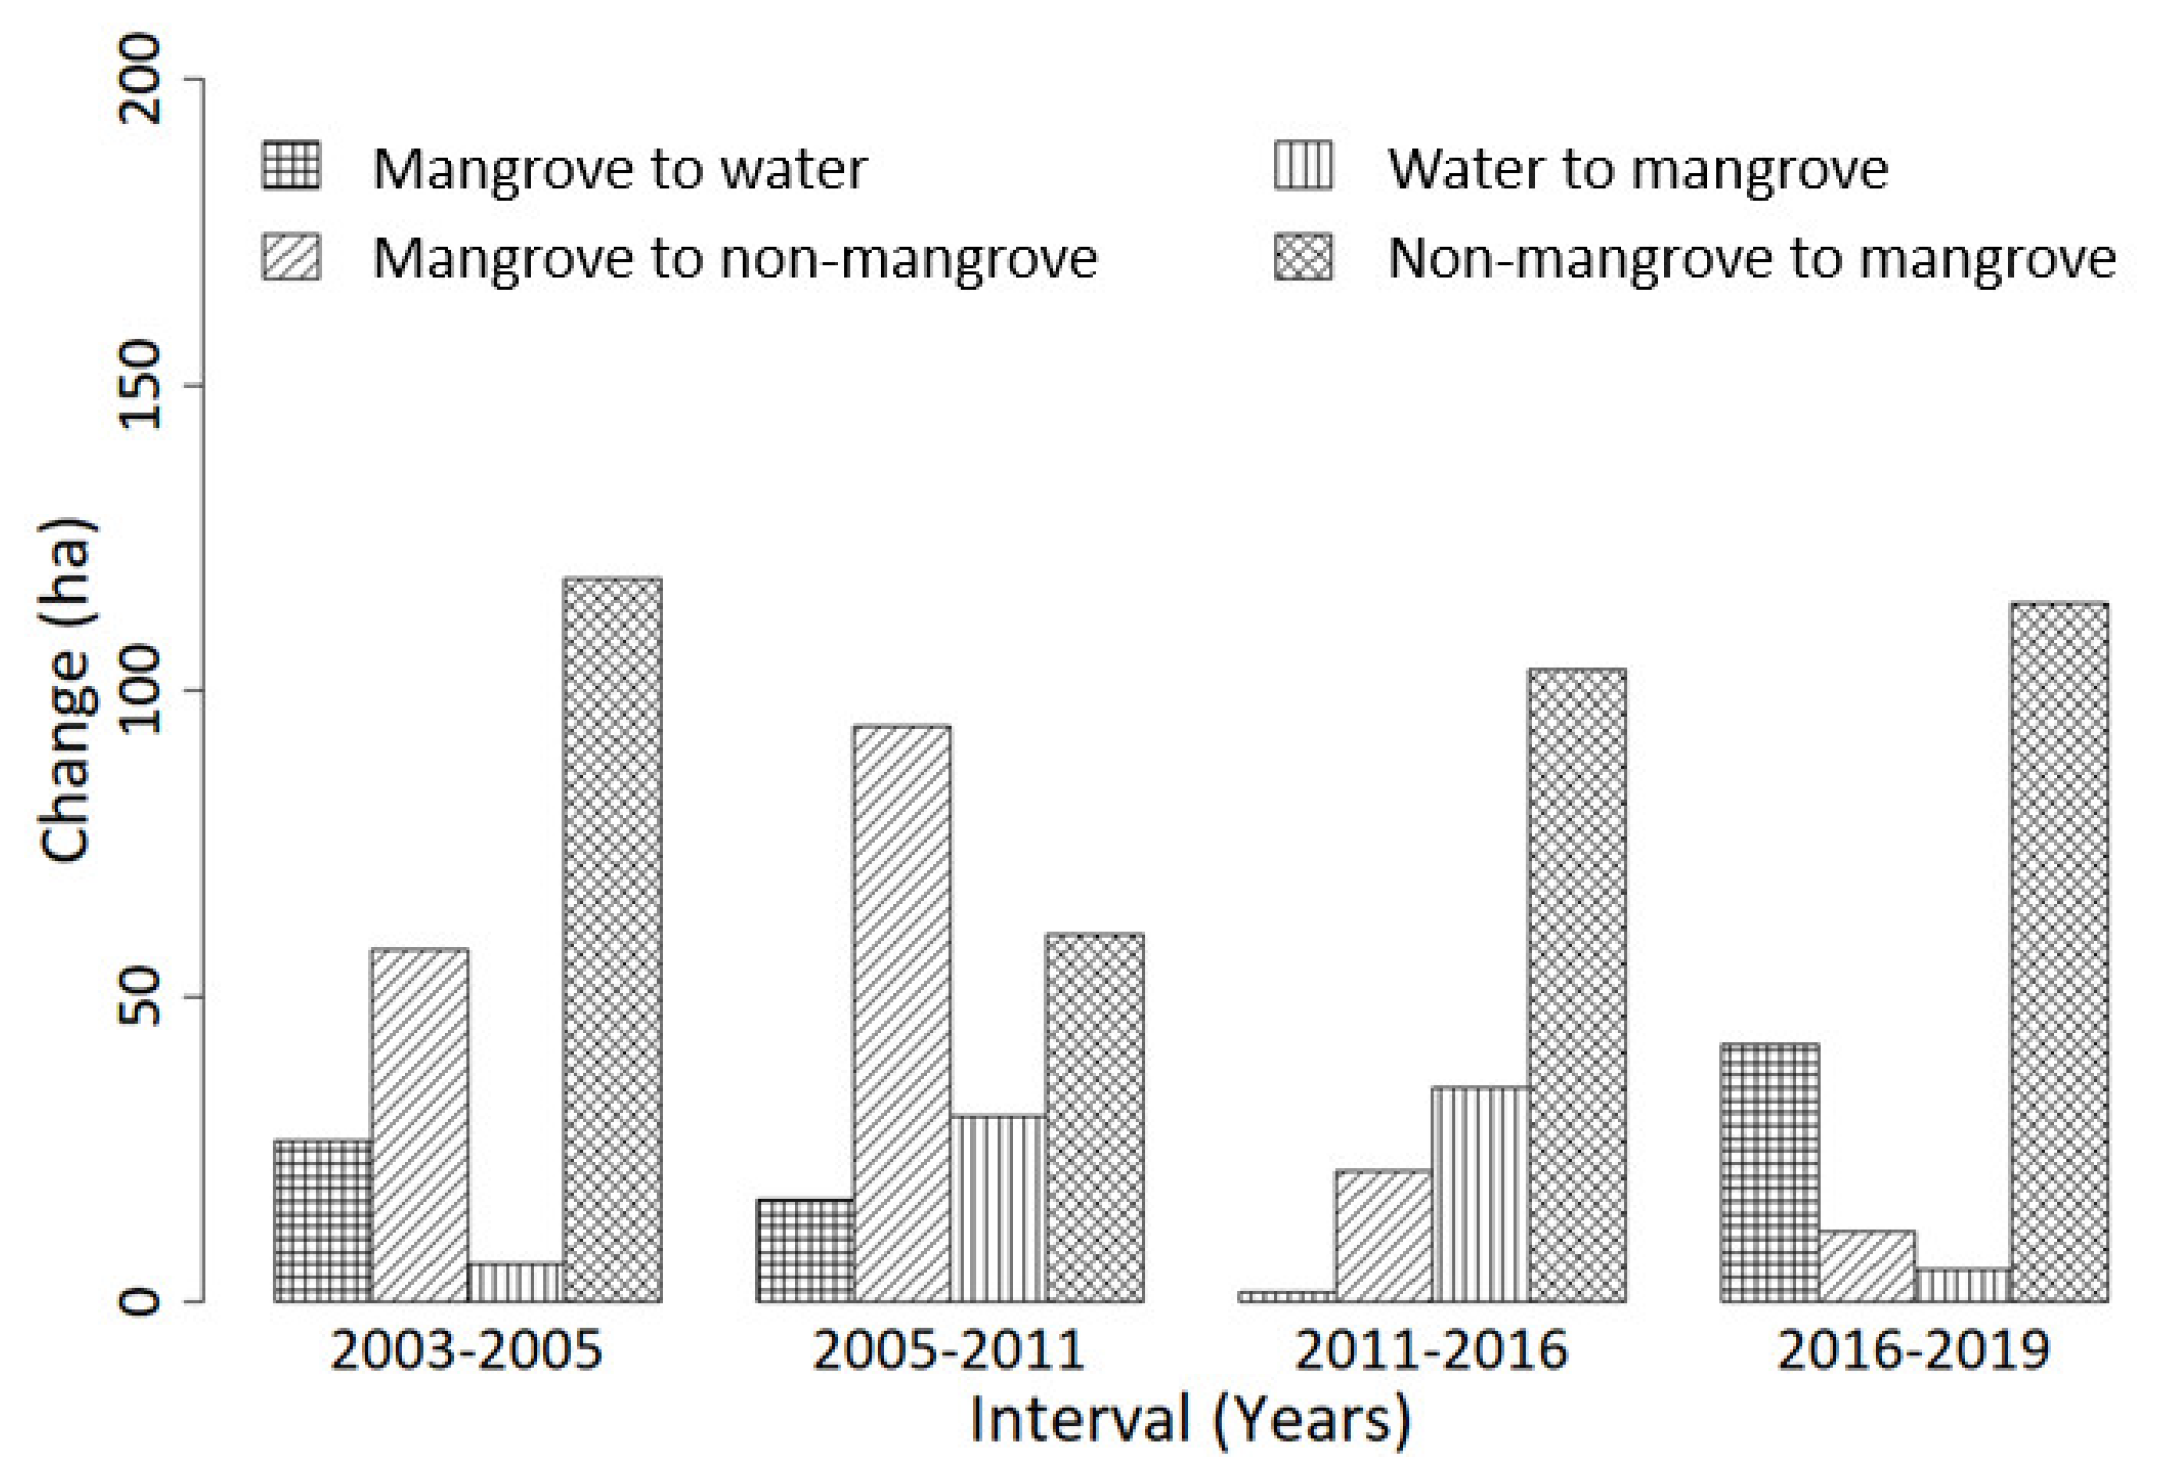
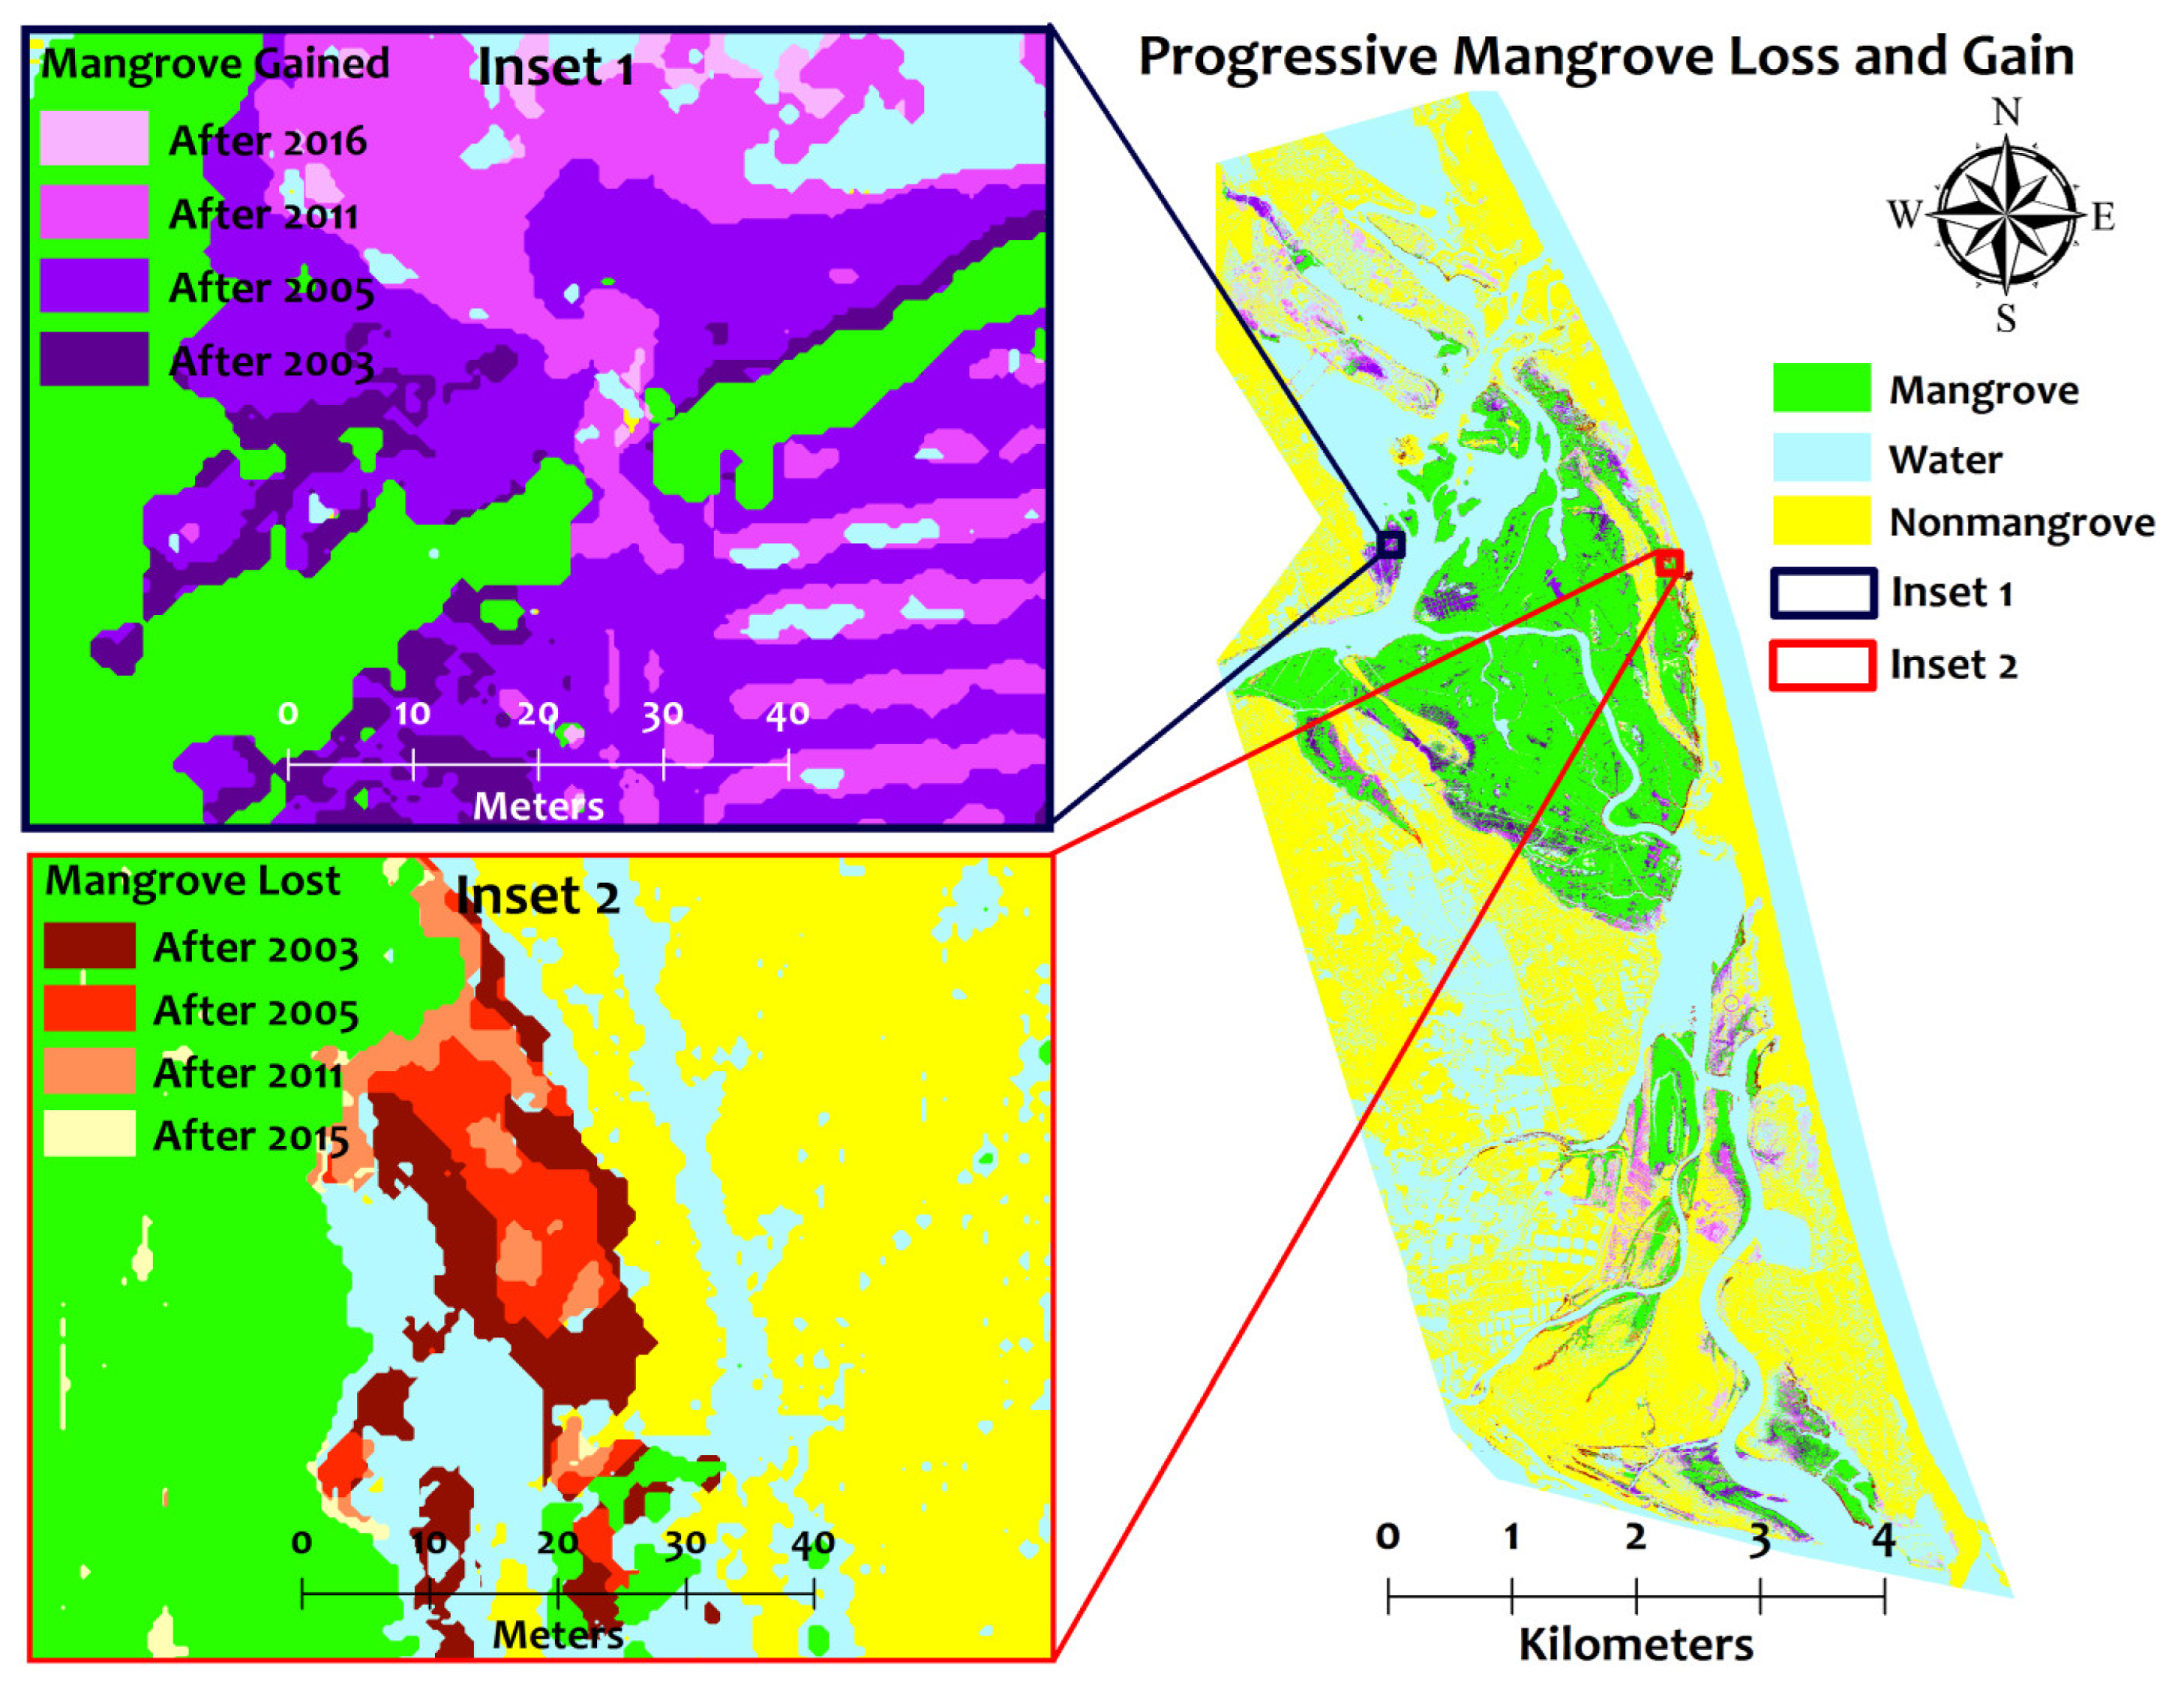
3.2. Change Detection and Analysis
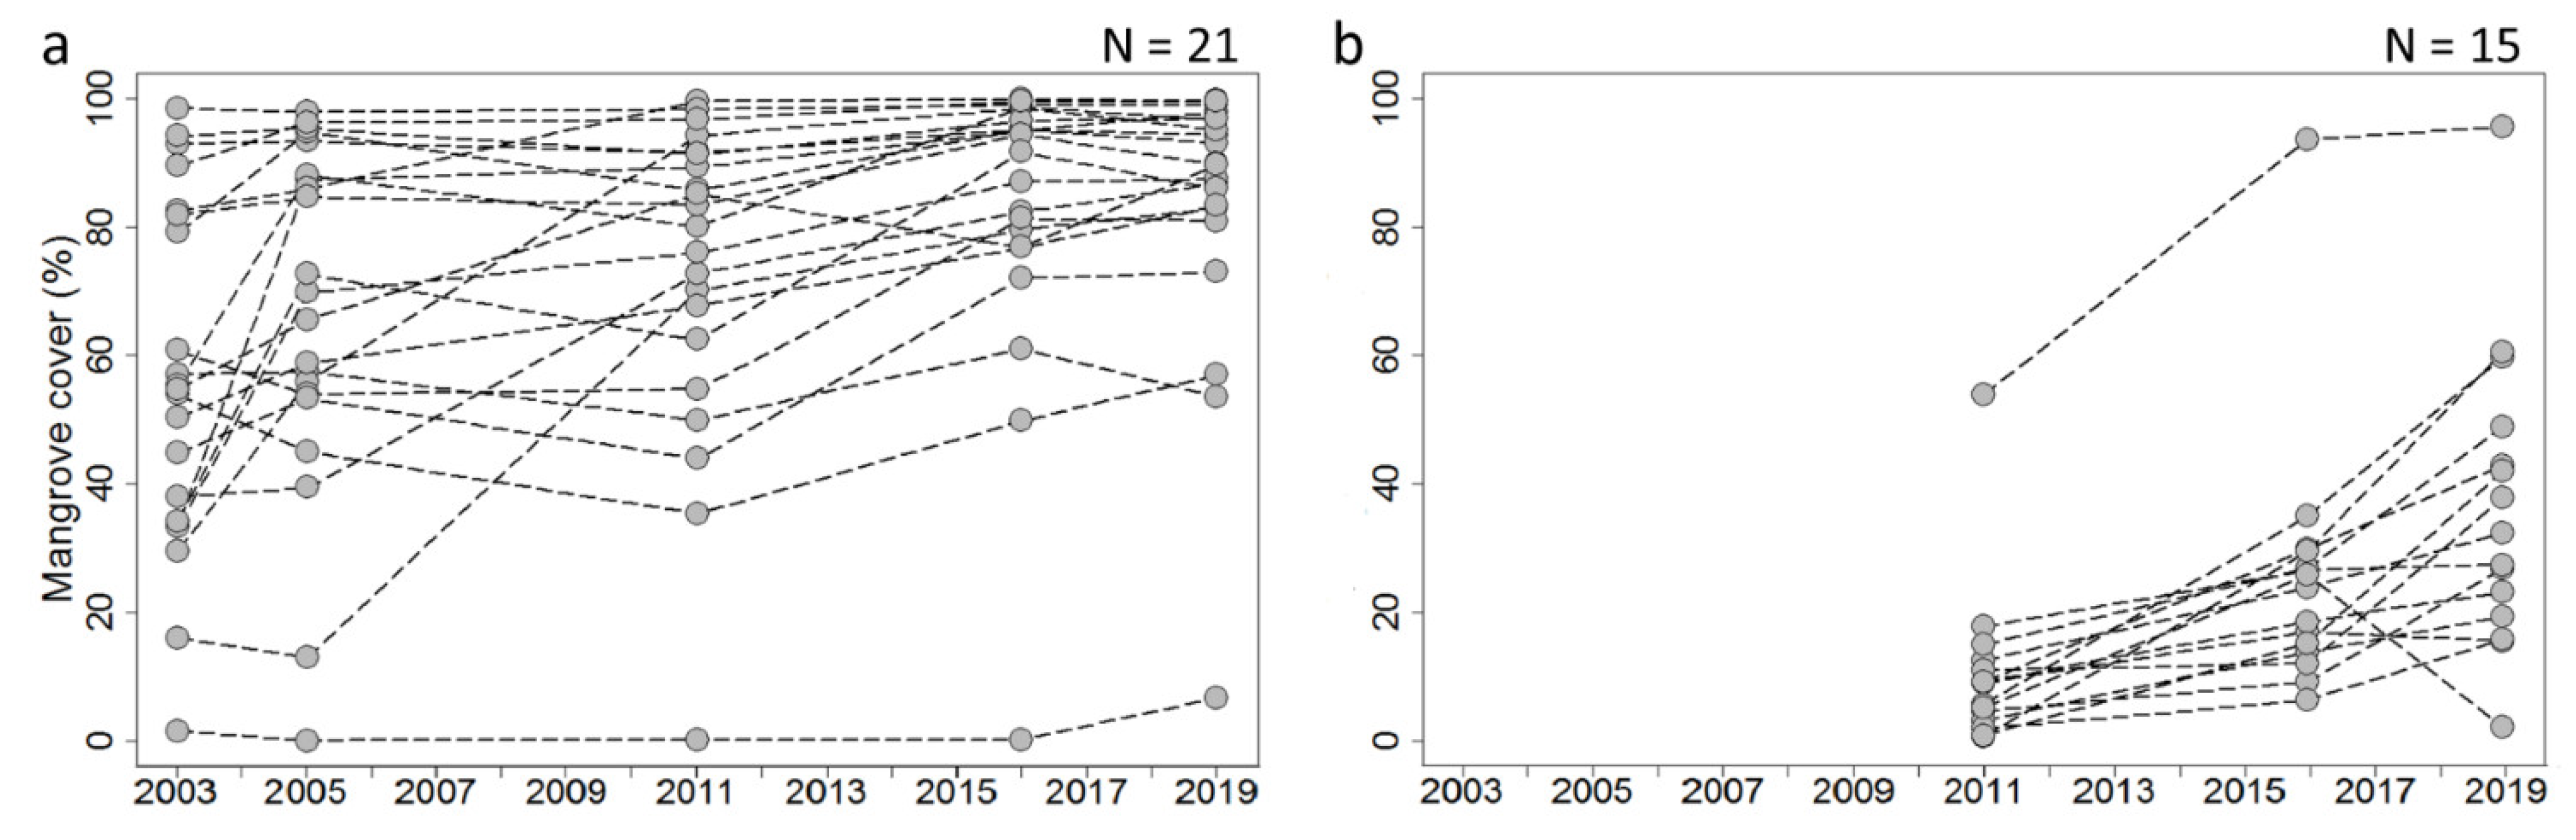
3.2.1. Change in Mangrove Cover within Fishbone Plantations
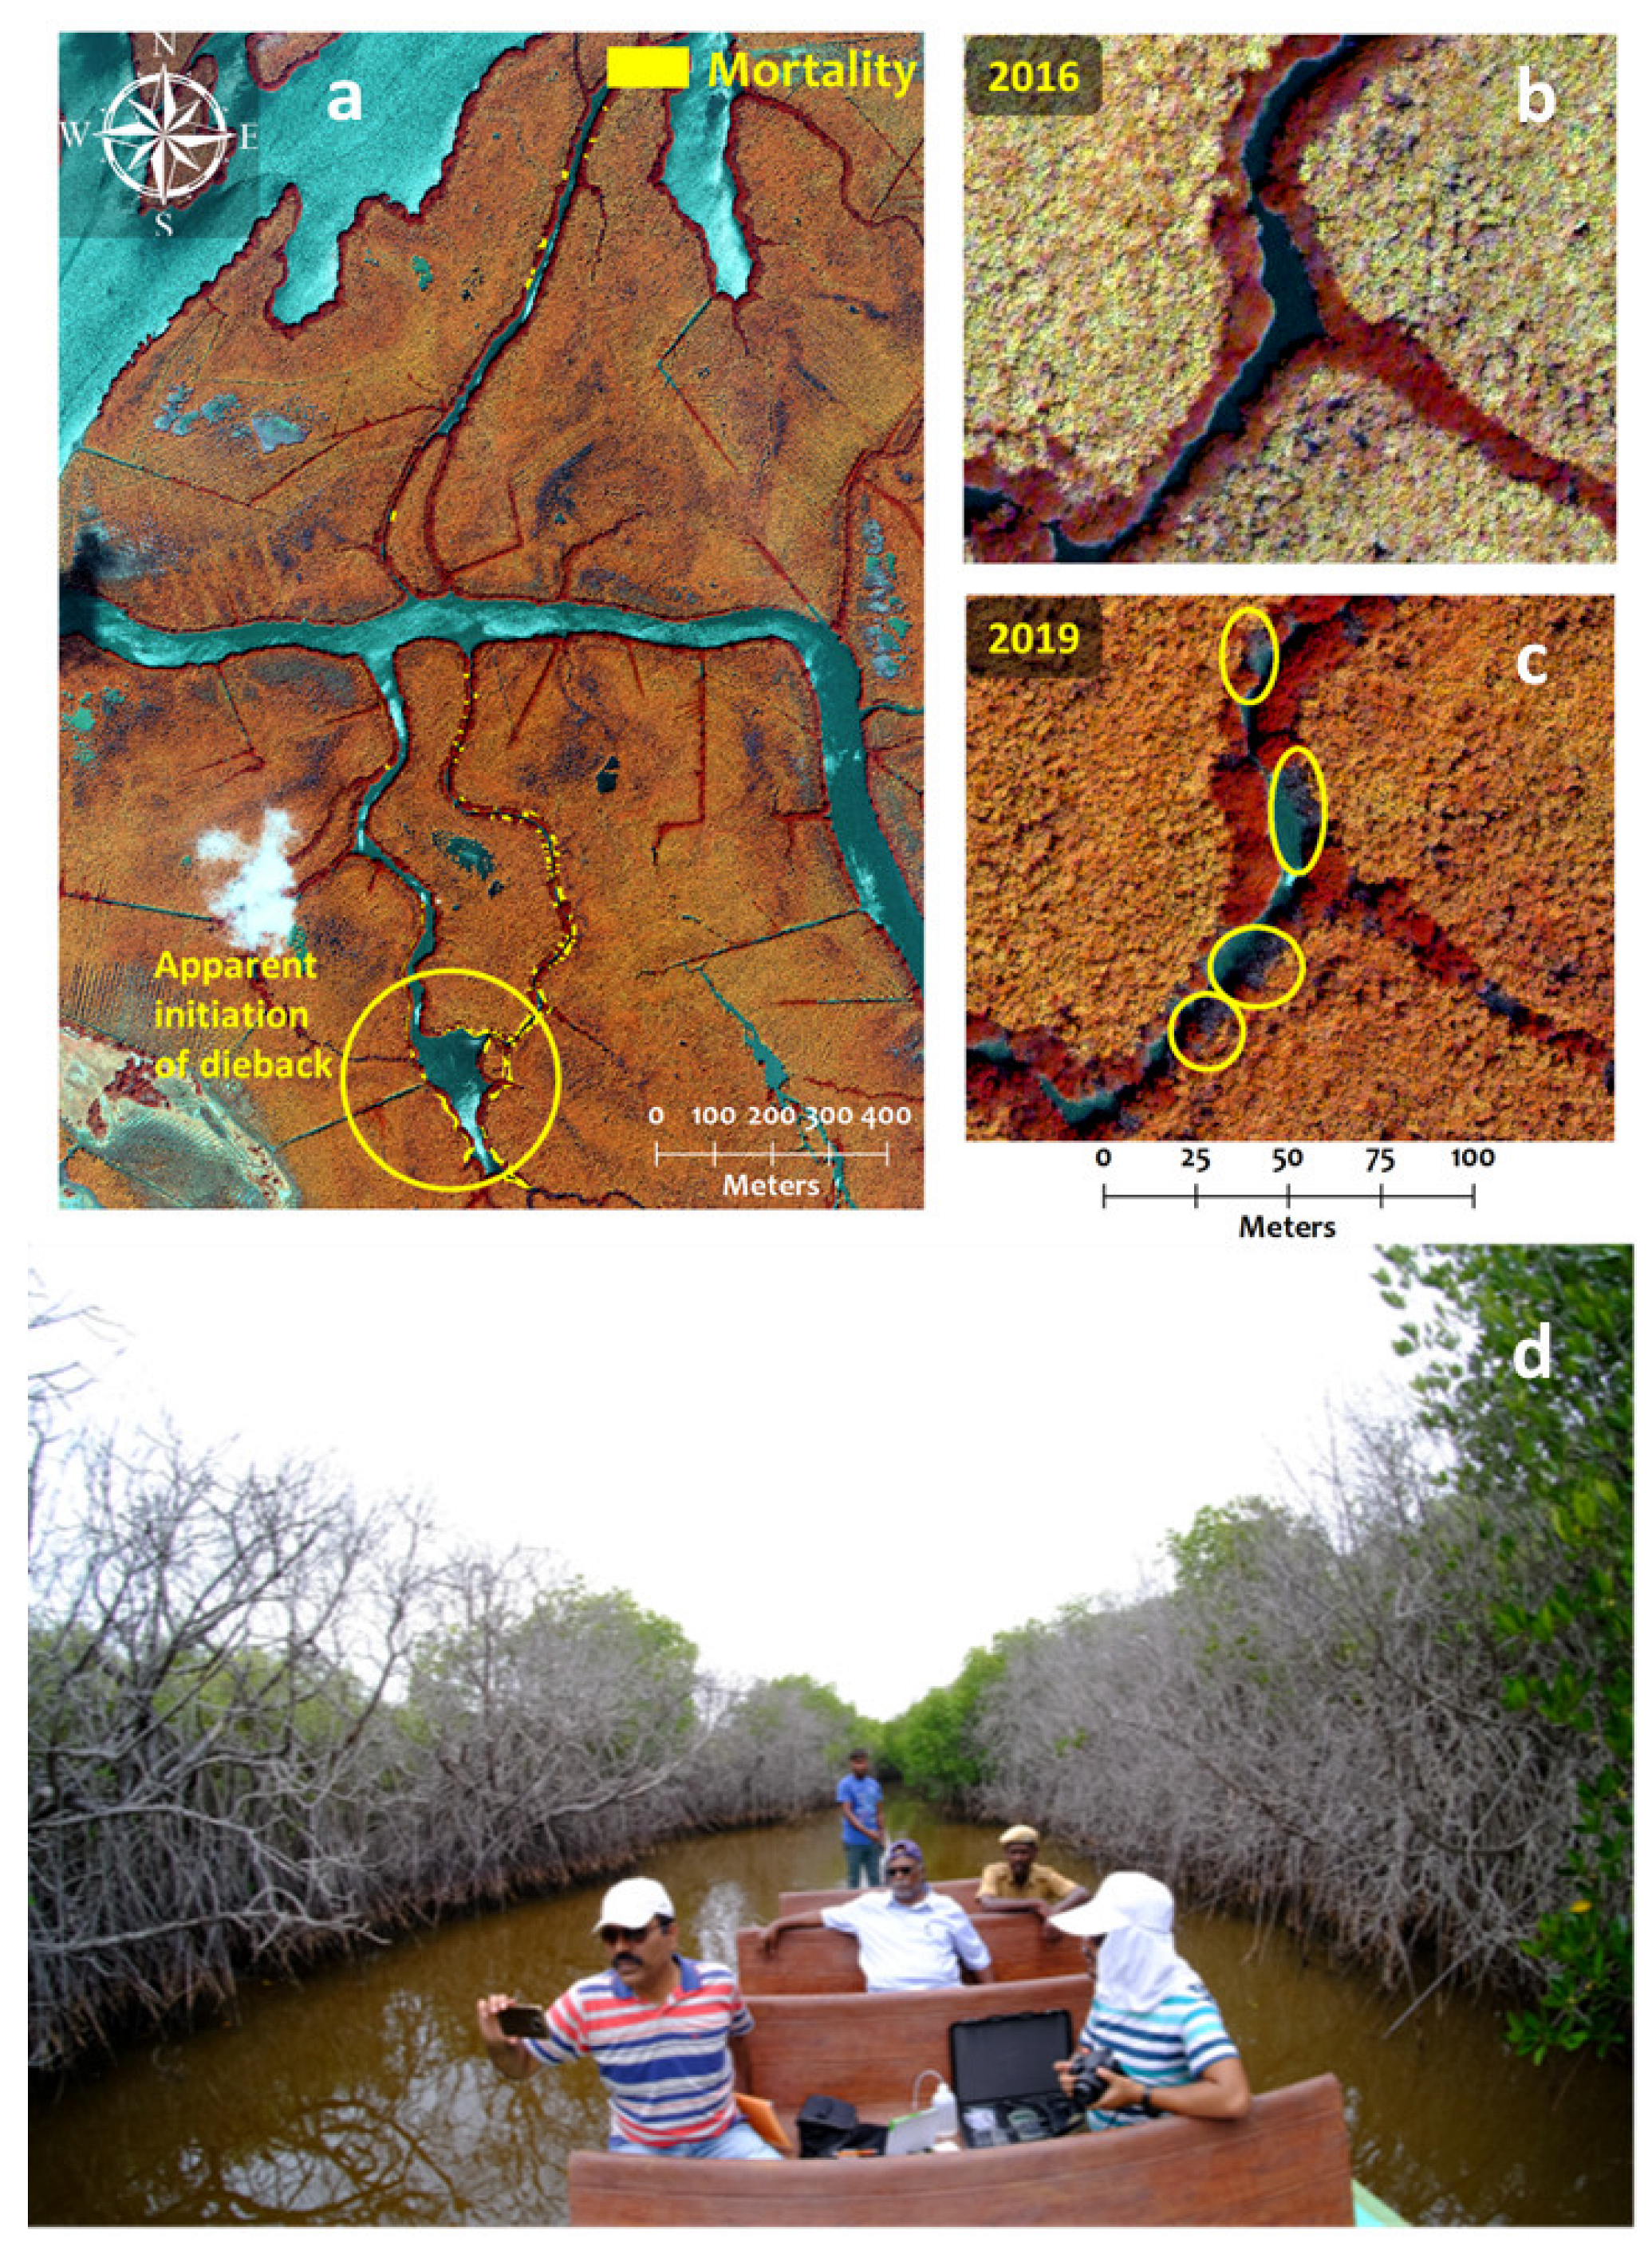
3.2.2. Dieback in Natural Mangroves
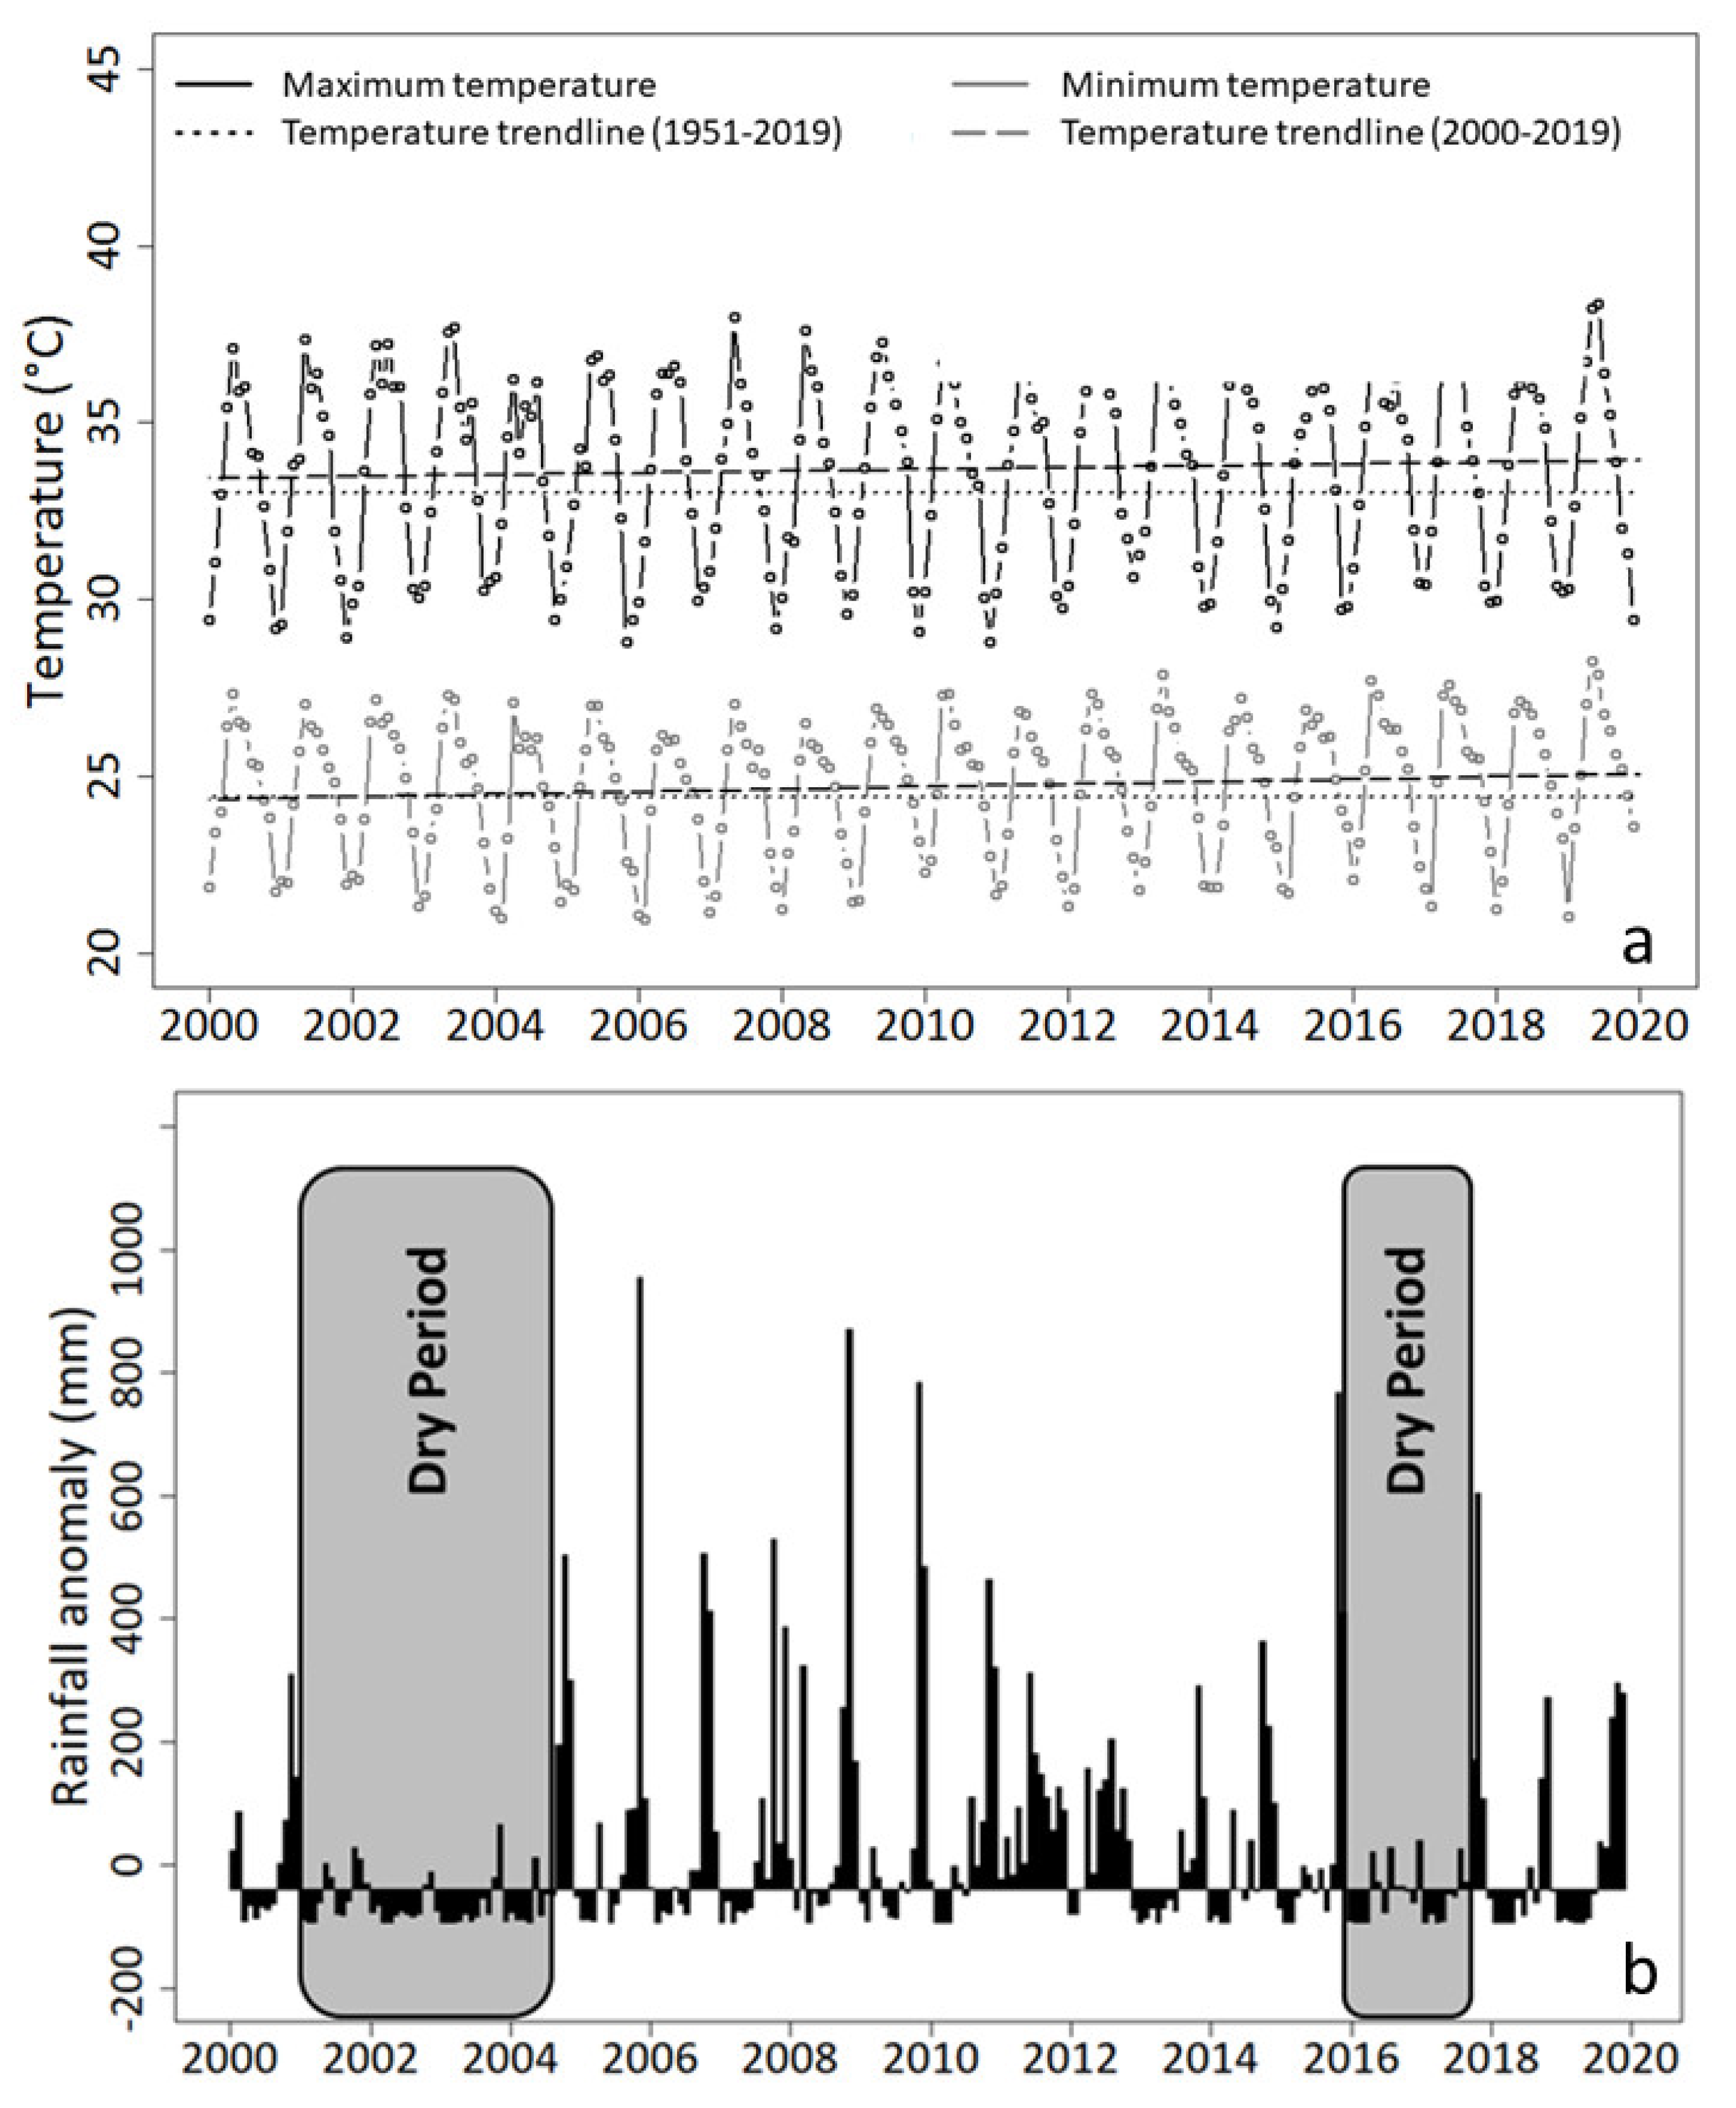
3.2.3. Additional Diagnostics Based on Meteorological Observations and Water Salinity
4. Discussion
4.1. Mangrove Cover Estimates Using Very High Spatial versus Moderate Spatial Resolution Images
4.2. Monitoring Spatio-Temporal Changes in Mangroves Using Time Series of VHSR Images
4.3. Preliminary Diagnosis for the Pichavaram Mangroves
4.3.1. Land-Cover Conversion to Mangrove Area
4.3.2. Mangrove Cover Fluctuations
4.3.3. Effects of Tsunami and Shoreline Erosion
4.3.4. Agriculture, Aquaculture and Other Developmental Activities
4.3.5. On the Mangrove Rehabilitation Efficiency
4.3.6. Mangrove Dieback
4.4. Preliminary Recommendations for the Pichavaram Mangroves
5. Conclusions
Author Contributions
Funding
Data Availability Statement
Acknowledgments
Conflicts of Interest
References
- Ellison, J.C. (Ed.) Biogeomorphology of Mangroves; Elsevier: Amsterdam, The Netherlands, 2019; pp. 687–715. [Google Scholar] [CrossRef]
- Rovai, A.S.; Riul, P.; Twilley, R.R.; Castañeda-Moya, E.; Rivera-Monroy, V.H.; Williams, A.A.; Simard, M.; Cifuentes-Jara, M.; Lewis, R.R.; Crooks, S.; et al. Scaling mangrove aboveground biomass from site-level to continental-scale. Glob. Ecol. Biogeogr. 2016, 25, 286–298. [Google Scholar] [CrossRef]
- Bunting, P.; Rosenqvist, A.; Hilarides, L.; Lucas, R.M.; Thomas, N. Global Mangrove Watch: Updated 2010 Mangrove Forest Extent (v2.5). Remote Sens. 2022, 14, 1034. [Google Scholar] [CrossRef]
- Duke, N.C.; Meynecke, J.O.; Dittmann, S.; Ellison, A.M.; Anger, K.; Berger, U.; Cannicci, S.; Diele, K.; Ewel, K.C.; Field, C.D.; et al. A world without mangroves? Science 2007, 317, 41–42. [Google Scholar] [CrossRef] [Green Version]
- Giri, C.; Ochieng, E.; Tieszen, L.L.; Zhu, Z.; Singh, A.; Loveland, T.; Masek, J.; Duke, N. Status and distribution of mangrove forests of the world using earth observation satellite data. Glob. Ecol. Biogeogr. 2011, 20, 154–159. [Google Scholar] [CrossRef]
- Spalding, M. World Atlas of Mangroves, 1st ed.; Routledge: London, UK, 2010. [Google Scholar] [CrossRef]
- Spalding, M.D.; Blasco, F.; Field, C.D. World Mangrove Atlas; The International Society for Mangrove Ecosystems: Okinawa, Japan, 1997; p. 178. Available online: http://www.archive.org/details/worldmangroveatl97spal (accessed on 1 April 2022).
- Thomas, N.; Lucas, R.; Bunting, P.; Hardy, A.; Rosenqvist, A.; Simard, M. Distribution and drivers of global mangrove forest change, 1996–2010. PLoS ONE 2017, 12, e0179302. [Google Scholar] [CrossRef] [Green Version]
- Valiela, I.; Bowen, J.L.; York, J.K. Mangrove forests: One of the world’s threatened major tropical environments. BioScience 2001, 51, 807–815. [Google Scholar] [CrossRef] [Green Version]
- Hamilton, S.E.; Casey, D. Creation of a high spatio-temporal resolution global database of continuous mangrove forest cover for the 21st century (CGMFC-21). Glob. Ecol. Biogeogr. 2016, 25, 729–738. [Google Scholar] [CrossRef]
- Goldberg, L.; Lagomasino, D.; Thomas, N.; Fatoyinbo, T. Global declines in human-driven mangrove loss. Glob. Chang. Biol. 2020, 26, 5844–5855. [Google Scholar] [CrossRef]
- Giri, C.; Long, J.; Abbas, S.; Murali, R.M.; Qamer, F.M.; Pengra, B.; Thau, D. Distribution and dynamics of mangrove forests of South Asia. J. Environ. Manag. 2015, 148, 101–111. [Google Scholar] [CrossRef]
- Richards, D.R.; Friess, D.A. Rates and drivers of mangrove deforestation in Southeast Asia, 2000–2012. Proc. Natl. Acad. Sci. USA 2016, 113, 344–349. [Google Scholar] [CrossRef] [Green Version]
- Giri, C.; Zhu, Z.; Tieszen, L.L.; Singh, A.; Gillette, S.; Kelmelis, J.A. Mangrove forest distributions and dynamics (1975–2005) of the tsunami-affected region of Asia. J. Biogeogr. 2008, 35, 519–528. [Google Scholar] [CrossRef]
- Nordhaus, I.; Toben, M.; Fauziyah, A. Impact of deforestation on mangrove tree diversity, biomass and community dynamics in the Segara Anakan lagoon, Java, Indonesia: A ten-year perspective. Estuar. Coast. Shelf Sci. 2019, 227, 106300. [Google Scholar] [CrossRef]
- Queiroz, L.D.; Rossi, S.; Calvet-Mir, L.; Ruiz-Mallen, I.; Garcia-Betorz, S.; Salva-Prat, J.; Meireles, A.J.D. Neglected ecosystem services: Highlighting the socio-cultural perception of mangroves in decision-making processes. Ecosyst. Serv. 2017, 26, 137–145. [Google Scholar] [CrossRef]
- Lewis, R.R.; Milbrandt, E.C.; Brown, B.; Krauss, K.W.; Rovai, A.S.; Beever Iii, J.W.; Flynn, L.L. Stress in mangrove forests: Early detection and preemptive rehabilitation are essential for future successful worldwide mangrove forest management. Mar. Pollut. Bull. 2016, 109, 764–771. [Google Scholar] [CrossRef]
- Proisy, C.; Viennois, G.; Sidik, F.; Andayani, A.; Enright, J.A.; Guitet, S.; Gusmawati, N.; Lemonnier, H.; Muthusankar, G.; Olagoke, A.; et al. Monitoring mangrove forests after aquaculture abandonment using time series of very high spatial resolution satellite images: A case study from the Perancak estuary, Bali, Indonesia. Mar. Pollut. Bull. 2018, 131, 61–71. [Google Scholar] [CrossRef] [Green Version]
- Wang, L.; Jia, M.; Yin, D.; Tian, J. A review of remote sensing for mangrove forests: 1956–2018. Remote Sens. Environ. 2019, 231, 111223. [Google Scholar] [CrossRef]
- Rahman, M.M.; Lagomasino, D.; Lee, S.; Fatoyinbo, T.; Ahmed, I.; Kanzaki, M. Improved assessment of mangrove forests in Sundarbans East Wildlife Sanctuary using WorldView 2 and TanDEM-X high resolution imagery. Remote Sens. Ecol. Conserv. 2019, 5, 136–149. [Google Scholar] [CrossRef]
- Everitt, J.H.; Yang, C.; Sriharan, S.; Judd, F.W. Using High Resolution Satellite Imagery to Map Black Mangrove on the Texas Gulf Coast. J. Coast. Res. 2008, 2008, 1582–1586. [Google Scholar] [CrossRef]
- Neukermans, G.; Dahdouh-Guebas, F.; Kairo, J.G.; Koedam, N. Mangrove species and stand mapping in Gazi bay (Kenya) using Quickbird satellite imagery. J. Spat. Sci. 2008, 53, 75–86. [Google Scholar] [CrossRef]
- Lee, T.-M.; Yeh, H.-C. Applying remote sensing techniques to monitor shifting wetland vegetation: A case study of Danshui River estuary mangrove communities, Taiwan. Ecol. Eng. 2009, 35, 487–496. [Google Scholar] [CrossRef]
- Wang, L.; Sousa, W.P.; Gong, P.; Biging, G.S. Comparison of IKONOS and QuickBird images for mapping mangrove species on the Caribbean coast of Panama. Remote Sens. Environ. 2004, 91, 432–440. [Google Scholar] [CrossRef]
- Proisy, C.; Féret, J.-B.; Lauret, N.; Gastellu-Etchegorry, J.-P. (Eds.) Mangrove Forest Dynamics Using Very High Spatial Resolution Optical Remote Sensing; Elsevier: Paris, France, 2016; Volume 7, pp. 269–295. [Google Scholar] [CrossRef]
- Proisy, C.; Couteron, P.; Fromard, F. Predicting and mapping mangrove biomass from canopy grain analysis using Fourier-based textural ordination of IKONOS images. Remote Sens. Environ. 2007, 109, 379–392. [Google Scholar] [CrossRef]
- Taureau, F.; Robin, M.; Proisy, C.; Fromard, F.; Imbert, D.; Debaine, F. Mapping the Mangrove Forest Canopy Using Spectral Unmixing of Very High Spatial Resolution Satellite Images. Remote Sens. 2019, 11, 367. [Google Scholar] [CrossRef] [Green Version]
- Wang, T.; Zhang, H.; Lin, H.; Fang, C. Textural–spectral feature-based species classification of mangroves in Mai Po Nature Reserve from Worldview-3 imagery. Remote Sens. 2016, 8, 24. [Google Scholar] [CrossRef] [Green Version]
- Proisy, C.; Walcker, R.; Blanchard, E.; Gardel, A.; Anthony, E.J. (Eds.) Mangroves: A Natural Early Warning System of Erosion on Open Muddy Coasts in French Guiana; Elsevier: Amsterdam, The Netherlands, 2021; pp. 47–63. [Google Scholar] [CrossRef]
- Gnanappazham, L.; Selvam, V. The dynamics in the distribution of mangrove forests in Pichavaram, South India—Perception by user community and remote sensing. Geocarto Int. 2011, 26, 475–490. [Google Scholar] [CrossRef]
- Olwig, M.F.; Sørensen, M.K.; Rasmussen, M.S.; Danielsen, F.; Selvam, V.; Hansen, L.B.; Nyborg, L.; Vestergaard, K.B.; Parish, F.; Karunagaran, V.M. Using remote sensing to assess the protective role of coastal woody vegetation against tsunami waves. Int. J. Remote Sens. 2007, 28, 3153–3169. [Google Scholar] [CrossRef]
- Selvam, V.; Ravichandran, K.K.; Gnanappazham, L.; Navamuniyammal, M. Assessment of community-based restoration of Pichavaram mangrove wetland using remote sensing data. Curr. Sci. 2003, 85, 794–798. [Google Scholar]
- Vani, M.; Rama Chandra Prasad, P. (Eds.) Geospatial Assessment of Spatio-Temporal Changes in Mangrove Vegetation of Pichavaram Region, Tamil Nadu, India; Springer International Publishing: Cham, Switzerland, 2018; pp. 89–102. [Google Scholar] [CrossRef]
- Löf, M.; Madsen, P.; Metslaid, M.; Witzell, J.; Jacobs, D.F. Restoring forests: Regeneration and ecosystem function for the future. New For. 2019, 50, 139–151. [Google Scholar] [CrossRef] [Green Version]
- Beck, H.E.; Zimmermann, N.E.; McVicar, T.R.; Vergopolan, N.; Berg, A.; Wood, E.F. Present and future Köppen-Geiger climate classification maps at 1-km resolution. Sci. Data 2018, 5, 180214. [Google Scholar] [CrossRef] [Green Version]
- Selvam, V.; Ravichandaran, K.K.; Karunakaran, V.M.; Mani, K.G.; Beula, E.J.; Gnanappazham, L. Pichavaram Mangrove Wetland: Situation Analysis; MS Swaminathan Research Foundation: Chennai, India, 2010; p. 39. [Google Scholar]
- Sathyanathan, R.; Thattai, D.; Selvam, V. The Coleroon river flow and its effect on the Pichavaram mangrove ecosystem. J. Coast. Conserv. 2014, 18, 309–322. [Google Scholar] [CrossRef]
- Kathiresan, K. A review of studies on Pichavaram mangrove, southeast India. Hydrobiologia 2000, 430, 185–205. [Google Scholar] [CrossRef]
- Sathya, T.; Sekar, C. Stakeholder Preference, Dependence and Attitude towards Conservation of Mangrove Eco-System in South-East Coast of India. Innovare J. Soc. Sci. 2014, 2, 15–25. [Google Scholar]
- Kuester, M.A. Absolute Radiometric Calibration: 2016 v0, Digital Globe. 2017. Available online: https://dgv4-cms-production.s3.amazonaws.com/uploads/document/file/136/ABSRADCAL_FLEET_2016v0_Rel20170606.pdf (accessed on 1 April 2022).
- Wilkinson, G.G. Results and implications of a study of fifteen years of satellite image classification experiments. IEEE Trans. Geosci. Remote Sens. 2005, 43, 433–440. [Google Scholar] [CrossRef]
- Kathiresan, K. Globally threatened mangrove species in India. Curr. Sci. 2010, 98, 1551. [Google Scholar]
- Kathiresan, K.; Rajendran, N. Fishery resources and economic gain in three mangrove areas on the south-east coast of India. Fish. Manag. Ecol. 2002, 9, 277–283. [Google Scholar] [CrossRef]
- Viennois, G.; Proisy, C.; Féret, J.-B.; Prosperi, J.; Sidik, F.; Suhardjono; Rahmania, R.; Longépé, N.; Germain, O.; Gaspar, P. Multitemporal analysis of high spatial resolution satellite imagery for mangrove species mapping, Bali, Indonesia. IEEE J. Sel. Top. Appl. Earth Observ. Remote Sens. 2016, 9, 3680–3686. [Google Scholar] [CrossRef]
- Unnikrishnan, A.S.; Nidheesh, A.G.; Lengaigne, M. Sea-level-rise trends off the Indian coasts during the last two decades. Curr. Sci. 2015, 108, 966–971. [Google Scholar]
- Jayanthi, M.; Thirumurthy, S.; Nagaraj, G.; Muralidhar, M.; Ravichandran, P. Spatial and temporal changes in mangrove cover across the protected and unprotected forests of India. Estuar. Coast. Shelf Sci. 2018, 213, 81–91. [Google Scholar] [CrossRef]
- Senthalir, S. Shrimp Farms Threatening Pichavaram Forest. The Hindu. 9 August 2017. Available online: https://www.thehindu.com/news/cities/puducherry/shrimp-farms-threatening-pichavaram-forest/article19453172.ece (accessed on 1 April 2022).
- Srivastava, J.; Farooqui, A.; Hussain, S.M. Vegetation history and salinity gradient during the last 3700 years in Pichavaram estuary, India. J. Earth Syst. Sci. 2012, 121, 1229–1237. [Google Scholar] [CrossRef] [Green Version]
- Bosire, J.O.; Dahdouh-Guebas, F.; Walton, M.; Crona, B.I.; Lewis III, R.R.; Field, C.; Kairo, J.G.; Koedam, N. Functionality of restored mangroves: A review. Aquat. Bot. 2008, 89, 251–259. [Google Scholar] [CrossRef] [Green Version]
- Kamali, B.; Hashim, R. Mangrove restoration without planting. Ecol. Eng. 2011, 37, 387–391. [Google Scholar] [CrossRef] [Green Version]
- Rossi, R.E.; Archer, S.K.; Giri, C.; Layman, C.A. The role of multiple stressors in a dwarf red mangrove (Rhizophora mangle) dieback. Estuar. Coast. Shelf Sci. 2020, 237, 106660. [Google Scholar] [CrossRef]
- Lagomasino, D.; Fatoyinbo, T.; Castañeda-Moya, E.; Cook, B.D.; Montesano, P.M.; Neigh, C.S.R.; Corp, L.A.; Ott, L.E.; Chavez, S.; Morton, D.C. Storm surge and ponding explain mangrove dieback in southwest Florida following Hurricane Irma. Nat. Commun. 2021, 12, 4003. [Google Scholar] [CrossRef] [PubMed]
- Servino, R.N.; Gomes, L.E.d.O.; Bernardino, A.F. Extreme weather impacts on tropical mangrove forests in the Eastern Brazil Marine Ecoregion. Sci. Total Environ. 2018, 628–629, 233–240. [Google Scholar] [CrossRef]
- Sippo, J.Z.; Santos, I.R.; Sanders, C.J.; Gadd, P.; Hua, Q.; Lovelock, C.E.; Santini, N.S.; Johnston, S.G.; Harada, Y.; Reithmeir, G.; et al. Reconstructing extreme climatic and geochemical conditions during the largest natural mangrove dieback on record. Biogeosciences 2020, 17, 4707–4726. [Google Scholar] [CrossRef]
- Lovelock, C.E.; Feller, I.C.; Reef, R.; Hickey, S.; Ball, M.C. Mangrove dieback during fluctuating sea levels. Sci. Rep. 2017, 7, 1680. [Google Scholar] [CrossRef]
- Duke, N.C.; Kovacs, J.M.; Griffiths, A.D.; Preece, L.; Hill, D.J.E.; van Oosterzee, P.; Mackenzie, J.; Morning, H.S.; Burrows, D. Large-scale dieback of mangroves in Australia’s Gulf of Carpentaria: A severe ecosystem response, coincidental with an unusually extreme weather event. Mar. Freshw. Res. 2017, 68, 1816–1829. [Google Scholar] [CrossRef]
- Duke, N.C.; Bell, A.M.; Pederson, D.K.; Roelfsema, C.M.; Bengtson Nash, S. Herbicides implicated as the cause of severe mangrove dieback in the Mackay region, NE Australia: Consequences for marine plant habitats of the GBR World Heritage Area. Mar. Pollut Bull. 2005, 51, 308–324. [Google Scholar] [CrossRef]
- Mathevet, R.; Targowla, S.; Munisamy, A.; Govindan, V.; Narayanan, A.; Bautès, N. Wetlands for a sustainable urban future: Insights from Pondicherry, South India. Grassroots J. Nat. Resour. 2020, 3, 74–93. [Google Scholar] [CrossRef]
- Prasad, S. Hunt for Hydrocarbons Could Sink Pichavaram, Fear Activists. The Hindu. 13 June 2019. Available online: https://www.thehindu.com/news/cities/puducherry/hunt-for-hydrocarbons-could-sink-pichavaram-fear-activists/article27891952.ece (accessed on 1 April 2022).
- Mathevet, R.; Poulin, B. From conservation biology to conservation geography. Bull. L’assoc. Géogr. Fr. 2006, 83, 341–354. [Google Scholar] [CrossRef]


| Satellite and Format | Acquisition Date | Pixel Size (m) | θs (°) | θv (°) | ϕs–v (°) | Tide Level (cm) |
|---|---|---|---|---|---|---|
| QBD [P, 4 MS] | 4 May 2003 | [0.6, 2.4] | 22.8 | 6.5 | 292.6 | 7 |
| 5 January 2005 | 38.7 | 32.9 | 230.3 | 46 | ||
| GEO [P, 4 MS] | 22 March 2011 | [0.4, 1.6] | 26.1 | 19.6 | 262.3 | 0 |
| 30 January 2016 | 38.8 | 26.3 | 86.1 | 20 | ||
| WV3 [P, 8 MS] | 28 January 2019 | [0.4, 1.6] | 34.5 | 19.2 | 169.2 | 44 |
| Year | Class Names | Producer’s Accuracy | User’s Accuracy | Kappa |
|---|---|---|---|---|
| 2003 (QBD) | Mangrove | 96.2% | 93.8% | 0.91 |
| Water | 90.8% | 98.8% | 0.98 | |
| Non-Mangrove | 97.3% | 91.2% | 0.87 | |
| Total Accuracy = 95% | Kappa = 0.92 | |||
| 2005 (QBD) | Mangrove | 84.8% | 97.5% | 0.96 |
| Water | 88.9% | 70.0% | 0.59 | |
| Non-Mangrove | 82.4% | 87.5% | 0.81 | |
| Total Accuracy = 85% | Kappa = 0.77 | |||
| 2011 (GEO) | Mangrove | 94.1% | 100.0% | 1 |
| Water | 100.00% | 97.5% | 0.96 | |
| Non-Mangrove | 97.4% | 93.8% | 0.91 | |
| Total Accuracy = 97% | Kappa = 0.96 | |||
| 2016 (GEO) | Mangrove | 93.0% | 100.0% | 1 |
| Water | 100.0% | 98.8% | 0.98 | |
| Non-Mangrove | 98.6% | 92.5% | 0.89 | |
| Total Accuracy = 97% | Kappa = 0.96 | |||
| 2019 (WV3) | Mangrove | 86.8% | 98.8% | 0.98 |
| Water | 97.1% | 82.5% | 0.76 | |
| Non-Mangrove | 90.1% | 91.3% | 0.87 | |
| Total Accuracy = 91% | Kappa = 0.86 | |||
Publisher’s Note: MDPI stays neutral with regard to jurisdictional claims in published maps and institutional affiliations. |
© 2022 by the authors. Licensee MDPI, Basel, Switzerland. This article is an open access article distributed under the terms and conditions of the Creative Commons Attribution (CC BY) license (https://creativecommons.org/licenses/by/4.0/).
Share and Cite
Ghosh, S.; Proisy, C.; Muthusankar, G.; Hassenrück, C.; Helfer, V.; Mathevet, R.; Andrieu, J.; Balachandran, N.; Narendran, R. Multiscale Diagnosis of Mangrove Status in Data-Poor Context Using Very High Spatial Resolution Satellite Images: A Case Study in Pichavaram Mangrove Forest, Tamil Nadu, India. Remote Sens. 2022, 14, 2317. https://doi.org/10.3390/rs14102317
Ghosh S, Proisy C, Muthusankar G, Hassenrück C, Helfer V, Mathevet R, Andrieu J, Balachandran N, Narendran R. Multiscale Diagnosis of Mangrove Status in Data-Poor Context Using Very High Spatial Resolution Satellite Images: A Case Study in Pichavaram Mangrove Forest, Tamil Nadu, India. Remote Sensing. 2022; 14(10):2317. https://doi.org/10.3390/rs14102317
Chicago/Turabian StyleGhosh, Shuvankar, Christophe Proisy, Gowrappan Muthusankar, Christiane Hassenrück, Véronique Helfer, Raphaël Mathevet, Julien Andrieu, Natesan Balachandran, and Rajendran Narendran. 2022. "Multiscale Diagnosis of Mangrove Status in Data-Poor Context Using Very High Spatial Resolution Satellite Images: A Case Study in Pichavaram Mangrove Forest, Tamil Nadu, India" Remote Sensing 14, no. 10: 2317. https://doi.org/10.3390/rs14102317