Article

Promising Uses of the iPad Pro Point Clouds: The Case of the Trunk Flare Diameter Estimation in the Urban Forest

1
Department of Forest Engineering, Agrarian and Environmental Sciences Sector, Midwestern State University, Irati 84505-677, Brazil
2
Department of Forest Resources Management, Faculty of Forestry, University of Agriculture in Krakow, 31-425 Krakow, Poland
*
Author to whom correspondence should be addressed.
Remote Sens. 2022, 14(18), 4661; https://doi.org/10.3390/rs14184661
Submission received: 5 July 2022 / Revised: 4 September 2022 / Accepted: 14 September 2022 / Published: 19 September 2022
(This article belongs to the Special Issue 3D Point Clouds in Forest Remote Sensing II)

Abstract

:
The rule of thumb “the right tree in the right place” is a common idea in different countries to avoid damages caused by trees on sidewalks. Although many new planting techniques can be used, the estimation of the trunk flare diameter (TFD) could help the planning process to give tree roots more space to grow over the years. As such, we compared the applicability of point clouds based on iPad Pro 2020 image processing and a precise terrestrial laser scanner (TLS FARO) for the modeling of the TFD using different modeling procedures. For both scanning methods, 100 open-grown and mature trees of 10 different species were scanned in an urban park in Cracow, Poland. To generate models, we used the PBH (perimeter at breast height) and TFD variables and simple linear regression procedures. We also tested machine learning algorithms. In general, the TFD value corresponded to two times the size of a given DBH (diameter at breast height) for both methods of point cloud acquisition. Linearized models showed similar statistics to machine learning techniques. The random forest algorithm showed the best fit for the TFD estimation, R2 = 0.8780 (iPad Pro), 0.8961 (TLS FARO), RMSE (m) = 0.0872 (iPad Pro), 0.0702 (TLS FARO). Point clouds generated from iPad Pro imageries (matching approach) promoted similar results as TLS FARO for the TFD estimations.

1. Introduction

Cities have been strategic ecosystems to research the conditions and patterns of trees’ growth and their interaction in the urban environment [1,2,3]. It is assumed to be relevant, as trees promote an enormous effect on humans’ quality of life. Different studies have pointed out that trees improve the air quality by removing pollutants and carbon [4], avoid flood events by reducing the runoff effect [5], improve human comfort by regulating the microclimate [6], increase the value of properties, and increase the sense of environmental justice [7]. There are also other benefits provided by trees, all called ecosystem services.
On the other hand, trees can promote a series of disservices related to safety and security, health, economy, mobility and infrastructure, and environmental and energy issues [2,8]. These disservices depend on the qualities of the built environment and the social-cultural aspects, as they might be produced depending on the species composition, location of the tree, the growth patterns, the life stage, the stress caused to trees, and the intensity of maintenance practices [2].
Regarding the disservices promoted by trees, two viewpoints should be relevant to the public management: the popular perception of trees’ problems and benefits and the ratio between the maintenance costs and the value of the tree [1,9]. These ideas can drive the way people put a price on trees and their needs to counterbalance the urban problems and make cities more resilient to the effects of climate change [1,3].
The planning process for the management of urban trees is an important step that should be seriously regarded by public managers [10], as more than 55% of people live in urban settlements around the world [11]. It helps to overcome the harmful ideas about trees and avoid problems due to tree growth on inadequate sites in cities. In the planning process regarding different types of urban green infrastructures that compose the urban forest, the management of the space available to trees on sidewalks and the interaction with urban infrastructures is one of the main challenges faced by public managers [8,12,13].
The space occupied by a tree at the ground level depends on the size of its trunk flare diameter (TFD), the region where the topmost roots connect to the trunk right in the above-ground portion [13]. As trees grow, the TFD becomes larger due to mechanical responses to the static load (tree structure weight) and dynamic load (wind drag forces) that influence trees growing in isolation [8,14,15]. So, the size of the space available for trees to grow on sidewalks is relevant for the avoidance of problems with pavement breakage and limitations on accessibility [8].
Problems regarding sidewalk breakage and conflicts with accessibility have been reported by some studies on urban trees [2,12,13,16] and in most cases, it is due to the natural trunk flare growth in an inadequate space to the tree on the sidewalk. In some places, pavement removal around the trunk flare can be a solution, but the best thing is to promote a qualified planning process, giving trees appropriate space for their growth over the years after planting [8,13].
To help in this procedure of planning, fitting general models for estimating the TFD from the DBH size of trees over the years can be the best option to give them the best-qualified soil area around the trunk. In this sense, not much effort has been made; the research works from North et al., Hilbert et al., and Koeser et al. [12,13,17] were the first to present models to estimate the TFD from the size of the tree DBH (diameter at breast height).
One option to acquire data to generate models could be 3D point clouds from laser scanning devices such as the terrestrial laser scanner (TLS) or hand-held laser scanners (HLS). Research shows that TLSs can deliver precise and accurate point cloud data needed to measure and estimate DBH, tree height, volume, position, and canopy cover [18,19,20,21], but 3D data gathered using an iPad Pro application, a new and quite low-cost solution, have also shown accuracy and precision for the detection of the tree trunk and estimations of the DBH [22,23,24]. Although this new device presents limitations regarding the distance from the device to the tree [23], it can be an alternative to the costs and time-consuming nature of the TLS. At the same time, it can show precision and reliability for use in forest inventory practices [23,24].
In addition, the iPad Pro’s LiDAR and camera sensors can be used to quickly create 3D scenes on the tablet itself using apps where the point cloud transformed to mesh is colored using the RGB texture collected by its cameras [25], aiding in the identification of objects of interest and their quality in situ. Working with the data collected from this device does not require advanced knowledge due to its user-friendly applications, such as the one that Tatsumi et al. developed [25], making it easy for the operator to learn and use it.
Although the iPad Pro has limitations regarding the maximum distance (approx. 5.0 m) from the device to the tree [23,26,27], this approach can be an alternative to TLS devices in terms of its portability, easy handling, agility in data acquisition, and affordability. At the same time, it can show accuracy and reliability for use in forest inventory practices [23,24,26,27].
Considering the problem of tree trunk flare modeling and the costs of a professional TLS to be used as a source of data, our research aimed to evaluate the applicability of iPad Pro point clouds for the modeling of the TFD of urban trees as an alternative to the point clouds generated by a precise terrestrial laser scanner which have been traditionally used in different forestry practices. This is an important research subject, as data from point clouds managed by machine learning techniques can make analysis faster than the traditional methods in the field.

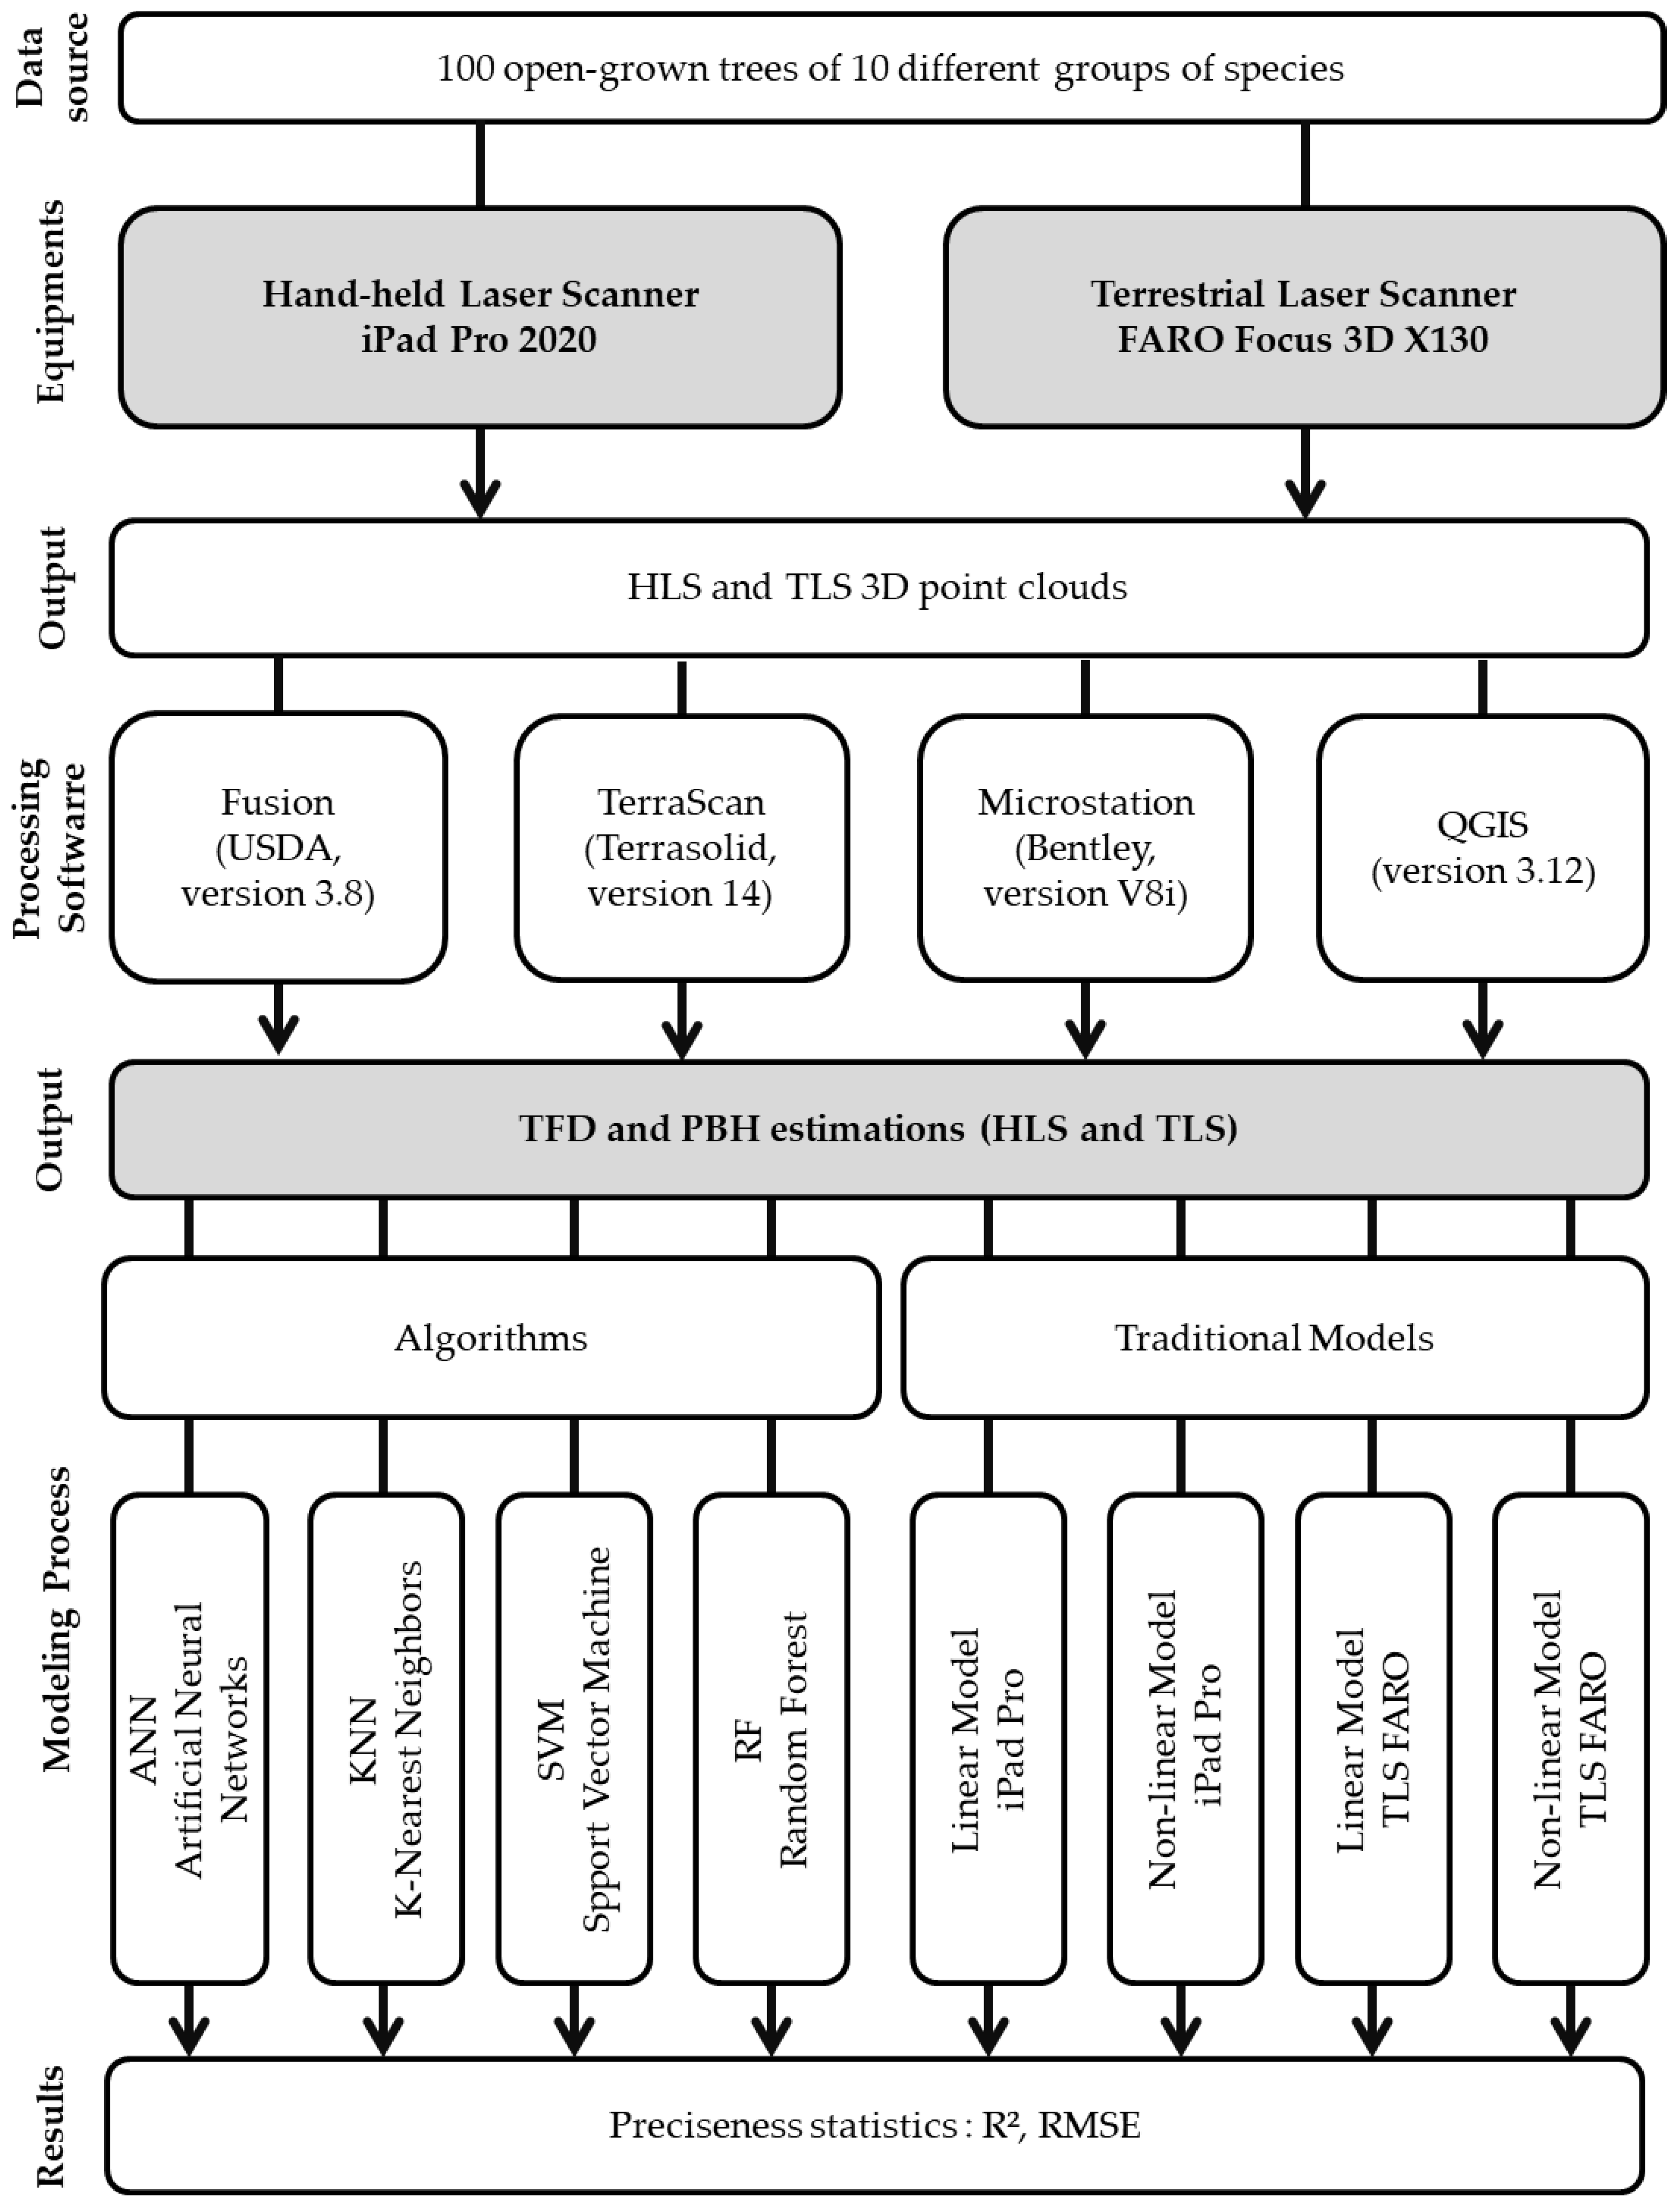
2. Materials and Methods

2.1. Information on the Study Area

We acquired data in the Polish Airmen Park in the city of Cracow, Poland (Figure 1). This park is one of the main urban green infrastructures. It is in the northeastern part of the city, surrounded by a train railroad, three avenues, and settlement buildings. It has a total area of 43 ha, divided into two parts: the north part, with an area of 4.5 ha, and the south part, with an area of 38.5 ha.
The south part of the park is composed of different groups of tree species, either with or without shrubs or ornamental plants on the ground level. Among these groups, there are open spaces covered by grass, infrastructure to relax or practice sports, and a well-established system of pathways connecting different parts of the park.

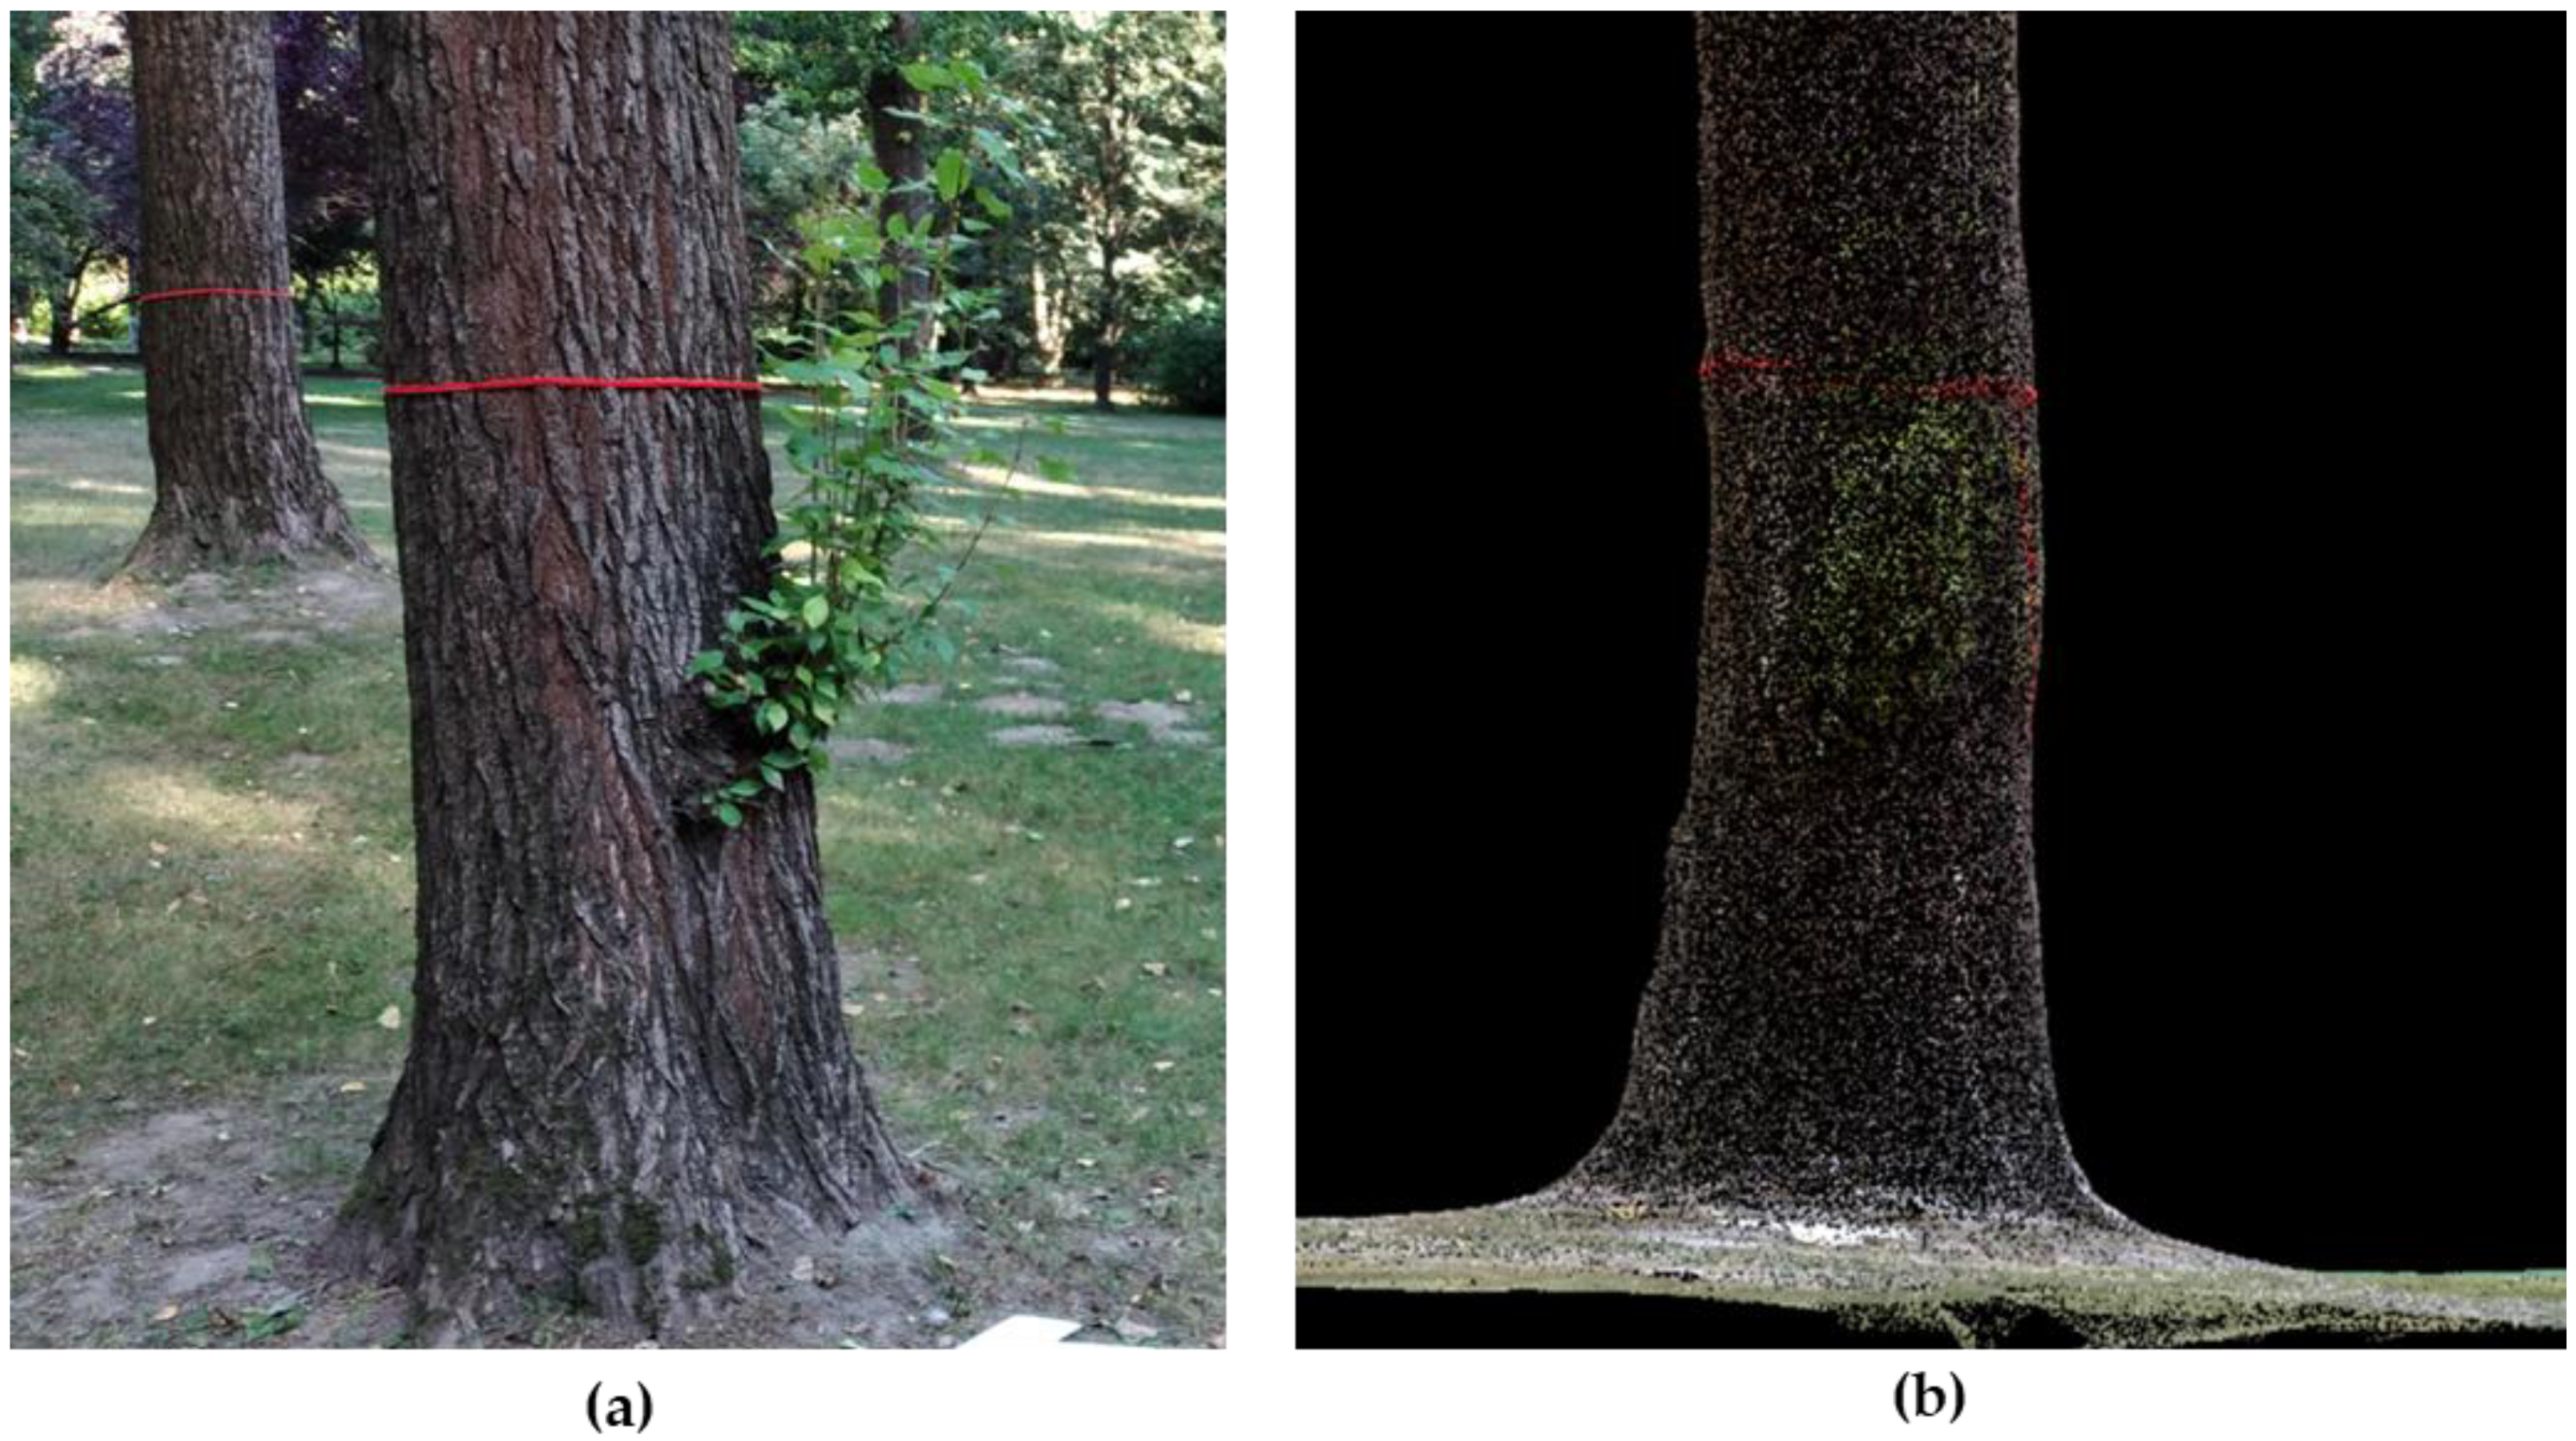
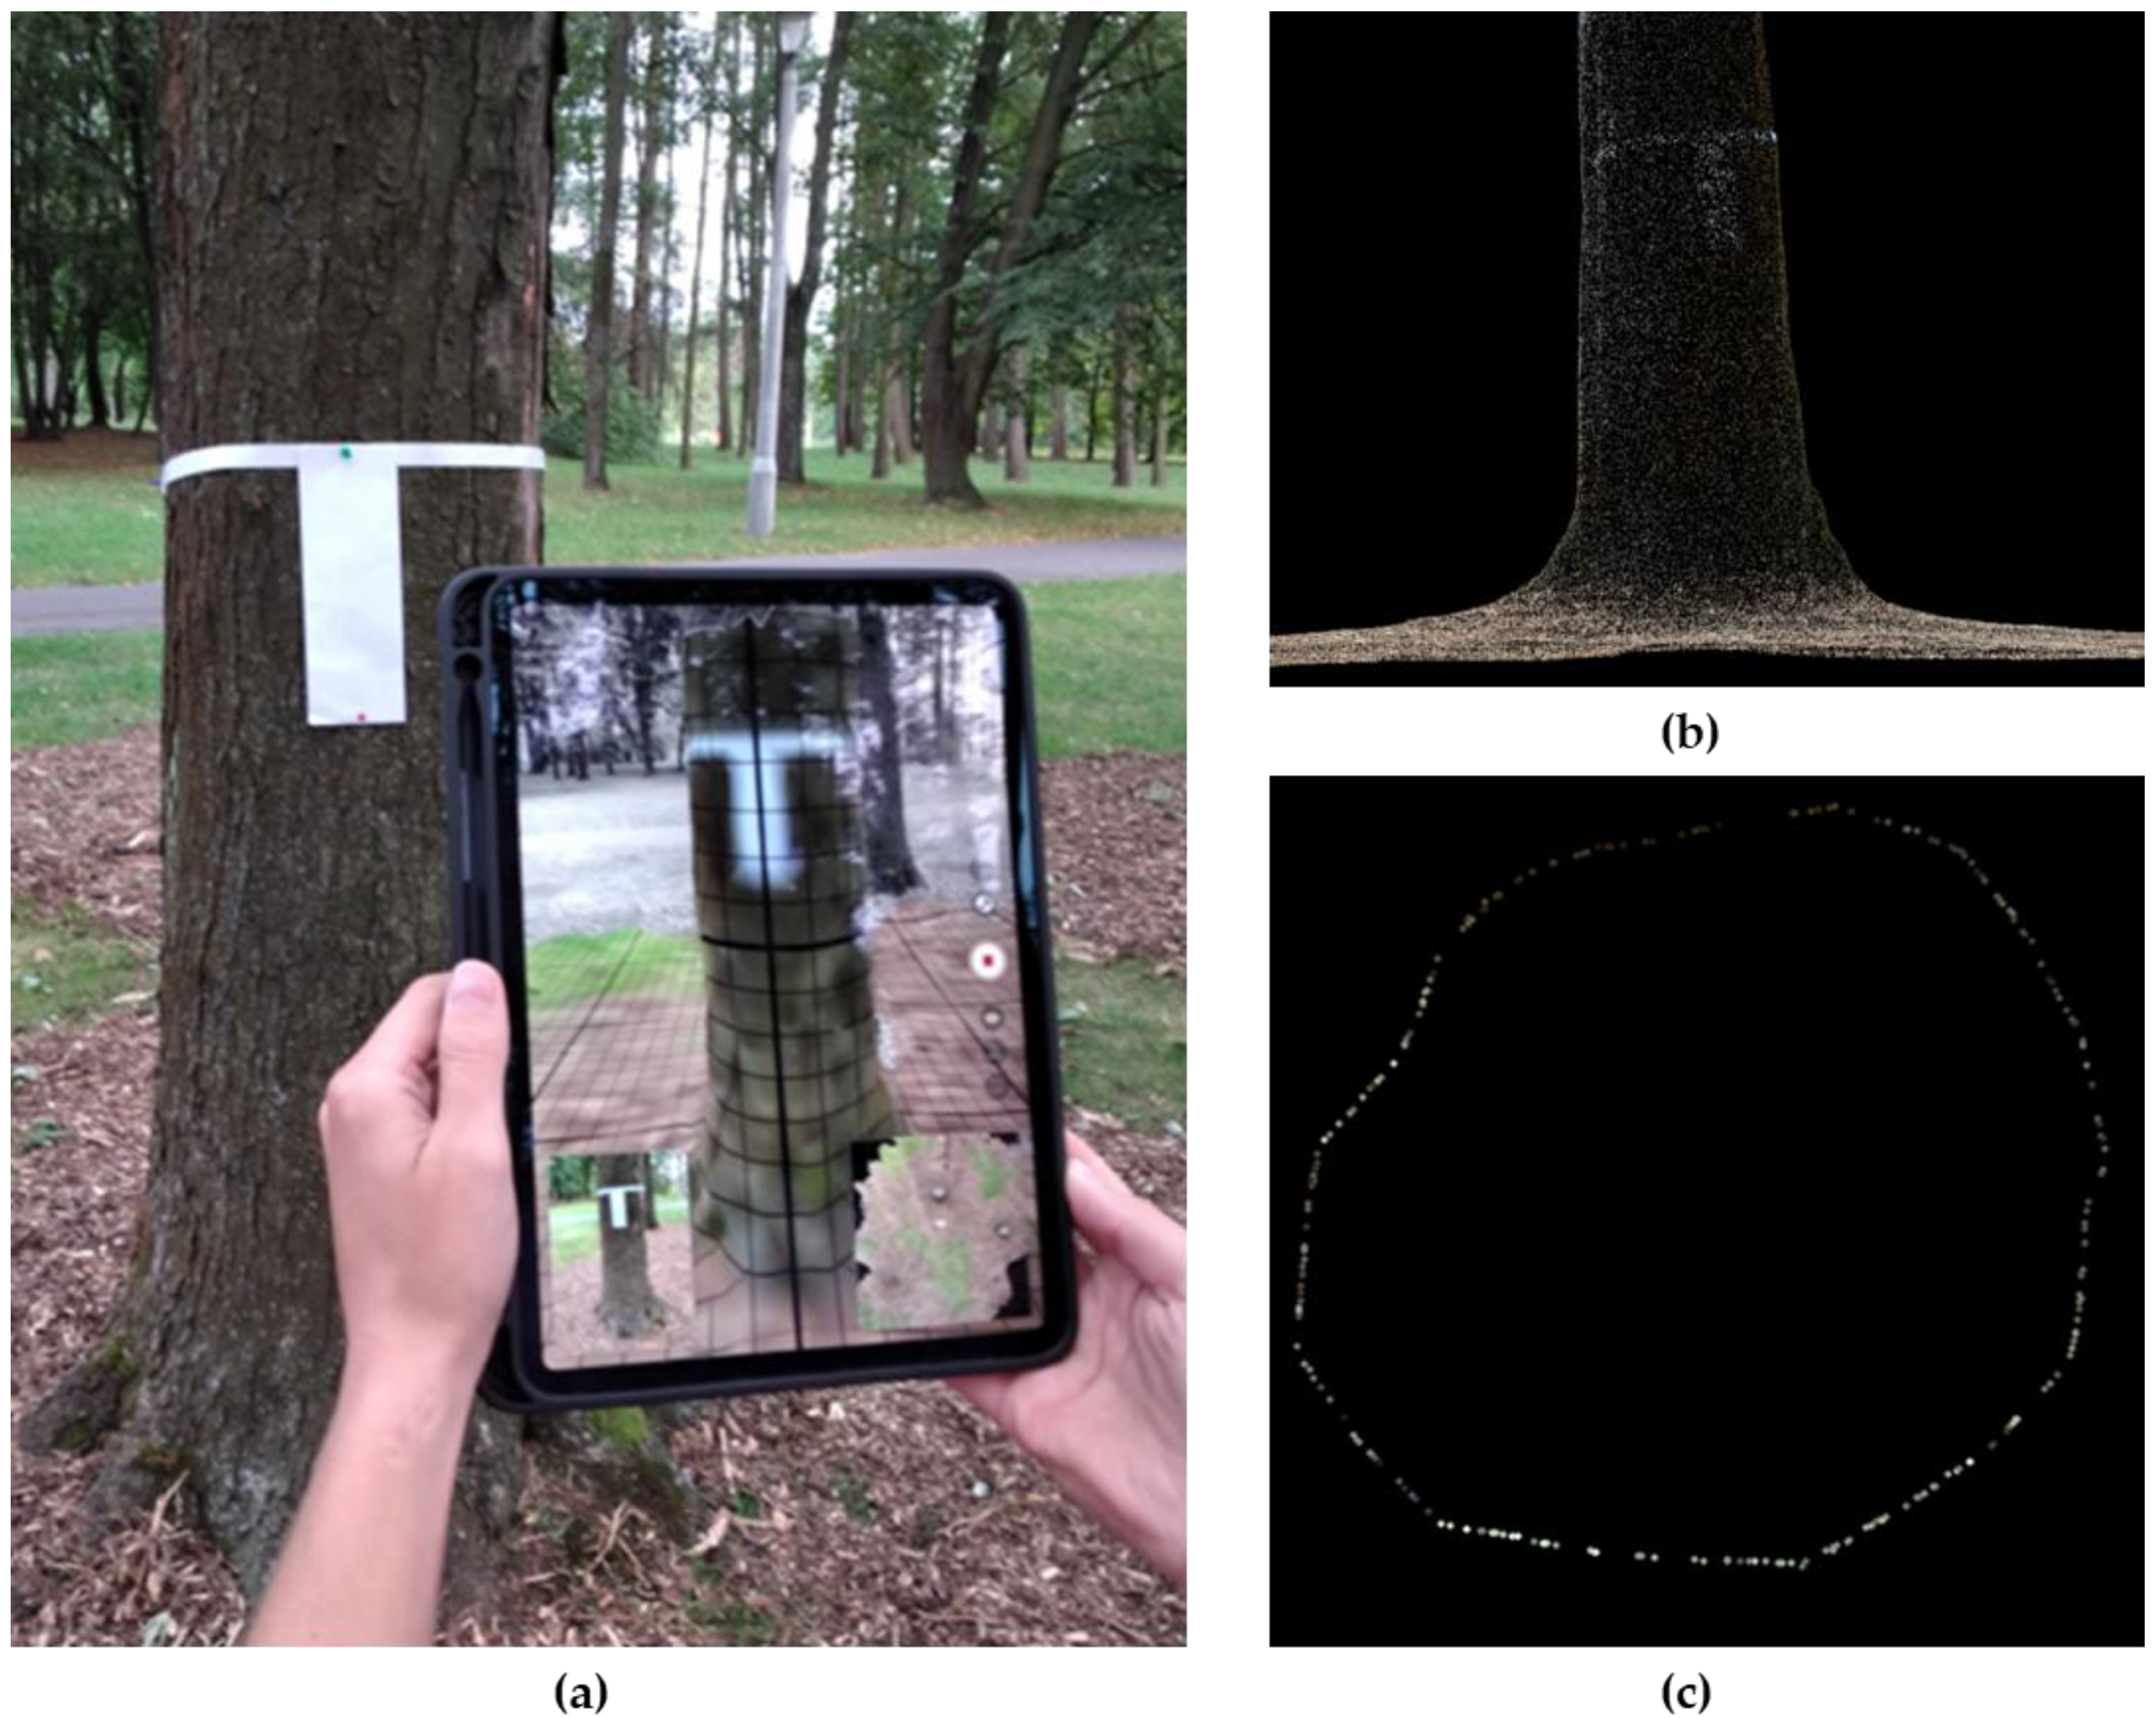
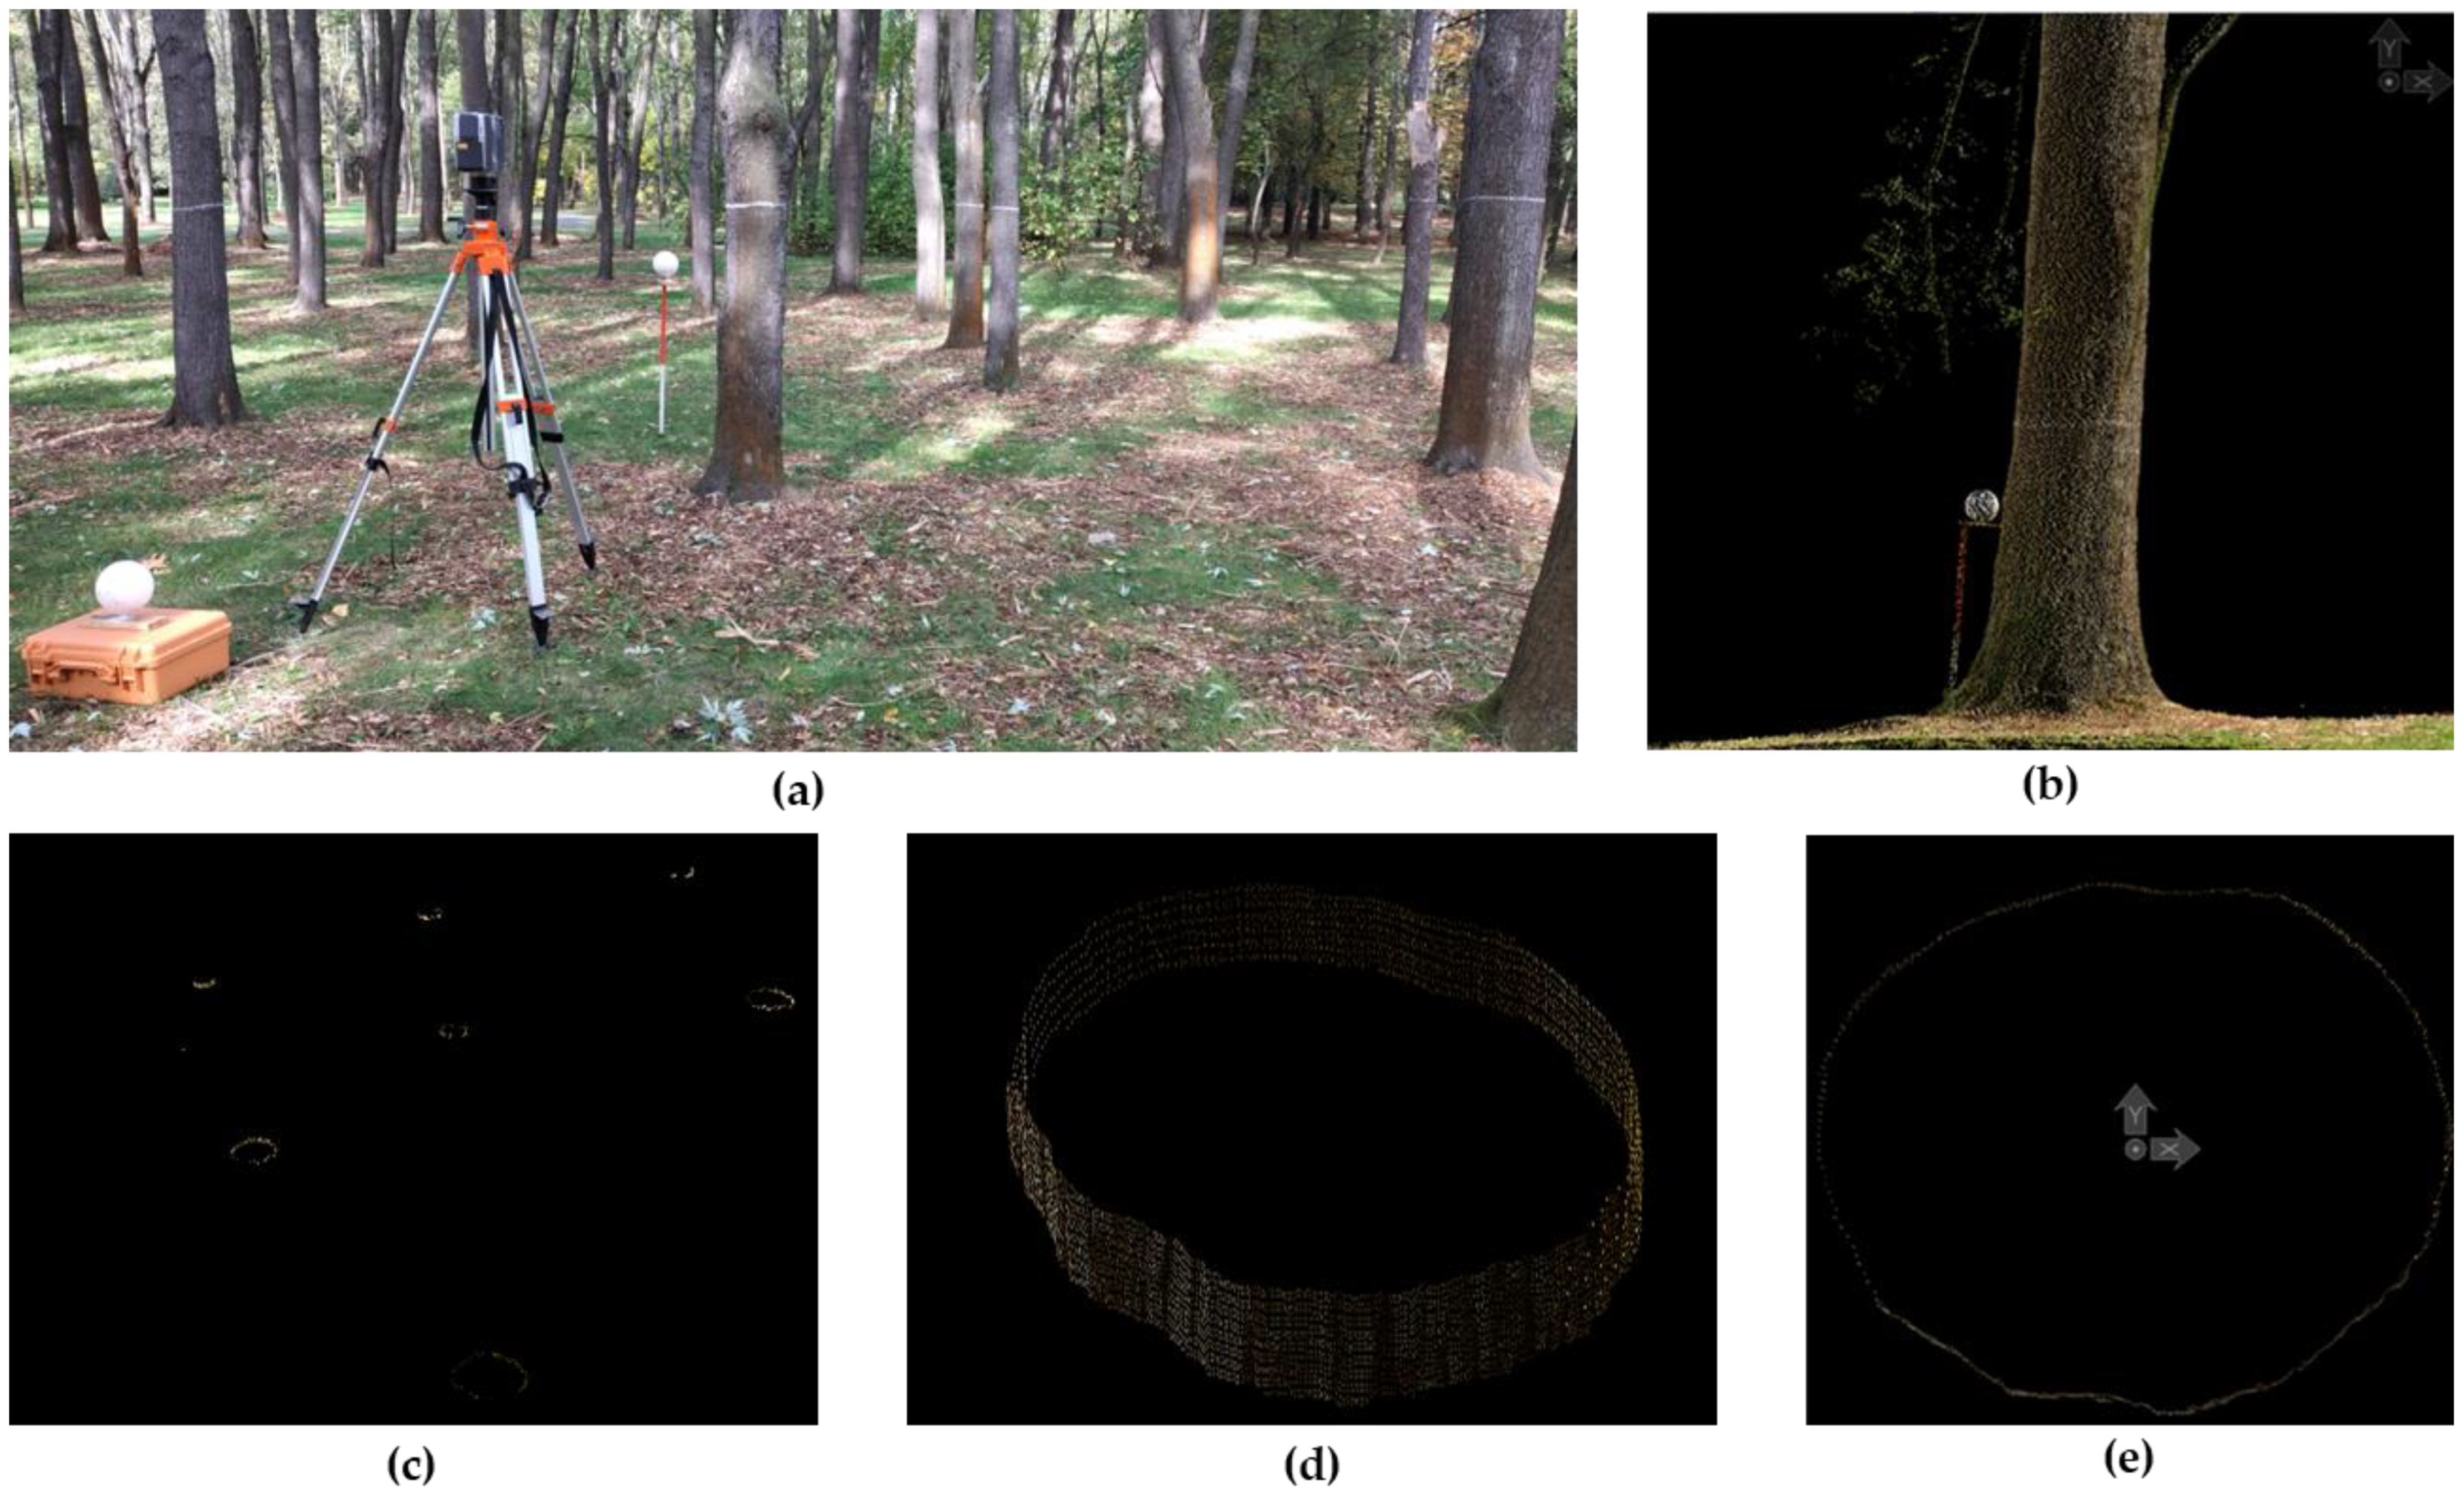
2.2. Procedures for Data Acquisition

Field data were acquired during the summer of 2020 from 100 open-grown trees of 10 different groups of species with varying sizes, ages, and distances among trees in each group. Only trees with upright and unique trunks were selected to avoid problems during the scanning process with the iPad Pro. The species selected were Acer platanoides (Norway maple), Acer saccharinum (Silver maple), Betula pendula (European white birch), Fraxinus excelsior (European ash), Larix decidua (Common larch—two groups), Populus balsamifera (Balsam poplar), Quercus rubra (Northern red oak), Robinia pseudoacacia (Black locust), and Tilia cordata (Littleleaf linden). Prior to the scanning process, all tree trunks were marked at the PBH (perimeter at breast height—1.30 m above ground) position with a white or red line to recognize this position in the colorized 3D point clouds (Figure 2 and Figure 3). We chose these groups of trees due to the similarity of growth conditions to isolated and open-grown trees in places surrounded by urban infrastructures such as sidewalks and parking lots. In such places, trees’ trunk flare growth can be affected by wind load and the static load of the tree, due to their weight [8,14,15].
The research steps are described in a flowchart (Figure 4). We adopted two methods to “scan” tree trunks, one with a handheld device, the iPad Pro 2020 (12.9” screen), and the other using a terrestrial laser scanner, the FARO FOCUS 3D X130. For the iPad Pro, we used the Abound Capture application, Beta version (Abound Labs, 2020; New York, NY, USA), to “scan” trees one by one by positioning the iPad Pro at 1.3 m above ground level and 2.0 m from the trunk (Figure 3 and Figure 4) due to the inability of the device to create a 3D point cloud for objects more distant than 5.0 m.
Abound Capture was one of the first apps developed for scanning objects and creating a 3D-textured object for augmented reality (AR), which allowed us to export the generated image-matching 3D point clouds (*.laz). With the FARO FOCUS device (Figure 5), the scanning process was performed from at least five stations per group of tree species at a distance <12.0 m from the scanner to the sphere targets used as matching objects for single scans. This device was set to ¼ of full resolution and 4× quality, which enabled us to obtain the laser beams at the tree trunk every 6 mm at a 10.0 m distance from the scanner station. The laser scan files (*.fls) were first matched into FARO Scene trial software, with fitting errors ranging from 3.1 to 5.7 mm.

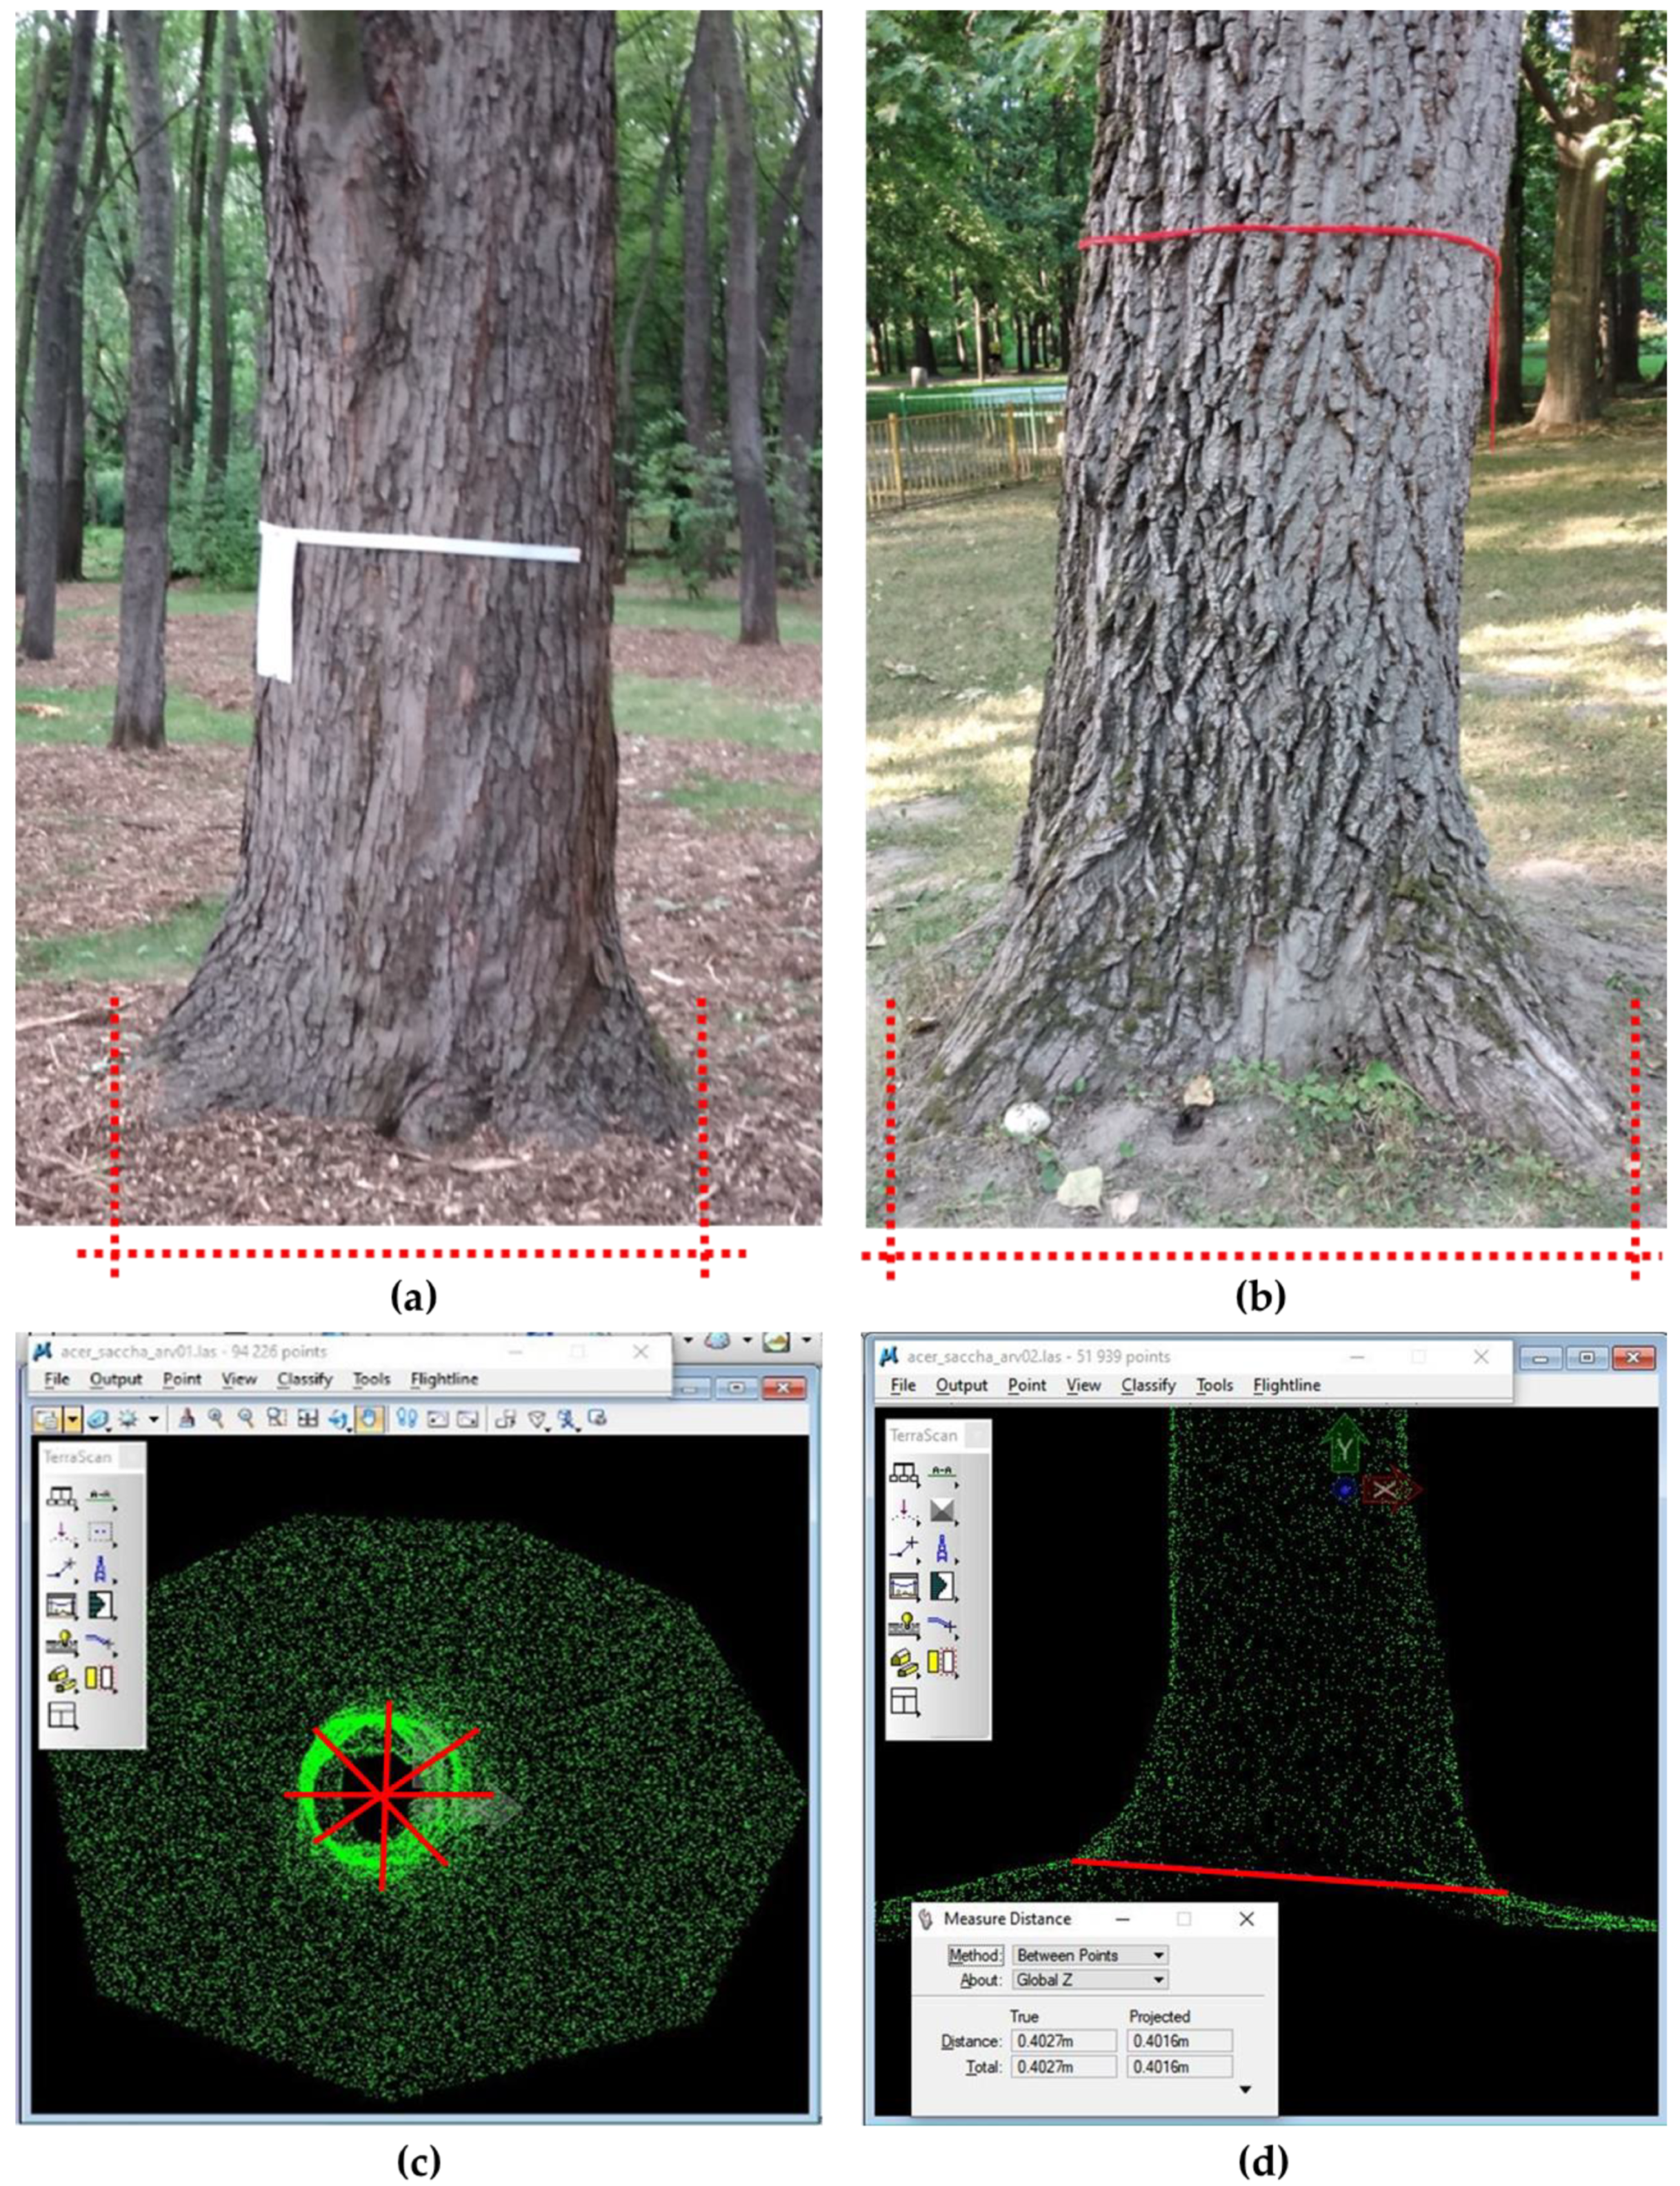
2.3. Procedures to Analyze the Point Clouds

The compressed point clouds based on the iPad Pro approach (“.laz” files) were converted to “.las” files through the “laszip” command in the software Fusion (USDA, version 3.8, Portland, OR, USA) [28] to make it possible to work in TerraScan (Terrasolid, version 14, Espoo, Finland) running with Microstation (Bentley, version V8i, Select Series 2, Exton, PA, USA) software.
The 3D point clouds of every single tree from the iPad and FARO TLS point clouds were classified using a macro tool in TerraScan (Terrasolid) software to extract a 2.0 cm width trunk slice at 1.30 m above ground (ranging from 1.29 to 1.31 m), corresponding to the PBH position on tree trunks marked in red or white (Figure 2, Figure 3 and Figure 4). The TFD was estimated using the Measure Distance tool in the Microstation software by identifying the points representing tree roots that went into the soil (Figure 6). This diameter was measured in four equidistant positions to consider the possible variation around the trunk.
All 3D point clouds representing the piece of trunk marked as a white or red line (1.30 m above ground level) were converted into shapefiles by using tools in the FUSION software. For each shapefile analyzed, the size of the PBH slice was measured in QGIS software (version 3.12) by using the convex hull algorithm to perform estimations. We measured the PBH instead of DBH to avoid the addition of errors due to the non-cylindric slices of the trunks.

2.4. Procedures to Predict the Trunk Flare Diameter (TFD)
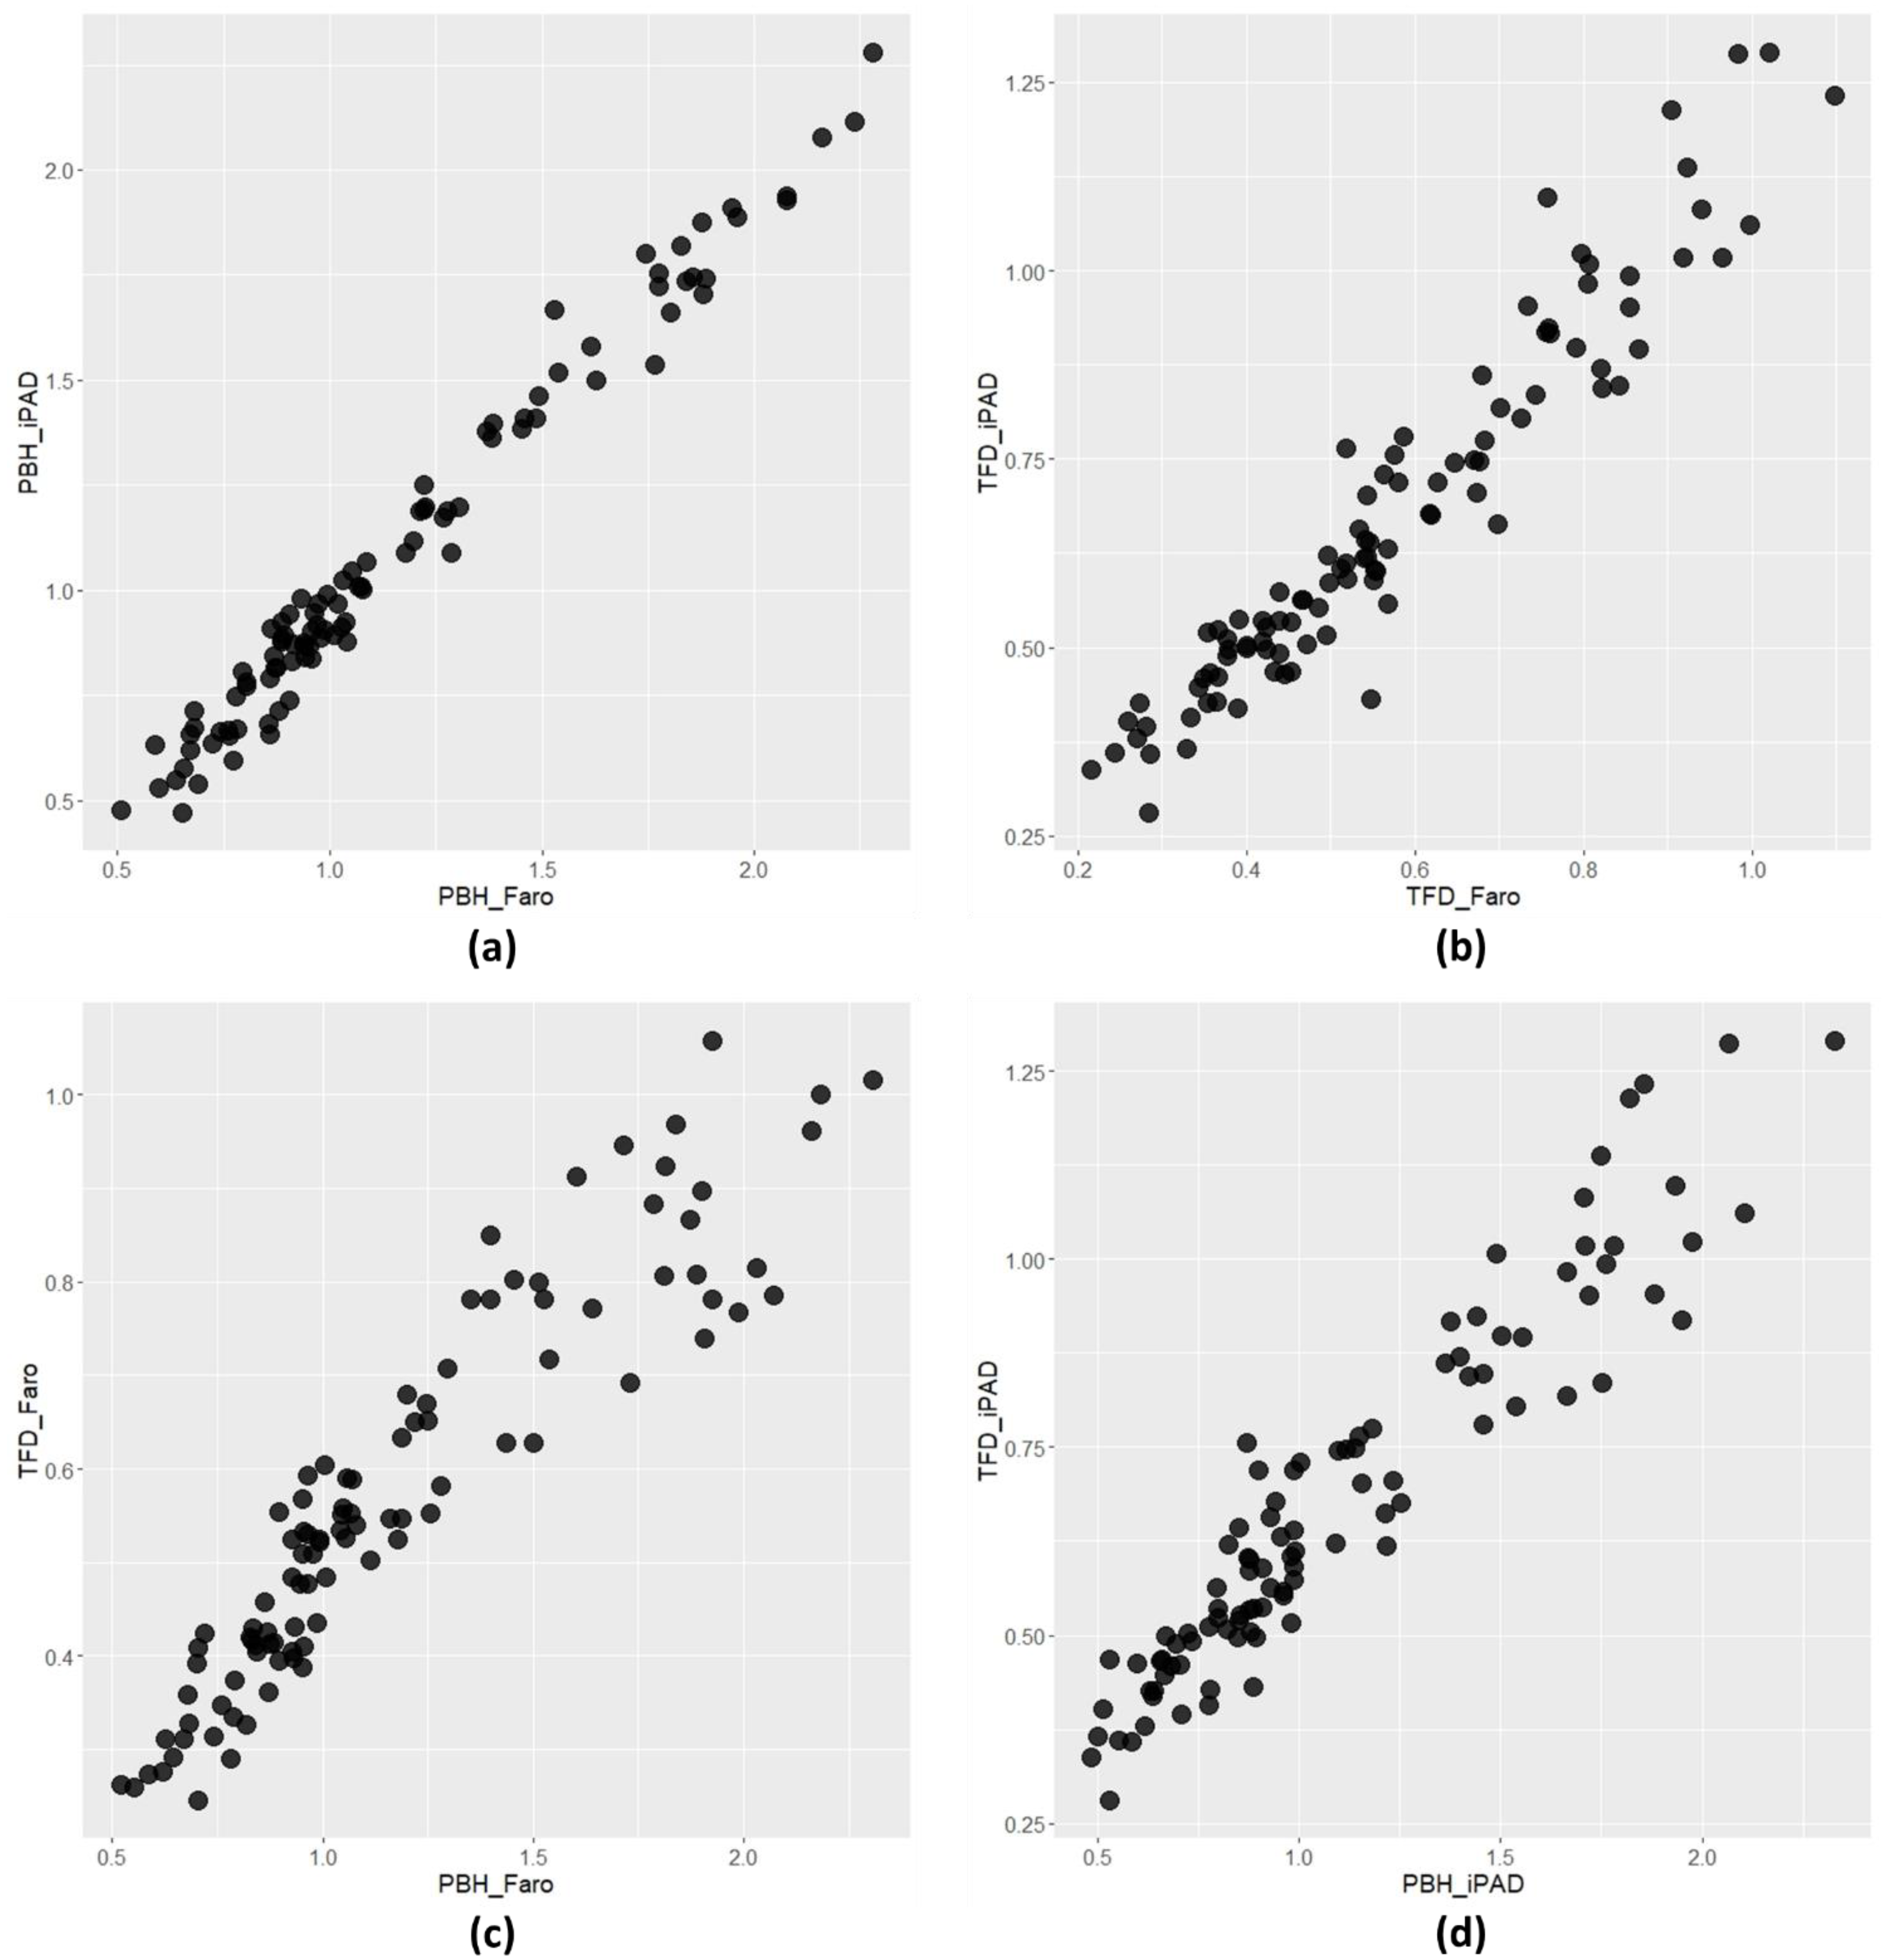
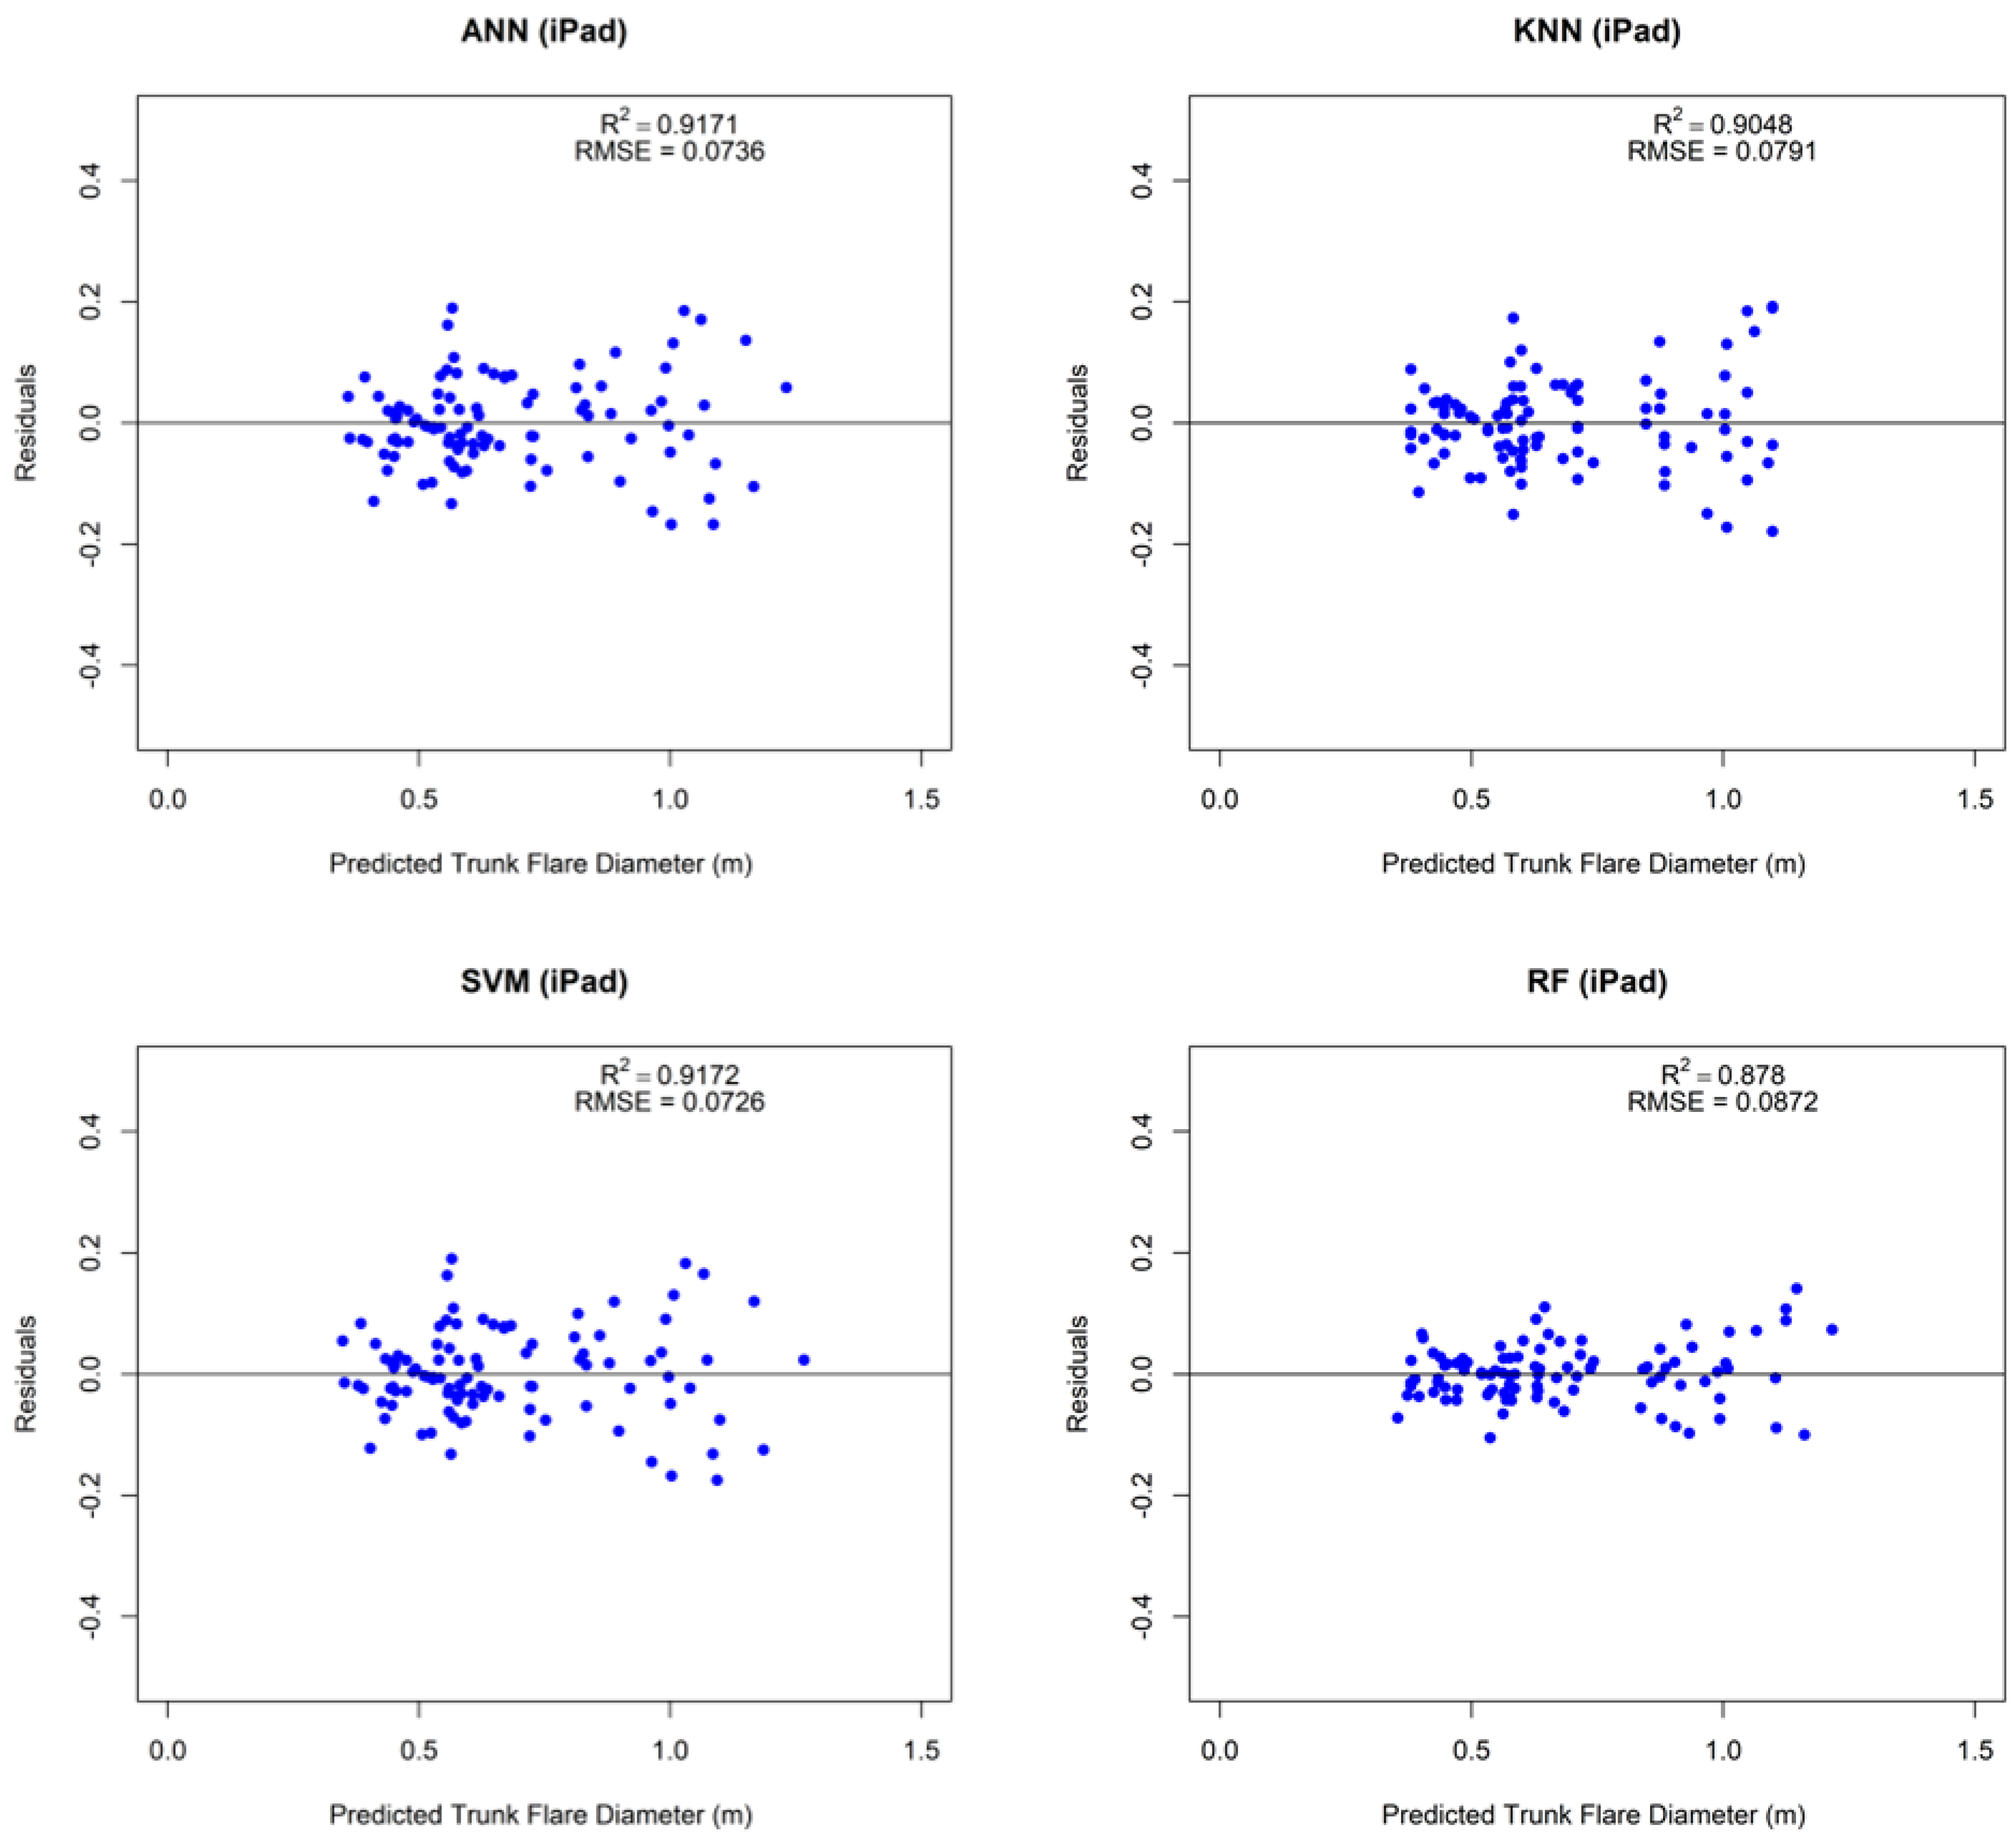
As the relationship between the variables PBH (in meters) and TFD (in meters) has shown to be linear, we used simple linear regression procedures to generate models, as used by Hilbert et al. [13]. We also applied machine learning techniques to test if the estimation’s preciseness and accuracy would improve.
In the modeling process, we used the TFD as a dependent variable and PBH as an independent variable. Both variables were transformed (e.g., lnTFD, lnPBH, PBH2, PBH3, 1/PBH, √PBH, and others) to create a set of variables to make it possible for the selection of the best fitted through forward stepwise regression in the software R.
The selection of the best-fitted model to estimate the TFD was performed by analyzing the highest value for the coefficient of determination (R2) or the highest value for the adjusted coefficient of determination (R2adj.) for the logarithmic models, the lowest value for the root mean square error (RMSE), the lowest value for the estimated standard error (Syx%) and by the analysis of the graphical distribution of the residues. In addition, the models selected were verified according to the linear regression’s assumptions: linearity, normality, homoscedasticity, and independence [29].
To verify the quality of the estimations by the best models, we compared the estimations of the TFD with the real values obtained using HLS (iPad Pro) and the FARO TLS, through the paired chi-squared test. For the models where the dependent variable had a logarithmic transformation (e.g., lnTFD), we also introduced Meyer’s coefficient into the model to avoid logarithmic discrepancy [30].
To test the improvement in the TFD estimations between the iPad Pro and FARO TLS point clouds, we used machine learning (ML) algorithms, applying the PBH as an independent variable. The algorithms tested were artificial neural networks (ANN), k-nearest neighbors (KNN), support vector machine (SVM) with the kernel linear method, and random forest (RF). In all estimations with these algorithms, data were not transformed as in the modeling process previously described. Before running the algorithms, all data were standardized to speed up the convergence rate, reduce the iteration process [31], and reduce errors in the running process of the ANN algorithm [32]. The tested algorithms were part of the package Caret (classification and regression training) in the software R.
We applied repeated k-fold cross-validation using 10 folds and three repetitions to validate and improve the machine learning procedures used. The repeated cross-validation can be used to evaluate the generalizability of the model, as this procedure can provide a more stable estimate of the prediction accuracy when compared to simple cross-validation [33]. Results from the algorithms were evaluated according to their accuracy and precision by the statistical criteria: coefficient of determination (R2), root mean square error (RMSE), and the analysis of the graphical distribution of the residues.

3. Results

We measured the point clouds for the PBH and TFD from two different techniques (iPad Pro and TLS FARO), and data from the 100 trees measured presented the same pattern of variation, with similar coefficients of variation for each variable measured. For PBH, data varied from 0.47 m to 2.28 m with a mean value of 1.10 m and a CV equal to 39.64% for the iPad Pro, and from 0.54 m to 2.31 m with a mean value of 1.17 m and a CV equal to 37.79% for the TLS FARO (t-test = 1.0573, p-value = 2.91−1). For TFD, data varied from 0.28 m to 1.2 m with a mean value of 0.68 m and a CV equal to 34.86% for the iPad Pro, and from 0.25 m to 1.06 m with a mean value of 0.57 m and a CV equal to 35.79% for the TLS FARO (t-test = 3.4193, p-value = 7.65−4). In general, the TFD value corresponded to two times the size of a given DBH for both methods of data acquisition.
Differences in the minimum, mean, and maximum values between techniques can be due to the resolution of the equipment (higher in the TLS FARO) and due to the smoothing process of the 3D texturizing in the iPad Pro, which cannot produce a regular trunk shape and produces a less detailed ground surface. The TFD mean value was 1.9 times the DBH values for the iPad Pro data, and 1.5 times for the TLS FARO data, with 12.87% and 11.57% for the coefficients of variation, respectively.
The pattern of data distribution for the variable PBH between the FARO and iPad (Figure 7a) is linear, as for the variable TFD (Figure 7b). Between the variables used in the modeling process, a linear distribution pattern was also observed (Figure 7a,b) with a similar pattern of data distribution for both methods used (TLS FARO and iPad Pro). However, for the relationship between TFD and PBH (Figure 7c,d), data tend to present more variation along with the size of the tree trunk and their trunk flare values, mainly for PBH greater than 1.5 m.
The stepwise regression returned two sets of variables reliable for model construction with significant coefficients (β0 and β1, p < 0.01). For the iPad Pro, the set of variables consisted of the variables PBH, lnTFD, and 1/√PBH, and for data from the TLS FARO, the set of variables consisted of the variables lnPBH, lnTFD, and 1/√PBH. Models adjusted for both methods of data acquisition are similar (Table 1). The quadratic models with the independent variables PBH and PBH2 showed better statistics for R2 and Syx% but did not follow the assumption of the residuals homoscedasticity [29], even after applying the weighted regression process.
From the adjusted models (Table 1), Models 1 and 3 are not reliable because they do not follow the assumption of the residual homoscedasticity [29], although they presented the best statistics for R2, Syx%, and RMSE. So, the best and most reliable models to estimate TFD from PBH point clouds are Models 2 and 4, composed of the same variables but with different coefficients according to the method of data acquisition (TLS FARO or iPad Pro). To Models 2 and 4, the values for Meyer’s coefficient were added (e0.5 * MSres) to correct the logarithmic discrepancy, with values around 1.0.
The residual distribution, along the predicted TFD (Figure 8), showed a similar pattern between the models adjusted for each source of data (iPad Pro, Models 1 and 2; or TLS FARO, Models 3 and 4). The residual distribution for the data from TLS FARO is better fit to the line at point zero, which reflects the smallest RMSE values.
All fitted models presented a satisfactory residual dispersion with homogeneous points along the regression line, without under- or overestimated points. For both models two and four, the estimated values were not significantly different from the original values of TFD (χ2iPad = 1.05, DF = 99, p-value = 1.00; χ2TLS = 0.67, DF = 99, p-value = 1.00).
Considering the machine learning techniques applied (Table 2), the random forest algorithm delivered slightly different precision parameters than the other algorithms (lower values for R2 and greater values for RMSE) for both methods of data acquisition (iPad Pro and TLS FARO).
In the graphical dispersion of residuals against the predicted TFD (Figure 9 and Figure 10), the random forest algorithm delivered the most interesting dispersion of residuals with points closer to and along the regression line, for both methods (iPad Pro and TLS FARO). Although all the other algorithms presented similar patterns, the SVM algorithm has a pattern of underestimation for the TLS FARO (Figure 10) and the KNN algorithm has an upper limit for the maximum values of TFD of 0.90 m for the TLS FARO data.
Among machine learning techniques, it was not possible to verify a satisfactory improvement in the precision parameters, compared to the fitted linear models. Otherwise, RMSE values from the machine learning algorithms are lower (Table 2) than the RMSE values from the linear models (Table 1), and for both groups of techniques, the R2 values were similar but higher for the machine learning algorithms.

4. Discussion

TFD data were collected in four different and equidistant directions around each tree due to the dimensional variability that can be promoted by factors such as the soil quality (depth and density), wind mean speed and direction, and solar radiation intensity over the tree crown [13,15]. However, for the local conditions of the group of trees measured at the Polish Airmen Park, we have found a uniform TFD size around tree trunks, with no specific projections for a given geographic position due to aforementioned factors. This made the modeling process more reliable, with a reduction in the magnitude of estimation errors.
On the other hand, the variability observed for the measured attributes is due to the diversity of species (10 species), inequality, and the conformation of the spatial distribution within the park. Due to these characteristics, the fitted models are more general, and in this case they can be used to estimate the TFD for a greater number of species that are frequently planted in different places in cities.
In general, the fitted models presented a high performance based on the evaluated parameters, showing consistency with the results obtained in similar studies [12,13,17]. For different groups of tree species and different places, with simple linear regression models using DBH as an independent variable, Hilbert et al. [13] obtained values of R2 and R2adj. above 0.80 and values of RMSE between 0.05 and 0.18 m, which concurs with the data presented.
It is worth noting that although the fitted models have presented excellent results, it is known that they should be used with caution and in planning situations with similar values to the values studied here, since the equations can generate a greater error for trees with PBH values greater than the values obtained in this research (2.31 m in PBH or 0.74 m in DBH).
As for the methods of data acquisition, point clouds can be considered highly accurate and easy to automate the analysis procedures, but different methods and devices to collect data can generate different results and errors [24]. The FARO Focus 3D X130 is a professional terrestrial laser scanner with greater coverage, greater detailing. Therefore, it is more complex, demanding adaptations and longer time of analysis to obtain the measurements correctly. The survey made with the iPad Pro already generates a less dense point cloud and is less rich in details; however, it needed many adaptations at the time of its use. These were situations that required a large amount of analysis and resourcefulness to obtain reliable data for the study.
The iPad Pro’s HLS has proven to be a useful and accurate tool for collecting tree data. In a study by Tatsumi et al. [25], the DBH results of mapping trees using this method and a traditional survey procedure with a tape measure were almost equal. Çakir et al. [26] also showed that this procedure produces accurate results for both forest and urban forest research regions, when compared to field measurement methods. Although this methodology has its limitations regarding the maximum distance from the tree (up to 5.0 m), it proves to be an efficient tool overall, depending on the type and conditions of the forest measurements [22,23,24,25].
Regarding the prediction of TFD by machine learning techniques, a modest improvement in the R2 and RMSE metrics was verified, compared to the traditional modeling process. This may have occurred due to the data showing linearity between the dependent and independent variables, which resulted in a good fit of the traditional models. Nevertheless, this result may be related to the small number of samples (n = 100) and the low complexity of the variables studied.
As highlighted by Thongpeth et al. [34] in a study carried out with an extensive database (n = 18,342) of 11 variables, the performance of machine learning techniques depends on the sample size. Therefore, a great database tends to provide better prediction performance, as these techniques need a large sample to learn, while the performance of linear models depends on the data variance.
Studying the TFD is essential for the proper planning and management of urban forests. It has been known that increased width of the planting strip decreases the probability of damage to the sidewalks and curbs [13,17,35]. In this sense, one of the applications of the TFD estimation models is to assist in the management and prevention of damage by serving as a tool for the planning of spaces that are more suitable for the growth of trees. As the trees grow, they can become incompatible with urban infrastructure due to the increase in anchorage size to support the incident static and dynamic loads [8,14,15]. Through this, they end up damaging sidewalks, floors, and buildings. In addition, the way that sidewalks are built in association to small planting pits and the poor quality of seedlings and soil can also contribute to increasing damages [15,36].
With this, the variables TFD, DBH, and PBH are very important for the proper planning of the sizes of some urban structures, such as sidewalks, curbs, and the flowerbed where trees can be planted. In this context, Koeser et al. [17] estimated the TFD and proposed an equation using the estimated TFD values and a buffer value equal to 1.2 to predict the minimum planting widths for small- to medium-sized trees in urban areas. The simplified model to estimate TFD had an R2 of 0.79, based on data from 288 trees (from newly planted to the largest sized tree found) of eleven different species.
Furthermore, the newly adjusted models, which predict the TFD as a function of the PBH, can be used in other areas, such as environmental protection. For example, in the case where a removed tree is found, one can measure the surface anchoring and discover the approximate PBH of the tree. With this variable, through other models, it is possible to estimate the total height and the crown area to determine values of fines and judicial reimbursements due to unauthorized tree removal. Thus, these models do not have their application restricted to urban areas and are of great benefit to forest science.

5. Conclusions

Our findings suggest that the point clouds based on the iPad Pro (HLS) are reliable to use as a source of data acquisition for modeling the TDF of urban trees, generating models as precise as those generated by the FARO FOCUS 3D (TLS) point clouds.
Considering the tested techniques, both promoted good and similar statistics and traditional linear models estimated by regression process were not different from the machine learning techniques, although the random forest algorithm showed the best fitting for the TFD estimation.
The fitted models and algorithms showed reliability and no overestimation or underestimation of the estimated TFD, which is a promising response to studies related to the topic of both the planning of the best space for tree growth at the ground level and the use for DBH estimations due to illegal tree removal.

Author Contributions

Conceptualization, R.B., M.W. and P.W.; methodology, R.B., M.W., T.C., L.P.S. and P.W.; software, R.B., M.W., L.P.S., P.W. and T.C.; validation, R.B., P.W. and T.C.; formal analysis, R.B., L.P.S. and T.C.; visualization, R.B., M.W., M.S. and P.W.; writing—original draft preparation, R.B., L.P.S., T.C., M.W., M.S. and P.W.; supervision, R.B., M.S. and P.W. All authors have read and agreed to the published version of the manuscript.

Funding

This research was supported by ProGea Consulting and the Ministry of Science and Higher Education of the Republic of Poland.

Acknowledgments

Thanks to ProGea Consulting for the devices made free available for this study.

Conflicts of Interest

The authors declare no conflict of interest. The funders had no role in the design of the study; in the collection, analyses, or interpretation of data; in the writing of the manuscript, or in the decision to publish the results.

References

  1. Widney, S.; Fischer, B.C.; Vogt, J. Tree Mortality Undercuts Ability of Tree-Planting Programs to Provide Benefits: Results of a Three-City Study. Forests 2016, 7, 65. [Google Scholar] [CrossRef]
  2. Lyytimäki, J. Disservices of urban trees. In Routledge Handbook of Urban Forestry; Ferrini, F., Van Den Bosch, C.C.K., Fini, A., Eds.; Taylor & Francis Group: New York, NY, USA, 2017; pp. 164–176. [Google Scholar] [CrossRef]
  3. Sharifi, A. Resilient urban forms: A review of literature on streets and street networks. Build. Environ. 2019, 147, 171–187. [Google Scholar] [CrossRef]
  4. Nowak, D.J.; Greenfield, E.J.; Hoehn, R.W.; Lapoint, E. Carbon storage and sequestration by trees in urban and community areas of the United States. Environ. Pollut. 2013, 178, 229–236. [Google Scholar] [CrossRef] [PubMed]
  5. Szota, C.; Coutts, A.M.; Thom, J.K.; Virahsawmy, H.K.; Fletcher, T.D.; Livesley, S.J. Street tree stormwater control measures can reduce runoff but may not benefit established trees. Landsc. Urban Plan. 2019, 182, 144–155. [Google Scholar] [CrossRef]
  6. Klemm, W.; Heusinkveld, B.G.; Lenzholzer, S.; Hove, B. Street greenery and its physical and psychological impact on thermal comfort. Landsc. Urban Plan. 2015, 138, 87–98. [Google Scholar] [CrossRef]
  7. Schwarz, K.; Fragkias, M.; Boone, C.G.; Zhou, W.; McHale, M.; Grove, J.M.; O’Neil-Dunne, J.; McFadden, J.P.; Buckley, G.L.; Childers, D.; et al. Trees Grow on Money: Urban Tree CanopyCover and Environmental Justice. PLoS ONE 2015, 10, e122051. [Google Scholar] [CrossRef]
  8. Urban, J. Up by Roots: Healthy Soils and Trees in the Built Environment; ISA: Champaign, IL, USA, 2008. [Google Scholar]
  9. Mullaney, J.; Lucke, T.; Trueman, S.J. A review of benefits and challenges in growing street trees in paved urban environments. Landsc. Urban Plan. 2015, 134, 157–166. [Google Scholar] [CrossRef]
  10. Ordóñez, C.; Duinker, P.N. An analysis of urban forest management plans in Canada: Implications for urban forest management. Landsc. Urban Plan. 2013, 116, 36–47. [Google Scholar] [CrossRef]
  11. Gao, J.; O’Neill, B.C. Mapping global urban land for the 21st century with data-driven simulations and Shared Socioeconomic Pathways. Nat. Commun. 2020, 11, 2302. [Google Scholar] [CrossRef]
  12. North, E.A.; Johnson, G.R.; Burk, T.E. Trunk flare diameter predictions as an infrastructure planning tool to reduce tree and sidewalk conflicts. Urban For. Urban Green. 2015, 14, 65–71. [Google Scholar] [CrossRef]
  13. Hilbert, D.R.; North, E.A.; Hauer, R.J.; Koeser, A.K.; McLean, D.C.; Northrop, R.J.; Andreu, M.; Parbs, S. Predicting trunk flare diameter to prevent tree damage to infrastructure. Urban For. Urban Green. 2020, 49, 126645. [Google Scholar] [CrossRef]
  14. Mattheck, C.; Breloer, H. The Body Language of Trees: A Handbook for Failure Analysis; The Stationery Office: London, UK, 1993. [Google Scholar]
  15. Hirons, A.D.; Thomas, P.A. Applied Tree Biology; Willey Blackwell: Oxford, UK, 2018. [Google Scholar] [CrossRef]
  16. North, E.A.; D’Amato, A.W.; Russell, M.B.; Johnson, G.R. The influence of sidewalk replacement on urban street tree growth. Urban For. Urban Green. 2017, 24, 116–124. [Google Scholar] [CrossRef]
  17. Koeser, A.K.; Hauer, R.J.; Hilbert, D.R.; Northrop, R.J.; Thorn, H.; Mclean, D.C.; Salisbury, A.B. The Tripping Point–Minimum Planting Widths for Small-Stature Trees in Dense Urban Developments. Sustainability 2022, 14, 3283. [Google Scholar] [CrossRef]
  18. Bienert, A.; Scheller, S.; Keane, E.; Mullooly, G.; Mohan, F. Application of Terrestrial Laser Sanners for the Determination of Forest Inventory Parameters. In Image Engineering and Vision Metrology; Maas, H.-G., Schneider, D., Eds.; International Archives of Photogrametry, Remote Sensing and Spatial Information Sciences: Dresden, Germany, 2006; Volume XXXVI. [Google Scholar]
  19. Wężyk, P.; Tompalski, P. Determining the tree density parameter in pine stands based on the analysis of the terrestrial laser scanning point clouds. Ann. Geomatics 2010, 8, 83–90. [Google Scholar]
  20. Wężyk, P.; Sroga, R.; Szwed, P.; Szostak, M.; Tompalski, P.; Kozioł, K. Application of terrestrial laser scanning for derriving selected trees and forest stand parameters. Arch. Photogramm. Cartogr. Remote Sens. 2009, 19, 447–457. [Google Scholar]
  21. Henning, J.G.; Radtke, P.J. Detailed Stem Measurements of Standing Trees from Ground Based Scanning Lidar. For. Sci. 2006, 52, 67–80. [Google Scholar]
  22. Wang, X.; Singh, A.; Pervysheva, Y.; Lamatungga, K.E.; Murtinová, V.; Mukarram, M.; Zhu, Q.; Song, K.; Surový, P.; Mokroš, M. Evaluation of iPad Pro 2020 for estimating tree diameters in urban forest. ISPRS Ann. Photogramm. Remote Sens. Spat. Inf. Sci. 2021, 8, 105–110. [Google Scholar] [CrossRef]
  23. Gollob, C.; Ritter, T.; Kraßnitzer, R.; Tockner, A.; Nothdurft, A. Measurement of Forest Inventory Parameters with Apple iPad Pro and Integrated LiDAR Technology. Remote Sens. 2021, 13, 3129. [Google Scholar] [CrossRef]
  24. Mokroš, M.; Mikita, T.; Singh, A.; Tomaštík, J.; Chudá, J.; Wężyk, P.; Kuželka, K.; Surový, P.; Klimánek, M.; Zięba-Kulawik, K.; et al. Novel low-cost mobile mapping systems for forest inventories as terrestrial laser scanning alternatives. Int. J. Appl. Earth Obs. Geoinf. 2021, 104, 102512. [Google Scholar] [CrossRef]
  25. Tatsumi, S.; Yamaguchi, K.; Furuya, N. ForestScanner: A mobile application for measuring and mapping trees with LiDAR-equipped iPhone and iPad. Methods Ecol. Evol. 2022, 00, 1–7. [Google Scholar] [CrossRef]
  26. Çakir, G.Y.; Post, C.J.; Mikhailova, E.A.; Schlautman, M.A. 3D LiDAR Scanning of Urban Forest Structure Using a Consumer Tablet. Urban Sci. 2021, 5, 88. [Google Scholar] [CrossRef]
  27. Wang, F.; Heenkenda, M.K.; Freeburn, J.T. Estimating tree Diameter at Breast Height (DBH) using an iPad Pro LiDAR sensor. Remote Sens. Lett. 2022, 13, 568–578. [Google Scholar] [CrossRef]
  28. McGaughey, R.J. FUSION/LDV LIDAR: Software for LIDAR Data Analysis Andvisualization, Version 3.80; USDA Forest Service: Pacific Northwest Research Station: Portland, OR, USA, 2018; Available online: http://forsys.cfr.washington.edu/fusion/fusion_overview.html (accessed on 17 July 2020).
  29. Matloff, N. Statistical Regression and Classification—From Linear Models to Machine Learning; Taylor & Francis Group: New York, NY, USA, 2017. [Google Scholar] [CrossRef]
  30. Tavares Júnior, I.S.; Rocha, J.E.C.; Ebling, A.E.; Chaves, A.S.; Zanuncio, J.C.; Farias, A.A.; Leite, H.G. Artificial Neural Networks and Linear Regression Reduce Sample Intensity to Predict the Commercial Volume of Eucalyptus Clones. Forests 2019, 10, 268. [Google Scholar] [CrossRef]
  31. Júnior, I.D.S.T.; Torres, C.M.M.E.; Leite, H.G.; de Castro, N.L.M.; Soares, C.P.B.; Castro, R.V.O.; Farias, A.A. Machine learning: Modeling increment in diameter of individual trees on Atlantic Forest fragments. Ecol. Indic. 2020, 117, 106685. [Google Scholar] [CrossRef]
  32. Aksu, G.; Güzeller, C.O.; Eser, M.T. The effect of the normalization method used in different sample sizes on the success of artificial neural network model. Int. J. Assess. Tools Educ. 2019, 6, 170–192. [Google Scholar] [CrossRef]
  33. Song, Q.C.; Tang, C.; Wee, S. Making sense of model generalizability: A tutorial on cross-validation in R and Shiny. Adv. Methods Pract. Psychol. Sci. 2021, 4, 2515245920947067. [Google Scholar] [CrossRef]
  34. Thongpeth, W.; Lim, A.; Wongpairin, A.; Thongpeth, T.; Chaimontree, S. Comparison of linear, penalized linear and machine learning models predicting hospital visit costs from chronic disease in Thailand. Inform. Med. Unlocked 2021, 26, 100769. [Google Scholar] [CrossRef]
  35. Scholz, M.; Uzomah, V.C.; Al-Faraj, F.A.M. Potential tree species for use in urban areas in temperate and oceanic climates. Heliyon 2016, 2, e00154. [Google Scholar] [CrossRef]
  36. Benatti, D.P.; Tonello, K.C.; Adriano Júnior, F.C.; Silva, J.M.S.; Oliveira, I.R.; Rolim, E.N.; Ferraz, D.L. Inventário arbóreo-urbano do município de Salto de Pirapora, SP. Árvore 2012, 36, 887–894. [Google Scholar] [CrossRef] [Green Version]
Figure 1. The study area: (a) overview map of Poland; (b) location of the Polish Airmen Park in Cracow; (c) the Polish Airmen Park in Cracow and the location of the scanned group of trees.
Remotesensing 14 04661 g001
Figure 2. The scanning process of a selected tree of Populus balsamifera: (a) the PBH position marked with a red stripe; (b) the point clouds of the tree.
Remotesensing 14 04661 g002
Figure 3. The 3D data acquisition using the iPad Pro (Apple) of an Acer saccharinum tree: (a) the texturized 3D image; (b) the 3D point cloud profile of the tree scanned; (c) the slice of point cloud at the PBH position.
Remotesensing 14 04661 g003
Figure 4. Flowchart describing the sequence of research steps.
Remotesensing 14 04661 g004
Figure 5. The FARO TLS scanning in a group of Acer saccharinum trees (a) showing in (b) the white mark at the PBH position on the trunk, part of the PBH slices of trees scanned (c), the thickness of the PBH slice from point clouds (d), and the slice of the PBH point cloud (e).
Remotesensing 14 04661 g005
Figure 6. The trunk flare diameter (TFD) limit in two trees of different species: (a) Acer saccharinum; (b) Populus balsamifera, and the position of the TFD measurement in different equidistant directions (c), and the measurement of TFD (d) visualized in a point cloud based on iPad Pro (HLS).
Remotesensing 14 04661 g006
Figure 7. Data dispersal between pairs of variables and their linear pattern: (a) PBH; (b) TFD data; and (c) variables used for the modeling process from TLS FARO; (d) from iPad Pro.
Remotesensing 14 04661 g007
Figure 8. Residual distribution according to the predicted trunk flare diameter from the iPad Pro data (Models 1 and 2) and from the TLS FARO data (Models 3 and 4).
Remotesensing 14 04661 g008
Figure 9. Residual distribution according to the predicted trunk flare diameter from four different algorithms using iPad Pro data.
Remotesensing 14 04661 g009
Figure 10. Graphics for the distribution of the residuals according to the predicted trunk flare diameter from four different algorithms using TLS FARO data.
Remotesensing 14 04661 g010
Table 1. Models fit by the forward stepwise regression for both sources of data acquisition.
Model SourceModels’ Variables and CoefficientsR2R2adj.Syx%RMSE (m)
1iPad ProTFD = 0.1119 + (0.5113 × PBH)0.89980.89887.50.0741
2iPad ProTFD = (e 1.2502 − (1.6901 × (1/√PBH))) × (e (0.5 × 0.013828909))0.88180.880611.70.0774
3TLS FAROTFD = 0.5216 + (0.5354 × (ln PBH))0.89840.89736.50.0646
4TLS FAROTFD = (e 1.3497 − (2.0349 × (1/√PBH))) × (e (0.5 × 0.011781564))0.91200.911110.80.0651
ln = natural logarithm, TFD = tree flare diameter, PBH = perimeter at breast height, R2 = coefficient of determination. R2adj. = adjusted coefficient of determination, Syx% = estimated standard error, RMSE = root mean square error, AC = Abound Capture application.
Table 2. Precision statistics for each of the four algorithms applied for data from iPad Pro and TLS FARO.
Data SourceAlgorithmR2RMSE (m)
iPad Pro (Abound Capture)ANN0.91710.0736
iPad Pro (Abound Capture)KNN0.90480.0791
iPad Pro (Abound Capture)SVM0.91720.0726
iPad Pro (Abound Capture)RF0.87800.0872
TLS FARO (3D X130 Model)ANN0.91640.0649
TLS FARO (3D X130 Model)KNN0.91060.0668
TLS FARO (3D X130 Model)SVM0.91590.0671
TLS FARO (3D X130 Model)RF0.89610.0702
ANN: artificial neural networks, KNN: k-nearest neighbors. SVM: support vector machine, RF: random forest (RF).
Publisher’s Note: MDPI stays neutral with regard to jurisdictional claims in published maps and institutional affiliations.

