Next Issue
Volume 12, March-2
Previous Issue
Volume 12, February-2
 
 
remotesensing-logo

Journal Browser

Journal Browser

Remote Sens., Volume 12, Issue 5 (March-1 2020) – 153 articles

Cover Story (view full-size image): 
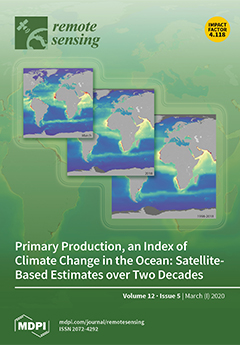
Primary production by marine phytoplankton is one of the largest fluxes of carbon on our planet. In the past few decades, considerable progress has been made in estimating global primary production at high spatial and temporal scales by combining in situ measurements of primary production with remote sensing observations of phytoplankton biomass. Here, we address one of the major challenges in this approach by improving the assignment of appropriate model parameters that define the photosynthetic response of phytoplankton cells. A global database of over 9,000 in situ photosynthesis–irradiance measurements and a 20-year record of climate quality satellite observations were used to assess global primary production and its variability between 1998 and 2018.View this paper.
  • Issues are regarded as officially published after their release is announced to the table of contents alert mailing list.
  • You may sign up for e-mail alerts to receive table of contents of newly released issues.
  • PDF is the official format for papers published in both, html and pdf forms. To view the papers in pdf format, click on the "PDF Full-text" link, and use the free Adobe Reader to open them.
Order results
Result details
Section
Select all
Export citation of selected articles as:
29 pages, 8314 KiB  
Article
Taking the Motion out of Floating Lidar: Turbulence Intensity Estimates with a Continuous-Wave Wind Lidar
by Felix Kelberlau, Vegar Neshaug, Lasse Lønseth, Tania Bracchi and Jakob Mann
Remote Sens. 2020, 12(5), 898; https://doi.org/10.3390/rs12050898 - 10 Mar 2020
Cited by 28 | Viewed by 8251
Abstract
Due to their motion, floating wind lidars overestimate turbulence intensity ( T I ) compared to fixed lidars. We show how the motion of a floating continuous-wave velocity–azimuth display (VAD) scanning lidar in all six degrees of freedom influences the T I estimates, [...] Read more.
Due to their motion, floating wind lidars overestimate turbulence intensity ( T I ) compared to fixed lidars. We show how the motion of a floating continuous-wave velocity–azimuth display (VAD) scanning lidar in all six degrees of freedom influences the T I estimates, and present a method to compensate for it. The approach presented here uses line-of-sight measurements of the lidar and high-frequency motion data. The compensation algorithm takes into account the changing radial velocity, scanning geometry, and measurement height of the lidar beam as the lidar moves and rotates. It also incorporates a strategy to synchronize lidar and motion data. We test this method with measurement data from a ZX300 mounted on a Fugro SEAWATCH Wind LiDAR Buoy deployed offshore and compare its T I estimates with and without motion compensation to measurements taken by a fixed land-based reference wind lidar of the same type located nearby. Results show that the T I values of the floating lidar without motion compensation are around 50 % higher than the reference values. The motion compensation algorithm detects the amount of motion-induced T I and removes it from the measurement data successfully. Motion compensation leads to good agreement between the T I estimates of floating and fixed lidar under all investigated wind conditions and sea states. Full article
(This article belongs to the Special Issue Advances in Atmospheric Remote Sensing with Lidar)
Show Figures

Graphical abstract

14 pages, 1679 KiB  
Letter
Effectiveness of Innovate Educational Practices with Flipped Learning and Remote Sensing in Earth and Environmental Sciences—An Exploratory Case Study
by Juan Antonio López Núñez, Jesús López Belmonte, Antonio José Moreno Guerrero and Santiago Pozo Sánchez
Remote Sens. 2020, 12(5), 897; https://doi.org/10.3390/rs12050897 - 10 Mar 2020
Cited by 33 | Viewed by 5598
Abstract
The rapid advancements in the technological field, especially in the field of education, have led to the incorporation of remote sensing in learning spaces. This innovation requires active and effective teaching methods, among which is flipped learning. The objective of this research was [...] Read more.
The rapid advancements in the technological field, especially in the field of education, have led to the incorporation of remote sensing in learning spaces. This innovation requires active and effective teaching methods, among which is flipped learning. The objective of this research was to analyze the effectiveness of flipped learning on the traditional-expository methodology in the second year of high school. The research is part of a quantitative methodology based on a quasi-experimental design of descriptive and correlational type. Data collection was carried out through an ad hoc questionnaire applied in a sample of 59 students. The Student’s t-test was applied for independent samples, differentiating the means given between the experimental group and the control group. The results show that there was a better assessment of the teaching method through flipped learning than the traditional teaching method in all the variables analyzed, except in the academic results, where the difference was minimal. It is concluded that flipped learning provides improvements in instructional processes in high school students who have used remote sensing in training practices. Therefore, the combination of flipped learning and remote sensing is considered effective for the work of contents related to environmental sciences in said educational level. Full article
(This article belongs to the Collection Teaching and Learning in Remote Sensing)
Show Figures

Graphical abstract

19 pages, 7362 KiB  
Article
Estimation of Hourly Rainfall during Typhoons Using Radar Mosaic-Based Convolutional Neural Networks
by Chih-Chiang Wei and Po-Yu Hsieh
Remote Sens. 2020, 12(5), 896; https://doi.org/10.3390/rs12050896 - 10 Mar 2020
Cited by 16 | Viewed by 3832
Abstract
Taiwan is located at the junction of the tropical and subtropical climate zones adjacent to the Eurasian continent and Pacific Ocean. The island frequently experiences typhoons that engender severe natural disasters and damage. Therefore, efficiently estimating typhoon rainfall in Taiwan is essential. This [...] Read more.
Taiwan is located at the junction of the tropical and subtropical climate zones adjacent to the Eurasian continent and Pacific Ocean. The island frequently experiences typhoons that engender severe natural disasters and damage. Therefore, efficiently estimating typhoon rainfall in Taiwan is essential. This study examined the efficacy of typhoon rainfall estimation. Radar images released by the Central Weather Bureau were used to estimate instantaneous rainfall. Additionally, two proposed neural network-based architectures, namely a radar mosaic-based convolutional neural network (RMCNN) and a radar mosaic-based multilayer perceptron (RMMLP), were used to estimate typhoon rainfall, and the commonly applied Marshall–Palmer Z-R relationship (Z-R_MP) and a reformulated Z-R relationship at each site (Z-R_station) were adopted to construct benchmark models. Monitoring stations in Hualien, Sun Moon Lake, and Taichung were selected as the experimental stations in Eastern, Central, and Western Taiwan, respectively. This study compared the performance of the models in predicting rainfall at the three stations, and the results are outlined as follows: at the Hualien station, the estimations of the RMCNN, RMMLP, Z-R_MP, and Z-R_station models were mostly identical to the observed rainfall, and all models estimated an increase during peak rainfall on the hyetographs, but the peak values were underestimated. At the Sun Moon Lake and Taichung stations, however, the estimations of the four models were considerably inconsistent in terms of overall rainfall rates, peak rainfall, and peak rainfall arrival times on the hyetographs. The relative root mean squared error for overall rainfall rates of all stations was smallest when computed using RMCNN (0.713), followed by those computed using RMMLP (0.848), Z-R_MP (1.030), and Z-R_station (1.392). Moreover, RMCNN yielded the smallest relative error for peak rainfall (0.316), followed by RMMLP (0.379), Z-R_MP (0.402), and Z-R_station (0.688). RMCNN computed the smallest relative error for the peak rainfall arrival time (1.507 h), followed by RMMLP (2.673 h), Z-R_MP (2.917 h), and Z-R_station (3.250 h). The results revealed that the RMCNN model in combination with radar images could efficiently estimate typhoon rainfall. Full article
(This article belongs to the Special Issue Deep Neural Networks for Remote Sensing Applications)
Show Figures

Graphical abstract

25 pages, 32443 KiB  
Article
Remote Sensing Derived Indices for Tracking Urban Land Surface Change in Case of Earthquake Recovery
by Sahar Derakhshan, Susan L. Cutter and Cuizhen Wang
Remote Sens. 2020, 12(5), 895; https://doi.org/10.3390/rs12050895 - 10 Mar 2020
Cited by 12 | Viewed by 4498
Abstract
The study of post-disaster recovery requires an understanding of the reconstruction process and growth trend of the impacted regions. In case of earthquakes, while remote sensing has been applied for response and damage assessment, its application has not been investigated thoroughly for monitoring [...] Read more.
The study of post-disaster recovery requires an understanding of the reconstruction process and growth trend of the impacted regions. In case of earthquakes, while remote sensing has been applied for response and damage assessment, its application has not been investigated thoroughly for monitoring the recovery dynamics in spatially and temporally explicit dimensions. The need and necessity for tracking the change in the built-environment through time is essential for post-disaster recovery modeling, and remote sensing is particularly useful for obtaining this information when other sources of data are scarce or unavailable. Additionally, the longitudinal study of repeated observations over time in the built-up areas has its own complexities and limitations. Hence, a model is needed to overcome these barriers to extract the temporal variations from before to after the disaster event. In this study, a method is introduced by using three spectral indices of UI (urban index), NDVI (normalized difference vegetation index) and MNDWI (modified normalized difference water index) in a conditional algebra, to build a knowledge-based classifier for extracting the urban/built-up features. This method enables more precise distinction of features based on environmental and socioeconomic variability, by providing flexibility in defining the indices’ thresholds with the conditional algebra statements according to local characteristics. The proposed method is applied and implemented in three earthquake cases: New Zealand in 2010, Italy in 2009, and Iran in 2003. The overall accuracies of all built-up/non-urban classifications range between 92% to 96.29%; and the Kappa values vary from 0.79 to 0.91. The annual analysis of each case, spanning from 10 years pre-event, immediate post-event, and until present time (2019), demonstrates the inter-annual change in urban/built-up land surface of the three cases. Results in this study allow a deeper understanding of how the earthquake has impacted the region and how the urban growth is altered after the disaster. Full article
Show Figures

Graphical abstract

13 pages, 7241 KiB  
Letter
Research on Post-Earthquake Landslide Extraction Algorithm Based on Improved U-Net Model
by Peng Liu, Yongming Wei, Qinjun Wang, Yu Chen and Jingjing Xie
Remote Sens. 2020, 12(5), 894; https://doi.org/10.3390/rs12050894 - 10 Mar 2020
Cited by 83 | Viewed by 5894
Abstract
Seismic landslides are the most common and highly destructive earthquake-triggered geological hazards. They are large in scale and occur simultaneously in many places. Therefore, obtaining landslide information quickly after an earthquake is the key to disaster mitigation and relief. The survey results show [...] Read more.
Seismic landslides are the most common and highly destructive earthquake-triggered geological hazards. They are large in scale and occur simultaneously in many places. Therefore, obtaining landslide information quickly after an earthquake is the key to disaster mitigation and relief. The survey results show that most of the landslide-information extraction methods involve too much manual participation, resulting in a low degree of automation and the inability to provide effective information for earthquake rescue in time. In order to solve the abovementioned problems and improve the efficiency of landslide identification, this paper proposes an automatic landslide identification method named improved U-Net model. The intelligent extraction of post-earthquake landslide information is realized through the automatic extraction of hierarchical features. The main innovations of this paper include the following: (1) On the basis of the three RGB bands, three new bands, DSM, slope, and aspect, with spatial information are added, and the number of feature parameters of the training samples is increased. (2) The U-Net model structure is rebuilt by adding residual learning units during the up-sampling and down-sampling processes, to solve the problem that the traditional U-Net model cannot fully extract the characteristics of the six-channel landslide for its shallow structure. At the end of the paper, the new method is used in Jiuzhaigou County, Sichuan Province, China. The results show that the accuracy of the new method is 91.3%, which is 13.8% higher than the traditional U-Net model. It is proved that the new method is effective and feasible for the automatic extraction of post-earthquake landslides. Full article
Show Figures

Graphical abstract

24 pages, 8239 KiB  
Article
X-Net-Based Radar Data Assimilation Study over the Seoul Metropolitan Area
by Ji-Won Lee, Ki-Hong Min, Young-Hee Lee and GyuWon Lee
Remote Sens. 2020, 12(5), 893; https://doi.org/10.3390/rs12050893 - 10 Mar 2020
Cited by 15 | Viewed by 4487
Abstract
This study investigates the ability of the high-resolution Weather Research and Forecasting (WRF) model to simulate summer precipitation with assimilation of X-band radar network data (X-Net) over the Seoul metropolitan area. Numerical data assimilation (DA) experiments with X-Net (S- and X-band Doppler radar) [...] Read more.
This study investigates the ability of the high-resolution Weather Research and Forecasting (WRF) model to simulate summer precipitation with assimilation of X-band radar network data (X-Net) over the Seoul metropolitan area. Numerical data assimilation (DA) experiments with X-Net (S- and X-band Doppler radar) radial velocity and reflectivity data for three events of convective systems along the Changma front are conducted. In addition to the conventional assimilation of radar data, which focuses on assimilating the radial velocity and reflectivity of precipitation echoes, this study assimilates null-echoes and analyzes the effect of null-echo data assimilation on short-term quantitative precipitation forecasting (QPF). A null-echo is defined as a region with non-precipitation echoes within the radar observation range. The model removes excessive humidity and four types of hydrometeors (wet and dry snow, graupel, and rain) based on the radar reflectivity by using a three-dimensional variational (3D-Var) data assimilation technique within the WRFDA system. Some procedures for preprocessing radar reflectivity data and using null-echoes in this assimilation are discussed. Numerical experiments with conventional radar DA over-predicted the precipitation. However, experiments with additional null-echo information removed excessive water vapor and hydrometeors and suppressed erroneous model precipitation. The results of statistical model verification showed improvements in the analysis and objective forecast scores, reducing the amount of over-predicted precipitation. An analysis of a contoured frequency by altitude diagram (CFAD) and time–height cross-sections showed that increased hydrometeors throughout the data assimilation period enhanced precipitation formation, and reflectivity under the melting layer was simulated similarly to the observations during the peak precipitation times. In addition, overestimated hydrometeors were reduced through null-echo data assimilation. Full article
(This article belongs to the Special Issue Precipitation and Water Cycle Measurements Using Remote Sensing)
Show Figures

Graphical abstract

25 pages, 14879 KiB  
Article
Combining InfraRed Thermography and UAV Digital Photogrammetry for the Protection and Conservation of Rupestrian Cultural Heritage Sites in Georgia: A Methodological Application
by William Frodella, Mikheil Elashvili, Daniele Spizzichino, Giovanni Gigli, Luka Adikashvili, Nikoloz Vacheishvili, Giorgi Kirkitadze, Akaki Nadaraia, Claudio Margottini and Nicola Casagli
Remote Sens. 2020, 12(5), 892; https://doi.org/10.3390/rs12050892 - 10 Mar 2020
Cited by 36 | Viewed by 6217
Abstract
The rock-cut city of Vardzia is an example of the extraordinary rupestrian cultural heritage of Georgia. The site, Byzantine in age, was carved in the steep tuff slopes of the Erusheti mountains, and due to its peculiar geological characteristics, it is particularly vulnerable [...] Read more.
The rock-cut city of Vardzia is an example of the extraordinary rupestrian cultural heritage of Georgia. The site, Byzantine in age, was carved in the steep tuff slopes of the Erusheti mountains, and due to its peculiar geological characteristics, it is particularly vulnerable to weathering and degradation, as well as frequent instability phenomena. These problems determine serious constraints on the future conservation of the site, as well as the safety of the visitors. This paper focuses on the implementation of a site-specific methodology, based on the integration of advanced remote sensing techniques, such as InfraRed Thermography (IRT) and Unmanned Aerial Vehicle (UAV)-based Digital Photogrammetry (DP), with traditional field surveys and laboratory analyses, with the aim of mapping the potential criticality of the rupestrian complex on a slope scale. The adopted methodology proved to be a useful tool for the detection of areas of weathering and degradation on the tuff cliffs, such as moisture and seepage sectors related to the ephemeral drainage network of the slope. These insights provided valuable support for the design and implementation of sustainable mitigation works, to be profitably used in the management plan of the site of Vardzia, and can be used for the protection and conservation of rupestrian cultural heritage sites characterized by similar geological contexts. Full article
Show Figures

Graphical abstract

23 pages, 6223 KiB  
Article
Exploration for Object Mapping Guided by Environmental Semantics using UAVs
by Reem Ashour, Tarek Taha, Jorge Manuel Miranda Dias, Lakmal Seneviratne and Nawaf Almoosa
Remote Sens. 2020, 12(5), 891; https://doi.org/10.3390/rs12050891 - 10 Mar 2020
Cited by 9 | Viewed by 3719
Abstract
This paper presents a strategy to autonomously explore unknown indoor environments, focusing on 3D mapping of the environment and performing grid level semantic labeling to identify all available objects. Unlike conventional exploration techniques that utilize geometric heuristics and information gain theory on an [...] Read more.
This paper presents a strategy to autonomously explore unknown indoor environments, focusing on 3D mapping of the environment and performing grid level semantic labeling to identify all available objects. Unlike conventional exploration techniques that utilize geometric heuristics and information gain theory on an occupancy grid map, the work presented in this paper considers semantic information, such as the class of objects, in order to gear the exploration towards environmental segmentation and object labeling. The proposed approach utilizes deep learning to map 2D semantically segmented images into 3D semantic point clouds that encapsulate both occupancy and semantic annotations. A next-best-view exploration algorithm is employed to iteratively explore and label all the objects in the environment using a novel utility function that balances exploration and semantic object labeling. The proposed strategy was evaluated in a realistically simulated indoor environment, and results were benchmarked against other exploration strategies. Full article
(This article belongs to the Section Remote Sensing Image Processing)
Show Figures

Figure 1

24 pages, 3451 KiB  
Article
Can Landsat-Derived Variables Related to Energy Balance Improve Understanding of Burn Severity From Current Operational Techniques?
by Alfonso Fernández-Manso, Carmen Quintano and Dar A. Roberts
Remote Sens. 2020, 12(5), 890; https://doi.org/10.3390/rs12050890 - 10 Mar 2020
Cited by 6 | Viewed by 3268
Abstract
Forest managers rely on accurate burn severity estimates to evaluate post-fire damage and to establish revegetation policies. Burn severity estimates based on reflective data acquired from sensors onboard satellites are increasingly complementing field-based ones. However, fire not only induces changes in reflected and [...] Read more.
Forest managers rely on accurate burn severity estimates to evaluate post-fire damage and to establish revegetation policies. Burn severity estimates based on reflective data acquired from sensors onboard satellites are increasingly complementing field-based ones. However, fire not only induces changes in reflected and emitted radiation measured by the sensor, but also on energy balance. Evapotranspiration (ET), land surface temperature (LST) and land surface albedo (LSA) are greatly affected by wildfires. In this study, we examine the usefulness of these elements of energy balance as indicators of burn severity and compare the accuracy of burn severity estimates based on them to the accuracy of widely used approaches based on spectral indexes. We studied a mega-fire (more than 450 km2 burned) in Central Portugal, which occurred from 17 to 24 June 2017. The official burn severity map acted as a ground reference. Variations induced by fire during the first year following the fire event were evaluated through changes in ET, LST and LSA derived from Landsat data and related to burn severity. Fisher’s least significant difference test (ANOVA) revealed that ET and LST images could discriminate three burn severity levels with statistical significance (uni-temporal and multi-temporal approaches). Burn severity was estimated from ET, LST and LSA using thresholding. Accuracy of ET and LST based on burn severity estimates was adequate (κ = 0.63 and 0.57, respectively), similar to the accuracy of the estimate based on dNBR (κ = 0.66). We conclude that Landsat-derived surface energy balance variables, in particular ET and LST, in addition to acting as useful indicators of burn severity for mega-fires in Mediterranean ecosystems, may provide critical information about how energy balance changes due to fire. Full article
Show Figures

Figure 1

22 pages, 8756 KiB  
Article
Novel Soil Moisture Estimates Combining the Ensemble Kalman Filter Data Assimilation and the Method of Breeding Growing Modes
by Yize Li, Hong Shu, B. G. Mousa and Zhenhang Jiao
Remote Sens. 2020, 12(5), 889; https://doi.org/10.3390/rs12050889 - 10 Mar 2020
Cited by 4 | Viewed by 3310
Abstract
Soil moisture plays an important role in climate prediction and drought monitoring. Data assimilation, as a method of integrating multi-geographic spatial data, plays an increasingly important role in estimating soil moisture. Model prediction error, an important part of the background field information, occupies [...] Read more.
Soil moisture plays an important role in climate prediction and drought monitoring. Data assimilation, as a method of integrating multi-geographic spatial data, plays an increasingly important role in estimating soil moisture. Model prediction error, an important part of the background field information, occupies a position that could not be ignored in data assimilation. The model prediction error in data assimilation consists of three parts: forcing data error, initial field error, and model error. However, the influence of model error in current data assimilation methods has not been completely considered in many studies. Therefore, we proposed a theoretical framework of the ensemble Kalman filter (EnKF) data assimilation based on the breeding of growing modes (BGM) method. This framework used the BGM method to perturb the initial field error term w of EnKF, and the EnKF data assimilation to assimilate the data to obtain the soil moisture analysis value. The feasibility and superiority of the proposed framework were verified, taking into consideration breeding length and ensemble size through experiments. We conducted experiments and evaluated the accuracy of the BGM and the Monte Carlo (MC) methods. The experiment showed that the BGM method could improve the estimation accuracy of the assimilated soil moisture and solve the problem of model error which is not fully expressed in data assimilation. This study can be widely used in data assimilation and has a significant role in weather forecast and drought monitoring. Full article
Show Figures

Graphical abstract

17 pages, 5340 KiB  
Article
Assessing the Link between Human Modification and Changes in Land Surface Temperature in Hainan, China Using Image Archives from Google Earth Engine
by Lixia Chu, Francis Oloo, Helena Bergstedt and Thomas Blaschke
Remote Sens. 2020, 12(5), 888; https://doi.org/10.3390/rs12050888 - 10 Mar 2020
Cited by 21 | Viewed by 4409
Abstract
In many areas of the world, population growth and land development have increased demand for land and other natural resources. Coastal areas are particularly susceptible since they are conducive for marine transportation, energy production, aquaculture, marine tourism and other activities. Anthropogenic activities in [...] Read more.
In many areas of the world, population growth and land development have increased demand for land and other natural resources. Coastal areas are particularly susceptible since they are conducive for marine transportation, energy production, aquaculture, marine tourism and other activities. Anthropogenic activities in the coastal areas have triggered unprecedented land use change, depletion of coastal wetlands, loss of biodiversity, and degradation of other vital ecosystem services. The changes can be particularly drastic for small coastal islands with rich biodiversity. In this study, the influence of human modification on land surface temperature (LST) for the coastal island Hainan in Southern China was investigated. We hypothesize that for this island, footprints of human activities are linked to the variation of land surface temperature, which could indicate environmental degradation. To test this hypothesis, we estimated LST changes between 2000 and 2016 and computed the spatio-temporal correlation between LST and human modification. Specifically, we classified temperature data for the four years 2000, 2006, 2012 and 2016 into 5 temperature zones based on their respective mean and standard deviation values. We then assessed the correlation between each temperature zone and a human modification index computed for the year 2016. Apart from this, we estimated mean, maximum and the standard deviation of annual temperature for each pixel in the 17 years to assess the links with human modification. The results showed that: (1) The mean LST temperature in Hainan Island increased with fluctuations from 2000 to 2016. (2) The moderate temperature zones were dominant in the island during the four years included in this study. (3) A strong positive correlation of 0.72 between human modification index and mean and maximum LST temperature indicated a potential link between human modification and mean and maximum LST temperatures over the 17 years of analysis. (4) The mean value of human modification index in the temperature zones in 2016 showed a progressive rise with 0.24 in the low temperature zone, 0.33 in the secondary moderate, 0.45 in the moderate, 0.54 in the secondary high and 0.61 in the high temperature zones. This work highlighted the potential value of using large and multi-temporal earth observation datasets from cloud platforms to assess the influence of human activities in sensitive ecosystems. The results could contribute to the development of sustainable management and coastal ecosystems conservation plans. Full article
Show Figures

Graphical abstract

18 pages, 64457 KiB  
Article
Pars pro toto—Remote Sensing Data for the Reconstruction of a Rounded Chalcolithic Site from NE Romania: The Case of Ripiceni–Holm Settlement (Cucuteni Culture)
by Andrei Asăndulesei, Felix Adrian Tencariu and Ionut Cristi Nicu
Remote Sens. 2020, 12(5), 887; https://doi.org/10.3390/rs12050887 - 10 Mar 2020
Cited by 14 | Viewed by 4609
Abstract
Prehistoric sites in NE Romania are facing major threats more than ever, both from natural and human-induced hazards. One of the main reasons are the climate change determined natural disasters, but human-induced activities should also not be neglected. The situation is critical for [...] Read more.
Prehistoric sites in NE Romania are facing major threats more than ever, both from natural and human-induced hazards. One of the main reasons are the climate change determined natural disasters, but human-induced activities should also not be neglected. The situation is critical for Chalcolithic sites, with a very high density in the region and minimal traces at the surface, that are greatly affected by one or more natural hazards and/or anthropic interventions. The case study, Ripiceni–Holm, belonging to Cucuteni culture, is one of the most important Chalcolithic discoveries in the region. It is also the first evidence from Romania of a concentric arrangement of buildings in the proto-urban mega-sites tradition in Cucuteni-Trypillia cultural complex, and a solid piece of evidence in terms of irreversible natural and anthropic destruction. Using archival cartographic material, alongside non-destructive and high-resolution airborne sensing and ground-based geophysical techniques (LiDAR, total field and vertical gradient magnetometry), we managed to detect diachronic erosion processes for 31 years, to identify a complex internal spatial organization of the actual site and to outline a possible layout of the initial extent of the settlement. The erosion was determined with the help of the DSAS tool and highlighted an average erosion rate of 0.96 m/year. The main results argue a high percent of site destruction (approximately 45%) and the presence of an active shoreline affecting the integrity of the cultural layer. Full article
Show Figures

Graphical abstract

16 pages, 3189 KiB  
Article
Adapting Satellite Soundings for Operational Forecasting within the Hazardous Weather Testbed
by Rebekah B. Esmaili, Nadia Smith, Emily B. Berndt, John F. Dostalek, Brian H. Kahn, Kristopher White, Christopher D. Barnet, William Sjoberg and Mitchell Goldberg
Remote Sens. 2020, 12(5), 886; https://doi.org/10.3390/rs12050886 - 10 Mar 2020
Cited by 20 | Viewed by 4443
Abstract
In this paper, we describe how researchers and weather forecasters work together to make satellite sounding data sets more useful in severe weather forecasting applications through participation in National Oceanic and Atmospheric Administration (NOAA)’s Hazardous Weather Testbed (HWT) and JPSS Proving Ground and [...] Read more.
In this paper, we describe how researchers and weather forecasters work together to make satellite sounding data sets more useful in severe weather forecasting applications through participation in National Oceanic and Atmospheric Administration (NOAA)’s Hazardous Weather Testbed (HWT) and JPSS Proving Ground and Risk Reduction (PGRR) program. The HWT provides a forum for collaboration to improve products ahead of widespread operational deployment. We found that the utilization of the NOAA-Unique Combined Atmospheric Processing System (NUCAPS) soundings was improved when the product developer and forecaster directly communicated to overcome misunderstandings and to refine user requirements. Here we share our adaptive strategy for (1) assessing when and where NUCAPS soundings improved operational forecasts by using real, convective case studies and (2) working to increase NUCAPS utilization by improving existing products through direct, face-to-face interaction. Our goal is to discuss the lessons we learned and to share both our successes and challenges working with the weather forecasting community in designing, refining, and promoting novel products. We foresee that our experience in the NUCAPS product development life cycle may be relevant to other communities who can then build on these strategies to transition their products from research to operations (and operations back to research) within the satellite meteorological community. Full article
Show Figures

Graphical abstract

17 pages, 11917 KiB  
Article
Individual Tree Detection in a Eucalyptus Plantation Using Unmanned Aerial Vehicle (UAV)-LiDAR
by Juan Picos, Guillermo Bastos, Daniel Míguez, Laura Alonso and Julia Armesto
Remote Sens. 2020, 12(5), 885; https://doi.org/10.3390/rs12050885 - 10 Mar 2020
Cited by 57 | Viewed by 7331
Abstract
The present study addresses the tree counting of a Eucalyptus plantation, the most widely planted hardwood in the world. Unmanned aerial vehicle (UAV) light detection and ranging (LiDAR) was used for the estimation of Eucalyptus trees. LiDAR-based estimation of Eucalyptus is a challenge [...] Read more.
The present study addresses the tree counting of a Eucalyptus plantation, the most widely planted hardwood in the world. Unmanned aerial vehicle (UAV) light detection and ranging (LiDAR) was used for the estimation of Eucalyptus trees. LiDAR-based estimation of Eucalyptus is a challenge due to the irregular shape and multiple trunks. To overcome this difficulty, the layer of the point cloud containing the stems was automatically classified and extracted according to the height thresholds, and those points were horizontally projected. Two different procedures were applied on these points. One is based on creating a buffer around each single point and combining the overlapping resulting polygons. The other one consists of a two-dimensional raster calculated from a kernel density estimation with an axis-aligned bivariate quartic kernel. Results were assessed against the manual interpretation of the LiDAR point cloud. Both methods yielded a detection rate (DR) of 103.7% and 113.6%, respectively. Results of the application of the local maxima filter to the canopy height model (CHM) intensely depends on the algorithm and the CHM pixel size. Additionally, the height of each tree was calculated from the CHM. Estimates of tree height produced from the CHM was sensitive to spatial resolution. A resolution of 2.0 m produced a R2 and a root mean square error (RMSE) of 0.99 m and 0.34 m, respectively. A finer resolution of 0.5 m produced a more accurate height estimation, with a R2 and a RMSE of 0.99 and 0.44 m, respectively. The quality of the results is a step toward precision forestry in eucalypt plantations. Full article
(This article belongs to the Special Issue Individual Tree Detection and Characterisation from UAV Data)
Show Figures

Graphical abstract

2 pages, 144 KiB  
Editorial
Editorial for the Special Issue “ASTER 20th Anniversary”
by Yasushi Yamaguchi and Michael Abrams
Remote Sens. 2020, 12(5), 884; https://doi.org/10.3390/rs12050884 - 10 Mar 2020
Viewed by 2183
Abstract
The Advanced Spaceborne Thermal Emission and Reflection Radiometer (ASTER) is a research
facility instrument on NASA’s Terra spacecraft. Full article
(This article belongs to the Special Issue ASTER 20th Anniversary)
18 pages, 26233 KiB  
Article
Temporal Variation and Spatial Structure of the Kuroshio-Induced Submesoscale Island Vortices Observed from GCOM-C and Himawari-8 Data
by Po-Chun Hsu, Chia-Ying Ho, Hung-Jen Lee, Ching-Yuan Lu and Chung-Ru Ho
Remote Sens. 2020, 12(5), 883; https://doi.org/10.3390/rs12050883 - 09 Mar 2020
Cited by 16 | Viewed by 3755
Abstract
Dynamics of ocean current-induced island wake has been an important issue in global oceanography. Green Island, a small island located off southeast of Taiwan on the Kuroshio path was selected as the study area to more understand the spatial structure and temporal variation [...] Read more.
Dynamics of ocean current-induced island wake has been an important issue in global oceanography. Green Island, a small island located off southeast of Taiwan on the Kuroshio path was selected as the study area to more understand the spatial structure and temporal variation of well-organized vortices formed by the interaction between the Kuroshio and the island. Sea surface temperature (SST) and chlorophyll-a (Chl-a) concentration data derived from the Himawari-8 satellite and the second generation global imager (SGLI) of global change observation mission (GCOM-C) were used in this study. The spatial SST and Chl-a variations in designed observation lines and the cooling zone transitions on the left and right sides of the vortices were investigated using 250 m spatial resolution GCOM-C data. The Massachusetts Institute of Technology general circulation model (MITgcm) simulation confirmed that the positive and negative vortices were sequentially detached from each other in a few hours. In addition, totals of 101 vortexes from July 2015 to December 2019 were calculated from the 1-h temporal resolution Himawari-8 imagery. The average vortex propagation speed was 0.95 m/s. Totals of 38 cases of two continuous vortices suggested that the average vortex shedding period is 14.8 h with 1.15 m/s of the average incoming surface current speed of Green Island, and the results agreed to the ideal Strouhal-Reynolds number fitting curve relation. Combined with the satellite observation and numerical model simulation, this study demonstrates the structure of the wake area could change quickly, and the water may mix in different vorticity states for each observation station. Full article
Show Figures

Graphical abstract

26 pages, 6942 KiB  
Article
Fusing China GF-5 Hyperspectral Data with GF-1, GF-2 and Sentinel-2A Multispectral Data: Which Methods Should Be Used?
by Kai Ren, Weiwei Sun, Xiangchao Meng, Gang Yang and Qian Du
Remote Sens. 2020, 12(5), 882; https://doi.org/10.3390/rs12050882 - 09 Mar 2020
Cited by 43 | Viewed by 5203
Abstract
The China GaoFen-5 (GF-5) satellite sensor, which was launched in 2018, collects hyperspectral data with 330 spectral bands, a 30 m spatial resolution, and 60 km swath width. Its competitive advantages compared to other on-orbit or planned sensors are its number of bands, [...] Read more.
The China GaoFen-5 (GF-5) satellite sensor, which was launched in 2018, collects hyperspectral data with 330 spectral bands, a 30 m spatial resolution, and 60 km swath width. Its competitive advantages compared to other on-orbit or planned sensors are its number of bands, spectral resolution, and swath width. Unfortunately, its applications may be undermined by its relatively low spatial resolution. Therefore, the data fusion of GF-5 with high spatial resolution multispectral data is required to further enhance its spatial resolution while preserving its spectral fidelity. This paper conducted a comprehensive evaluation study of fusing GF-5 hyperspectral data with three typical multispectral data sources (i.e., GF-1, GF-2 and Sentinel-2A (S2A)), based on quantitative metrics, classification accuracy, and computational efficiency. Datasets on three study areas of China were utilized to design numerous experiments, and the performances of nine state-of-the-art fusion methods were compared. Experimental results show that LANARAS (this method was proposed by lanaras et al.), Adaptive Gram–Schmidt (GSA), and modulation transfer function (MTF)-generalized Laplacian pyramid (GLP) methods are more suitable for fusing GF-5 with GF-1 data, MTF-GLP and GSA methods are recommended for fusing GF-5 with GF-2 data, and GSA and smoothing filtered-based intensity modulation (SFIM) can be used to fuse GF-5 with S2A data. Full article
(This article belongs to the Special Issue Advanced Techniques for Spaceborne Hyperspectral Remote Sensing)
Show Figures

Graphical abstract

26 pages, 18945 KiB  
Article
Estimating Ground-Level Particulate Matter in Five Regions of China Using Aerosol Optical Depth
by Qiaolin Zeng, Jinhua Tao, Liangfu Chen, Hao Zhu, SongYan Zhu and Yang Wang
Remote Sens. 2020, 12(5), 881; https://doi.org/10.3390/rs12050881 - 09 Mar 2020
Cited by 10 | Viewed by 3002
Abstract
Aerosol optical depth (AOD) has been widely used to estimate near-surface particulate matter (PM). In this study, ground-measured data from the Campaign on Atmospheric Aerosol Research network of China (CARE-China) and the Aerosol Robotic Network (AERONET) were used to evaluate the accuracy of [...] Read more.
Aerosol optical depth (AOD) has been widely used to estimate near-surface particulate matter (PM). In this study, ground-measured data from the Campaign on Atmospheric Aerosol Research network of China (CARE-China) and the Aerosol Robotic Network (AERONET) were used to evaluate the accuracy of Visible Infrared Imaging Radiometer Suite (VIIRS) AOD data for different aerosol types. These four aerosol types were from dust, smoke, urban, and uncertain and a fifth “type” was included for unclassified (i.e., total) aerosols. The correlation for dust aerosol was the worst (R2 = 0.15), whereas the correlations for smoke and urban types were better (R2 values of 0.69 and 0.55, respectively). The mixed-effects model was used to estimate the PM2.5 concentrations in Beijing–Tianjin–Hebei (BTH), Sichuan–Chongqing (SC), the Pearl River Delta (PRD), the Yangtze River Delta (YRD), and the Middle Yangtze River (MYR) using the classified aerosol type and unclassified aerosol type methods. The results suggest that the cross validation (CV) of different aerosol types has higher correlation coefficients than that of the unclassified aerosol type. For example, the R2 values for dust, smoke, urban, uncertain, and unclassified aerosol types BTH were 0.76, 0.85, 0.82, 0.82, and 0.78, respectively. Compared with the daily PM2.5 concentrations, the air quality levels estimated using the classified aerosol type method were consistent with ground-measured PM2.5, and the relative error was low (most RE was within ±20%). The classified aerosol type method improved the accuracy of the PM2.5 estimation compared to the unclassified method, although there was an overestimation or underestimation in some regions. The seasonal distribution of PM2.5 was analyzed and the PM2.5 concentrations were high during winter, low during summer, and moderate during spring and autumn. Spatially, the higher PM2.5 concentrations were predominantly distributed in areas of human activity and industrial areas. Full article
Show Figures

Graphical abstract

27 pages, 5947 KiB  
Article
Quantifying Information Content in Multispectral Remote-Sensing Images Based on Image Transforms and Geostatistical Modelling
by Ying Zhang, Jingxiong Zhang and Wenjing Yang
Remote Sens. 2020, 12(5), 880; https://doi.org/10.3390/rs12050880 - 09 Mar 2020
Cited by 1 | Viewed by 2923
Abstract
Quantifying information content in remote-sensing images is fundamental for information-theoretic characterization of remote sensing information processes, with the images being usually information sources. Information-theoretic methods, being complementary to conventional statistical methods, enable images and their derivatives to be described and analyzed in terms [...] Read more.
Quantifying information content in remote-sensing images is fundamental for information-theoretic characterization of remote sensing information processes, with the images being usually information sources. Information-theoretic methods, being complementary to conventional statistical methods, enable images and their derivatives to be described and analyzed in terms of information as defined in information theory rather than data per se. However, accurately quantifying images’ information content is nontrivial, as information redundancy due to spectral and spatial dependence needs to be properly handled. There has been little systematic research on this, hampering wide applications of information theory. This paper seeks to fill this important research niche by proposing a strategy for quantifying information content in multispectral images based on information theory, geostatistics, and image transformations, by which interband spectral dependence, intraband spatial dependence, and additive noise inherent to multispectral images are effectively dealt with. Specifically, to handle spectral dependence, independent component analysis (ICA) is performed to transform a multispectral image into one with statistically independent image bands (not spectral bands of the original image). The ICA-transformed image is further normal-transformed to facilitate computation of information content based on entropy formulas for Gaussian distributions. Normal transform facilitates straightforward incorporation of spatial dependence in entropy computation for the aforementioned double-transformed image bands with inter-pixel spatial correlation modeled via variograms. Experiments were undertaken using Landsat ETM+ and TM image subsets featuring different dominant land cover types (i.e., built-up, agricultural, and hilly). The experimental results confirm that the proposed methods provide more objective estimates of information content than otherwise when spectral dependence, spatial dependence, or non-normality is not accommodated properly. The differences in information content between image subsets obtained with ETM+ and TM were found to be about 3.6 bits/pixel, indicating the former’s greater information content. The proposed methods can be adapted for information-theoretic analyses of remote sensing information processes. Full article
Show Figures

Graphical abstract

17 pages, 6311 KiB  
Article
Accuracy Verification of Airborne Large-Footprint Lidar based on Terrain Features
by Weiqi Lian, Shaoning Li, Guo Zhang, Yanan Wang, Xinyang Chen and Hao Cui
Remote Sens. 2020, 12(5), 879; https://doi.org/10.3390/rs12050879 - 09 Mar 2020
Cited by 4 | Viewed by 3135
Abstract
Accuracy verification of airborne large-footprint lidar data is important for proper data application but is difficult when ground-based laser detectors are not available. Therefore, we developed a novel method for lidar accuracy verification based on the broadened echo pulse caused by signal saturation [...] Read more.
Accuracy verification of airborne large-footprint lidar data is important for proper data application but is difficult when ground-based laser detectors are not available. Therefore, we developed a novel method for lidar accuracy verification based on the broadened echo pulse caused by signal saturation over water. When an aircraft trajectory crosses both water and land, this phenomenon and the change in elevation between land and water surfaces can be used to verify the plane and elevation accuracy of the airborne large-footprint lidar data in conjunction with a digital surface model (DSM). Due to the problem of echo pulse broadening, the center-of-gravity (COG) method was proposed to optimize the processing flow. We conducted a series of experiments on terrain features (i.e., the intersection between water and land) in Xiangxi, Hunan Province, China. Verification results show that the elevation accuracy obtained in our experiments was better than 1 m and the plane accuracy was better than 5 m, which is well within the design requirements. Although this method requires specific terrain conditions for optimum applicability, the results can lead to valuable improvements in the flexibility and quality of lidar data collection. Full article
Show Figures

Graphical abstract

22 pages, 9443 KiB  
Article
A Bayesian Three-Cornered Hat (BTCH) Method: Improving the Terrestrial Evapotranspiration Estimation
by Xinlei He, Tongren Xu, Youlong Xia, Sayed M. Bateni, Zhixia Guo, Shaomin Liu, Kebiao Mao, Yuan Zhang, Huaize Feng and Jingxue Zhao
Remote Sens. 2020, 12(5), 878; https://doi.org/10.3390/rs12050878 - 09 Mar 2020
Cited by 28 | Viewed by 5414
Abstract
In this study, a Bayesian-based three-cornered hat (BTCH) method is developed to improve the estimation of terrestrial evapotranspiration (ET) by integrating multisource ET products without using any a priori knowledge. Ten long-term (30 years) gridded ET datasets from statistical or empirical, remotely-sensed, and [...] Read more.
In this study, a Bayesian-based three-cornered hat (BTCH) method is developed to improve the estimation of terrestrial evapotranspiration (ET) by integrating multisource ET products without using any a priori knowledge. Ten long-term (30 years) gridded ET datasets from statistical or empirical, remotely-sensed, and land surface models over contiguous United States (CONUS) are integrated by the BTCH and ensemble mean (EM) methods. ET observations from eddy covariance towers (ETEC) at AmeriFlux sites and ET values from the water balance method (ETWB) are used to evaluate the BTCH- and EM-integrated ET estimates. Results indicate that BTCH performs better than EM and all the individual parent products. Moreover, the trend of BTCH-integrated ET estimates, and their influential factors (e.g., air temperature, normalized differential vegetation index, and precipitation) from 1982 to 2011 are analyzed by the Mann–Kendall method. Finally, the 30-year (1982 to 2011) total water storage anomaly (TWSA) in the Mississippi River Basin (MRB) is retrieved based on the BTCH-integrated ET estimates. The TWSA retrievals in this study agree well with those from the Gravity Recovery and Climate Experiment (GRACE). Full article
(This article belongs to the Special Issue Remote Sensing and Modeling of the Terrestrial Water Cycle)
Show Figures

Graphical abstract

18 pages, 14778 KiB  
Article
Using Training Samples Retrieved from a Topographic Map and Unsupervised Segmentation for the Classification of Airborne Laser Scanning Data
by Zhishuang Yang, Wanshou Jiang, Yaping Lin and Sander Oude Elberink
Remote Sens. 2020, 12(5), 877; https://doi.org/10.3390/rs12050877 - 09 Mar 2020
Cited by 7 | Viewed by 3402
Abstract
The labeling of point clouds is the fundamental task in airborne laser scanning (ALS) point clouds processing. Many supervised methods have been proposed for the point clouds classification work. Training samples play an important role in the supervised classification. Most of the training [...] Read more.
The labeling of point clouds is the fundamental task in airborne laser scanning (ALS) point clouds processing. Many supervised methods have been proposed for the point clouds classification work. Training samples play an important role in the supervised classification. Most of the training samples are generated by manual labeling, which is time-consuming. To reduce the cost of manual annotating for ALS data, we propose a framework that automatically generates training samples using a two-dimensional (2D) topographic map and an unsupervised segmentation step. In this approach, input point clouds, at first, are separated into the ground part and the non-ground part by a DEM filter. Then, a point-in-polygon operation using polygon maps derived from a 2D topographic map is used to generate initial training samples. The unsupervised segmentation method is applied to reduce the noise and improve the accuracy of the point-in-polygon training samples. Finally, the super point graph is used for the training and testing procedure. A comparison with the point-based deep neural network Pointnet++ (average F1 score 59.4%) shows that the segmentation based strategy improves the performance of our initial training samples (average F1 score 65.6%). After adding the intensity value in unsupervised segmentation, our automatically generated training samples have competitive results with an average F1 score of 74.8% for ALS data classification while using the ground truth training samples the average F1 score is 75.1%. The result shows that our framework is feasible to automatically generate and improve the training samples with low time and labour costs. Full article
(This article belongs to the Special Issue Laser Scanning and Point Cloud Processing)
Show Figures

Graphical abstract

23 pages, 21187 KiB  
Article
Determining the Suitable Number of Ground Control Points for UAS Images Georeferencing by Varying Number and Spatial Distribution
by Valeria-Ersilia Oniga, Ana-Ioana Breaban, Norbert Pfeifer and Constantin Chirila
Remote Sens. 2020, 12(5), 876; https://doi.org/10.3390/rs12050876 - 09 Mar 2020
Cited by 41 | Viewed by 5075
Abstract
Currently, products that are obtained by Unmanned Aerial Systems (UAS) image processing based on structure-from-motion photogrammetry (SfM) are being investigated for use in high precision projects. Independent of the georeferencing process being done directly or indirectly, Ground Control Points (GCPs) are needed to [...] Read more.
Currently, products that are obtained by Unmanned Aerial Systems (UAS) image processing based on structure-from-motion photogrammetry (SfM) are being investigated for use in high precision projects. Independent of the georeferencing process being done directly or indirectly, Ground Control Points (GCPs) are needed to increase the accuracy of the obtained products. A minimum of three GCPs is required to bring the results into a desired coordinate system through the indirect georeferencing process, but it is well known that increasing the number of GCPs will lead to a higher accuracy of the final results. The aim of this study is to find the suitable number of GCPs to derive high precision results and what is the effect of GCPs systematic or stratified random distribution on the accuracy of the georeferencing process and the final products, respectively. The case study involves an urban area of about 1 ha that was photographed with a low-cost UAS, namely, the DJI Phantom 3 Standard, at 28 m above ground. The camera was oriented in a nadiral position and 300 points were measured using a total station in a local coordinate system. The UAS images were processed using the 3DF Zephyr software performing a full BBA with a variable number of GCPs i.e., from four up to 150, while the number and the spatial location of check points (ChPs) was kept constant i.e., 150 for each independent distribution. In addition, the systematic and stratified random distribution of GCPs and ChPs spatial positions was analysed. Furthermore, the point clouds and the mesh surfaces that were automatically derived were compared with a terrestrial laser scanner (TLS) point cloud while also considering three test areas: two inside the area defined by GCPs and one outside the area. The results expressed a clear overview of the number of GCPs needed for the indirect georeferencing process with minimum influence on the final results. The RMSE can be reduced down to 50% when switching from four to 20 GCPs, whereas a higher number of GCPs only slightly improves the results. Full article
Show Figures

Graphical abstract

23 pages, 4873 KiB  
Article
The Least Square Adjustment for Estimating the Tropical Peat Depth Using LiDAR Data
by Bambang Kun Cahyono, Trias Aditya and Istarno
Remote Sens. 2020, 12(5), 875; https://doi.org/10.3390/rs12050875 - 09 Mar 2020
Cited by 7 | Viewed by 4389
Abstract
High-accuracy peat maps are essential for peatland restoration management, but costly, labor-intensive, and require an extensive amount of peat drilling data. This study offers a new method to create an accurate peat depth map while reducing field drilling data up to 75%. Ordinary [...] Read more.
High-accuracy peat maps are essential for peatland restoration management, but costly, labor-intensive, and require an extensive amount of peat drilling data. This study offers a new method to create an accurate peat depth map while reducing field drilling data up to 75%. Ordinary least square (OLS) adjustments were used to estimate the elevation of the mineral soil surface based on the surrounding soil parameters. Orthophoto and Digital Terrain Models (DTMs) from LiDAR data of Tebing Tinggi Island, Riau, were used to determine morphology, topography, and spatial position parameters to define the DTM and its coefficients. Peat depth prediction models involving 100%, 50%, and 25% of the field points were developed using the OLS computations, and compared against the field survey data. Raster operations in a GIS were used in processing the DTM, to produce peat depth estimations. The results show that the soil map produced from OLS provided peat depth estimations with no significant difference from the field depth data at a mean absolute error of ±1 meter. The use of LiDAR data and the OLS method provides a cost-effective methodology for estimating peat depth and mapping for the purpose of supporting peat restoration. Full article
(This article belongs to the Special Issue Remote Sensing of Peatlands II)
Show Figures

Graphical abstract

24 pages, 4236 KiB  
Article
Morphometric Analysis for Soil Erosion Susceptibility Mapping Using Novel GIS-Based Ensemble Model
by Alireza Arabameri, John P. Tiefenbacher, Thomas Blaschke, Biswajeet Pradhan and Dieu Tien Bui
Remote Sens. 2020, 12(5), 874; https://doi.org/10.3390/rs12050874 - 09 Mar 2020
Cited by 57 | Viewed by 10941
Abstract
The morphometric characteristics of the Kalvārī basin were analyzed to prioritize sub-basins based on their susceptibility to erosion by water using a remote sensing-based data and a GIS. The morphometric parameters (MPs)—linear, relief, and shape—of the drainage network were calculated using data from [...] Read more.
The morphometric characteristics of the Kalvārī basin were analyzed to prioritize sub-basins based on their susceptibility to erosion by water using a remote sensing-based data and a GIS. The morphometric parameters (MPs)—linear, relief, and shape—of the drainage network were calculated using data from the Advanced Land-observing Satellite (ALOS) phased-array L-type synthetic-aperture radar (PALSAR) digital elevation model (DEM) with a spatial resolution of 12.5 m. Interferometric synthetic aperture radar (InSAR) was used to generate the DEM. These parameters revealed the network’s texture, morpho-tectonics, geometry, and relief characteristics. A complex proportional assessment of alternatives (COPRAS)-analytical hierarchy process (AHP) novel-ensemble multiple-criteria decision-making (MCDM) model was used to rank sub-basins and to identify the major MPs that significantly influence erosion landforms of the Kalvārī drainage basin. The results show that in evolutionary terms this is a youthful landscape. Rejuvenation has influenced the erosional development of the basin, but lithology and relief, structure, and tectonics have determined the drainage patterns of the catchment. Results of the AHP model indicate that slope and drainage density influence erosion in the study area. The COPRAS-AHP ensemble model results reveal that sub-basin 1 is the most susceptible to soil erosion (SE) and that sub-basin 5 is least susceptible. The ensemble model was compared to the two individual models using the Spearman correlation coefficient test (SCCT) and the Kendall Tau correlation coefficient test (KTCCT). To evaluate the prediction accuracy of the ensemble model, its results were compared to results generated by the modified Pacific Southwest Inter-Agency Committee (MPSIAC) model in each sub-basin. Based on SCCT and KTCCT, the ensemble model was better at ranking sub-basins than the MPSIAC model, which indicated that sub-basins 1 and 4, with mean sediment yields of 943.7 and 456.3 m 3 km 2   year 1 , respectively, have the highest and lowest SE susceptibility in the study area. The sensitivity analysis revealed that the most sensitive parameters of the MPSIAC model are slope (R2 = 0.96), followed by runoff (R2 = 0.95). The MPSIAC shows that the ensemble model has a high prediction accuracy. The method tested here has been shown to be an effective tool to improve sustainable soil management. Full article
(This article belongs to the Special Issue Remote Sensing of Soil Erosion)
Show Figures

Graphical abstract

21 pages, 5358 KiB  
Article
The Potential of Space-Based Sea Surface Salinity on Monitoring the Hudson Bay Freshwater Cycle
by Wenqing Tang, Simon H. Yueh, Daqing Yang, Ellie Mcleod, Alexander Fore, Akiko Hayashi, Estrella Olmedo, Justino Martínez and Carolina Gabarró
Remote Sens. 2020, 12(5), 873; https://doi.org/10.3390/rs12050873 - 09 Mar 2020
Cited by 10 | Viewed by 3582
Abstract
Hudson Bay (HB) is the largest semi-inland sea in the Northern Hemisphere, connecting with the Arctic Ocean through the Foxe Basin and the northern Atlantic Ocean through the Hudson Strait. HB is covered by ice and snow in winter, which completely melts in [...] Read more.
Hudson Bay (HB) is the largest semi-inland sea in the Northern Hemisphere, connecting with the Arctic Ocean through the Foxe Basin and the northern Atlantic Ocean through the Hudson Strait. HB is covered by ice and snow in winter, which completely melts in summer. For about six months each year, satellite remote sensing of sea surface salinity (SSS) is possible over open water. SSS links freshwater contributions from river discharge, sea ice melt/freeze, and surface precipitation/evaporation. Given the strategic importance of HB, SSS has great potential in monitoring the HB freshwater cycle and studying its relationship with climate change. However, SSS retrieved in polar regions (poleward of 50°) from currently operational space-based L-band microwave instruments has large uncertainty (~ 1 psu) mainly due to sensitivity degradation in cold water (<5°C) and sea ice contamination. This study analyzes SSS from NASA Soil Moisture Active and Passive (SMAP) and European Space Agency (ESA) Soil Moisture and Ocean Salinity(SMOS) missions in the context of HB freshwater contents. We found that the main source of the year-to-year SSS variability is sea ice melting, in particular, the onset time and places of ice melt in the first couple of months of open water season. The freshwater contribution from surface forcing P-E is smaller in magnitude comparing with sea ice contribution but lasts on longer time scale through the whole open water season. River discharge is comparable with P-E in magnitude but peaks before ice melt. The spatial and temporal variations of freshwater contents largely exceed the remote sensed SSS uncertainty. This fact justifies the use of remote sensed SSS for monitoring the HB freshwater cycle. Full article
(This article belongs to the Section Ocean Remote Sensing)
Show Figures

Graphical abstract

20 pages, 4172 KiB  
Article
Multi-scale Adaptive Feature Fusion Network for Semantic Segmentation in Remote Sensing Images
by Ronghua Shang, Jiyu Zhang, Licheng Jiao, Yangyang Li, Naresh Marturi and Rustam Stolkin
Remote Sens. 2020, 12(5), 872; https://doi.org/10.3390/rs12050872 - 09 Mar 2020
Cited by 67 | Viewed by 6578
Abstract
Semantic segmentation of high-resolution remote sensing images is highly challenging due to the presence of a complicated background, irregular target shapes, and similarities in the appearance of multiple target categories. Most of the existing segmentation methods that rely only on simple fusion of [...] Read more.
Semantic segmentation of high-resolution remote sensing images is highly challenging due to the presence of a complicated background, irregular target shapes, and similarities in the appearance of multiple target categories. Most of the existing segmentation methods that rely only on simple fusion of the extracted multi-scale features often fail to provide satisfactory results when there is a large difference in the target sizes. Handling this problem through multi-scale context extraction and efficient fusion of multi-scale features, in this paper we present an end-to-end multi-scale adaptive feature fusion network (MANet) for semantic segmentation in remote sensing images. It is a coding and decoding structure that includes a multi-scale context extraction module (MCM) and an adaptive fusion module (AFM). The MCM employs two layers of atrous convolutions with different dilatation rates and global average pooling to extract context information at multiple scales in parallel. MANet embeds the channel attention mechanism to fuse semantic features. The high- and low-level semantic information are concatenated to generate global features via global average pooling. These global features are used as channel weights to acquire adaptive weight information of each channel by the fully connected layer. To accomplish an efficient fusion, these tuned weights are applied to the fused features. Performance of the proposed method has been evaluated by comparing it with six other state-of-the-art networks: fully convolutional networks (FCN), U-net, UZ1, Light-weight RefineNet, DeepLabv3+, and APPD. Experiments performed using the publicly available Potsdam and Vaihingen datasets show that the proposed MANet significantly outperforms the other existing networks, with overall accuracy reaching 89.4% and 88.2%, respectively and with average of F1 reaching 90.4% and 86.7% respectively. Full article
Show Figures

Figure 1

24 pages, 2952 KiB  
Article
Estimating the Growing Stem Volume of Chinese Pine and Larch Plantations based on Fused Optical Data Using an Improved Variable Screening Method and Stacking Algorithm
by Xinyu Li, Zhaohua Liu, Hui Lin, Guangxing Wang, Hua Sun, Jiangping Long and Meng Zhang
Remote Sens. 2020, 12(5), 871; https://doi.org/10.3390/rs12050871 - 09 Mar 2020
Cited by 24 | Viewed by 3659
Abstract
Accurately estimating growing stem volume (GSV) is very important for forest resource management. The GSV estimation is affected by remote sensing images, variable selection methods, and estimation algorithms. Optical images have been widely used for modeling key attributes of forest stands, including GSV [...] Read more.
Accurately estimating growing stem volume (GSV) is very important for forest resource management. The GSV estimation is affected by remote sensing images, variable selection methods, and estimation algorithms. Optical images have been widely used for modeling key attributes of forest stands, including GSV and aboveground biomass (AGB), because of their easy availability, large coverage and related mature data processing and analysis technologies. However, the low data saturation level and the difficulty of selecting feature variables from optical images often impede the improvement of estimation accuracy. In this research, two GaoFen-2 (GF-2) images, a Landsat 8 image, and fused images created by integrating GF-2 bands with the Landsat multispectral image using the Gram–Schmidt method were first used to derive various feature variables and obtain various datasets or data scenarios. A DC-FSCK approach that integrates feature variable screening and a combination optimization procedure based on the distance correlation coefficient and k-nearest neighbors (kNN) algorithm was proposed and compared with the stepwise regression analysis (SRA) and random forest (RF) for feature variable selection. The DC-FSCK considers the self-correlation and combination effect among feature variables so that the selected variables can improve the accuracy and saturation level of GSV estimation. To validate the proposed approach, six estimation algorithms were examined and compared, including Multiple Linear Regression (MLR), kNN, Support Vector Regression (SVR), RF, eXtreme Gradient Boosting (XGBoost) and Stacking. The results showed that compared with GF-2 and Landsat 8 images, overall, the fused image (Red_Landsat) of GF-2 red band with Landsat 8 multispectral image improved the GSV estimation accuracy of Chinese pine and larch plantations. The Red_Landsat image also performed better than other fused images (Pan_Landsat, Blue_Landsat, Green_Landsat and Nir_Landsat). For most of the combinations of the datasets and estimation models, the proposed variable selection method DC-FSCK led to more accurate GSV estimates compared with SRA and RF. In addition, in most of the combinations obtained by the datasets and variable selection methods, the Stacking algorithm performed better than other estimation models. More importantly, the combination of the fused image Red_Landsat with the DC-FSCK and Stacking algorithm led to the best performance of GSV estimation with the greatest adjusted coefficients of determination, 0.8127 and 0.6047, and the smallest relative root mean square errors of 17.1% and 20.7% for Chinese pine and larch, respectively. This study provided new insights on how to choose suitable optical images, variable selection methods and optimal modeling algorithms for the GSV estimation of Chinese pine and larch plantations. Full article
Show Figures

Graphical abstract

21 pages, 9488 KiB  
Article
A Novel Stereo Matching Algorithm for Digital Surface Model (DSM) Generation in Water Areas
by Wenhuan Yang, Xin Li, Bo Yang and Yu Fu
Remote Sens. 2020, 12(5), 870; https://doi.org/10.3390/rs12050870 - 08 Mar 2020
Cited by 14 | Viewed by 4075
Abstract
Image dense matching has become one of the widely used means for DSM generation due to its good performance in both accuracy and efficiency. However, for water areas, the most common ground object, accurate disparity estimation is always a challenge to excellent image [...] Read more.
Image dense matching has become one of the widely used means for DSM generation due to its good performance in both accuracy and efficiency. However, for water areas, the most common ground object, accurate disparity estimation is always a challenge to excellent image dense matching methods, as represented by semi-global matching (SGM), due to the poor texture. For this reason, a great deal of manual editing is always inevitable before practical applications. The main reason for this is the lack of uniqueness of matching primitives, with fixed size and shape, used by those methods. In this paper, we propose a novel DSM generation method, namely semi-global and block matching (SGBM), to achieve accurate disparity and height estimation in water areas by adaptive block matching instead of pixel matching. First, the water blocks are extracted by seed point growth, and an adaptive block matching strategy considering geometrical deformations, called end-block matching (EBM), is adopted to achieve accurate disparity estimation. Then, the disparity of all other pixels beyond these water blocks is obtained by SGM. Last, the median value of height of all pixels within the same block is selected as the final height for this block after forward intersection. Experiments are conducted on ZiYuan-3 (ZY-3) stereo images, and the results show that DSM generated by our method in water areas has high accuracy and visual quality. Full article
Show Figures

Graphical abstract

26 pages, 8962 KiB  
Article
A Precise Indoor Visual Positioning Approach Using a Built Image Feature Database and Single User Image from Smartphone Cameras
by Ming Li, Ruizhi Chen, Xuan Liao, Bingxuan Guo, Weilong Zhang and Ge Guo
Remote Sens. 2020, 12(5), 869; https://doi.org/10.3390/rs12050869 - 08 Mar 2020
Cited by 22 | Viewed by 5085
Abstract
Indoor visual positioning is a key technology in a variety of indoor location services and applications. The particular spatial structures and environments of indoor spaces is a challenging scene for visual positioning. To address the existing problems of low positioning accuracy and low [...] Read more.
Indoor visual positioning is a key technology in a variety of indoor location services and applications. The particular spatial structures and environments of indoor spaces is a challenging scene for visual positioning. To address the existing problems of low positioning accuracy and low robustness, this paper proposes a precision single-image-based indoor visual positioning method for a smartphone. The proposed method includes three procedures: First, color sequence images of the indoor environment are collected in an experimental room, from which an indoor precise-positioning-feature database is produced, using a classic speed-up robust features (SURF) point matching strategy and the multi-image spatial forward intersection. Then, the relationships between the smartphone positioning image SURF feature points and object 3D points are obtained by an efficient similarity feature description retrieval method, in which a more reliable and correct matching point pair set is obtained, using a novel matching error elimination technology based on Hough transform voting. Finally, efficient perspective-n-point (EPnP) and bundle adjustment (BA) methods are used to calculate the intrinsic and extrinsic parameters of the positioning image, and the location of the smartphone is obtained as a result. Compared with the ground truth, results of the experiments indicate that the proposed approach can be used for indoor positioning, with an accuracy of approximately 10 cm. In addition, experiments show that the proposed method is more robust and efficient than the baseline method in a real scene. In the case where sufficient indoor textures are present, it has the potential to become a low-cost, precise, and highly available indoor positioning technology. Full article
Show Figures

Graphical abstract

Previous Issue
Next Issue
Back to TopTop