Article

Photometric Normalization of Chang’e-4 Visible and Near-Infrared Imaging Spectrometer Datasets: A Combined Study of In-Situ and Laboratory Spectral Measurements

1
Shandong Key Laboratory of Optical Astronomy and Solar-Terrestrial Environment, School of Space Science and Physics, Institute of Space Sciences, Shandong University, Weihai 264209, China
2
CAS Center for Excellence in Comparative Planetology, Chinese Academy of Sciences, Hefei 230026, China
3
Key Laboratory of Space Active Opto-Electronics Technology, Shanghai Institute of Technical Physics, Chinese Academy of Sciences, Shanghai 200083, China
4
Institute of Geochemistry, Chinese Academy of Sciences, Guiyang 550002, China
5
State Key Laboratory of Space Weather, National Space Science Center, Chinese Academy of Sciences, Beijing 100190, China
*
Author to whom correspondence should be addressed.
Remote Sens. 2020, 12(19), 3211; https://doi.org/10.3390/rs12193211
Submission received: 30 August 2020 / Revised: 23 September 2020 / Accepted: 29 September 2020 / Published: 1 October 2020
(This article belongs to the Special Issue Lunar Remote Sensing and Applications)

Abstract

:
Until 29 May 2020, the Visible and Near-Infrared Imaging Spectrometer (VNIS) onboard the Yutu-2 Rover of the Chang’e-4 (CE-4) has acquired 96 high-resolution surface in-situ imaging spectra. These spectra were acquired under different illumination conditions, thus photometric normalization should be conducted to correct the introduced albedo differences before deriving the quantitative mineralogy for accurate geologic interpretations. In this study, a Lommel–Seeliger (LS) model and Hapke radiative transfer (Hapke) model were used and empirical phase functions of the LS model were derived. The values of these derived phase functions exhibit declining trends with the increase in phase angles and the opposition effect and phase reddening effect were observed. Then, we discovered from in-situ and laboratory measurements that the shadows caused by surface roughness have significant impacts on reflectance spectra and proper corrections were introduced. The validations of different phase functions showed that the maximum discrepancy at 1500 nm of spectra corrected by the LS model was less (~3.7%) than that by the Hapke model (~7.4%). This is the first time that empirical phase functions have been derived for a wavelength from 450 to 2395 nm using in-situ visible and near-infrared spectral datasets. Generally, photometrically normalized spectra exhibit smaller spectral slopes, lower FeO contents and larger optical maturity parameter (OMAT) than spectra without correction. In addition, the band centers of the 1 and 2 μm absorption features of spectra after photometric normalization exhibit a more concentrated distribution, indicating the compositional homogeneity of soils at the CE-4 landing site.

Graphical Abstract

1. Introduction

On 3 January 2019, Chang’e-4 (CE-4) landed in the South Pole–Aitken (SPA) basin on the lunar farside and released the Yutu-2 rover. The rover is equipped with four payloads including Panoramic Cameras (PCAMs), a Visible and Near-Infrared Imaging Spectrometer (VNIS), Lunar Penetrating Radars (LPRs), and international-joint Advanced Small Analyzed for Neutrals (ASANs), to investigate the morphology, mineral composition, subsurface structure, and energetic neutral atoms (ENAs) of the CE-4 landing site and travel path [1]. The Yutu-2 rover has driven a total of 447.68 m on the floor of the Von Kármán crater (Figure 1) in a north-westerly direction, heading for basalt or craters with high reflectance. Ninety-six hyperspectral measurements were performed (for 18 lunar days until 29 May 2020) over relatively uniform terrain and the rover is still active as of 23 September. This valuable dataset provides critical observations for uncovering the mineralogy and rock lithologies on the Von Kármán crater floor in South Pole–Aitken (SPA) basin of the lunar farside [2,3,4,5,6]. Note that these in-situ spectral datasets were acquired with different illumination conditions (e.g., incident angle (i), emission angle (e), and phase angle (g)). It is widely known that in addition to mineralogy, reflected light entering the spectrometer is also influenced by illumination conditions, causing albedo differences due to observation geometries [7]. Thus, photometric normalization should be conducted to normalize these spectra to a standard illumination condition (i = 30°, e = 0°, g = 30°) before deriving the quantitative mineralogy for accurate geologic interpretations.
Numerous investigations have been reported to eliminate the influence of illumination/observation geometry [8,9,10,11,12]. Existing lunar photometric models can be classified as two distinct groups including empirical models [13,14] and models referenced to physical properties (e.g., radiative transfer models) [9,11,15]. Among the empirical models, the Lommel–Seeliger (LS) model has the advantage of simple analysis, and in many cases, it is an excellent first approximation to diffuse reflection [16]. The LS model assumes that light attenuates exponentially as it penetrates the surface [16] and it has been widely applied to spectral datasets obtained from lunar spacecrafts (e.g., Lunar Reconnaissance Orbiter Camera [17], Chandrayaan-1 Moon Mineralogy Mapper [10], Chang’e-1 Imaging Interferometer [18,19,20], CE-4 VNIS [5,21]). The Hapke radiative transfer (Hapke) model is based on the radiative transport equation of granular media and comprehensively considers the effects of mineralogy, surface roughness, grain sizes, compaction, and multiple scattering factors [9,11,22,23]. This model has been widely applied to the photometric normalization of reflectance spectra detected from various solar system objects (e.g., asteroids, Mercury, comets, Mars, Moon) [12,24,25,26,27,28,29,30,31].
For the above photometric models, phase functions describe the relationship between reflectance and phase angles [32]. Accurate phase functions of the above models are essential in photometric normalization, which is an important data processing step in the scientific analysis and application of Chang’e-3 (CE-3) [33,34] and CE-4 VNIS data. However, most previous phase functions of the LS and Hapke model were obtained from orbital or Earth-based observations [7,14,20,35,36] and it was difficult to achieve the ideal observing conditions for the continuous detection of the same target. Besides, in-situ measurements of the lunar phase functions had never been carried out until the successful landing of the CE-3 mission [37]. Images acquired by the CE-3 PCAM were used to extract phase functions, but the limited three bands (470, 540, 640 nm) may have constrained the application of these derived phase functions [37]. After CE-4 landed, the in-situ phase functions of the LS model [21] were derived using the spectral datasets detected on the fourth lunar day. However, due to the limited observation data on the fourth lunar day, the derived phase functions only cover the spectral ranges of 470–945 nm [21]. Using the Hapke model, Yang et al. [31] and Lin et al. [38] evaluated the effect of view geometry on CE-4 spectral data and derived average Hapke parameters for the potential uses of a Legendre pronominal and Henyey–Greenstein single-scattering phase functions in the Hapke model.
In this study, we focus on the determination of the best models for photometric normalization of CE-4 VNIS datasets using data acquired over 18 lunar days. We derived the fitness parameters of the phase functions (LS model) of VNIS datasets covering 450–2395 nm using photometric experiments in the CE-4 landing site on the tenth lunar day. Compared with photometrically corrected reflectance between the LS and Hapke models, this study aims to obtain the best-fit phase functions with the intent to get robust VNIS spectral datasets and better constrain the photometric properties of lunar soils at the CE-4 landing site.

2. Data and Methods

2.1. VNIS Instrument

The VNIS spectrometer, mounted at the front of Yutu-2 rover with ~0.69 m altitude, comprises a visible and near-infrared (VNIR, 450–945 nm) imaging detector and a non-imaging shortwave infrared detector (SWIR, 900–2395 nm), with a scientific goal to detect the rock lithologies and mineral composition of the lunar soils and rocks at the CE-4 landing site [39,40,41]. The spectral resolution of VNIS is 2~10 nm for the VNIR range and 3~12 nm for the SWIR, respectively, yet the spectral sampling interval is 5 nm for both detectors [1,39,40]. The single point measurement of the SWIR spectrometer has a circular field of view (FOV) with a diameter of 107.6 pixels for the corresponding VNIR detector. The central point of the SWIR is located at the coordinate (98, 127.5) within the FOV of the VNIR image [2,39]. The radiance of the forward scattered sunlight from particles on the lunar surface are collected by the VNIS on a trapezoid with a nominal emission angle of ~45° [39,40]. The single-band spectral or image information pass through the Acousto-optic Tunable Filter (AOTF) to form quasi-monochromatic light with a specific wavelength and then converges to the Complementary Metal-Oxide Semiconductor (CMOS) detector [39,42]. The spectral or imaging data of all bands are obtained by changing the driving frequency of exerting on the AOTF in order to achieve wavelength selection [39,40].

2.2. Photometric Models

2.2.1. Lommel–Seeliger Model

As an empirical model, the LS model has the advantage of analytical simplicity and has been widely applied to various spectral datasets obtained from lunar spacecraft [7,12,21]. For low albedo solar system bodies such as the Moon, single scattering dominates the regolith albedo, and the variations of lunar surface reflectance with the illumination-viewing geometry can be approximated by the Lommel–Seeliger Law [5,10,14,19,20,21]:
r(i, e, g) = μ0/(μ0 + μ1) × f(g),
where r is bidirectional reflectance. μ0 and μ1 are the cosine values of the incident angle and emission angle, respectively. f(g) describes reflectance variation with the phase angle.
A third-order polynomial was used in this work to model f(g):
f(g) = p1g3 + p2g2 + p3g + p4,
The parameter values in Equation (2) were derived for each band using the non-linear least squares methods. The model parameters with the minimum Root Mean Square Error (RMSE) [43] are achieved and then VNIS data are normalized into the standard geometry (i = 30°, e = 0°, g = 30°) by Equation (3):
rmeasure(30°, 0°, 30°) = rmodel(30°, 0°, 30°)/rmodel(i, e, g) × rmeasure(i, e, g),

2.2.2. Hapke Radiative Transfer Model

As a model tied to the physical properties of the lunar surface, the Hapke radiative transfer model is another way to characterize the photometric properties and normalize the photometric effects of lunar soils. The Hapke radiative transfer model often assumes that that all airless planetary materials in the media are an intimate mixture and the particle sizes are larger than wavelengths [11]. The Hapke model is derived from the radiative transport equation of the particle medium, and its parameters reflect the chemical and physical properties of the medium. The bidirectional reflectance as a function of i, e, g, and single scattering albedo (SSA) are approximated as follows [9,11,22,23]:
r ( i , e , g ) = K ω 4 π μ 0 μ 0 + μ 0 { [ 1 + B ( g ) ] P ( g ) + H ( μ 0 / K ) H ( μ 1 / K ) 1 } ,  
where r is bidirectional reflectance (BREF). K is the porosity factor and can usually be calculated with the filling factor ϕ (ϕ = 0.41 for lunar soil) [11,22]: K = −ln(1 − 1.209ϕ2/3)/(1.209ϕ2/3). ω (SSA) describes the ratio of the energy loss due to the scattering of incident light through a particle medium to the total energy loss due to scattering and absorption. B(g) is a backscattering function describing the shadow-hiding opposition effect and can be expressed as:
B ( g ) = ( 1 + 1 h s tan g 2 ) 1 ,  
hs [11] describes the angle width of backscattering and can be expressed as:
h s 3 3 8 K ϕ ln ( 1000 )
H(x) describes the multiple scattering process and can be approximated as H(x) = (1 + 2x)/(1 + 2γx), where γ = √(1 − ω) [11].
The specific expression of the P(g) is related to the particle size, orientation, electromagnetic properties, etc., and has analytical solutions only under special conditions. In practical applications, phase functions are usually expressed by a Legendre polynomial or empirical formulas such as the Henyey–Greenstein function [44]. In this work, a Legendre polynomial was used:
P(g) = 1 + b × cos(g) + c × (1.5 × cos2(g) − 0.5),
The coefficients b and c determine the general shape of phase functions (Equation (7), where b describes the degree of forward and backward scattering and c the degree of side scatter [9]. Based on this model, the reflectance data at different phase angles were converted to SSA and then the bidirectional reflectance at a standard geometry was calculated from SSA with Equation (4). Then, bidirectional reflectance can be converted to reflectance factor (REFF) using Equation (8):
REFF = BREF × π/μ0,

2.3. CE-4 VNIS Datasets

The VNIS level 2B data used in this study have been underwent dark-current and scattering-background subtraction, flat-field and instrument temperature correction, and radiometric and geometric calibration [2,39,45] by the Ground Research and Application System (GRAS) of the Chinese Lunar Exploration Program. The level 2B data were then transformed into bidirectional reflectance of solar irradiance divided before normalization to a Sun–Moon distance of 1 AU [6]. For the view geometry of VNIS datasets, the illumination conditions (e.g., incident angle (i), emission angle (e), and phase angle (g)) of each pixel are calculated by the linear interpolation of the values of the four corner points and averaged over a 1° angle bin for the VNIR images. In addition, the central point of the FOV is used for the SWIR spectra to analyze. The detailed observation geometry is shown in Table 1. This calculation of illumination geometry assumes a horizontal surface and the incidence angle could be changed by <2° [38] due to the topographic slopes, while the phase angle remains unchanged.
During the first 18 lunar days of the Yutu-2 operation, 96 VNIS spectra datasets were obtained (Figure 1) and three photometric experiments were conducted in the surrounding regions on the fourth lunar day and two sites on the tenth lunar day (Figure 2). These observations provide a critical opportunity for the photometric studies of local lunar soils. On the fourth lunar day, the Yutu-2 rover had remained stationary and conducted multiple spectral measurements with phase angles of 39°–97° for the surrounding lunar surface area of homogeneous composition [21]. Along the planned travel path, the VNIS observed another two targeted sites with phase angles of 55°–79° and 91°–112° (Table 1), respectively, on the tenth lunar day. The spectrophotometric experiments on the tenth lunar day provide valuable in-situ data to investigate the photometric properties of CE-4 lunar soils, thus we focus on this spectral dataset in this study (Table 1).

2.4. Laboratorial Spectral Measurements by a VNIS Replica

In order to better understand the photometric properties of the CE-4 landing site and examine the effect of surface roughness on SWIR bands, we performed the spectral measurements in a laboratory using a VNIS replica. The mixed silicate powders were prepared as an analog of lunar regolith. The photometric measurements were conducted at the Shanghai Institute of Technical Physics, Chinese Academy of Sciences (SITP). The lunar regolith analog (Table 2) was prepared following the remote sensing results based on a Kaguya Multiband Imager [46,47], which suggest that lunar regolith at the landing site is mainly made up of ejecta from the Finsen crater [2,3,4,48]. Orthopyroxene (Opx), Clinopyroxene (Cpx), plagioclase (Pl) and olivine (Ol) were selected as pure mineral endmembers, and they were grounded and sieved into particle size of 20–100 μm. The mineral proportions of the lunar regolith analog are similar to the Finsen crater ejecta, as shown in Table 2. The measurements were designed with instrument configuration as shown in Supplementary Materials Figure S1. The vertical distance between the light source and the experimental platform is 0.69 m. The spectrometer was fixed (thus the emission angle was fixed) in order to reduce the error of instrument (Table 3). The phase angle was adjusted by changing the azimuth angle of the light source and the included angle between the light source and the normal of the experimental platform was maintained at 60° (thus the incident angle was maintained at 60°) (Table 3). The lunar regolith analog was flattened out before VNIS spectral measurements, aiming to suppress the shadowing effects resulting from surface roughness to ensure a conformable distribution of powders. The spectral data of the lunar regolith analog were collected with multiple phase angles varying from 28° to 103° (Table 3).

3. Results

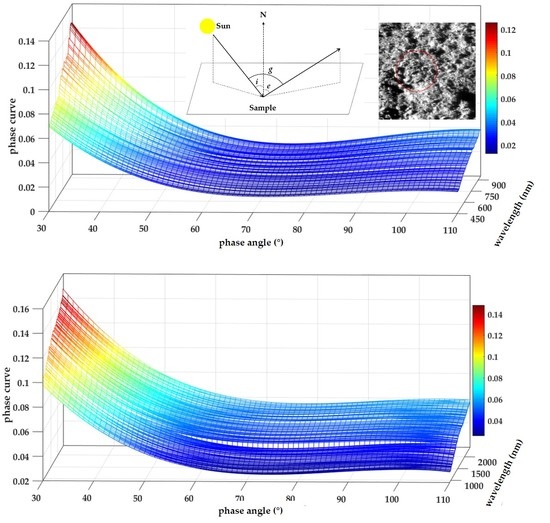
3.1. Phase Functions of the LS Model and Initial Photometric Normalization of CE-4 Datasets

The Yutu-2 rover performed the photometric measurements of two targets with different phase angles under immobile conditions during the tenth lunar day, which provides unprecedented opportunities for determining the accurate phase functions for lunar farside soils. As the first step, the phase curves of VNIR imaging bands and SWIR non-imaging bands are independently fitted using a third-order polynomial LS model as given above (Equation (2), Figure 3). The derived best-fit values for phase functions of LS model are given in Table S1. The scattering intensities related to phase curves exhibit declining trends with the increase in phase angles shown in Figure 3a,b. As expected for lunar regolith, when the phase angle is small, the values of phase curves rapidly increase with decreasing phase angles due to the opposition effect (Figure 3) [24]. It is suggested that the phase curves of short-wavelength bands display faster declining trends with the decrease in phase angles than that of long-wavelength bands, resulting in a phase reddening effect [49]. In addition, the minimum phase angle used to fit phase curves in our work is 55° limited by the actual observations of VNIS (Table 1). We conducted an extrapolation correction to 30° for VNIS datasets, possibly importing additional errors and/or uncertainties.
For the Hapke model, the parameters of phase functions have been intensively studied. In this study, we preliminarily used b = −0.4, c = 0.25 (named by Mustard parameters in this work) for the Legendre polynomials [50,51], as they are widely used in spectral unmixing analysis [4,43]. We then conducted a photometric correction using the Hapke model and LS model with the methods mentioned in Section 2.4. The initial photometric correction results of the LS model for VNIS datasets are compared with those of the Hapke model (Figure 4), indicating that the corrected reflectance-using Hapke model decreases in contrary to the LS model. Besides, the spectra of the same target did not coincide after photometric corrections employing both the LS and Hapke model. Compared with raw VNIS datasets, spectral curves become more dispersed after the correction of the Hapke model (Figure 4, the maximum discrepancy at 1500 nm increase from 15.4% to 28.3%). As shown in Figure S2, the values of the single-scattering phase function of the Hapke model are unrealistic when increasing with phase angles greater than ~60°. Many observations of CE-4 VNIS were made at large phase angles (>60°), thus the Hapke model with parameters b = −0.4 and c = 0.25 may be not suitable for CE-4 spectra. The shadows resulting from lunar surface roughness may exert a significant influence on the reflectance spectra obtained during in-situ measurements, as evident from the increase in shadowed pixels in images with increasing incident angles and phase angles (Figure 2). The effect of surface roughness was assessed and described in the discussion section.

3.2. Laboratory Spectral Measurements of Lunar Regolith Analog

As shown in Figure 5a, the nine spectra of the lunar regolith analog exhibit flat continuum and distinct 1 and 2 μm absorption features due to the Fe2+ electronic transitions of mafic minerals. In general, the REFF values of nine spectra increase in accordance with phase angles in both the VNIR and SWIR spectral regions. Photometric corrections were performed (Figure 5b,c) on these laboratory data in order to verify the photometric functions of the LS and Hapke models and help to constrain the photometric properties of the CE-4 landing site.
As indicated in Figure 5b, the normalized spectra of the SWIR range using the LS model show a striking coincidence (maximum discrepancy was 8.2% at 1500 nm). The spectra with very large phase angle (g = 103°) exhibit abnormal high REFF values before and after normalization, possibly due to the stray light contamination during VNIS observations. Compared with the normalized spectra using the LS model of CE-4 lunar soils and regolith analog (Figure 4 and Figure 5b), CE-4 spectra exhibit a larger spectral slope and smaller absorption depth caused by the formation and accumulation of submicroscopic metallic iron (SMFe), named the space weathering effect [52,53]. Furthermore, the normalized spectra of CE-4 show a dispersed distribution (Figure 4), while normalized laboratory spectra match with each other (Figure 5b). We tentatively ascribe this to the fact that the lunar regolith analog underwent adequate grounding, sieving and mixing and the apparent surface for the measured sample was smooth at a large scale compared with the analog particle size (20–100 μm). However, lunar soils at the CE-4 landing site were composed of lumps of varying sizes and exhibited an uneven microtopography with shadows caused by surface roughness (Figure 2). From our laboratory measurements, the surface roughness has a significant influence on the reflectance spectra acquired during the in-situ VNIS observations and its effects should not be ignored in the VNIS data processing. We will discuss the shadow effect in detail in the following section.
As shown in Figure 5c, similar to CE-4 VNIS spectra corrected by the Hapke model (mentioned in Section 3.1), the normalized laboratory spectra employing the Hapke model exhibit a similar dispersion. This may further enhance our recognition that the parameters (b = −0.4 and c = 0.25) in the phase functions of the Hapke model are not reliable when applying it to the CE-4 VNIS spectra [31]. Instead, we would use the phase function parameters (b = −0.17 and c = 0.70, named by YZ parameters in this work) of the Hapke model obtained by CE-4 in-situ measurements [31] to normalize the CE-4 REFF spectra at different phase angles. Details will be given in following discussions.

4. Discussion

4.1. Evaluation of the Shadow Effects

As discussed above, different performances of the photometric normalization of lunar soils and lunar regolith analog were observed, leading to the necessity to evaluate shadow effects in CE-4 in-situ VNIS measurements. As indicted by the VNIS images (Figure 2) of the first target on the tenth lunar day, the numbers of shadowed pixels increase with the increase in incident and phase angles, revealing the influence of surface roughness.
The pixels of the VNIR image with REFF <0.02 at 465 nm were regarded as shadowed pixels. To evaluate the contribution of the shadowed pixels in VNIR and SWIR detectors, we first extracted the number of shadowed pixels in the VNIR images within regions of the FOV of the SWIR detector using a density slice function of ENVI (Figure 6a,b). The proportions of shadowed pixels (indicated as red areas in Figure 6b) related to the total pixels in the red circle for 750 nm were obtained. We find a linear relationship between the proportions of shadowed pixels and REFF values for the eleven spectra obtained during the photometric experiments on the tenth lunar day. As given in Figure 6c,d, the squares of the determination coefficients are 0.97 and 0.98 for REFF at 750 and 1500 nm, respectively. Therefore, the shadowed pixels will affect the total reflectance values varying with illumination conditions, possibly caused by the multiple scattering contribution to the shadowed pixels. This reveals that in-situ visible and near-infrared detection is susceptible to surface roughness, which should be corrected to get the authentic REFF. Conversely, for orbital images, these small shadows would not be resolvable.

4.2. Improvement and Validation of Photometric Models

To eliminate the shadow effects on the CE-4 VNIR data, all shadowed pixels in VNIR images were discarded. Then, the spectra of all VNIR non-shadowed pixels within the region of the FOV of the SWIR detector are averaged and used as the new REFF spectra from 450 to 950 nm. To reduce the influence of shadows on SWIR spectra, the REFF values of all bands were divided by the correction factors that are defined by the proportions of the non-shadowed to all the pixels within the red circles (e.g., Figure 6b) extracted from the corresponding VNIR images.
As shown in Figure 7a, the spectra coincident worked well if only shadow correction was performed. However, comparing Figure 7a with Figure 7b, the photometric-corrected spectra exhibit higher reflectance values and larger spectral slopes in SWIR bands. For the shadow correction of VNIR bands, we could assess the reflectance value of each pixel and remove all the shadowed pixels. For the non-imaging SWIR detector of VNIS, we divided the REFF values by the correction factors. This could help to weaken but not eliminate all the influence of shadows on SWIR detector due to their different spectral responses and spatial resolutions. Thus, a further photometric correction is necessary. Different photometric correction results (Figure 7) were compared for the data from the tenth lunar day. The corrected reflectance spectra using the LS model after removal of shadowed pixels exhibit preferable consistence with each other (Figure 7b). These photometric-corrected spectra exhibit higher reflectance values that in Figure 7a. However, spectra corrected by the Hapke model using the Mustard parameters (Figure 7c) obviously deviate from each other, while spectra corrected by Hapke model using the YZ parameters (Figure 7d) improved but still show some mismatches comparing to the result of the LS model (Figure 7b).
The validations (Figure 8) were then conducted by comparing the photometrically normalized spectra of the first target observed on the tenth lunar day. For the reflectance spectra of the same target, their deviations are caused by different illumination geometries and they should be coincident after the photometric normalization by perfect phase functions [36]. It is found that the maximum discrepancies of the spectra at 1500 nm are 10.6% for the LS model (Figure 8a) and 28.3% for the Hapke model (Figure 8c) prior to the removal of shadow effects. After performing the shadow correction, the maximum discrepancies at 1500 nm were reduced to 3.7% for the LS model (Figure 8b) and 20.8% for the Hapke model using Mustard parameters (Figure 7c and Figure 8d). The relatively poor spectra coincidence of the Hapke model for Mustard parameters reveals that they are not suitable for spectra with large phase angles, as is the case for CE-4 observations. In order to improve the performance of the Hapke model, the YZ parameters (b = −0.17 and c = 0.70), obtained by CE-4 in-situ photometric experiment datasets [31], were employed to normalize the CE-4 REFF spectra at different phase angles. Results show that the maximum discrepancy at 1500 nm was reduced to 7.4% (Figure 7d and Figure 8e). The spectra of the second target measured on the tenth lunar day were also shown to evaluate the performance of the phase functions of the LS and Hapke model (Figure S3). However, correction results of both the LS and Hapke model show obvious trichotomy in terms of phase angles. This inconsistency could be caused by stray light contamination at very large phase angles, which was also observed during laboratory measurements using the CE-4 VNIS replica. It is worth noting that the spectra measured at different phase angles are approximately parallel to each other after being corrected by the LS model (Figure S3b,f), while they deviated from each other after being corrected by the Hapke model (Figure S3c,d,g,h).
In summary, we find that in-situ measured spectra are greatly influenced by the shadows caused by surface roughness. For the in-situ photometric correction, proper shadow correction should be conducted first. We also find that the phase functions derived for the LS model are more suitable for the photometric normalization of CE-4 VNIS datasets, which could help to gain an accurate interpretation of the relative quantitative mineralogy along the traverse route of the Yutu-2 rover in the Von Kármán crater.

4.3. Comparison of the Spectral and Mineralogical Properties of the CE-4 and CE-3 Lunar Soils

The VNIS observations implemented by CE-4 and CE-3 were the only in-situ reflectance detections of the Moon so far, providing unique opportunities to comprehend the properties of lunar soils. In this work, the in-situ VNIS spectra of CE-4 and CE-3 landing site were normalized to the standard geometry using the LS model (Figure 9a,b), ensuring that the corrected spectra are comparable with each other, devoid of the influence of solar illumination conditions. The VNIR spectra were multiplied by a factor to splice them with the SWIR spectra; then, a Savitzky–Golay filter [54] of order 3 that uses a frame size of 31 points was applied to smooth these spectra (Figure 9a). Except some rock-related spectra (e.g., 0014, 0015, 0104 and 0107), the regolith spectra of the CE-4 landing site show a weak absorption depth and consistent 1 μm absorption band center. The spectra of the CE-3 landing site exhibit lower reflectance values and a stronger absorption depth than that of CE-4 spectra. Then, spectral continuums were removed and spectral parameters (e.g., band centers, integrated band depth (IBD) of 1μm absorption) were extracted using the data processing method of [6].
As shown in Figure 9c, the normalized VNIS spectra of the CE-4 landing site exhibited redder spectral slopes (R1600/R750) (Figure 9c, average value of 1.70) and a weaker IBD (Figure 9d, average value of 16.5) of the 1 μm absorption than that of the CE-3 landing site (average values of 1.58 and 28.1) due to different optical maturities. Then, the contents of FeO and the optical maturity parameter (OMAT) [53] were estimated (Table S2) from the photometric-normalized spectra using parameters provided by [21]. Results show that the estimated OMAT of CE-4 soils are 0.18 ± 0.03—smaller than the results of [21] (~ 0.25). Besides, the soils at the CE-4 landing site had a lower abundance of FeO (10.8 ± 1.06 wt.%) than that of the CE-3 landing site (~22.8 wt.%) [33], which is consistent with the lunar soils of the CE-4 landing site as they exhibit higher maturity and are exposed to a longer duration of space weathering [55,56]. Moreover, previous studies suggest that the exposure ages of the CE-4 and CE-3 landing sites are about 3.5–3.6 Ga (Finsen crater ejecta) [56,57] and 27–80 My (Zi Wei crater) [58], and the maturity indexes Is/FeO are ~82 [59] and ~53 [55], respectively.
In terms of mineral chemistries, the CE-4 landing site is located near ballistic ejecta from the Imbrian-aged Finsen [56] and/or the Imbrian-aged Alder crater [4,47,60], which are rich in Low-Calcium Pyroxene (LCP) (HCP/LCP = ~ 0.7) and characterized by a more feldspathic composition [48]. However, the CE-3 landing site is located on the young impact ejecta blankets of the Copernican Zi Wei crater on the lunar nearside [58], which is rich in high-calcium pyroxene (HCP) (HCP/LCP = ~ 2.0), olivine (>20 wt.%) and characterized by medium-titanium lunar basalt exposure [33,61]. As shown in Figure 9e, the band centers of the 1 μm absorption are plotted against 2 μm absorption to identify the composition of pyroxene. The band centers (1 μm absorption) of CE-3 soils fall in the range of 1004–1027 nm, while CE-4 regolith was concentrated in the range of 951–1006 nm. In addition, the band centers (1 μm absorption) of CE-4 soils located at the position of non-mare clinopyroxene (CPX), while the pyroxene chemistries of the CE-3 soils were more Fe,Ca-rich than that of CE-4. Despite the large deviation of 2000 nm band centers (with standard deviation of 154 nm), the CE-4 VNIS spectra are located between Mg-rich pyroxene and calcic CPX, which is similar to the results of [6]. The composition of lunar soils on the CE-4 landing site are relatively homogeneous, indicating that the soils are well gardened and mixed.
A comparison of spectral parameters was conducted (Table S2) for the CE4 VNIS spectra before and after correction to better understand the influence of illumination conditions. Generally, normalized spectra exhibit smaller spectral slopes, lower FeO contents and thus a larger OMAT (Table S2). The standard deviations of these spectral parameters were also smaller than that of spectra without a photometric correction. Besides, the band centers of the 1 and 2 μm absorption of spectra without a photometric correction exhibit a wider dispersion and the 1 μm band centers range from 940 to 1041 nm (Table S2). The difference in spectra shapes before and after photometric correction reveal that the variation of illumination conditions would influence the spectral characteristics and thus the geologic interpretation of the analyses of lunar materials. Thus, it is essential to acquire accurate phase functions and eliminate the effects of illumination conditions and shadows.

5. Conclusions

This work establishes empirical photometric functions to normalize the radiance variation of the lunar surface with incidence, emission, and phase angles, in order to eliminate the influence of illumination conditions. Major remarks are as follows:
(1)
From in-situ and laboratory measurements, the shadows caused by surface roughness have significant impacts on the reflectance spectra acquired during lunar in-situ VNIS observations and proper corrections for shadows were introduced.
(2)
We produced empirical wavelength-dependent phase functions of Lommel–Seeliger model from CE-4 VNIS datasets. Values of phase functions exhibit declining trends with the increase in phase angles and an opposition effect and phase reddening effect were observed. This is the first time that empirical phase functions have been derived for wavelengths from 450 to 2395 nm using in-situ visible and near-infrared spectral datasets.
(3)
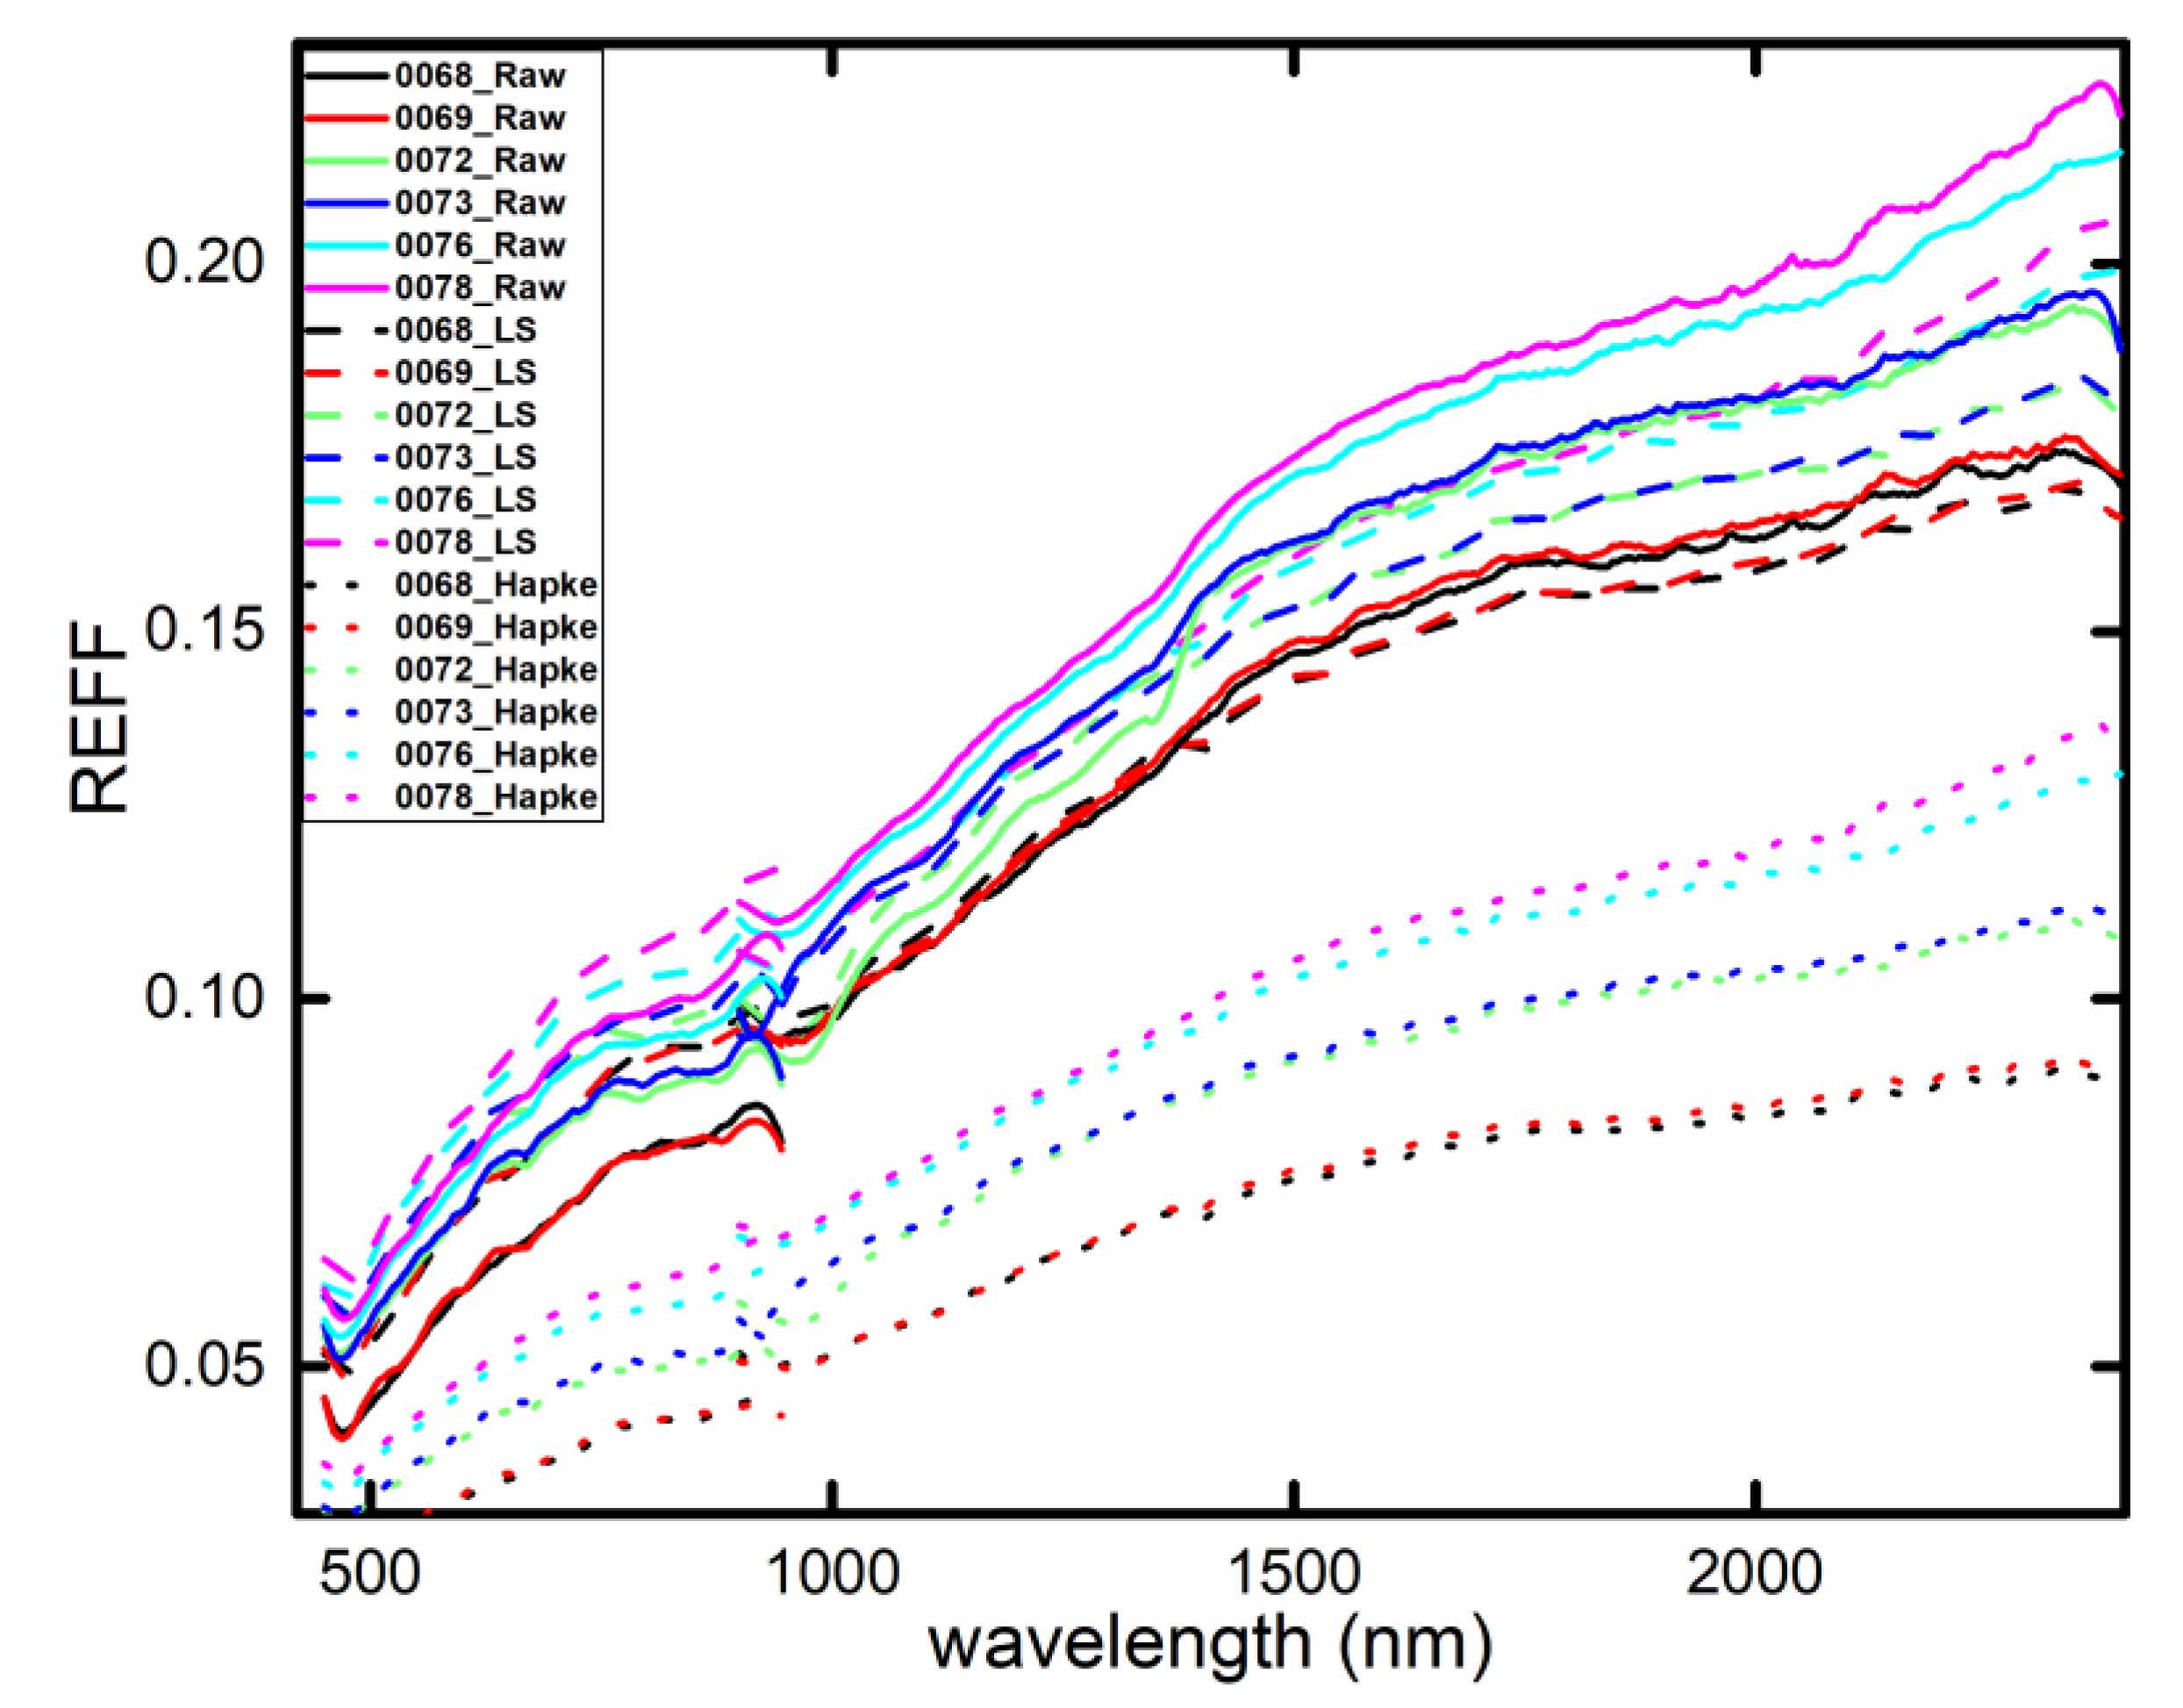
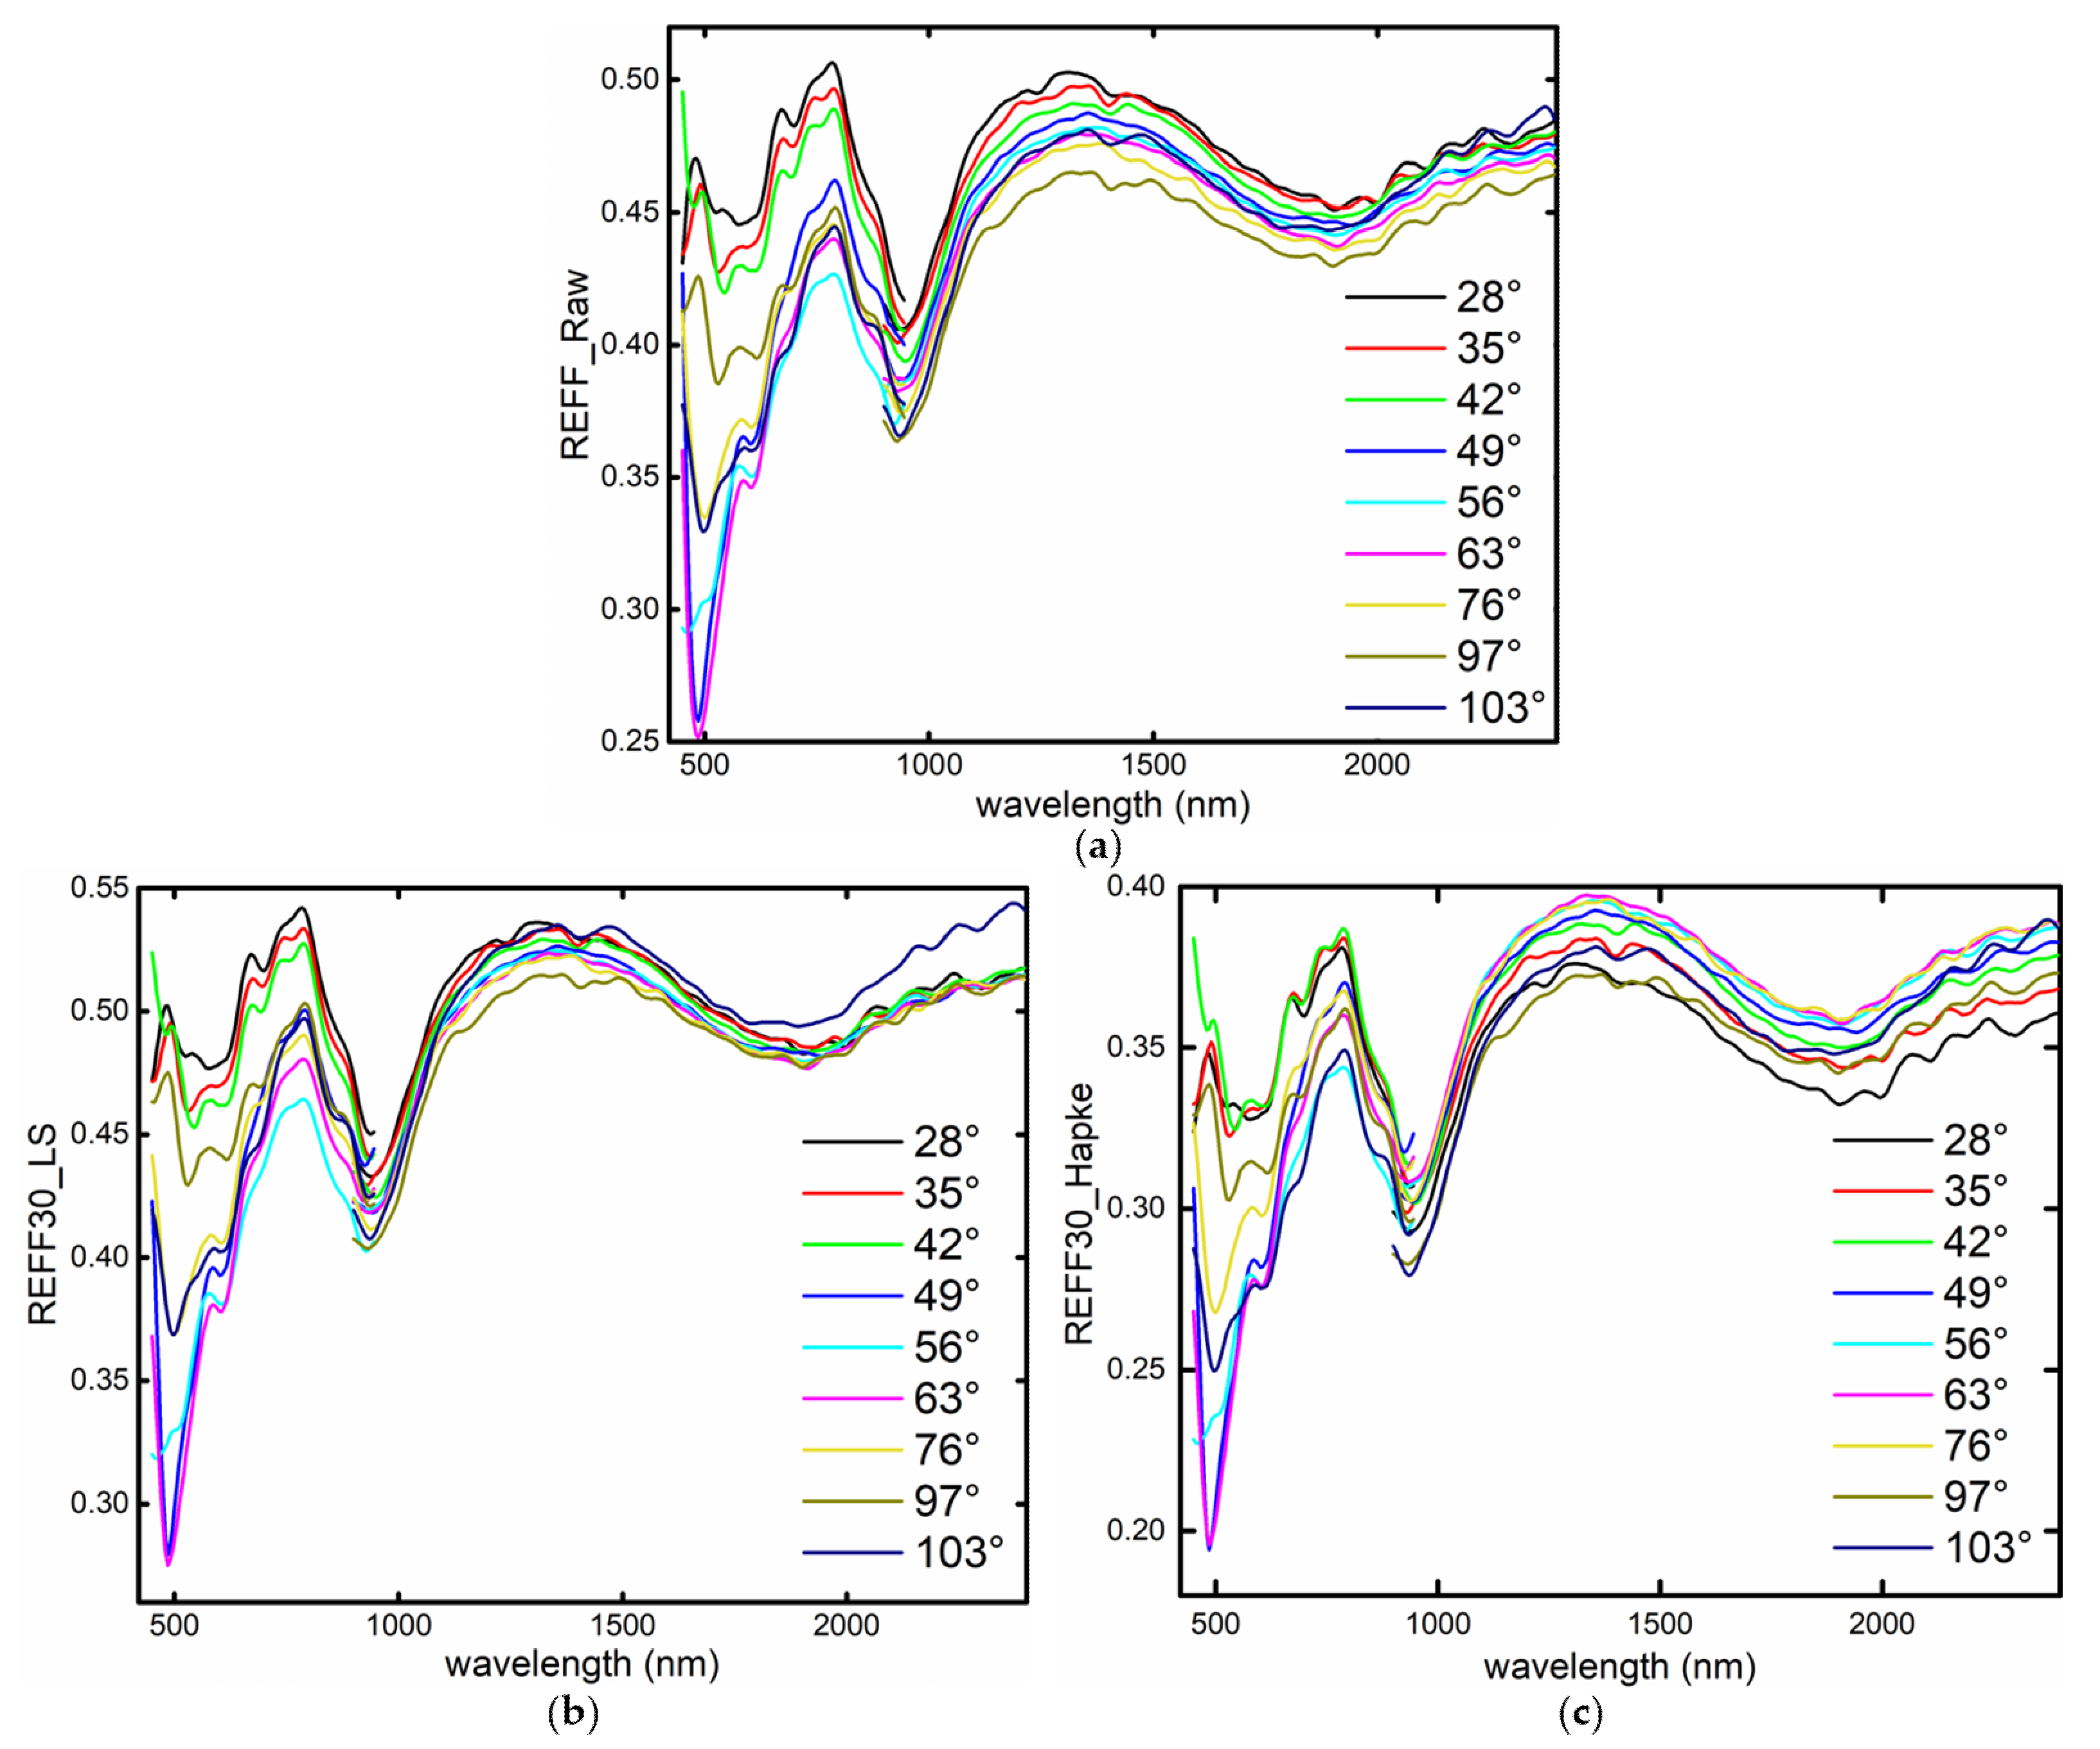
Photometric corrections of CE-4 and laboratory VNIS spectra were conducted using the Lommel–Seeliger and Hapke radiative transfer models to determine the most suitable phase functions. Then, the validations of different phase functions conducted by comparing photometric-normalized spectra of the same target suggest that their discrepancies at 1500 nm are 3.7% using the Lommel–Seeliger model and 7.4% using the Hapke radiative transfer model (with parameters b = −0.17, c = 0.70).
(4)
Generally, photometrically normalized spectra exhibit smaller spectral slopes, lower FeO contents and thus a larger OMAT than that of spectra without correction. In addition, the band centers of the 1 and 2 μm absorption of spectra after photometric normalization exhibit a more concentrated distribution, indicating the compositional homogeneity of soils at the CE-4 landing site after Yutu-2 traveling ~448 m.
(5)
We prefer the phase functions derived from the LS model to apply to the photometric normalization of VNIS datasets and these empirical phase functions will contribute to the detection of, and accurate interpretation of, relative quantitative mineralogy along the traverse route of the Yutu-2 rover in the Von Kármán crater.

Supplementary Materials

The following are available online at https://www.mdpi.com/2072-4292/12/19/3211/s1, Figure S1: The laboratory spectral measurements by VNIS replica at the Shanghai Institute of Technical Physics, Chinese Academy of Sciences (SITP); Figure S2. Single-scattering phase functions of Hapke model (b = −0.4 and c = 0.25); Figure S3: Comparisons of photometric correction results of CE-4 VNIS spectra measured at the tenth lunar day after shadow correction; Table S1. The derived best-fit values for phase functions of Lommel-Seeliger model; Table S2: Spectral parameters of spectra after photometric correction and shadow corrections.

Author Contributions

Conceptualization, Z.L. and J.Z.; Data curation, X.Q., C.L., Z.H. and R.X.; Formal analysis, X.Q., Z.L. and J.Z.; Funding acquisition, Z.L., L.Q., X.F., J.L. and Y.Z.; Methodology, X.Q., Z.L., J.Z. and J.C.; Supervision, Z.L.; Writing—original draft, X.Q.; Writing—review and editing, Z.L., J.Z., J.C., H.C., L.Q., X.F., J.L. and Y.Z. All authors have read and agreed to the published version of the manuscript.

Funding

This research was funded by Strategic Priority Research Program of Chinese Academy of Sciences, grant number XDB 41000000; the National Natural Science Foundation of China, grant number 11941001, 41972322, U1931211, and 41706063; the pre-research project on Civil Aerospace Technologies supported by China National Space Administration (CNSA), grant number D020102, D020205 and D020201; the National Key Research and Development Program of China, grant number 2020YFE0202100; National Science and Technology Infrastructure Work Projects, grant number 2015FY210500; the Natural Science Foundation of Shandong Province, grant number ZR2019MD008; the Beijing Municipal Science and Technology Commission, grant number Z181100002918003; Physical-Chemical Materials Analytical and Testing Center of Shandong University at Weihai.

Acknowledgments

The scientific data are provided by China National Space Administration. The authors gratefully thank the whole Chang’e-4 team for mission operations and the Ground Research and Application System (GRAS) of the Chinese Lunar Exploration Program for providing the data (http://moon.bao.ac.cn). All original LRO data can be found in NASA’s Planetary Data System (http://pds.nasa.gov/). The authors are grateful to the editors and reviewers for their constructive reviews.

Conflicts of Interest

The authors declare no conflict of interest.

References

  1. Jia, Y.; Zou, Y.; Ping, J.; Xue, C.; Yan, J.; Ning, Y. The scientific objectives and payloads of Chang’E-4 mission. Planet. Space Sci. 2018, 162, 207–215. [Google Scholar] [CrossRef]
  2. Li, C.; Liu, D.; Liu, B.; Ren, X.; Liu, J.; He, Z.; Zuo, W.; Zeng, X.; Xu, R.; Tan, X. Chang’E-4 initial spectroscopic identification of lunar far-side mantle-derived materials. Nature 2019, 569, 378–382. [Google Scholar] [CrossRef]
  3. Gou, S.; Di, K.; Yue, Z.; Liu, Z.; He, Z.; Xu, R.; Lin, H.; Liu, B.; Peng, M.; Wan, W. Lunar deep materials observed by Chang’e-4 rover. Earth Planet. Sci. Lett. 2019, 528, 115829. [Google Scholar] [CrossRef]
  4. Hu, X.; Ma, P.; Yang, Y.; Zhu, M.H.; Jiang, T.; Lucey, P.G.; Sun, L.; Zhang, H.; Li, C.; Xu, R. Mineral Abundances Inferred From In Situ Reflectance Measurements of Chang’E-4 Landing Site in South Pole-Aitken Basin. Geophys. Res. Lett. 2019, 46, 9439–9447. [Google Scholar] [CrossRef]
  5. Lin, H.; He, Z.; Yang, W.; Lin, Y.; Xu, R.; Zhang, C.; Zhu, M.-H.; Chang, R.; Zhang, J.; Li, C. Olivine-norite rock detected by the lunar rover Yutu-2 likely crystallized from the SPA impact melt pool. Natl. Sci. Rev. 2019, 7, 913–920. [Google Scholar] [CrossRef] [Green Version]
  6. Chen, J.; Ling, Z.; Qiao, L.; He, Z.; Xu, R.; Sun, L.; Zhang, J.; Li, B.; Fu, X.; Liu, C. Mineralogy of Chang’e-4 landing site: Preliminary results of visible and near-infrared imaging spectrometer. Inf. Sci. 2020, 63, 1–140903. [Google Scholar] [CrossRef] [Green Version]
  7. Sato, H.; Robinson, M.; Hapke, B.; Denevi, B.; Boyd, A. Resolved Hapke parameter maps of the Moon. J. Geophys. Res. Planets 2014, 119, 1775–1805. [Google Scholar] [CrossRef]
  8. Shkuratov, Y.G.; Grynko, Y.S. Light scattering by media composed of semitransparent particles of different shapes in ray optics approximation: Consequences for spectroscopy, photometry, and polarimetry of planetary regoliths. Icarus 2005, 173, 16–28. [Google Scholar] [CrossRef]
  9. Hapke, B. Bidirectional reflectance spectroscopy: 1. Theory. J. Geophys. Res. Solid Earth 1981, 86, 3039–3054. [Google Scholar] [CrossRef]
  10. Besse, S.; Sunshine, J.; Staid, M.; Boardman, J.; Pieters, C.; Guasqui, P.; Malaret, E.; McLaughlin, S.; Yokota, Y.; Li, J.-Y. A visible and near-infrared photometric correction for Moon Mineralogy Mapper (M3). Icarus 2013, 222, 229–242. [Google Scholar] [CrossRef]
  11. Hapke, B. Theory of Reflectance and Emittance Spectroscopy; Cambridge University Press: Cambridge, UK, 2012. [Google Scholar]
  12. Hillier, J.K.; Buratti, B.J.; Hill, K. Multispectral photometry of the Moon and absolute calibration of the Clementine UV/Vis camera. Icarus 1999, 141, 205–225. [Google Scholar] [CrossRef]
  13. Minnaert, M. The reciprocity principle in lunar photometry. Astrophys. J. 1941, 93, 403–410. [Google Scholar] [CrossRef]
  14. Hicks, M.; Buratti, B.; Nettles, J.; Staid, M.; Sunshine, J.; Pieters, C.; Besse, S.; Boardman, J. A photometric function for analysis of lunar images in the visual and infrared based on Moon Mineralogy Mapper observations. J. Geophys. Res. Planets 2011, 116, E6. [Google Scholar] [CrossRef]
  15. Shkuratov, Y.; Starukhina, L.; Hoffmann, H.; Arnold, G. A model of spectral albedo of particulate surfaces: Implications for optical properties of the Moon. Icarus 1999, 137, 235–246. [Google Scholar] [CrossRef]
  16. Fairbarin, M.B. Planetary Photometry: The Lommel-Seeliger Law. J. R. Astron. Soc. Can. 2005, 99, 92. [Google Scholar]
  17. Sato, H.; Boyd, A.; Robinson, M.; Denevi, B.; Hapke, B.; McEwen, A.; Speyerer, E. Photometric normalization of LROC WAC global color mosaic. epsc 2011, 2011, 636. [Google Scholar]
  18. Chen, C.; Qin, Q.; Zhang, N.; Wang, J.; Li, J.; Jiang, H. Research on photometric calibration and reflectance calculation of CE-1 IIS data. Spectrosc. Spectr. Anal. 2011, 31, 1985–1990. [Google Scholar]
  19. Wu, Y.; Besse, S.; Li, J.-Y.; Combe, J.-P.; Wang, Z.; Zhou, X.; Wang, C. Photometric correction and in-flight calibration of Chang’E-1 Interference Imaging Spectrometer (IIM) data. Icarus 2013, 222, 283–295. [Google Scholar] [CrossRef]
  20. Zhang, J.; Ling, Z.; Zhang, W.; Ren, X.; Li, C.; Liu, J. Photometric modeling of the Moon using Lommel-Seeliger function and Chang’E-1 IIM data. Chin. Sci. Bull. 2013, 58, 4588–4592. [Google Scholar] [CrossRef]
  21. Lin, H.; Xu, R.; Yang, W.; Lin, Y.; Wei, Y.; Hu, S.; He, Z.; Qiao, L.; Wan, W. In situ photometric experiment of lunar regolith with visible and near-infrared imaging spectrometer onboard the Yutu-2 lunar rover. J. Geophys. Res. Planets 2020, 125, e2019JE006076. [Google Scholar] [CrossRef]
  22. Hapke, B. Bidirectional reflectance spectroscopy: 4. The extinction coefficient and the opposition effect. Icarus 1986, 67, 264–280. [Google Scholar] [CrossRef] [Green Version]
  23. Hapke, B. Space weathering from Mercury to the asteroid belt. J. Geophys. Res. Planets 2001, 106, 10039–10073. [Google Scholar] [CrossRef]
  24. Helfenstein, P.; Veverka, J.; Hillier, J. The lunar opposition effect: A test of alternative models. Icarus 1997, 128, 2–14. [Google Scholar] [CrossRef]
  25. Helfenstein, P.; Veverka, J.; Thomas, P.C. Uranus satellites: Hapke parameters from Voyager disk-integrated photometry. Icarus 1988, 74, 231–239. [Google Scholar] [CrossRef]
  26. Domingue, D.; Hapke, B. Fitting theoretical photometric functions to asteroid phase curves. Icarus 1989, 78, 330–336. [Google Scholar] [CrossRef]
  27. Guinness, E.A.; Arvidson, R.E.; Clark, I.H.; Shepard, M.K. Optical scattering properties of terrestrial varnished basalts compared with rocks and soils at the Viking Lander sites. J. Geophys. Res. Planets 1997, 102, 28687–28703. [Google Scholar] [CrossRef]
  28. Warell, J. Properties of the Hermean regolith: IV. Photometric parameters of Mercury and the Moon contrasted with Hapke modelling. Icarus 2004, 167, 271–286. [Google Scholar] [CrossRef]
  29. Li, J.-Y.; A’Hearn, M.F.; Belton, M.J.; Crockett, C.J.; Farnham, T.L.; Lisse, C.M.; McFadden, L.A.; Meech, K.J.; Sunshine, J.M.; Thomas, P.C. Deep Impact photometry of comet 9P/Tempel 1. Icarus 2007, 187, 41–55. [Google Scholar] [CrossRef]
  30. Fernando, J.; Schmidt, F.; Ceamanos, X.; Pinet, P.; Douté, S.; Daydou, Y. Surface reflectance of Mars observed by CRISM/MRO: 2. Estimation of surface photometric properties in Gusev Crater and Meridiani Planum. J. Geophys. Res. Planets 2013, 118, 534–559. [Google Scholar] [CrossRef]
  31. Yang, Y.; Lin, H.; Liu, Y.; Lin, Y.; Wei, Y.; Hu, S.; Yang, W.; Xu, R.; He, Z.; Zou, Y. The Effects of Viewing Geometry on the Spectral Analysis of Lunar Regolith as Inferred by in situ Spectrophotometric Measurements of Chang’E-4. Geophys. Res. Lett. 2020, 47, e2020GL087080. [Google Scholar] [CrossRef]
  32. Kreslavsky, M.; Shkuratov, Y.G. Photometric anomalies of the lunar surface: Results from Clementine data. J. Geophys. Res. Planets 2003, 108. [Google Scholar] [CrossRef]
  33. Ling, Z.; Jolliff, B.L.; Wang, A.; Li, C.; Liu, J.; Zhang, J.; Li, B.; Sun, L.; Chen, J.; Xiao, L. Correlated compositional and mineralogical investigations at the Chang′ e-3 landing site. Nat. Commun. 2015, 6, 1–9. [Google Scholar] [CrossRef] [PubMed] [Green Version]
  34. Zhang, H.; Yang, Y.; Yuan, Y.; Jin, W.; Lucey, P.G.; Zhu, M.H.; Kaydash, V.G.; Shkuratov, Y.G.; Di, K.; Wan, W. In situ optical measurements of Chang’E-3 landing site in Mare Imbrium: 1. Mineral abundances inferred from spectral reflectance. Geophys. Res. Lett. 2015, 42, 6945–6950. [Google Scholar] [CrossRef]
  35. Buratti, B.; Hicks, M.; Nettles, J.; Staid, M.; Pieters, C.; Sunshine, J.; Boardman, J.; Stone, T. A wavelength-dependent visible and infrared spectrophotometric function for the Moon based on ROLO data. J. Geophys. Res. Planets 2011, 116, E6. [Google Scholar] [CrossRef]
  36. Yokota, Y.; Matsunaga, T.; Ohtake, M.; Haruyama, J.; Nakamura, R.; Yamamoto, S.; Ogawa, Y.; Morota, T.; Honda, C.; Saiki, K. Lunar photometric properties at wavelengths 0.5–1.6 μm acquired by SELENE Spectral Profiler and their dependency on local albedo and latitudinal zones. Icarus 2011, 215, 639–660. [Google Scholar] [CrossRef]
  37. Jin, W.; Zhang, H.; Yuan, Y.; Yang, Y.; Shkuratov, Y.G.; Lucey, P.G.; Kaydash, V.G.; Zhu, M.H.; Xue, B.; Di, K. In situ optical measurements of Chang’E-3 landing site in Mare Imbrium: 2. Photometric properties of the regolith. Geophys. Res. Lett. 2015, 42, 8312–8319. [Google Scholar] [CrossRef] [Green Version]
  38. Lin, H.; Yang, Y.; Lin, Y.; Liu, Y.; Wei, Y.; Li, S.; Hu, S.; Yang, W.; Wan, W.; Xu, R. Photometric properties of lunar regolith revealed by the Yutu-2 rover. Astron. Astrophys. 2020, 638, A35. [Google Scholar] [CrossRef]
  39. He, Z.-P.; Wang, B.-Y.; Lü, G.; Li, C.-L.; Yuan, L.-Y.; Xu, R.; Liu, B.; Chen, K.; Wang, J.-Y. Operating principles and detection characteristics of the Visible and Near-Infrared Imaging Spectrometer in the Chang’e-3. Res. Astron. Astrophys. 2014, 14, 1567. [Google Scholar] [CrossRef]
  40. Li, C.; Wang, Z.; Xu, R.; Lv, G.; Yuan, L.; He, Z.; Wang, J. The scientific information model of Chang’e-4 visible and near-IR imaging spectrometer (VNIS) and in-flight verification. Sensors 2019, 19, 2806. [Google Scholar] [CrossRef] [Green Version]
  41. Wu, W.; Wang, Q.; Tang, Y.; Yu, G.; Liu, J.; Zhang, W. Design of Chang’E-4 lunar farside soft-landing mission. J. Deep Space Explor. 2017, 4, 111–117. [Google Scholar]
  42. He, Z.; Li, C.; Xu, R.; Lv, G.; Yuan, L.; Wang, J. Spectrometers based on acousto-optic tunable filters for in-situ lunar surface measurement. J. Appl. Remote Sens. 2019, 13, 027502. [Google Scholar]
  43. Li, S.; Li, L. Radiative transfer modeling for quantifying lunar surface minerals, particle size, and submicroscopic metallic Fe. J. Geophys. Res. Planets 2011, 116, E9. [Google Scholar] [CrossRef]
  44. Henyey, L.G.; Greenstein, J.L. Diffuse radiation in the galaxy. Astrophys. J. 1941, 93, 70–83. [Google Scholar] [CrossRef]
  45. Liu, B.; Li, C.-L.; Zhang, G.-L.; Xu, R.; Liu, J.-J.; Ren, X.; Tan, X.; Zhang, X.-X.; Zuo, W.; Wen, W.-B. Data processing and preliminary results of the Chang’e-3 VIS/NIR Imaging Spectrometer in-situ analysis. Res. Astron. Astrophys. 2014, 14, 1578. [Google Scholar] [CrossRef]
  46. Lemelin, M.; Lucey, P.G.; Miljković, K.; Gaddis, L.R.; Hare, T.; Ohtake, M. The compositions of the lunar crust and upper mantle: Spectral analysis of the inner rings of lunar impact basins. Planet. Space Sci. 2019, 165, 230–243. [Google Scholar] [CrossRef]
  47. Qiao, L.; Ling, Z.; Fu, X.; Li, B. Geological characterization of the Chang’e-4 landing area on the lunar farside. Icarus 2019, 333, 37–51. [Google Scholar] [CrossRef]
  48. Ling, Z.; Qiao, L.; Liu, C.; Cao, H.; Bi, X.; Lu, X.; Zhang, J.; Fu, X.; Li, B.; Liu, J. Composition, mineralogy and chronology of mare basalts and non-mare materials in Von Kármán crater: Landing site of the Chang’E-4 mission. Planet. Space Sci. 2019, 179, 104741. [Google Scholar] [CrossRef]
  49. Schröder, S.E.; Grynko, Y.; Pommerol, A.; Keller, H.; Thomas, N.; Roush, T. Laboratory observations and simulations of phase reddening. Icarus 2014, 239, 201–216. [Google Scholar] [CrossRef]
  50. Mustard, J.F.; Pieters, C.M. Photometric phase functions of common geologic minerals and applications to quantitative analysis of mineral mixture reflectance spectra. J. Geophys. Res. Solid Earth 1989, 94, 13619–13634. [Google Scholar] [CrossRef]
  51. Lucey, P.G. Model near-infrared optical constants of olivine and pyroxene as a function of iron content. J. Geophys. Res. Planets 1998, 103, 1703–1713. [Google Scholar] [CrossRef]
  52. Pieters, C.M.; Taylor, L.A.; Noble, S.K.; Keller, L.P.; Hapke, B.; Morris, R.V.; Allen, C.C.; McKAY, D.S.; Wentworth, S. Space weathering on airless bodies: Resolving a mystery with lunar samples. Meteorit. Planet. Sci. 2000, 35, 1101–1107. [Google Scholar] [CrossRef]
  53. Lucey, P.G.; Blewett, D.T.; Taylor, G.J.; Hawke, B.R. Imaging of lunar surface maturity. J. Geophys. Res. Planets 2000, 105, 20377–20386. [Google Scholar] [CrossRef]
  54. Savitzky, A.; Golay, M.J. Smoothing and differentiation of data by simplified least squares procedures. Anal. Chem. 1964, 36, 1627–1639. [Google Scholar] [CrossRef]
  55. Wang, Z.; Wu, Y.; Blewett, D.T.; Cloutis, E.A.; Zheng, Y.; Chen, J. Submicroscopic metallic iron in lunar soils estimated from the in situ spectra of the Chang’E-3 mission. Geophys. Res. Lett. 2017, 44, 3485–3492. [Google Scholar] [CrossRef]
  56. Gou, S.; Yue, Z.; Kaichang, D.; Cai, Z.; Liu, Z.; Niu, S. Absolute model age of lunar Finsen crater and geologic implications. Icarus 2020, 354, 114046. [Google Scholar] [CrossRef]
  57. Ivanov, M.; Hiesinger, H.; van der Bogert, C.; Orgel, C.; Pasckert, J.; Head, J. Geologic History of the Northern Portion of the South Pole-Aitken Basin on the Moon. J. Geophys. Res. Planets 2018, 123, 2585–2612. [Google Scholar] [CrossRef]
  58. Xiao, L.; Zhu, P.; Fang, G.; Xiao, Z.; Zou, Y.; Zhao, J.; Zhao, N.; Yuan, Y.; Qiao, L.; Zhang, X. A young multilayered terrane of the northern Mare Imbrium revealed by Chang’E-3 mission. Science 2015, 347, 1226–1229. [Google Scholar] [CrossRef]
  59. Gou, S.; Yue, Z.; Di, K.; Wan, W.; Liu, Z.; Liu, B.; Peng, M.; Wang, Y.; He, Z.; Xu, R. In situ spectral measurements of space weathering by Chang’e-4 rover. Earth Planet. Sci. Lett. 2020, 535, 116117. [Google Scholar] [CrossRef]
  60. Fu, X.-H.; Qiao, L.; Zhang, J.; Ling, Z.-C.; Li, B. The subsurface structure and stratigraphy of the Chang’E-4 landing site: Orbital evidence from small craters on the Von Kármán crater floor. Res. Astron. Astrophys. 2020, 20, 008. [Google Scholar] [CrossRef]
  61. Zhao, J.; Huang, J.; Qiao, L.; Xiao, Z.; Huang, Q.; Wang, J.; He, Q.; Xiao, L. Geologic characteristics of the Chang’E-3 exploration region. Sci. China Phys. Mech. Astron. 2014, 57, 569–576. [Google Scholar] [CrossRef]
  62. Cloutis, E.A.; Gaffey, M.J. Pyroxene spectroscopy revisited: Spectral-compositional correlations and relationship to geothermometry. J. Geophys. Res. Planets 1991, 96, 22809–22826. [Google Scholar] [CrossRef]
  63. Moriarty Iii, D.; Pieters, C. The character of south pole-Aitken basin: Patterns of surface and subsurface composition. J. Geophys. Res. Planets 2018, 123, 729–747. [Google Scholar] [CrossRef]
Figure 1. Orbital view of the Chang’e-4 (CE-4) landing site. (a) Nomenclature of major features surrounding the CE-4 landing site on Lunar Reconnaissance Orbiter (LRO) Lunar Orbiter Laser Altimeter Digital Elevation Model; (b) the traverse map of Yutu-2 in the first 17 lunar days (overlaid on Lunar Reconnaissance Orbiter Camera Narrow Angle Camera Digital Terrain Model). Yutu-2 did not move in the eighteenth lunar day; each exploration site in different lunar days is marked by circles with different colors.
Remotesensing 12 03211 g001
Figure 2. Reflectance images at 750 nm of the two detection targets measured in the tenth lunar day. Addition labels of pixels were added to the first Visible and Near-Infrared (VNIR) image; the red circles and number labels indicate Field of View (FOV) of Shortwave Infrared (SWIR) spectrometer and data filename released at the Data Release and Information Service System of China’s Lunar Exploration Program; a schematic diagram of the relationship between incident, emission and phase angles is placed in the upper left corner of Figure 2.
Remotesensing 12 03211 g002
Figure 3. Three-dimensional phase functions for the Lommel–Seeliger (LS) model derived from observations 0068-0090. (a) VNIR spectral regions; (b) SWIR spectral regions.
Remotesensing 12 03211 g003
Figure 4. Comparisons of initial photometric correction results of Hapke radiative transfer (Hapke) model and Lommel–Seeliger (LS) model.
Remotesensing 12 03211 g004
Figure 5. Comparisons of the photometric correction results of (a) raw reflectance factor (REFF) spectra of lunar regolith analog obtained by VNIS replica at different phase angles; (b) spectra of lunar regolith analog corrected with LS model; (c) spectra of lunar regolith analog corrected with Hapke model.
Remotesensing 12 03211 g005
Figure 6. (a) REFF images at 750 nm of CE-4-VNIS-0068; (b) color mapping of CE-4-VNIS-0068 at 750 nm; (c) the linear relationship between shadowed pixels in VNIR image and reflectance at 750 nm (observations 0068-0079); (d) the linear relationship between shadowed pixels in VNIR image and reflectance at 1500 nm (observations 0068-0079). The red circle indicates FOV of SWIR spectrometer; green: pixels with REFF (465 nm) >0.02; red: pixels with REFF (465 nm) >0.02, were regarded as shadowed pixels.
Remotesensing 12 03211 g006
Figure 7. Comparisons of photometric correction results of the CE-4 VNIS spectra measured on the tenth lunar day (target 1). (a) Spectra that are only shadow-corrected; (b) spectra after shadow correction corrected by LS model; (c) spectra of the first target corrected by Hapke model (b = −0.4 and c = 0.25); (d) spectra of the first target corrected by Hapke model (b = −0.17 and c = 0.70).
Remotesensing 12 03211 g007
Figure 8. Scatter plot between photometrically normalized VNIS spectra of the same target and at different illumination geometries. (a) Before shadow effect corrections (LS model); (b) after shadow effect corrections (LS model); (c) before shadow effect corrections (Hapke model, Mustard parameters); (d) after shadow effect corrections (Hapke model, Mustard parameters); (e) after shadow effect corrections (Hapke model, YZ parameters). The dashed line denotes the two spectra are coincident; NSR—no shadow effects removed; SR—shadow effects removed.
Remotesensing 12 03211 g008
Figure 9. (a) Part of the CE-4 VNIS spectra obtained during 1–18 lunar days; (b) photometric normalization results of CE-3 VNIR spectra using LS model; (c) spectral slopes of CE-3 and CE-4 measurements; (d) integrated band depth (IBD) of 1μm absorption (CE-3 and CE-4 measurements); (e) band center positions of the CE-3 and CE-4 VNIS detections overlain on band centers of pyroxene [6,62,63]. Mg-PX: Mg-rich pyroxene.
Remotesensing 12 03211 g009
Table 1. The observation geometry (incident angle (i), emission angle (e), and phase angle (g)) of the tenth lunar day.
Observationi (°)e (°)g (°)Observationi (°)e (°)g (°)
006876.54348.27379.376007957.27244.41491.082
006975.94648.27378.433008057.87344.41492.113
007071.31948.27371.432008158.28944.41492.814
007170.10248.27369.544008258.74144.41493.568
007269.57648.27368.722008359.23944.41494.386
007368.86748.27367.607008463.49844.414100.990
007468.29948.27366.708008564.12744.414101.916
007563.70948.27359.185008664.64044.414102.664
007662.82348.27357.672008765.22744.414103.512
007762.01548.27356.269008865.81244.414104.349
007861.14948.27354.737008966.37044.414105.139
009077.11344.414111.614
Table 2. Mineral proportions of Finsen ejecta (estimated from Kaguya MI data) and lunar regolith analog.
Mineral (wt.%)OlOpxCpxPl
Finsen ejecta7 ± 325 ± 413 ± 455 ± 4
Lunar regolith analog7251355
Table 3. The observation geometry of laboratory spectral measurements.
ObservationAzimuth Angle (°)i (°)e (°)g (°)
Measurement 11506045103
Measurement 2140604597
Measurement 3130604576
Measurement 4120604563
Measurement 5110604556
Measurement 6100604549
Measurement 790604542
Measurement 880604535
Measurement 970604528

