Article

Spatio-Temporal Characteristics for Moon-Based Earth Observations

1
Aerospace Information Research Institute, Chinese Academy of Sciences, Beijing 100094, China
2
College of Resources and Environment, University of Chinese Academy of Sciences, Beijing 100049, China
3
Qian Xuesen Laboratory of Space and Technology, China Academy of Space Technology, Beijing 100094, China
4
School of Earth and Space Sciences, Peking University, Beijing 100871, China
5
Department of Mechanical Engineering, Tsinghua University, Beijing 100084, China
*
Author to whom correspondence should be addressed.
Remote Sens. 2020, 12(17), 2848; https://doi.org/10.3390/rs12172848
Submission received: 20 May 2020 / Revised: 26 August 2020 / Accepted: 31 August 2020 / Published: 2 September 2020
(This article belongs to the Special Issue Lunar Remote Sensing and Applications)

Abstract

:
Spatio-temporal characteristics are the crucial conditions for Moon-based Earth observations. In this study, we established a Moon-based Earth observation geometric model by considering the intervisibility condition between a Moon-based platform and observed points on the Earth, which can analyze the spatio-temporal characteristics of the observations of Earth’s hemisphere. Furthermore, a formula for the spherical cap of the Earth visibility region on the Moon is analytically derived. The results show that: (1) the observed Earth spherical cap has a diurnal period and varies with the nadir point. (2) All the annual global observation durations in different years show two lines that almost coincide with the Arctic circle and the Antarctic circle. Regions between the two lines remain stable, but the observation duration of the South pole and North pole changes every 18.6 years. (3) With the increase of the line-of-sight minimum observation elevation angle, the area of an intervisible spherical cap on the lunar surface is obviously decreased, and this cap also varies with the distance between the barycenter of the Earth and the barycenter of the Moon. In general, this study reveals the effects of the elevation angle on the spatio-temporal characteristics and additionally determines the change of area where the Earth’s hemisphere can be observed on the lunar surface; this information can provide support for the accurate calculation of Moon-based Earth hemisphere observation times.

Graphical Abstract

1. Introduction

In recent years, Earth system science has considered the planet as an indivisible whole, with large-scale geoscience phenomena such as global warming receiving increasing attention. To understand, monitor, and predict global change, many countries and organizations have created three global observation systems. These systems are named the Global Climate Observing System (GCOS), the Global Ocean Observing System (GOOS), and the Global Terrestrial Observing System (GTOS), and their objectives are to observe the climate, oceans, and land [1,2,3]. Taking the GCOS as an example, it is designed to detect climate change, monitor the climate system, and perform climate forecasting at a global scale [4]. The European Space Agency (ESA) also proposed a project called Long-Term Data Preservation (LTDP), whose mission includes recording regional to global Earth observation data [5]. These observations are all continuous and provide abundant data for revealing the potential mechanism of Earth system evolution. These projects demonstrate that studying Earth system science requires large-scale and temporally consistent data.
Currently, airborne and space-borne remote-sensing platforms are powerful tools to acquire the Earth’s data. For example, Deep Space Climate Observatory (DSCOVR) which is 1,500,000 km from the Earth, can always observe the daytime Earth. In addition to artificial remote-sensing platforms, the Earth’s sole natural satellite, i.e., the Moon, has been proposed as a potential Earth observation platform [6]. This is because the Moon is a long-term stable platform, with a stable geologic framework and vast space, thereby meeting the requirement of equipping sensors to observe the Earth for hundreds of years and provide long-term Earth system data. Because of the 380,000-km distance between the two celestial bodies, and because the Moon always faces the Earth as a result of “tidal locking,” this body can potentially provide consistent Earth hemisphere observations. DSCOVR and the Moon-based platform have some similarities and differences. (1) From the aspect of the lifetime, the Moon is a natural platform, it is stable and unique, DSCOVR is in the Lissajous orbit and its planned mission life is five years [7]. (2) In the aspect of distance, the Moon is about 380,000 km from the Earth and DSCOVR is about 1,500,000 km from the Earth, thus, the effects of the minimum elevation angle for DSCOVR to the Earth spherical cap are less than the Moon-based platform. Because of the long distance, if looking at the edges of the lit hemisphere from the Moon and from DSCOVR, the lit area will be less of the total lit area because the effect of the view frustum is so much further away, and the calculations of the percentage loss of area from a Moon-based platform and from DSCOVR are shown in Appendix A. Moreover, the time interval of each Earth phases viewed from a Moon-based platform is about one quarter of a synodic month. Among this cycle, the duration that the Moon can view a full sunlit disk reaches to about two days. (3) In terms of the observed phenomena, both of them can achieve Earth hemisphere observations. DSCOVR makes observations every 3 or 6 h depending on the day of the year. It has severe bandwidth limitations also, and a Moon-based platform would not have such limitations; it could in effect observe the Earth continuously from the lunar surface. (4) From the aspect of observation angles, the Moon-based platform have various observation angles thanks to the orbit of the Moon, it can achieve the whole observations for the Earth polar regions. DSCOVR has a fixed solar zenith angle and it cannot observe the whole Earth polar regions. Thus, the Moon-based platform is a great supplement to the existing platforms.
Although the Moon-based platform is new in remote sensing, communication from lunar landers has been investigated so far. For example, Vogler [8] discusses the problem of point-to-point radio communication on the Moon. Sawyer [9] describes several communications-related lunar-environment experiments proposed by the Apollo program. Shian Hwu et al. [10] proved that the lunar terrain geometry, antenna location, and lunar surface material are important factors to determine the propagation characteristics of the lunar wireless communication systems.
Various studies have established that the Moon is a suitable Earth observation platform. Foing [11] notes the advantages and constraints of the Moon as a site for astronomical observations in 1996. Lunar properties such as lunar gravity, rotation, and topography are favorable for building a lunar site. The concept of a Moon-based platform is proposed by Guo [12], and he also notes the Moon’s unique advantages resulting from its high orbit altitude and vast surface. Then, he compares the Moon-based platform with existing platforms and argues for the former’s superiority in observing surfaces and the Earth’s outer sphere because of long-term observations, its large coverage area, and long platform life [13]. Ye et al. [14] mentions that because of the Moon’s high orbit and low rotation, it can observe the Earth’s hemisphere with continuous observation angles. Moccia et al. [15] thinks the Moon is a stable platform and describes the peculiarities of the Moon-based synthetic aperture radar (SAR). Xu et al. [16,17,18] also mentions that the long distance between the Earth and Moon would provide a Moon-based SAR with suitable conditions for studying global change. Moreover, its stability makes the Moon an ideal place to view the Earth for many years, which is beneficial to large-scale and long-term Earth observations. Song et al. [19] indicate that the lunar polar regions are the best regions to build a Moon-based observatory because the variation in lunar night temperature is no more than 0.2 K.
To prove that a Moon-based platform has the ability to observe a large-scale phenomenon, from the perspective of viewing geometry, Ren et al. [20] proposes a new concept of effective coverage, and demonstrates that for almost 75% of the area of the near Earth side on the lunar surface, the average effective coverage rate approaches nearly one-half. Ye et al. [21] proposes a geometry model based on the model of Ren et al. then calculates parameters that are related to the observation scope. Their results enhance our understanding of the potential for observing large-scale geoscientific phenomena. Regarding the observation duration, Ye et al. [22] reveals that the global annual observation duration from selenocenter is approximately 90 days, increasing from north to south in 2016. Wherever a Moon-based platform would be, when observing 0° latitude Earth surface features, observation durations would all be more than 40 days during one year.
Conferences have also been held in recent years to demonstrate the progress of research on Moon-based observations. The First Symposium on Space Earth Science (SESS 2018) was held in Sanya, China, and one of its sessions was focused on Moon-based Earth observations; some experts, from the perspective of the preliminary design of the payload, detailed outgoing radiation from a Moon-based platform for Earth observations, the design of a Moon-based SAR Earth observation system, the effects of lunar terrain on Moon-based observations, and so on in order to share the progress of their studies. In 2019, the First China Space Science Assembly (CSSA) was held with the theme of “Develop Space Science and Build Aerospace Power.” As a potential means for Earth observations, Moon-based Earth observations has attracted considerable attention. Scholars in the aspects of Moon-based infrared surface temperature inversion, a data transmission scheme design of a Moon-based platform, and global cloud distribution extraction from a simulation image, introduced their research.
The aim of this study is to define the spatio-temporal characteristics of a Moon-based platform. We make two contributions in this paper. First, according to the unique observation geometry of a Moon-based platform, we find the period of the observed Earth spherical cap. When compared with the annual global observation duration of different years, the observation duration distribution varies with the latitude of the nadir point. Second, we derive the analytical formula of the intervisible spherical cap of the Moon as suitable places to equip sensors that can observe the Earth’s entire hemisphere, and calculate its area. The area is in connection with the line-of-sight minimum observation elevation angle and distance between the barycenter of the Earth and the barycenter of Moon (the barycenter separation distance); thus, it can support calculating the accurate time for Moon-based Earth hemisphere observations.

2. Methodology

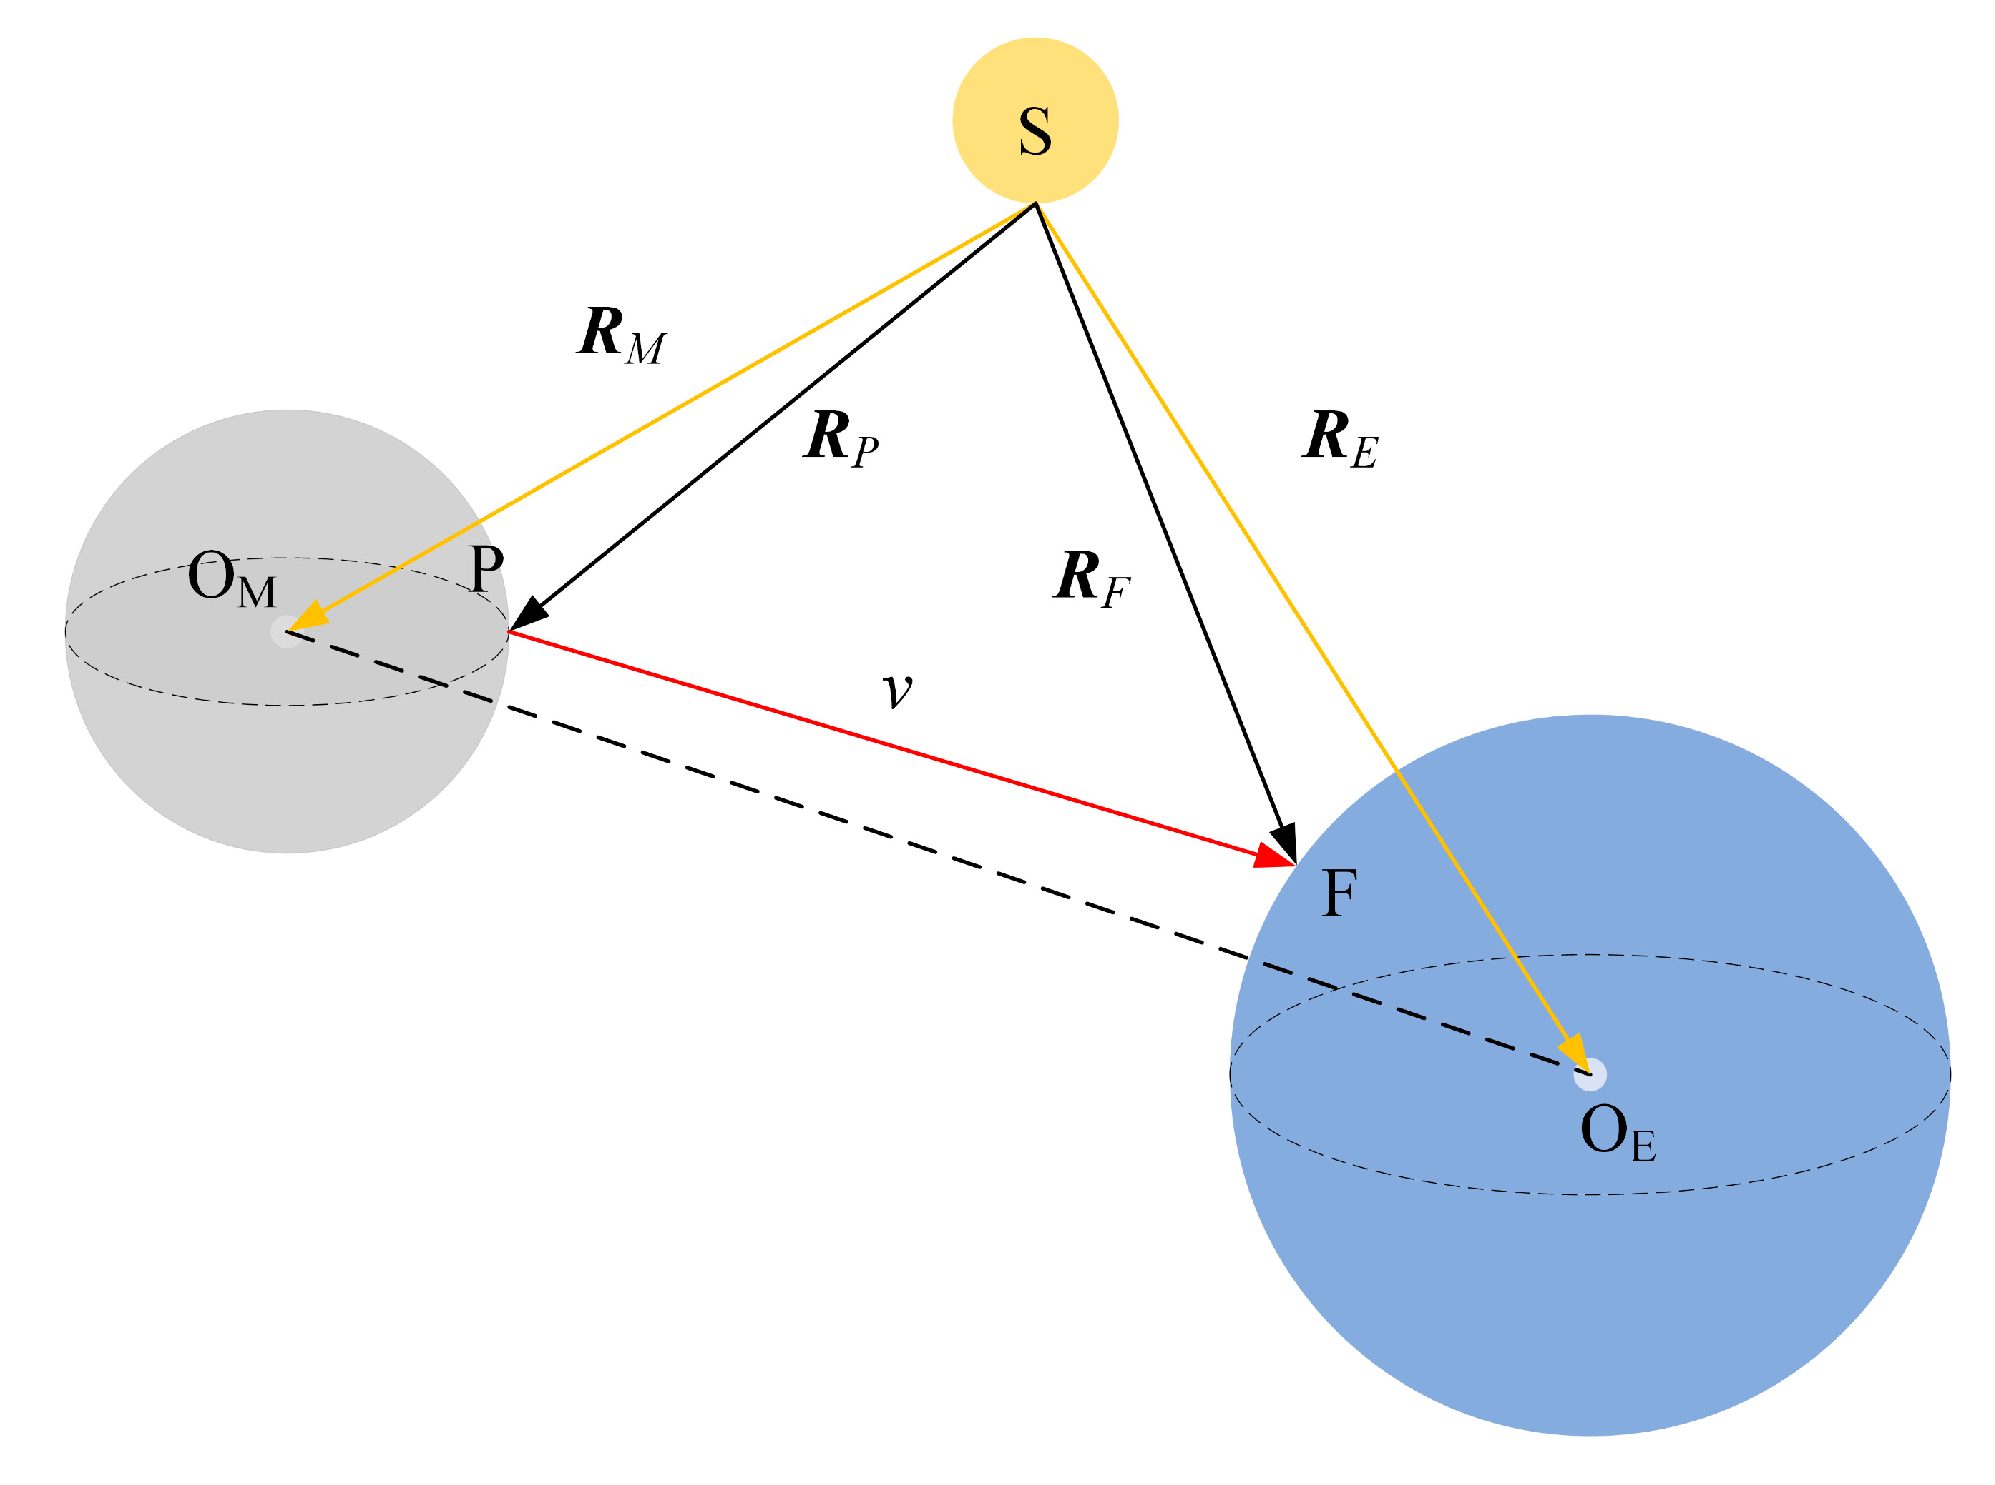
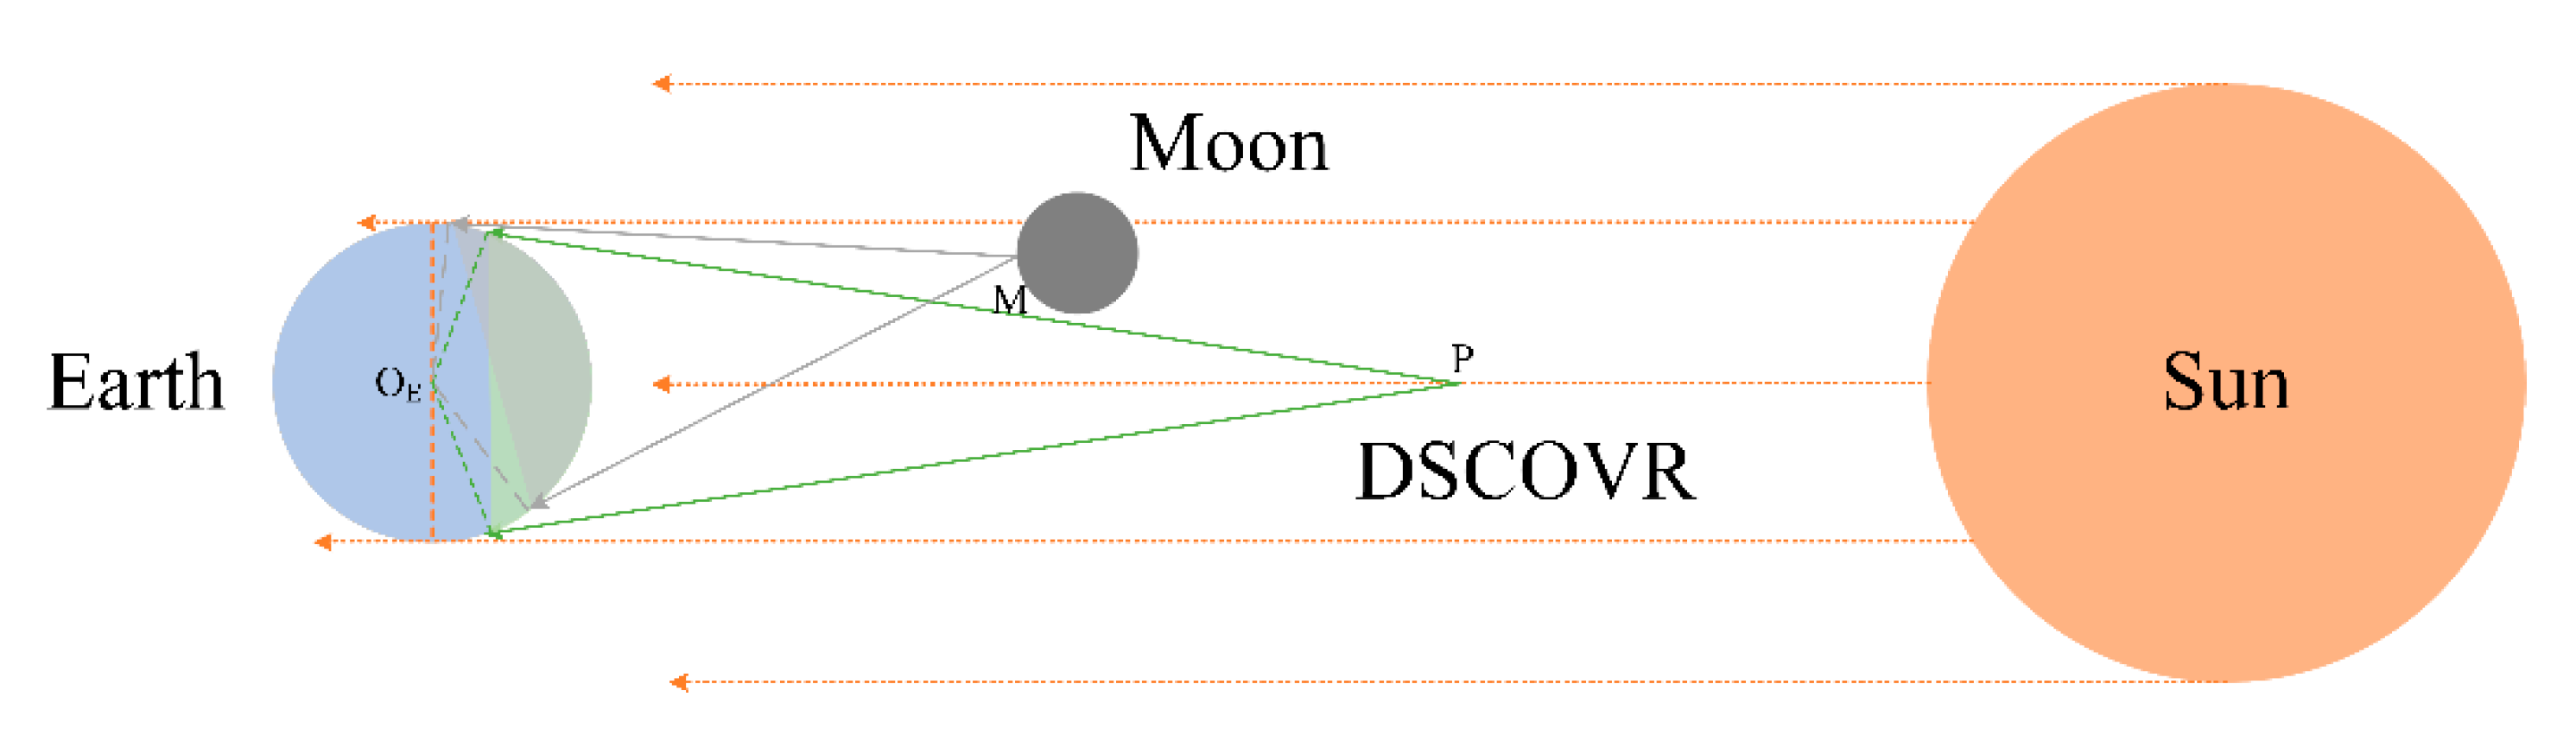
2.1. Coordinate System Definitions and Moon-Based Earth Observation Geometry

In this section, we briefly introduce the astronomical coordinate systems used in this study. Because the Moon and the Earth are in motion in their respective orbits, the positions of the features on the Earth are defined in the geodetic coordinate system of the Earth and the positions of a Moon-based sensor are defined in the geodetic coordinate system of the Moon. Thus, to elucidate the spatio-temporal characteristics for Moon-based Earth observations, we should transform the Earth and the Moon into a unified coordinate system. The five main coordinate systems used are as follows:
  • International Terrestrial Reference System (ITRS). This is the fundamental coordinate system we have chosen to unify the Earth and the Moon. Specifically, the x-axis of ITRS points to (0°, 0°) in the latitude and longitude network coordinate system, the z-axis is oriented toward the north pole, and the y-axis completes the rotation in the right-handed Cartesian system [23].
  • Geocentric Celestial Reference System (GCRS) and International Celestial Reference System (ICRS). What makes these systems unique are their origins, as GCRS is a geocentric coordinate system with its origin at the barycenter of the Earth; however, the origin of ICRS is from the solar system [24]. ICRS is the inertial system, and is the key coordinate system to transform the Moon-centered coordinate system to an Earth-centered coordinate system.
  • Selenographic coordinate system (SCS). A Moon-based platform is initially defined in this coordinate system, and it is represented as latitude, longitude, and altitude. Latitudes are measured from the equator; the Moon’s north pole is expressed as +90°, whereas the south pole is −90°. The same configuration is used for longitude, as demarcated by the prime meridian; thus, the direction towards Mare Crisium is considered positive. Altitude means the distance from the lunar surface to the sphere [25].
  • Moon-centered Moon-fixed coordinate system (MCMF). MCMF uses the barycenter of the Moon as the origin, with the x-axis pointing to the intersection of prime meridian and the lunar equatorial plane, and the z-axis points to the north pole of the Moon. This is the transitional coordinate system used to transform a Moon-based platform from a non-inertial system to an inertial system. According to the axis orientation, MCMF is divided into the mean Earth (ME) lunar reference system (LRS) and principal axis (PA) LRS [26,27].
To calculate the observation scope, the first step is to determine the geometric relationship of the Earth and the Moon.
The geometric relationship is shown in Figure 1. The barycenter of the Earth and the Moon are presented as OE and OM, respectively. Surface features on the Earth are shown as F, point P is the position of a Moon-based platform, and S is the position of the Sun. The Earth’s and a Moon-based platform position vectors are designated RF and RP, respectively, and the barycenter vector of the Earth and the Moon are set to RE and RM, respectively; v is the vector from a Moon-based platform to the Earth surface features, which can be expressed as follows
v = R F R P
RF and RP are calculated by
R F = R E + [ B ] [ P ] [ N ] [ R ] [ M ] e ITRS R P = R M + [ L ] [ C ] m M C M F
where vector eITRS represents the Earth surface features’ position vector in ITRS, and mMCMF is the position vector of a Moon-based platform in MCMF. [B] [P], [N], [R], [M] are five Earth orientation parameters (EOP) that include information of the Earth’s rotation. [P] and [N] are called the precession matrix and nutation matrix, respectively, and reveal the precession and nutation characteristics of the Earth, respectively. [R] is the rotation matrix and represents the irregularities of the rotation angle. [M] and [B] are the polar motion matrix and bias matrix, respectively. Matrix [L] represents the lunar libration with three Euler angles that are also derived from planetary ephemeris, and matrix [C] is the constant matrix used to transform ME to PA, because data from planetary ephemeris are defined in the ME and their rotation axes are not the same [28,29].
Next, we detail how to unify the Earth and the Moon in the same coordinate system. The initial coordinates of the Earth’s barycenter are obtained from development ephemeris (DE), which is studied by the Jet Propulsion Laboratory (JPL) regarding the ICRS. JPL DE has been widely used in astrogation, planetary exploration and analysis, and reductions of most astronomical precision observations, and has provided data for our study [30]. There have been many versions of the JPL DE, with each ephemeris produced by numerical integration of the equations—i.e., Chebyshev polynomial of motion. In this study, we use DE 430, which adds lunar laser ranging data and is the most accurate lunar ephemeris that includes both libration and nutation [31].
The transformation of the Earth is from ICRS to the ITRS. In the inertial reference system, ICRS to GCRS can be understood as the transformation from the solar system’s barycenter to the Earth’s barycenter. GCRS to ITRS is a more complicated transition, requiring EOP as mentioned above [32]. Additionally, a Moon-based platform can be indicated in the SCS. Transforming it into the MCMF means that the platform can be expressed as a Cartesian coordinate system. To describe its orientation, the transformation from MCMF to ICRS requires Euler angles of the lunar libration, which are derived from JPL DE 430. Then, the remaining transformations of the Moon from ICRS to ITRS are the same as the Earth.
Assuming (λF, φF) as the coordinates of a feature on the Earth’s surface, then the coordinates of this feature in ITRS can be written as:
[ x n y n z n ] = [ r E cos λ F cos φ F r E cos λ F sin φ F r E sin λ F ]
where rE is the radius of the Earth. Similarly, assuming (λL, φL) as the coordinates of a Moon-based platform in the SCS, the coordinates transformed from the SCS to ME system are calculated as:
[ x M y M z M ] = [ r M cos λ L cos φ L r M cos λ L sin φ L r M sin λ L ]
where rM is the radius of the Moon and (xM, yM, zM) are the coordinates of a Moon-based platform in the ME coordinate system.
For the transformation of a Moon-based platform from the ME reference system to ITRS, the transformation process is expressed as [14]:
P ITRS = [ M ] [ R ] [ N ] [ P ] [ B ] [ T ] [ L ] [ C ] P MCMF
where P is a Moon-based platform’s position, matrix [T] denotes a translation matrix; regardless of which vector is multiplied by [T], the vector will not change its length and orientation but be translated. The coordinates of the Moon’s barycenter are the elements in the translation matrix that can be obtained from planetary ephemeris. The remaining seven matrixes were introduced at the beginning of this section.
Figure 2 shows the Earth spherical cap viewed from a Moon-based sensor. The tangent line starts at a Moon-based platform that intersects the spherical surface of the Earth at AE and BE. Considering the minimum observation elevation angle of the Earth ε m i n (it is the critical angle which allows the line-of-sight from a Moon-based sensor that can reach to the observed features on the Earth, breaking through the limit of Earth’s local terrain, shown in Figure 2), then the Earth spherical cap changes from AENEBE to   A E N E B E , which can be expressed as:
S A E N E B E = 2 π r E h = 2 π r E 2 [ 1 sin ( α + ε m i n ) ]
where h is the height of Earth spherical cap, representing the distance between point GE and NE in Figure 2.
sin ( π / 2 + ε m i n ) r E + d = sin α r E
where d is the distance between a Moon-based platform and the Moon’s nadir point on the Earth (Earth–Moon distance). α′ is the angle between line MA E and line MO E . Line MA E starts from the position of a Moon-based platform (point M) and ends at the tangent line considering the minimum observation elevation angle ε m i n , shown as A E in Figure 2. Line MO E is the line that connects point M and the barycenter of the Earth O E . Thus, because the angle α′ is far less than π/2, Equation (6) can be simplified as:
S A E N E B E = 2 π r E 2 ( 1 sin α cos ε m i n cos α sin ε m i n )   = 2 π r E 2 [ 1 r E d + r E cos 2 ε m i n sin ε m i n 1 ( r E d + r E cos ε m i n ) 2 ]
The Earth spherical cap is connected with Earth–Moon distance d and minimum observation elevation angle ε m i n .

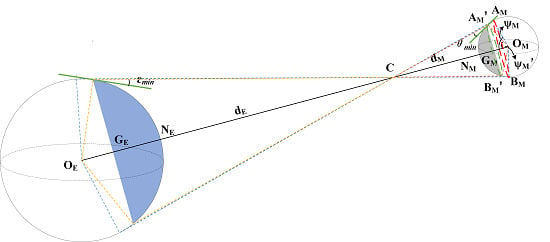
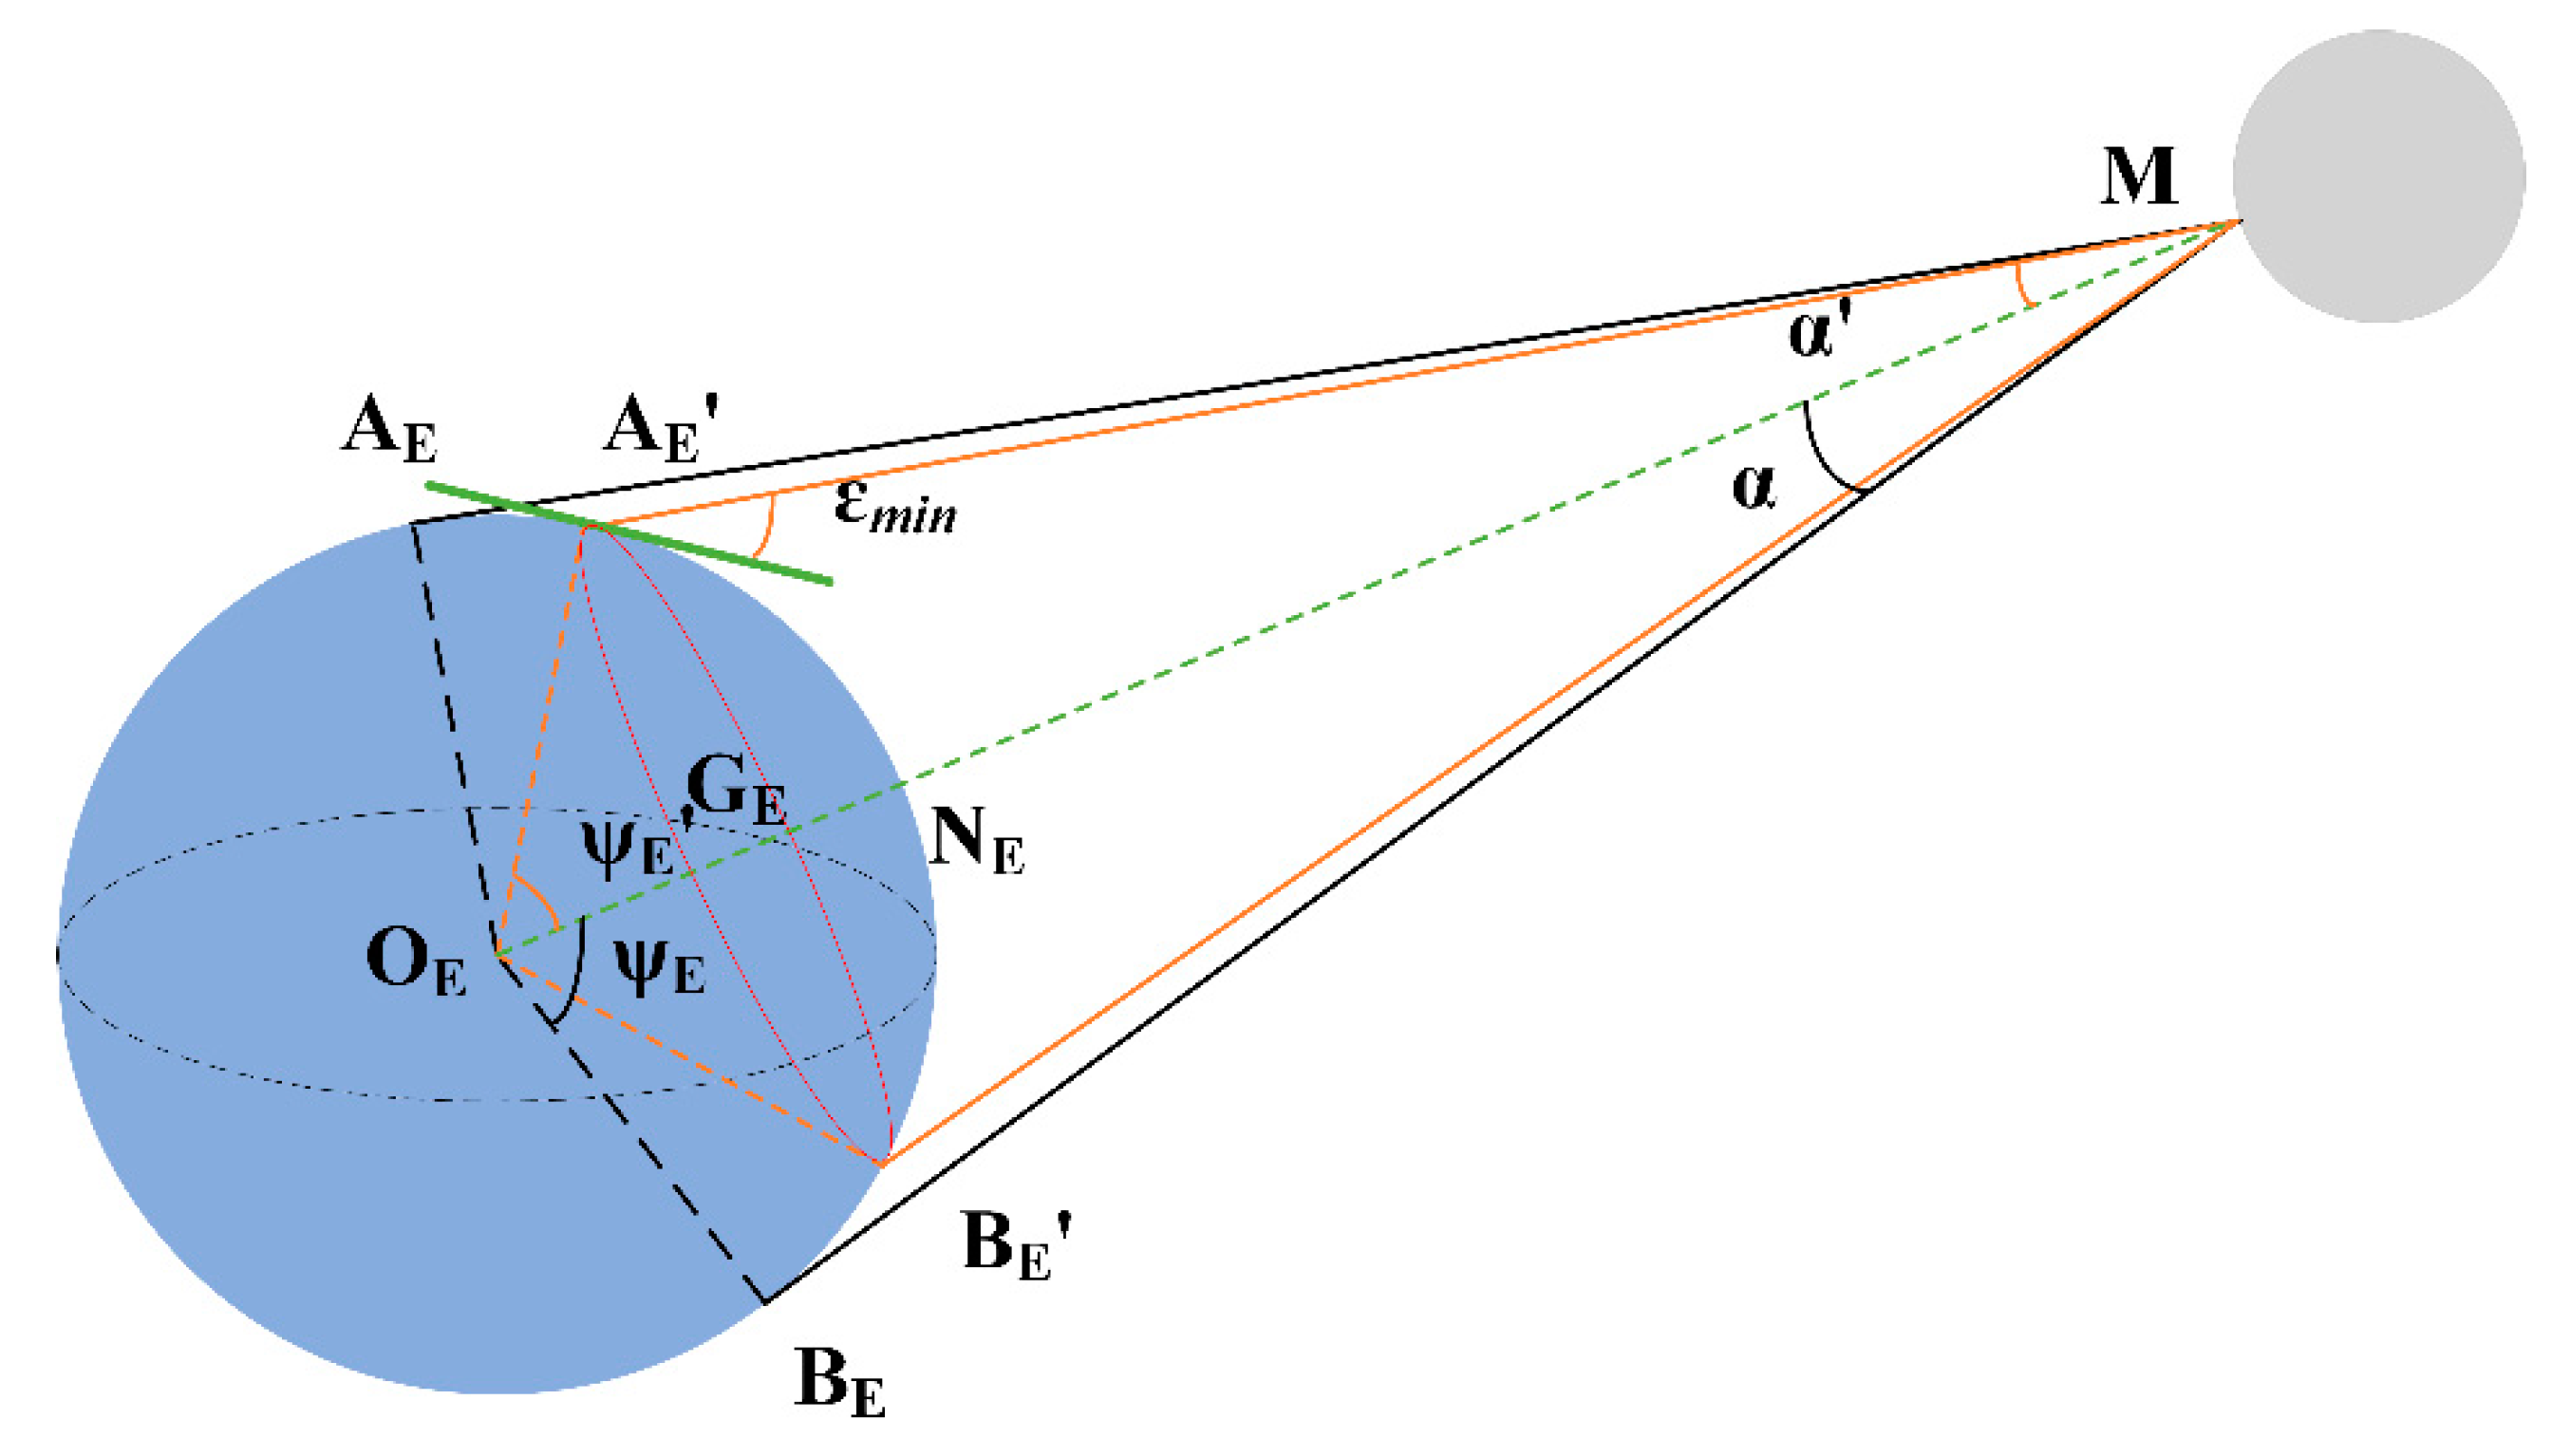
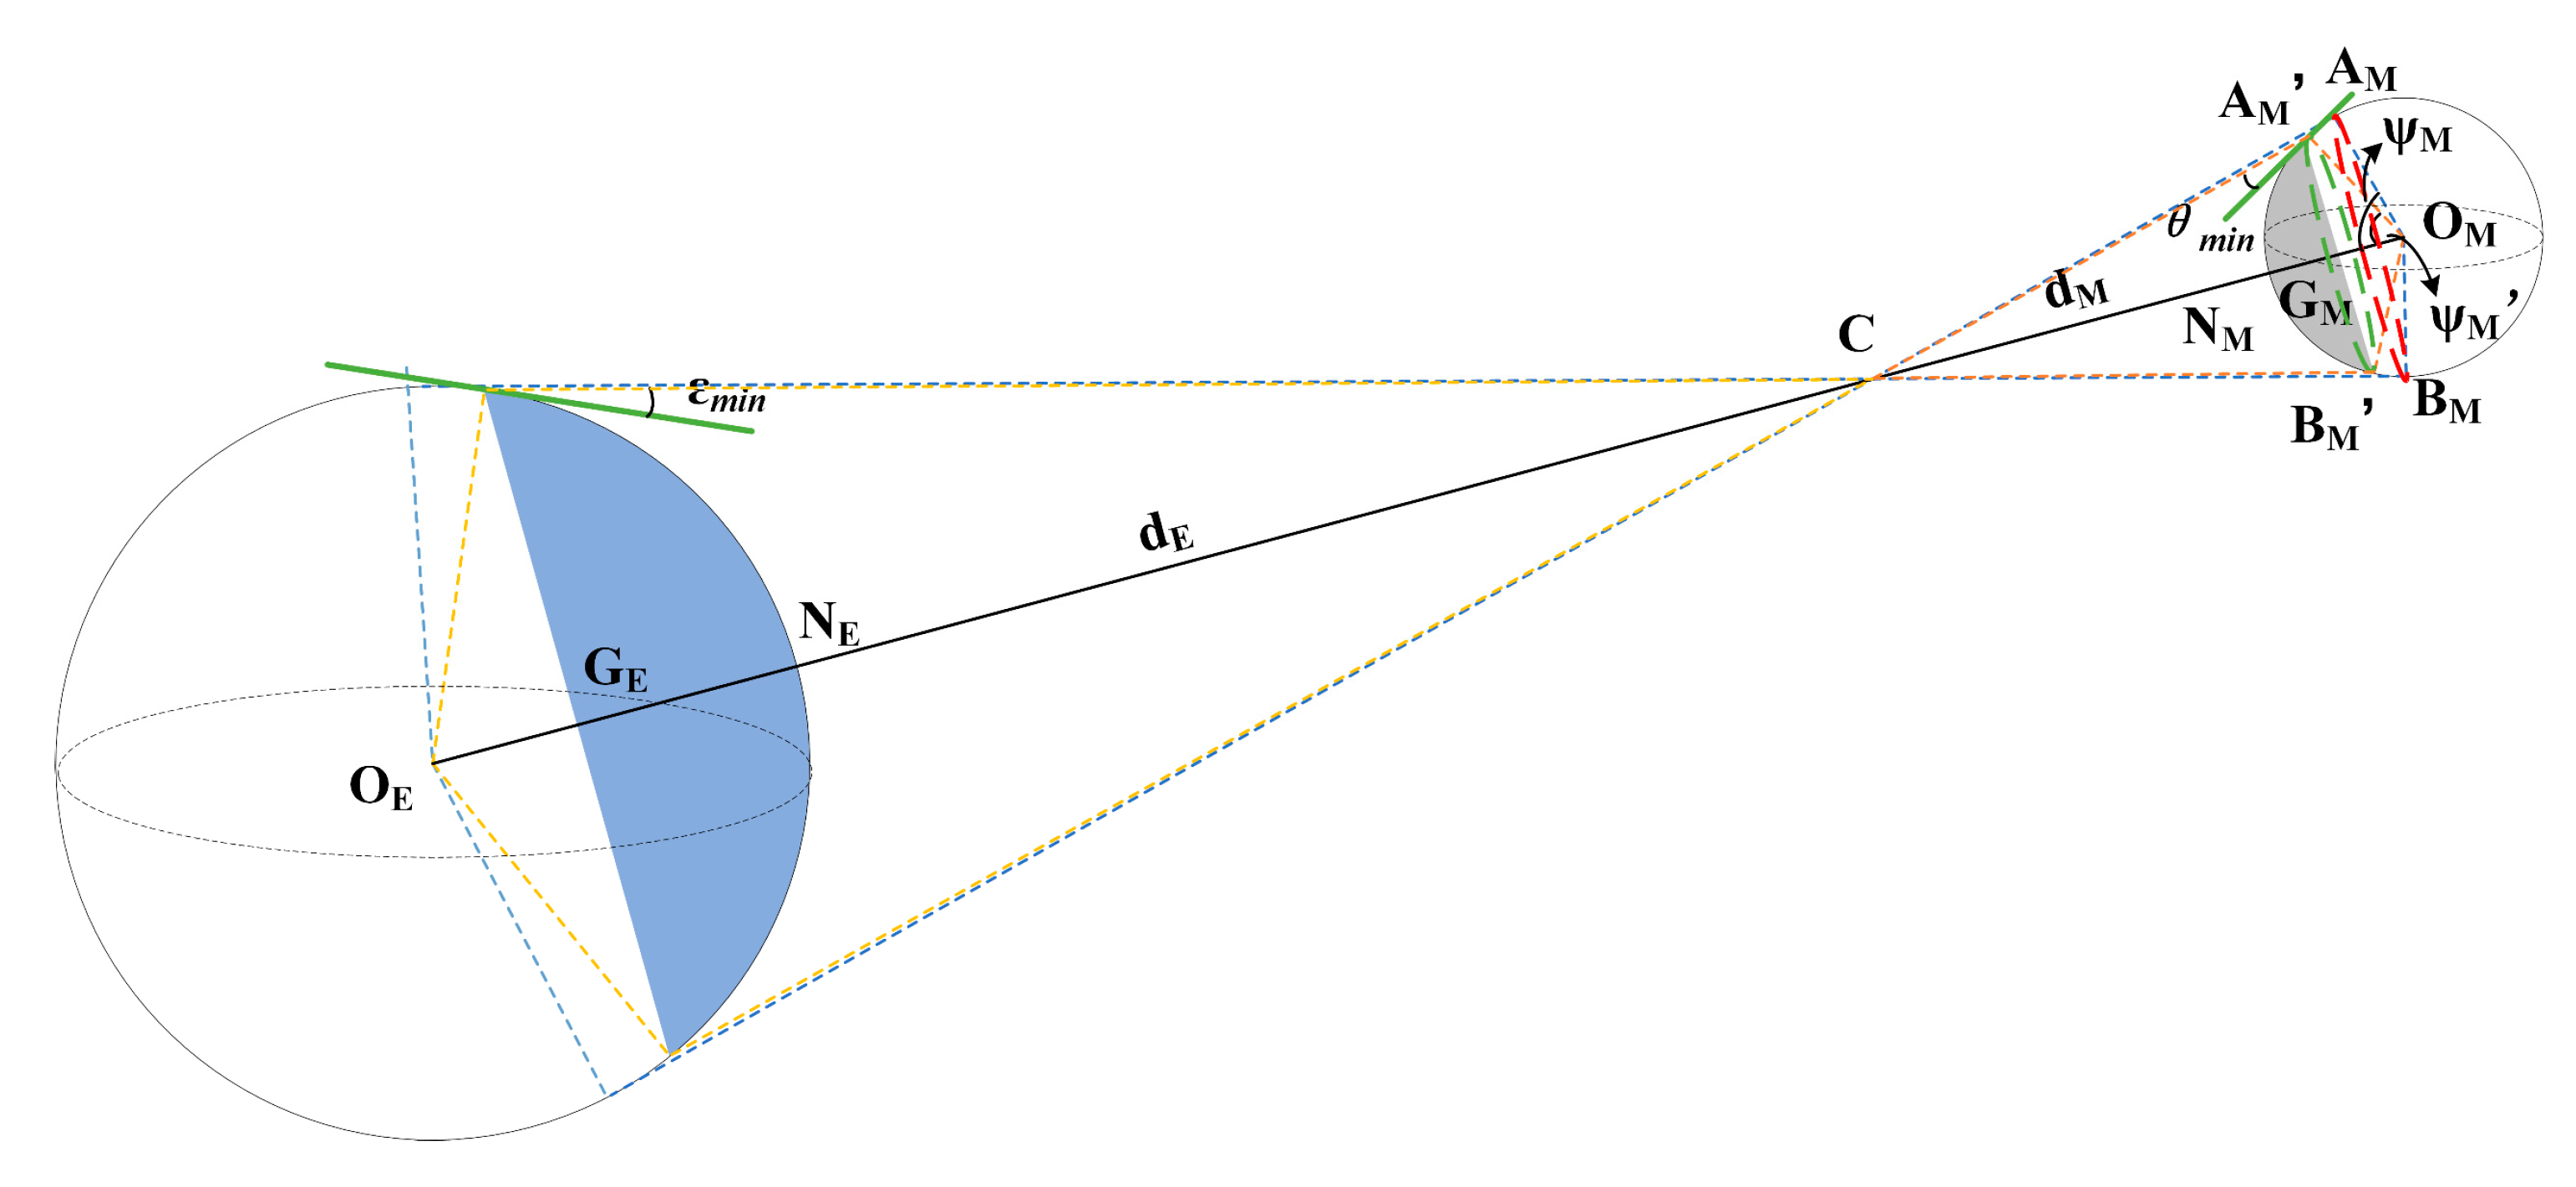
2.2. Determination of Intervisibility Conditions

Figure 3 represents the intervisibility geometry of a Moon-based platform and the observed points on the Earth. However, by contrast with the first geometry which focuses on the observation of one point on the Earth, it focuses on Earth hemisphere observation. When accounting for the minimum observation elevation angle, sensors which locates within the gray spherical cap A M N M B M can observe the hemisphere of the Earth; thus, we refer to this a lunar intervisible spherical cap. AM and BM are points where the tangent line begins at the sphere of the Earth and intersects the sphere of the Moon. Thus, in the ideal condition, the spherical crown A M N M B M is a suitable place to equip a Moon-based sensor. Because angle ψ M (the angle between line O M A M and line O M C ) is half of the corresponding solid angle for the lunar intervisible spherical cap, the following equation is tenable:
d E r E = d M r M = cos ψ M
where dE (dM) represents the distance between the barycenter of the Earth OE (Moon OM) and point C. In addition:
d E + d M = D
D is the barycenter separation distance. By substituting (10) into (9), thus leading to:
d M = r M D r M + r E
If we consider that the line-of-sight minimum observation elevation angle θmin on the lunar surface, which partly depends on the lunar terrain, is the prerequisite for the line-of-sight vector breaks through the limit of lunar local terrain, the lunar intervisible spherical cap is changed to A M N M B M , and ψM′ (angle between line   A M O M and line O M C ) can be calculated by:
r M sin [ π ψ M ( π / 2 + θ m i n ) ] = d M sin ( π / 2 + θ m i n )
Simplifying Equation (12), we can derive:
cos ( ψ M + θ min ) = ( r E + r M ) cos θ m i n D
Thus,
ψ M = arccos [ ( r E + r M ) cos θ m i n D ] θ m i n
The projection of the barycenter of the Earth on the lunar surface is assumed to be (xN, yN, zN), shown as point NM. Based on spatial geometrical relations, coordinates of point GM can be shown as ( cos ψ M x N ,   cos ψ M y N ,   cos ψ M z N ) . The plane that passes through point GM and is perpendicular to vector OITRS starts at OE and ends with OM, thus leading to,
x N ( x cos ψ M x N ) + y N ( y cos ψ M y N ) + z N ( z cos ψ M z N ) = 0
where (x, y, z) represent coordinates of a Moon-based platform. The nadir point NM meets the demand of the equation when ignoring the ellipticity of the Earth, as shown by:
x N 2 + y N 2 + z N 2 = r M 2
By substituting (16) into (15), we can derive that:
( x N x + y N y + z N z ) / r M 2 cos ψ M 0
By replacing (14) to (17), the final criterion can be written as:
( x N x + y N y + z N z ) / r M 2 - cos { arccos [ ( r E + r M ) cos θ m i n D ] θ m i n } 0
Thus, the hemisphere of the Earth can be seen by a Moon-based sensor when Equation (18) is satisfied.
The lunar intervisible spherical cap AM′NM′BM′ where a Moon-based sensor can observe the hemisphere of the Earth can be shown as:
S A M N M B M = 2 π r M H   = 2 π r M 2 { 1 cos { arccos [ ( r E + r M ) cos θ m i n D ] θ m i n } }
where H is the height of the spherical cap, representing the distance between points GM and NM in Figure 3. Through the derivation, we find that the lunar intervisible spherical cap area is related to the line-of-sight minimum observation elevation angle θmin and the barycenter separation distance D.
When the barycenter separation distance D continuously changes, the variation rate of the lunar intervisible spherical cap can be written as:
d S A M N M B M d D = 2 π r M 2 sin { arccos [ ( r E + r M ) cos θ m i n D ] θ m i n } { 1 D 2 1 [ ( r E + r M ) cos θ m i n D ] 2 }
Because of:
{ 0 < ψ M < 90 0 θ m i n 90 0 θ m i n + ψ M 90 D r E + r M
Therefore,
d S A M N M B M d D < 0
Similarly, in considering the derivative of the line-of-sight minimum observation elevation angle θmin with respect to the lunar intervisible spherical cap, thus leading to:
d S A M N M B M d θ min = 2 π r M 2 sin { arccos [ ( r E + r M ) cos θ m i n D ] θ m i n } { sin θ m i n 1 [ ( r E + r M ) cos θ m i n D ] 2 1 }
Because the sum of radii of the Earth and the Moon is much smaller than the barycenter separation distance, as the distance increases, the rate of lunar intervisible spherical cap size change becomes smaller.

3. Results and Discussion

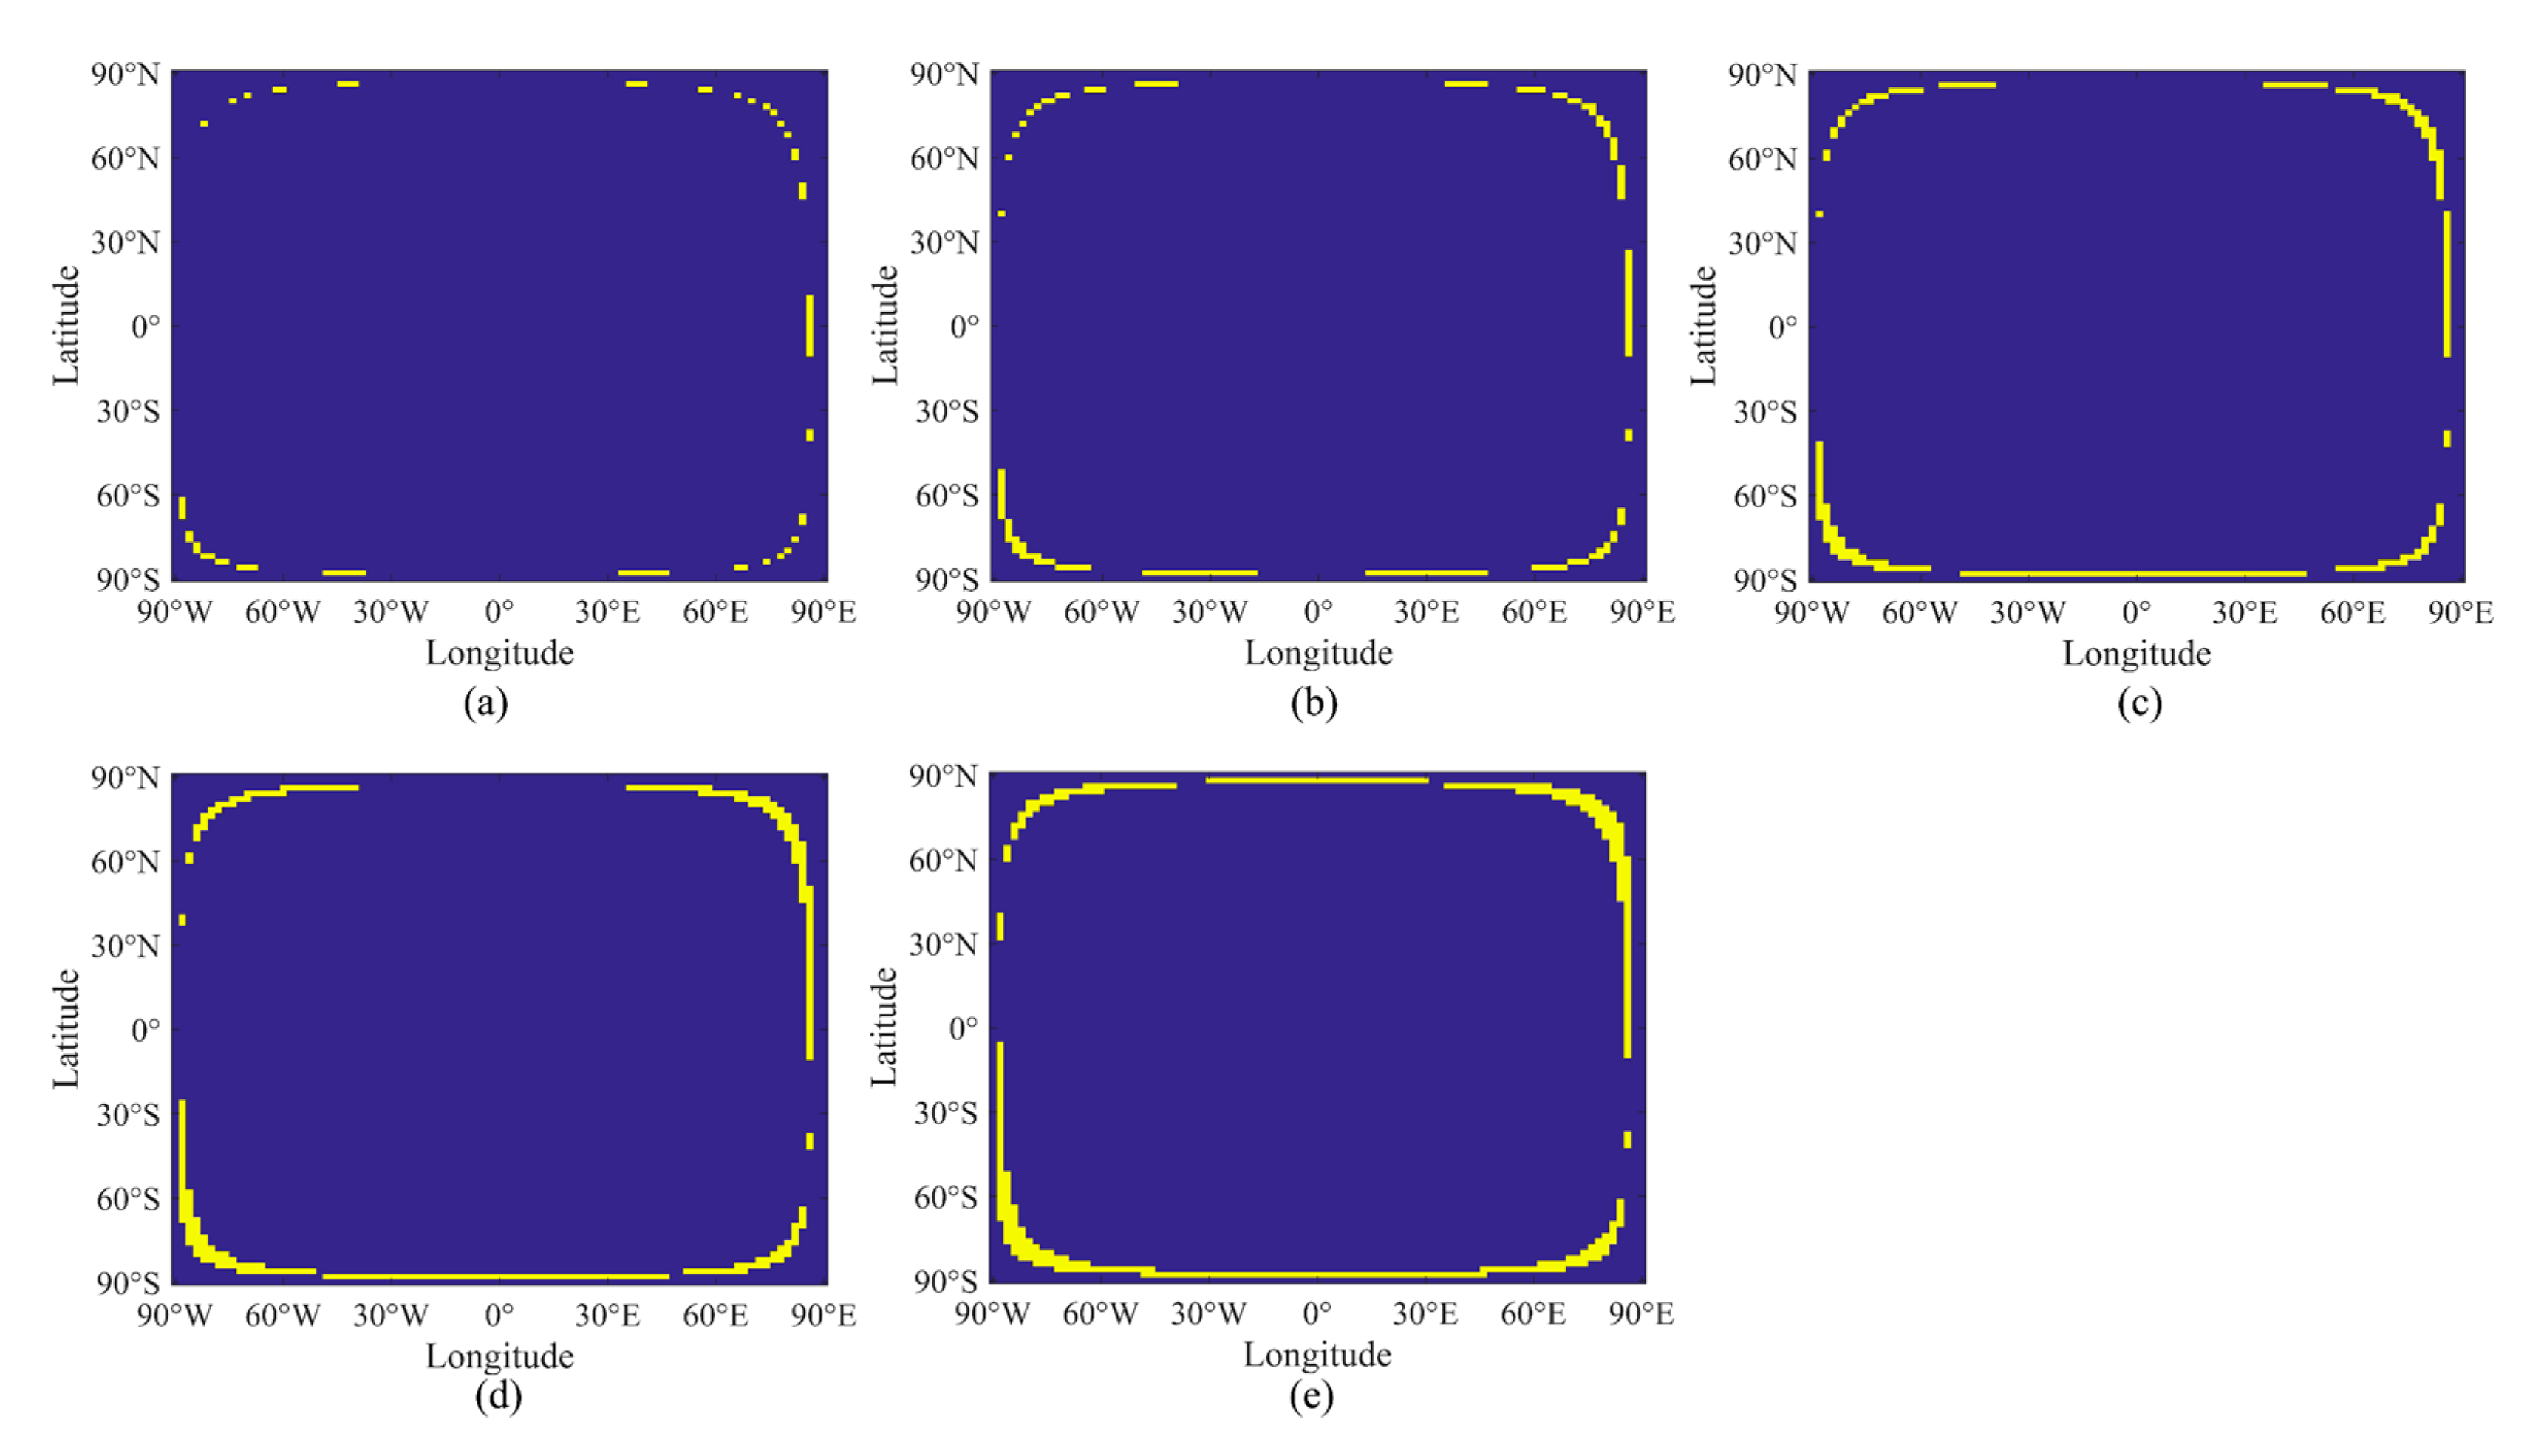
3.1. Spatio-Temporal Coverage Performance

To elucidate the global observation coverage of the Earth, we first assume a Moon-based sensor is located at the (0°, 0°) on the lunar surface to observe the Earth. Figure 4 is the global observation coverage at corresponding moments of the first two days in 2021. Thus, the observation scope is connected with the angle of the orbit of the Moon to the ecliptic and the obliquity of the ecliptic. Furthermore, the distributions of the observed area at the same moment from two different days appear alike. Thus, the Earth observation shows daily periodicity. To determine the regularity of the observation coverage, we calculate the variation of the Earth spherical cap with d and ε m i n , the three-dimensional curve line is shown in Figure 5. We choose the variation of dE in January 2021, and ε m i n is continuously changing from 0° to 40°. The largest Earth spherical cap can reach 2.51 × 10⁸ km2 and the smallest Earth spherical cap is approximately 8.8 × 10⁷ km2. Obviously, a 27-day cycle occurs that corresponds to the lunar orbit period. Notably, the valley and peak of the curve correspond to the perigee and the apogee of the lunar orbit. Thus, the Earth spherical cap is related to the Earth–Moon distance and the minimum observation elevation angle.
Figure 6 displays influences of Earth–Moon distance and minimum observation elevation angle on the Earth spherical cap. In the most ideal case, the minimum elevation angle can be equal to 0°. However, because it is affected by the terrain and surface features which cannot be ignored, the minimum elevation angle is non-zero values. We set this angle to be 10°, 20°, and 30°. Figure 6a shows with the increase of the Earth–Moon distance, the area of the Earth spherical cap is also increased because it is inversely proportional to the Earth–Moon distance. Additionally, the slope of the curve line is tiny and becomes smaller with the increase of the Earth–Moon distance. Figure 6b indicates that with an increase of the minimum observation elevation angles, the Earth spherical cap would decrease. Moreover, if the minimum observation elevation angle increases by the same size, the decrease of the Earth spherical cap would become less intense. The three lines show that the increase of the Earth spherical cap is more sensitive when the elevation angle is small. In general, the Earth spherical cap is relative to the Earth–Moon distance and the minimum observation elevation angle, and with the increase of the distance, the Earth spherical cap also increases. Conversely, with an increase of the minimum elevation angle, the cap decreases. However, the effects of the minimum elevation angle to the Earth spherical cap are much larger than the Earth–Moon distance, which cannot be ignored. The similarity is that with increases of these two factors, both rate changes of the Earth spherical cap will become slower.
Next, we quantify the normalized global observation duration at different years to demonstrate the Moon-based Earth observation characteristics, which is shown in Figure 7. From the six subfigures in Figure 7, the observation duration distributes with latitude. We also observe that there are two distinct lines whose range is nearly from 61° to 71°, which nearly match the Arctic circle and Antarctic circle. This is complementary to the angle between the Earth equatorial plane and the ecliptic plane, whose range is from 18.5° to 28.5°. Regions from the top line to 90°N are in the range of the north pole; similarly, regions between the bottom line to 90°S are in the scope of the south pole. The widths of two regions clearly change together when the difference in duration distribution becomes larger; for example, in Figure 7e, the widths of the two regions are smaller than those in Figure 7b, whose duration distribution is relatively average. Moreover, the widths of the two regions change with the maximum latitude of the nadir point in a year. For example, the widths of the two polar regions reach the minimum in 2035 when the maximum latitude of nadir point is smallest in the six years of the subfigures. The regions between two lines remain stable during the observation period. With an increase in observation duration in one polar region, the observation duration of another polar region decreases. Specifically, the observation durations of two polar regions are inversely proportional. This inversion is mainly a product of the geometric relationship between the Earth’s surface features, the Sun, and the Moon-based platform, and it is also in connection with the latitude of the nadir point. Moreover, the distribution of the observation duration appears opposite when the time interval is four years, as shown in Figure 7a,b,e,f. However, if the time interval is two years, the distribution is stable, as shown in Figure 7c,d. This is because the 18.6-year lunar nodal precession associated with the Earth–Moon system causes a systematic variation of the Moon’s orbit around the Earth.

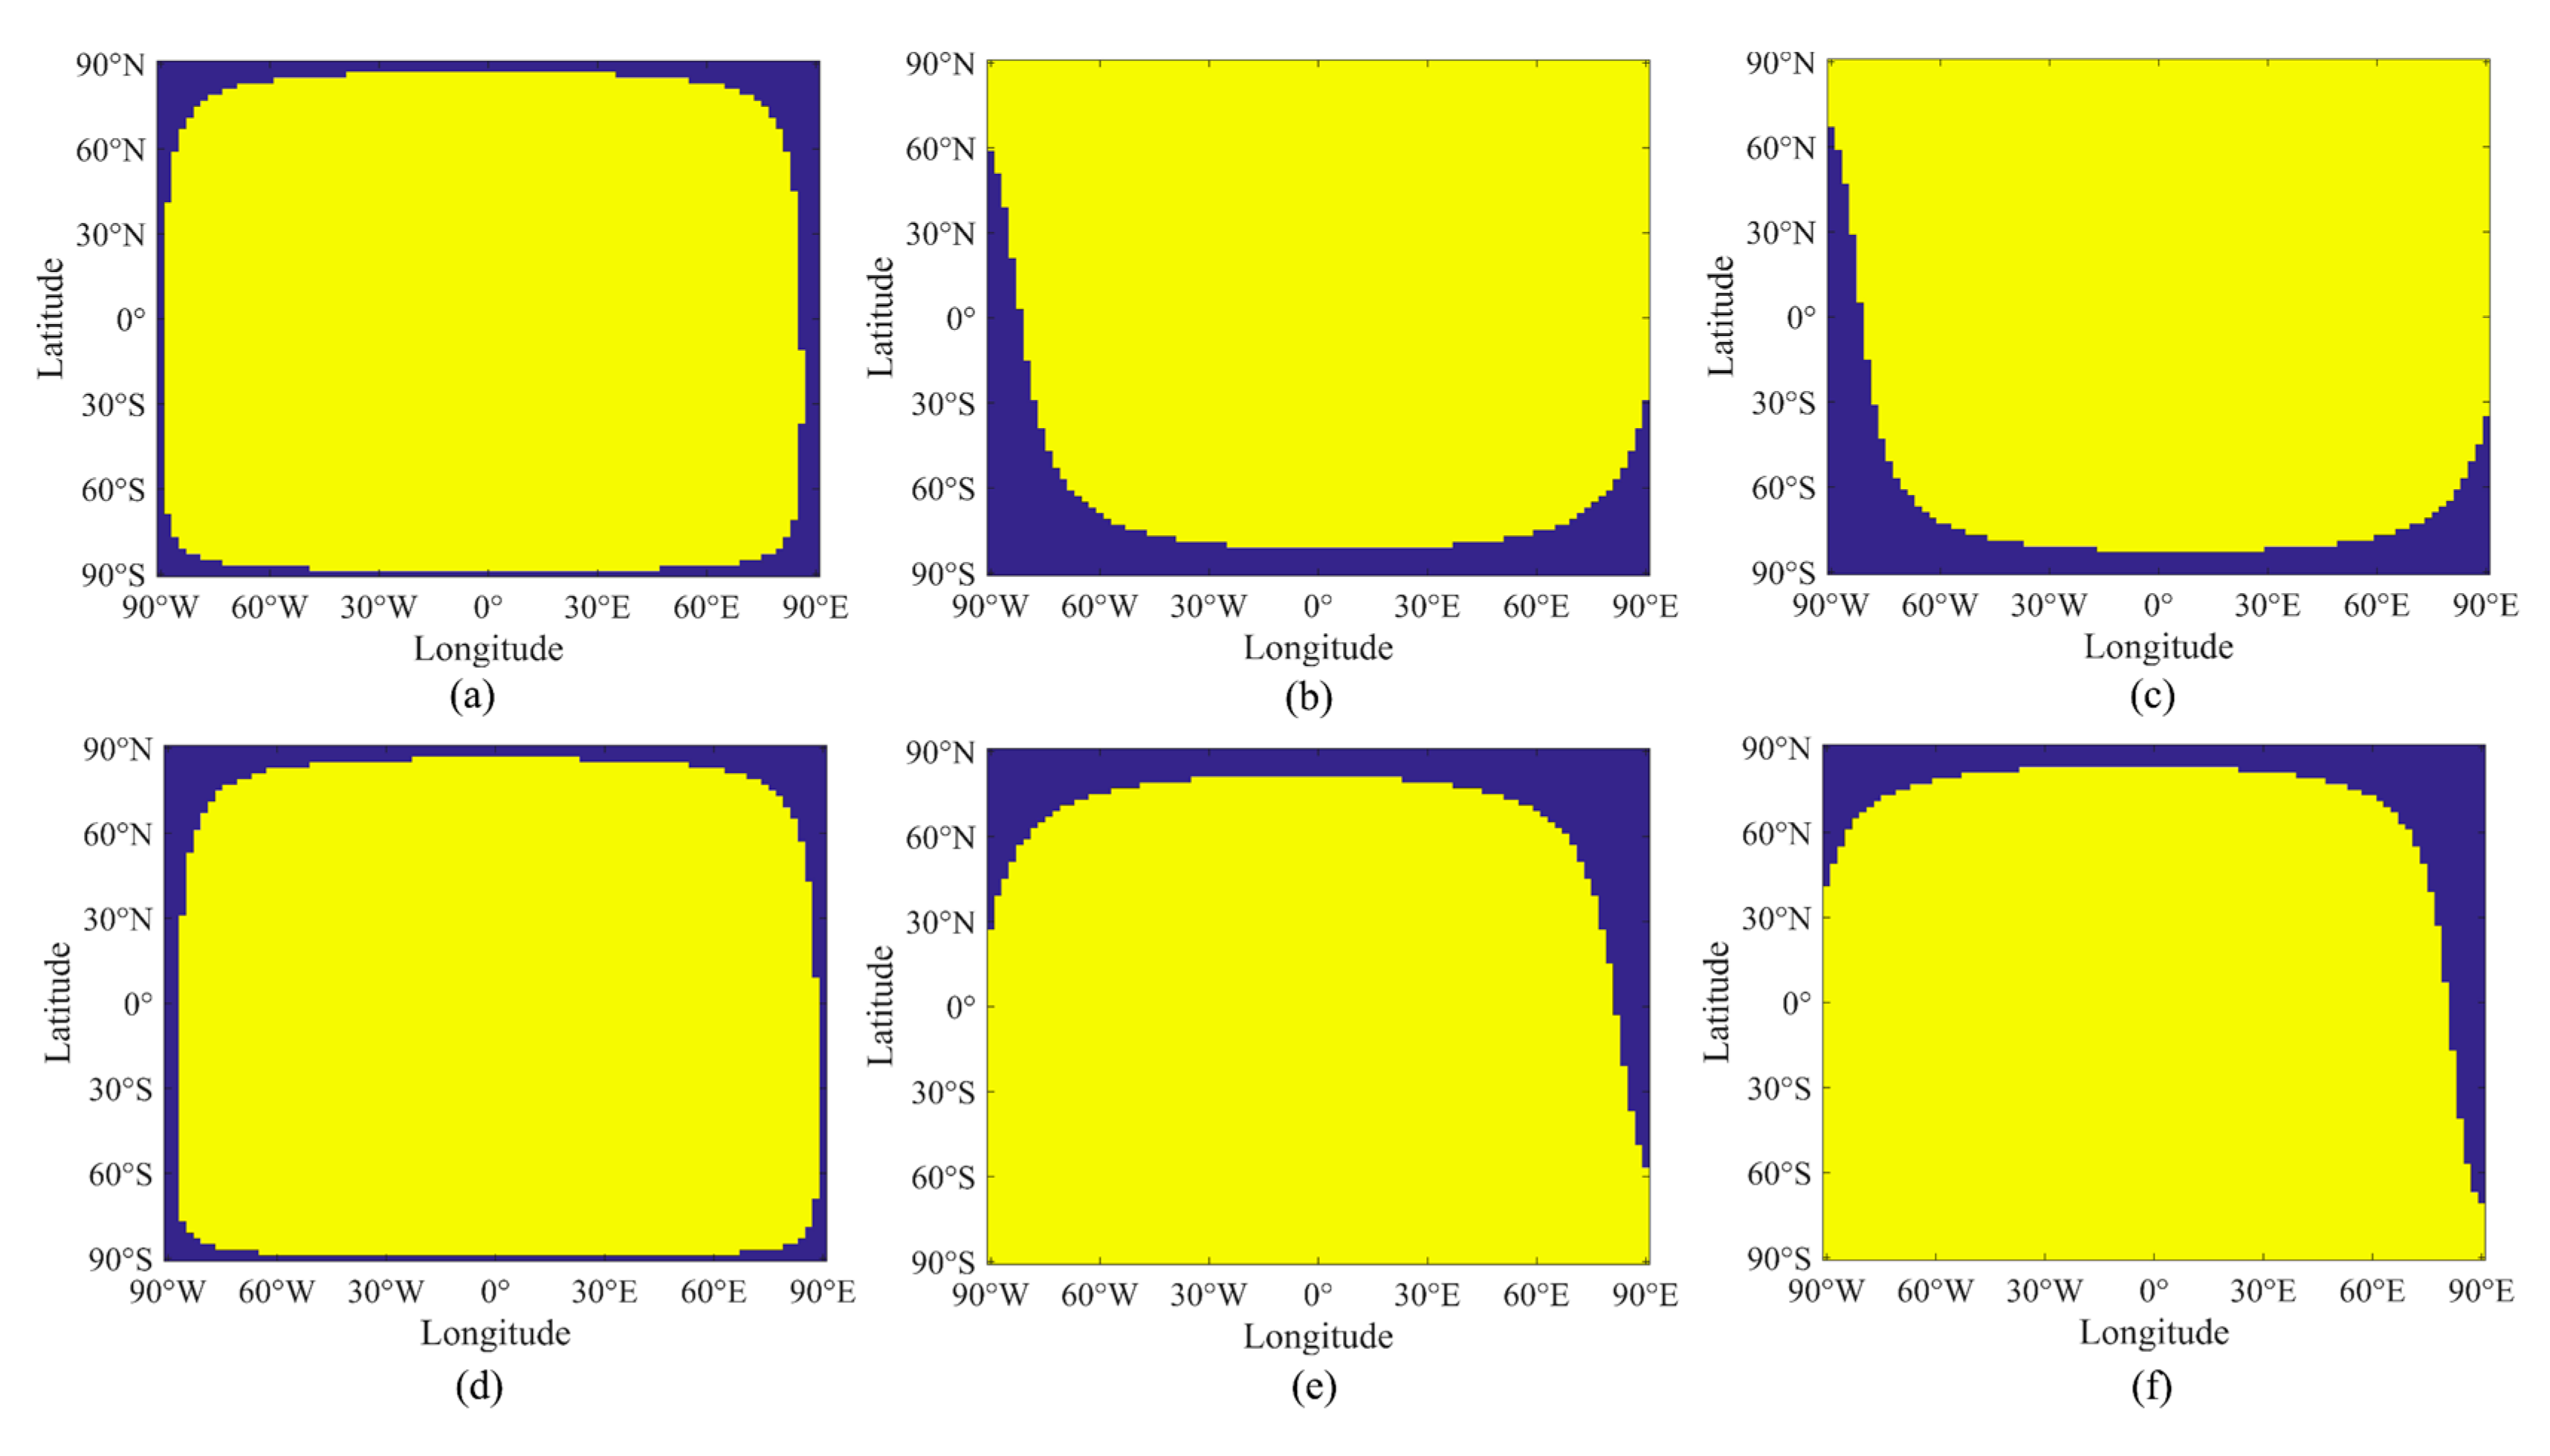
3.2. Spatio-Temporal Coverage Performance at Different Positions on the Lunar Surface

In this section, we first introduce the effects of barycenter separation distance and the line-of-sight minimum observation elevation angle of the lunar surface on the lunar intervisible spherical cap. Next, we assume that a Moon-based platform is equipped at different positions on the lunar surface to determine the observation performance from different positions on the Moon.
Figure 8 displays the influences of barycenter separation distance and the line-of-sight minimum observation elevation angle on the lunar intervisible spherical cap. As described in [33], in the full observation regions (longitude between 80°W–80°E and latitude between 80°S–80°N), which is less affected by lunar terrain, the line-of-sight minimum elevation angle should be larger than 20°. Thus, we choose the line-of-sight minimum observation elevation angle to be equal to 10°, 20°, and 30° to represent different conditions. With an increase of barycenter separation distance, the variation of the lunar intervisible spherical cap also increases, shown in Figure 8a. The maximum lunar intervisible spherical cap reaches nearly 45% of the lunar surface area. Figure 8b indicates that when the line-of-sight minimum elevation angle increases by the same amount, the lunar intervisible spherical cap decreases at a slower rate. Thus, the effects of line-of-sight minimum observation elevation angle to the lunar intervisible spherical cap are considerable. However, if the line-of-sight minimum observation elevation angle is constant, the lunar intervisible spherical cap area becomes larger when the Moon moves from the perigee to apogee.
Figure 9 shows the variations of intervisible spherical cap, starting at 00:00 UTC on 1 January 2010 and ending at 20:00 UTC on the same day at four-hour intervals. Figure 8a–d shows that the invisible area is mainly limited to the edge of the near side of the Moon, and every subfigure shows a few differences. To elucidate the coverage’s change in one day, the difference figures are shown in Figure 10. Over time, the invisible area that starts from the edge area gradually extends to the center of the Moon. However, the ratio of the areal change in one day is just 5% of the entire lunar surface, which can be considered negligible. In summary, if a Moon-based sensor is located at a place where it can observe the Earth even when at the edge of the Moon, the sensor is likely to observe Earth in one day.
Therefore, the variations of intervisible spherical cap for one month are calculated as shown in Figure 11. The time interval between adjacent subfigures is five days. Compared with Figure 9, the daily variation is much more distinct, and can be regarded as the movement of the nadir point that first moves northward; half a month later, the nadir point comes back to the lunar equator then moves southward. Therefore, the invisible area becomes larger in the south but disappears in the north on the sixth day. This condition is opposite to that of the 21st day. In detail, the area of lunar intervisible spherical cap is related to the barycenter separation distance, and whether or not the area can be observed on the Earth is relative to the angle between the equatorial plane of the Moon and the line between barycenter of the Earth and the Moon. The result is the foundation for considering lunar polar regions as the Moon-based platform’s site. Because Earth polar regions exist permanent illumination region and permanent shadowed area. As for the permanent illumination region, it will be helpful for the energy supplement. For the permanent shadowed area, on the one hand, there may exist ice or water, which is the primary condition for site selection. On the other hand, we do not need to consider the potential damage caused by solar invasion to a Moon-based sensor. Thus, this result can provide the accurate visible time for Earth observations at the lunar edge and the range of lunar visible area, and they are related to Earth–Moon distance and the latitude of the projection of the barycenter of the Earth on the lunar surface, and influenced greatly by the lunar orbital period.
In this study, based on the characteristics of the Moon-based Earth observation, we built an intervisibility geometry model that, on one hand, can be used to evaluate whether the hemisphere of the Earth can be seen from a certain position on the lunar surface. On the other hand, the area of the lunar intervisible spherical cap is expressed by an analytical expression that is in connection with the line-of-sight minimum observation elevation angle and the barycenter separation distance. From the variation of the barycenter separation distance, we found a suitable time to observe the Earth because the lunar intervisible spherical cap reached the maximum.
In our work, based on an intervisiblility geometry model, an analytical formula of the lunar intervisible spherical cap that can observe the hemisphere of the Earth was derived. The lunar intervisible spherical cap is related to the line-of-sight minimum observation elevation angle and the barycenter separation distance, and the results show that the effects of the line-of-sight minimum observation elevation angle to the lunar intervisible spherical cap are considerable. This contrasts with Ren et al. [20] and Ye et al. [21], whose geometry models do not consider the effects of minimum elevation angle to the spatial coverage, and the positions of their Moon-based sensor satisfy the condition of observing one point on the Earth rather than the entire hemisphere of the Earth. In addition, Wang et al. [34] and Sui et al. [35] also discusses the observation characteristics of a Moon-based platform, but they concentrate on the polar regions and Moon-based sensors located in certain places; thus, the two distinct lines as shown in Figure 7 are not found in their study. Our work focuses on Earth hemispheric observations, including polar regions, and sensors anywhere on the lunar intervisible spherical cap can achieve hemispheric observations. Ye et al. [22] expresses regions on the lunar surface where can achieve hemisphere’s observation by fixed latitude and longitude, which is not accurate because the area of intervisible spherical cap is related to the distance between the barycenter of the Earth and the barycenter of the Moon.
In recent years, Europe has been planning to build a lunar research station, as has China [36]. Meanwhile, the United States is preparing for future lunar exploration. The spatio-temporal characteristics are the primary condition for Earth observations. Our work can provide additional insights into spatio-temporal characteristics of a Moon-based platform. Additionally, it can determine the change of area on the Moon where the whole hemisphere of the Earth can be observed, which can provide support for calculating the accurate time for a Moon-based Earth hemispheric observation.

4. Conclusions

Based on the unique observation geometry of a Moon-based platform and according to the intervisibility geometry model, we derived an analytical formula for the lunar intervisible spherical cap to determine suitable places where sensors can be equipped to observe the hemisphere of the Earth, which can thus increase awareness of the spatio-temporal characteristics of a Moon-based platform. The Earth observations show daily periodicity and a 27-day cycle that corresponds to the lunar orbit period that also occurs. For the average global observation duration, two distinct lines occur within the ranges of 61°N to 71°N and 61°S to 71°S. Regions between the top line and 90°N or between the bottom line and 90°S change with the latitude of the nadir point; when the maximum latitude of the nadir point increases, the widths of the two regions become larger. However, the observation durations of regions between two lines are in accordance. The lunar intervisible spherical cap on the lunar surface varies with the line-of-sight minimum elevation angle as well as the barycenter separation distance. With an increase of the line-of-sight minimum elevation angle, the lunar intervisible spherical cap decreased, although the opposite effect was observed for barycenter separation distance. If a Moon-based sensor is located at a place where it can observe the Earth’s hemisphere, it is likely to observe the hemisphere within one day, and its small period is also approximately 27 days. From the perspective of the area of the lunar intervisible spherical cap, our study can provide guidance in calculations of accurate time for Earth hemispheric observations from a Moon-based platform.

Author Contributions

Conceptualization, J.H., H.G., G.L. and G.S.; methodology, J.H., G.L. and H.Y.; validation, J.H., Y.D. and R.D.; writing—original draft preparation, J.H., H.Y. and R.D.; writing—review and editing, J.H., H.G., G.L., G.S., H.Y., Y.D. and R.D.; visualization, J.H. All authors have read and agreed to the published version of the manuscript.

Funding

This research was funded by National Natural Science Foundation of China, grant number 41590852. The Key Research Program of Frontier Sciences, CAS, grant number QYZDY-SSW-DQC026. And the National Key Research and Development Program of China, grant number 2020YFE0202100.

Conflicts of Interest

The authors declare no conflict of interest.

Abbreviations

Global Climate Observing SystemGCOS
Global Ocean Observing SystemGOOS
Global Ocean Observing SystemGTOS
European Space AgencyESA
Long-Term Data PreservationLTDP
Deep Space Climate ObservatoryDSCOVR
synthetic aperture radarSAR
Symposium on Space Earth ScienceSESS
China Space Science AssemblyCSSA
International Terrestrial Reference SystemITRS
Geocentric Celestial Reference SystemGCRS
International Celestial Reference SystemICRS
Selenographic coordinate systemSCS
Moon-centered Moon-fixed coordinate systemMCMF
Mean Earth ME
Lunar reference systemLRS
Principal Axis PA
Earth Orientation ParametersEOP
Development EphemerisDE
Jet Propulsion LaboratoryJPL

Appendix A

Detailed calculation of the percentage of loss of lit area viewed from a Moon-based platform and DSCOVR are expressed below.
Figure A1 shows the observed lit spherical cap from a Moon-based platform and DSCOVR. It is not drawn to scale. Because considering the Earth as ellipsoid or not has negligible effects of the visible area, thus, these calculations are in the situation that considers the Earth as a spheroid model.
Figure A1. The lit area viewed from a Moon-based platform and Deep Space Climate Observatory (DSCOVR).
Remotesensing 12 02848 g0a1
Assuming the radius of the Earth is rE and the distance between a Moon-based platform (DSCOVR) and the nadir point on the Earth is d, thus, the gray or the green spherical cap can be shown as:
S = 2 π r r E d r E + d
Thus, the ratio between the observed lit spherical cap and the lit hemisphere can be calculated as:
A = S 2 π r E 2 = d r E + d
For a Moon-based platform, it is assumed the distance d is equal to 380,000 km. For DSCOVR, it is assumed the distance d is equal to 1,500,000 km. The radius of the Earth is 6371 km. Thus, the percentages of loss of area are shown as:
L M = 1 A M = 1 0 . 9835 = 0 . 0165 L D = 1 A D = 1 0.9958 = 0.0042
where LM means percentage of loss of area viewed from a Moon-based platform and LD means percentage of loss of area viewed from DSCOVR. It is worth noting that all the calculations are in the assumption that a Moon-based platform can observe the full lit Earth. In the situation that a Moon-based platform cannot observe the full lit Earth, the percentage of loss of area viewed from a Moon-based platform is larger than 0.0165. In general, the minimal percentage of loss of area viewed from a Moon-based platform is 0.0165 and the percentage of loss of area viewed from a Moon-based platform is about 0.0042.

References

  1. Karl, T.; Bretherton, F.; Easterling, W.; Miller, C.; Trenberth, K. Long-Term Climate Monitoring by the Global Climate Observing System (GCOS). Clim. Chang. 1995, 31, 135–147. [Google Scholar] [CrossRef]
  2. Woods, J. The global ocean observing system. Mar. Policy 1994, 18, 445–452. [Google Scholar] [CrossRef]
  3. Heal, O.W.; Menaut, J.C.; Steffen, W.L. Towards a Global Terrestrial Observing System, (GTOS); Detecting and Monitoring Change in Terrestrial Ecosystems; ASME Press: Montpellier, France, 1993. [Google Scholar]
  4. Houghton, J.; Townshend, J.; Dawson, K.; Mason, P.; Zillman, J.; Simmons, A. The GCOS at 20 years: The origin, achievement and future development of the Global Climate Observing System. Weather 2012, 67, 227–235. [Google Scholar] [CrossRef]
  5. Molch, K.; Leone, R.; Albani, M.; Mikusch, E. User needs and requirements impacting the long term preservation of earth observation data. In Proceedings of the IEEE International Geoscience & Remote Sensing Symposium, Munich, Germany, 22–27 July 2012. [Google Scholar]
  6. Guo, H.; Liu, G.; Ding, Y. Moon-based Earth observation: Scientific concept and potential applications. Int. J. Digit. Earth 2018, 11, 546–557. [Google Scholar] [CrossRef]
  7. Gore, A. Deep Space Climate Observatory; National Aeronautics and Space Administration: Washington, DC, USA, 2015. [Google Scholar]
  8. Vogler, L.E. A Study of Lunar Surface Radio Communication; Technical Report Archive & Image Library, United States Government Printing Office: Washington, DC, USA, 1964.
  9. Sawyer, R.S. New Apollo Lunar Communications. In Proceedings of the Space and Communication-Acquisition and Transmission of Data in Space Applications Systems International Conference, Paris, France, 6 August 2013. [Google Scholar]
  10. Hwu, S.; Matthew, U.; Sham, C. Lunar Surface Propagation Modeling and Effects on Communications. In Proceedings of the 26th International Communications Satellite Systems Conference (ICSSC), San Diego, CA, USA, 10–12 June 2008. [Google Scholar]
  11. Foing, B.H. The Moon as a platform for astronomy and space science. Adv. Space Res. 1996, 18, 17–23. [Google Scholar] [CrossRef]
  12. Guo, H.D.; Fu, W.; Li, X.; Chen, P.; Liu, G.; Li, Z.; Wang, C.; Dong, Q.; Lei, L.; Bai, L.; et al. Research on global change scientific satellites. Sci. China Earth Sci. 2013, 57, 204–215. [Google Scholar] [CrossRef]
  13. Guo, H. Earth system observation from space: From scientific satellite to Moonbased platform. J. Remote Sens. 2016, 20, 716–723. [Google Scholar]
  14. Ye, H.; Guo, H.; Liu, G.; Ping, J.; Guo, Q. Impacts of Platform’s Position Errors on Geolocation for a Moon-Based Sensor. IEEE Geosci. Remote Sens. Lett. 2020, 17, 112–116. [Google Scholar] [CrossRef]
  15. Moccia, A.; Renga, A. Synthetic Aperture Radar for Earth Observation from a Lunar Base: Performance and Potential Applications. IEEE Trans. Aerosp. Electron. Syst. 2010, 46, 1034–1051. [Google Scholar] [CrossRef]
  16. Xu, Z.; Chen, K.-S. On Signal Modeling of Moon-Based Synthetic Aperture Radar (SAR) Imaging of Earth. Remote Sens. 2018, 10, 486. [Google Scholar] [CrossRef] [Green Version]
  17. Xu, Z.; Chen, K.-S. Temporal-Spatial Varying Background Ionospheric Effects on the Moon-Based Synthetic Aperture Radar Imaging: A Theoretical Analysis. IEEE Access 2018, 6, 66767–66786. [Google Scholar] [CrossRef]
  18. Xu, Z.; Chen, K.-S. Effects of the Earth’s Curvature and Lunar Revolution on the Imaging Performance of the Moon-Based Synthetic Aperture Radar. IEEE Trans. Geosci. Remote Sens. 2019, 57, 5868–5882. [Google Scholar] [CrossRef]
  19. Song, Y.; Wang, X.; Bi, S.; Wu, J.; Huang, S. Effects of solar radiation, terrestrial radiation and lunar interior heat flow on surface temperature at the nearside of the Moon: Based on numerical calculation and data analysis. Adv. Space Res. 2017, 60, 938–947. [Google Scholar] [CrossRef]
  20. Ren, Y.; Guo, H.; Liu, G.; Ye, H. Simulation Study of Geometric Characteristics and Coverage for Moon-Based Earth Observation in the Electro-Optical Region. IEEE J. Sel. Top. Appl. Earth Obs. Remote Sens. 2017, 10, 2431–2440. [Google Scholar] [CrossRef]
  21. Ye, H.; Guo, H.; Liu, G.; Ren, Y. Observation scope and spatial coverage analysis for earth observation from a Moon-based platform. Int. J. Remote Sens. 2017, 39, 5809–5833. [Google Scholar] [CrossRef]
  22. Ye, H.; Huadong, G.; Guang, L.; Yuanzhen, R. Observation duration analysis for Earth surface features from a Moon-based platform. Adv. Space Res. 2018, 62, 274–287. [Google Scholar] [CrossRef]
  23. Petit, G.; Brian, L. IERS Conventions (2010); Bureau International des Poids et Mesures Sevres: Parc de Saint-Cloud, France, 2010; pp. 1–179. [Google Scholar]
  24. Jin, W.; Xia, Y.; Tang, Z.; Wang, S. International Celestial Reference System. Prog. Astron. 1999, 17, 281–291. [Google Scholar]
  25. Seidelmann, P.K.; Archinal, B.A.; A’hearn, M.F.; Conrad, A.; Consolmagno, G.J.; Hestroffer, D.; Hilton, J.L.; Krasinsky, G.A.; Neumann, G.; Oberst, J. Report of the IAU/IAG Working Group on cartographic coordinates and rotational elements: 2006. Celest. Mech. Dyn. Astron. 2007, 98, 155–180. [Google Scholar] [CrossRef] [Green Version]
  26. GSFC. A Standardized Lunar Coordinate System for the Lunar Reconnaissance Orbiter; Goddard Space Flight Center: Greenbelt, MD, USA, 2008; p. 4. [Google Scholar]
  27. Lieske, J.H. Precession matrix based on IAU/1976/system of astronomical constants. Astron. Astrophys. 1979, 73, 282–284. [Google Scholar]
  28. Folgueira, M.; Souchay, J. Free polar motion of a triaxial and elastic body in Hamiltonian formalism: Application to the Earth and Mars. Astron. Astrophys. 2005, 432, 1101–1113. [Google Scholar] [CrossRef] [Green Version]
  29. Weratschnig, J.M.; Taylor, D.B.; Bell, S.A.; Hilton, J.L.; Sinclair, A.T. Computation of the quantities describing Lunar librations in the Astronomical Almanac. In Proceedings of the Journées 2010 “Systèmes de référence spatio-temporels” (JSR2010): New challenges for reference systems and numerical standards in astronomy, Paris, France, 20–22 September 2010. [Google Scholar]
  30. Folkner, W.M.; Williams, J.G.; Boggs, D.H.; Park, R.S.; Kuchynka, P. The Planetary and Lunar Ephemerides DE430 and DE431. Interplanet. Netw. Prog. Rep. 2014, 196, 1–81. [Google Scholar]
  31. Müller, J.; Biskupek, L.; Oberst, J.; Schreiber, U. Contribution of lunar laser ranging to realise geodetic reference systems. Int. Assoc. Geod. Symp. 2009, 134, 55–59. [Google Scholar] [CrossRef]
  32. Capitaine, N. Definition and realization of the celestial intermediate reference system. Proc. Int. Astron. Union 2008, 248, 367–373. [Google Scholar] [CrossRef] [Green Version]
  33. Ye, H. Looking Vector Direction Analysis for the Moon-Based Earth Observation Optical Sensor. IEEE J. Sel. Top. Appl. Earth Obs. Remote Sens. 2018, 11, 4488–4499. [Google Scholar] [CrossRef]
  34. Wang, H.; Guo, Q.; Li, A.; Liu, G.; Guo, H.; Huang, J. Comparative study on the observation duration of the two-polar regions of the Earth from four specific sites on the Moon. Int. J. Remote Sens. 2020, 41, 339–352. [Google Scholar] [CrossRef]
  35. Sui, Y.; Guo, H.; Liu, G.; Ren, Y. Analysis of Long-Term Moon-Based Observation Characteristics for Arctic and Antarctic. Remote Sens. 2019, 11, 2805. [Google Scholar] [CrossRef] [Green Version]
  36. Li, C.; Wang, C.; Wei, Y.; Lin, Y. China’s present and future lunar exploration program. Science 2019, 365, 238–239. [Google Scholar] [CrossRef]
Figure 1. Geometric relationship between the Earth’s surface features and a Moon-based platform. Not drawn to scale.
Remotesensing 12 02848 g001
Figure 2. Earth spherical cap observed from a Moon-based sensor.
Remotesensing 12 02848 g002
Figure 3. Intervisibility geometry of the Moon and the Earth.
Remotesensing 12 02848 g003
Figure 4. Global observation coverage from (0°,0°) on the lunar surface at (a) 00:00; (b) 08:00; (c) 16:00 UTC on 1 January; (d) 00:00; (e) 08:00; (f) 16:00 UTC on 2 January 2021. The light part means that these regions are visible for a Moon-based sensor, which changes with the positions of nadir point; the dark part represents the opposite.
Remotesensing 12 02848 g004
Figure 5. Dependence of the Earth spherical cap area on the Earth–Moon distance and minimum Earth observation elevation angle.
Remotesensing 12 02848 g005
Figure 6. Influences of Earth–Moon distance on the Earth spherical cap (a) minimum Earth observation elevation angle is 10°, (b) minimum Earth observation elevation angle is 10°, 20°, 30°.
Remotesensing 12 02848 g006
Figure 7. Global observation duration distribution from (0°,0°) on the lunar surface during (a) 2021, (b)2025, (c) 2029, (d) 2031, (e) 2035, and (f) 2039.
Remotesensing 12 02848 g007
Figure 8. Influences of barycenter separation distance on the lunar intervisible spherical cap (a) line-of-sight minimum observation elevation angle is 10°, (b) line-of-sight minimum observation elevation angle is 10°, 20°, 30°.
Remotesensing 12 02848 g008
Figure 9. The area on the Moon where sensor equipped on can observe hemisphere of the Earth at (a) 00:00, (b) 04:00, (c) 08:00, (d) 12:00, (e) 16:00, and (f) 20:00 UTC on 1 January 2010. The blue part indicates a Moon-based platform at a position on the lunar surface where the Earth’s hemisphere cannot be observed. Conversely, the yellow part means that the Earth’s hemisphere is visible.
Remotesensing 12 02848 g009
Figure 10. Area differences on the Moon between (a) 00:00 and 04:00, (b) 00:00 and 08:00, (c) 00:00 and 12:00, (d) 00:00 and 16:00, and (e) 00:00 and 20:00 UTC on 1 January 2010.
Remotesensing 12 02848 g010
Figure 11. The area on the Moon where sensor equipped on can observe hemisphere of the Earth at 00:00 UTC on (a) 1, (b) 6, (c) 11, (d) 16, (e) 21, and (f) 26 January 2010.
Remotesensing 12 02848 g011

