Article

Comparison of GPM IMERG and TRMM 3B43 Products over Cyprus

by
Adrianos Retalis
1,*,
Dimitris Katsanos
1,
Filippos Tymvios
2,3 and
Silas Michaelides
3
1
Institute for Environmental Research & Sustainable Development, National Observatory of Athens, GR15236 Athens, Greece
2
Department of Meteorology, 1086 Nicosia, Cyprus
3
Climate and Atmosphere Research Center (CARE-C), The Cyprus Institute, 2121 Aglantzia, Cyprus
*
Author to whom correspondence should be addressed.
Remote Sens. 2020, 12(19), 3212; https://doi.org/10.3390/rs12193212
Submission received: 27 August 2020 / Revised: 26 September 2020 / Accepted: 29 September 2020 / Published: 1 October 2020
(This article belongs to the Special Issue Remote Sensing of Precipitation: Part II)

Abstract

:
Global Precipitation Measurement (GPM) Integrated Multi-satellitE Retrievals for GPM (IMERG) high-resolution product and Tropical Rainfall Measuring Mission (TRMM) 3B43 product are validated against rain gauges over the island of Cyprus for the period from April 2014 to June 2018. The comparison performed is twofold: firstly, the Satellite Precipitation (SP) estimates are compared with the gauge stations’ records on a monthly basis and, secondly, on an annual basis. The validation is based on ground data from a dense and well-maintained network of rain gauges, available in high temporal (hourly) resolution. The results show high correlation coefficient values, on average reaching 0.92 and 0.91 for monthly 3B43 and IMERG estimates, respectively, although both IMERG and TRMM tend to underestimate precipitation (Bias values of −1.6 and −3.0, respectively), especially during the rainy season. On an annual basis, both SP estimates are underestimating precipitation, although IMERG estimates records (R = 0.82) are slightly closer to that of the corresponding gauge station records than those of 3B43 (R = 0.81). Finally, the influence of elevation of both SP estimates was considered by grouping rain gauge stations in three categories, with respect to their elevation. Results indicated that both SP estimates underestimate precipitation with increasing elevation and overestimate it at lower elevations.

Graphical Abstract

1. Introduction

Satellite observations have been widely used during recent decades for several meteorological, hydrological and climatological applications incorporating precipitation data worldwide [1,2,3,4,5,6]. In order to fill in where ground observations are absent or sparse, satellite estimations have been evolving using sophisticated algorithms that can identify rainfall, snow and/or other hydrometeors [7,8,9,10,11]. However, although Satellite Precipitation (SP) products are able to, overall, capture the variability and magnitude of rainfall, still they cannot accurately estimate the localized rainfall variations. Thus, validation of satellite precipitation products is often needed against ground-based measurements.
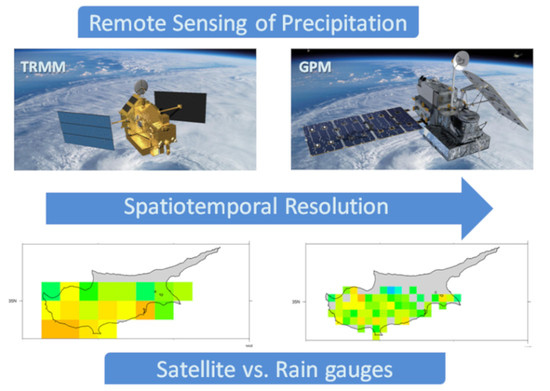
The Tropical Rainfall Measuring Mission (TRMM) platform placed in orbit during the 1997–2015 period, provided reliable data of high spatial (≈25 km) and temporal resolution (3 h), at a geographical coverage between 50°N and 50°S [12,13,14,15,16,17]. TRMM’s successor, namely, the Global Precipitation Mission (GPM) has been in orbit since 2014, giving estimates at even higher resolutions (≈10 km; 30 min) and geographical coverage from 60°S to 60°N, making it available for a variety of applications, including the assimilation of GPM data in numerical weather prediction models to improve model forecasting skill [15,16], the monitoring of severe weather events [13,15,16,17], hydrological hazards [18,19], etc.
Several studies attempted to demonstrate the accuracy of TRMM and GPM IMERG (Integrated Multi-satellitE Retrievals) estimates in various geographical areas. In their study over mainland China, Wu et al. [20] found that both SP products overestimate light rainfall. This is attributed to the fact that hydrometeors detected by infrared and microwave sensors as well as precipitation radars may partially or even totally evaporate before they are registered by the rain gauges. Furthermore, these authors found an underestimation of moderate and heavy rainfall by both products. A slightly better performance by GPM-IMERG, according to these authors, is attributed to the satellite overpasses and sensor capabilities.
In a similar study over Pakistan, Anjum et al. [21] found a slight dominance of IMERG; however, both products correlate well with the in situ measurements at a monthly scale, adequately following the temporal pattern. Again, underestimation of moderate and heavy rainfall and overestimation of light events was reported.
In their study regarding the area of Singapore, Tan and Duan [22] presented similar results, showing good correlation on a monthly scale, with rain gauges for both products and moderate correlation for daily values. The authors underlined that the better performance of IMERG was not that notable and that the main advantage of the new product was mostly its finer resolution.
In a study over the Tibetan plateau (Hexi region), Wang et al. [23] found a better correlation for IMERG, ascribed mostly to the ability to detect better moderate and heavy rainfall; however, they concluded that the improvement was not significant.
In their study (China, 2015–2017), Chen et al. [24] evaluated the performance of IMERG (v5) and TRMM 3B42 (v7) and found that, at monthly and annual scale, both datasets were highly correlated with rain gauge observations. Considering daily values, satellite estimates overestimate precipitation for intensities within the range 0 to 25 mm/day and underestimate precipitation for light and heavy intensities. Considering various statistical scores, they found that IMERG, in general, performed better in detecting the observed precipitation.
In a similar study (China, March 2014 to February 2017), Wei et al. [25] found severe underestimation with high negative relative biases for both IMERG (v5) and TRMM products. However, IMERG product performed better than TRMM 3B42 in the detection of precipitation events in terms of specific statistical scores (i.e., probability of detection), over China and across most of the sub-regions.
Sunilkumar et al. [26] evaluated the GPM-IMERG (v5) final precipitation product against a ground-based gridded data set over Japan, Nepal and the Philippines for two years (2014–2015). Their results showed generally good performance (in terms of statistical scores, like correlation, mean bias, root mean square error) of GPM-IMERG over three regions, although an underestimation was noticed during heavy rainfall events. They also noticed that GPM-IMERG estimates improved its capability in terms of detecting light and heavy precipitation events, although their performance was found to be seasonally dependent.
A few studies with evaluation of satellite precipitation products over Cyprus are reported in the literature. Retalis et al. [27] performed an analysis of precipitation data from satellite data TRMM 3B43 (versions 7 and 7A) over Cyprus and compared them with the corresponding gauge observations and E-OBS gridded data (i.e., a European daily high-resolution gridded dataset of surface temperature and precipitation to be used for validation of Regional Climate Models and for climate change studies) for a 15-year period (1998–2012). They concluded that correlation between TRMM and E-OBS was higher in summertime (≈0.97), but significantly lower in the winter period (≈0.60–0.74). It was noticed that the annual correlation tends to decrease considerably with time. They also found that the coefficient of determination between TRMM, E-OBS estimates and gauge data were relatively high (0.929 and 0.932, respectively); however, the variations noticed were attributed to the elevation differences.
A study for a 30-year period (1981–2010) for the precipitation database Climate Hazards Group Infrared Precipitation with Station data (CHIRPS) in Cyprus was presented by Katsanos et al. [28]. The CHIRPS database was evaluated against gauge stations data. Results showed good correlation between monthly CHIRPS values and recorded precipitation with the correlation coefficients found to be around 0.85 and January the month with the highest correlation. The corresponding values for the annual mean ranged between 0.70 and 0.74, with the mountainous stations showing a slightly higher correlation.
In a later study, Katsanos et al. [29] examined the performance of several climatic indices for the CHIRPS precipitation dataset and rain gauges records on high spatial (0.05°) and temporal (daily) resolution for a period of 30 years (1981–2010). Results indicates quite a promising performance regarding indices related to daily precipitation thresholds, resulting in high correlation scores. However, for indices referring to number of days, results showed medium or no correlation, probably due to the criteria used for the identification of a wet (rainy) day on the CHIRPS dataset.
Furthermore, Retalis et al. [30], in their study on the accuracy of the GPM IMERG estimates over Cyprus (April 2014 to February 2017), concluded that, overall, a very good agreement (based on the statistical analysis) between monthly IMERG estimates and gauge data was established (coefficient of determination r2 value ≈ 0.93), presenting a tendency of IMERG for underestimation when higher elevation (>1000 m) was considered. They also examined the daily dependency of IMERG estimates and gauge data, considering a series of extreme precipitation events, and they concluded that this is case dependency, while elevation does not have an apparent effect.
The objective of this study is to evaluate statistically the performance and improvement of the GPM IMERG product compared to TRMM 3B43V7 estimates, thus exploring, the continuity and uniformity between IMERG and TRMM-era data sets over Cyprus so that they can be used in climate studies as a combined and consistent dataset. The present research is a continuation and extension of previous studies by the same authors.
The current research aims at comparing the two products, namely, GPM IMERG and TRMM 3B43, in order to determine and highlight possible differences, advantages and disadvantages of each one of them, based on the performance of several statistical skill scores, along with cross-evaluation against the dense rain gauge dataset over Cyprus during the period from April 2014 to June 2018.

2. Study Area

Located in the north-eastern corner of the Mediterranean Sea, the island of Cyprus has a typical eastern-Mediterranean climate. The major characteristic of this type of climate can be concisely described by a bimodal seasonality with alternating relatively short wet winters and prolonged dry summers. As can be seen from the geomorphological map in Figure 1, the island is transversed by two mountain ranges: the high Troodos massif in the southwest with the highest peak, Olympus at 1951 m, and the elongated east-west oriented narrow Pentadaktylos range, rising to 900 m which borders the northern coast from east to west. Between the two mountain ranges, lies the central Mesaoria plain. Narrow, relatively flat strips of land surround the island along its coast.
Most of the winter dynamic systems which affect Cyprus originate from the southwest to west [31,32]; hence, the highest average annual precipitation values are recorded on the southern side of the highest peaks of the Troodos mountain and the lowest over the rain-shadowed areas north of Troodos and at coastal stations on the east part of the island [33].

3. Data and Methodology

3.1. In-Situ Rain Data

The in-situ meteorological stations of the very reliable [30] dense and well-distributed network operated by the Cyprus Department of Meteorology were used for ground validation. Daily and hourly complete data records from 136 rain gauges were used for the study period (see Figure 1). These gauges are distributed in such a way so as to cover the whole study area, including not only coastal, urban and agricultural areas, but also the hilly and mountainous areas. It is worth noting that data underwent quality control prior to the present analysis.
The average annual total precipitation increases up the southwestern windward slopes from 450 mm to nearly 1100 mm at the top of the central massif. On the leeward slopes amounts decrease steadily northwards and eastwards to between 300 and 350 mm in the central plain and the flat southeastern parts of the island [34].
The annual average rainfall, covering the period 1951–1980, is 480 mm, exhibiting a decreasing trend in the last 30 years [34]. Furthermore, rainfall in the warmer months contributes little or nothing to the annual precipitation amounts.
It should be noted at this point that data from four meteorological stations are provided by the Cyprus Department of Meteorology to be incorporated in the TRMM and GPM estimates. These four stations are not representative of the country as a whole. Furthermore, they barely make up 3% of the data used herein, hence, the are not expected to have an impact on the objectivity of the study.

3.2. IMERG Data

Global Precipitation Measurement (GPM) mission was launched on 27 February 2014, as a successor of the Tropical Rainfall Measuring Mission (TRMM). GPM constellation incorporates passive microwave (PMW) and infrared (IR) satellites, providing global precipitation measurements within the range 60°N–60°S and better temporal and spatial analysis (see [25,35,36]).
GPM consists of one Core Observatory and approximately 10 constellation satellites. The Core Observatory carries a Ku/Ka-band dual-frequency precipitation radar and a multi-channel GPM microwave imager, extending the measurement range of TRMM instruments. GPM provides three levels of precipitation-related products. The level-3 products are produced with the IMERG (Integrated Multi-satellitE Retrievals for GPM) algorithm, which intercalibrates and merges precipitation estimates from all constellation microwave sensors, microwave-calibrated infrared satellite estimates, and monthly gauge precipitation data [37,38]. It is important here to comment on the PMW sensitivity of retrieved rainfall, since the launch of GPM, the overland rainfall retrieval algorithm, is transitioning from an inversion technique based on rainfall–brightness temperature scattering relationships to a Bayesian framework consistent with the over-ocean algorithm [39]. GPM IMERG precipitation estimates are available from 12 March 2014 to present. The GPM IMERG products offer a relatively fine spatial resolution of 0.1° × 0.1° and high temporal resolution of 30 min, with a spatial coverage from 60°S to 60°N. The IMERG Final product [18] was chosen for our study and so, especially, was the IMERG (v05B) data for the period from April 2014 to June 2018.

3.3. TRMM Data

The Tropical Rainfall Measuring Mission (TRMM), launched by NASA (National Aeronautics and Space Administration) and JAXA (Japan Aerospace Exploration Agency) in 1997, provided precipitation estimates within the latitude 50°S to 50°N (see [40,41]).
The TRMM satellite carried several instruments to detect precipitation, including the Visible Infrared Radiometer (VIRS), TRMM Microwave Imager (TMI), Cloud and Earth Radiant Energy Sensor (CERES), Lightning Imaging Sensor (LIS) and the first spaceborne precipitation radar (PR). Several precipitation retrieval algorithms have been developed based on observations from the sensors on board the TRMM satellite such as the TMPA (TRMM Multi-satellite Precipitation Analysis). The TMPA algorithm combines observations from satellite-based microwave and infrared sensors and ground rainfall gauge analyses, and produces 3-hourly rainfall estimates at a spatial resolution of 0.25° × 0.25° with a quasi-global coverage (50° N-S) [42]. In 2015, the TRMM mission came to an end, with the instruments turned off and the spacecraft re-entering the Earth’s atmosphere. However, the multi-satellite TMPA products continue to be produced using input data from other satellites in the constellation. Indeed, the TMPA algorithms are still being run using other calibrators to produce data in parallel with GPM IMERG [43].
The Level 3 TRMM 3B43 data, also called TMPA product, were chosen for our analysis [42]. In particular, TRMM 3B43 (v7) data for the period from April 2014 to June 2018 were used.

3.4. Methods

In order to perform the evaluation of IMERG and 3B43V7 products relative to the reference rain gauges data, several indices including Pearson Correlation Coefficient (R), mean error (Bias), relative Bias (rBias), Root Mean Square Error (RMSE) and mean absolute error (MAE) were computed (see Table 1). Pearson correlation coefficient (R) is a dimensionless statistical index used to assess the linear correlation between the reference ground-based data and the satellite precipitation estimates. Mean error (Bias) represents the systematic error of satellite precipitation estimates, a measure of the overestimation or underestimation of the gauge data. Relative Bias (rBias) estimates the relative difference (in percentage) between the two data sources (satellite estimates and rain gauges). RMSE quantifies the average error magnitude (mm/time) between the satellite estimates and the rain gauge data. Mean absolute error (MAE) reflects the magnitude and extent of the mean error of satellite precipitation estimates. For seasonal analysis, the year was divided into four seasons: winter (December to February); spring (March to May); summer (June to September); and autumn (October to November).
Figure 2 shows the number of stations that are distributed within the grid cells of each Satellite Precipitation (SP) dataset. The number of grid cells for the study area was 19 for the TRMM 3B43 data and 61 for IMERG data, respectively. On the one hand, the TRMM 3B43 grids show a notable variation of the available number of gauge stations residing (e.g., from 1 to 23 stations per grid cell). It should be also noted that 42% of the available gauge stations (57 of 136) were located within only three cells, although these 3B43 cells are not the ones with the maximum correlation with the corresponding gauge values. We notice that the distribution of the available gauge station within each IMERG grid cell was more balanced (1 to 5 stations per grid cell).

4. Results and Discussion

4.1. Monthly Validation

Mean monthly values for the study period were calculated for both the gauge stations (136 stations) and the two satellite precipitation products (mean values of all available corresponding grid cells within the study area). The results are illustrated in Figure 3. We notice that, overall, both IMERG and TRMM data follow very well the “climatology” of the stations, although with an underestimation during the rainy period, while IMERG is closer to the gauge values for almost the whole period of study.
In order to highlight the performance of satellite precipitation (SP) products, we estimate their average difference (of their monthly values) from the corresponding gauge stations data (see Figure 4). We notice that, generally, IMERG monthly values present lower divergence than TRMM.
Next, IMERG and TRMM monthly estimates were compared to the corresponding gauge data based on a grid-level approach. Thus, for each SP product, the mean gauge station value is calculated for the comparison if more than one station was located within each SP grid.
The estimated correlation coefficient values between the monthly values of the gauge stations and the SP data are presented in Figure 5. Correlation seems slightly better for TRMM 3B43 cells, since there is a lower variation (minimum 0.84–maximum 0.96) than that corresponding to the IMERG cells (minimum 0.78–maximum 0.96), with the average of all cells being 0.92 and 0.91, respectively.
Both IMERG and 3B43 products underestimate precipitation with Bias values of −1.6 mm/month and −3.0 mm/month, respectively. IMERG showed better performance than 3B43 in terms of rBias values (3.6 and −8.7, respectively), while presenting worst performance in terms of RMSE (23.8 mm/month and 20.0 mm/month, respectively) and MAE (15.1 mm/month and 12.9 mm/month, respectively) values, as presented in Table 2 (minimum and maximum respective values are provided in brackets).

4.2. Seasonal Validation

The results for the seasonal validation are summarized in Table 3. Both TRMM 3B43 and GPM IMERG estimates presented high R values (0.91 and 0.90, respectively) in winter, which suggests a good agreement with ground-based measurements on a seasonal scale. Similar results were found for autumn (0.84 and 0.83, respectively) and spring (0.81 and 0.80, respectively), while the poorest correlation (0.68 and 0.67, respectively) was established in summer.
The BIAS for TRMM 3B43 and IMERG ranged from −12.6 to 0.9 and from −8.3 to 2.6, respectively, in the four seasons. The 3B43 overestimated precipitation in spring (0.9) and autumn (0.3), while underestimation is noticed in summer (−1.3) and is rather significant in winter (−12.6). Similar is the pattern for IMERG, with overestimation in spring (0.8) and autumn (2.6), while underestimation is noticed in summer (−1.8) and is rather significant in winter (−8.3).
In terms of rBias, 3B43 presented larger values than that of IMERG in spring (15.0 and 17.5, respectively) and autumn (6.4 and 18.4, respectively), while IMERG showed better performance in winter (−1.1 and −9.9, respectively). Both products displayed their worst values in summer (440.7 for 3B43 and 299.8 for IMERG, respectively).
Precipitation products displayed a similar trend for RMSE and MAE with higher values in winter, spring and autumn and lower values in summer. For winter, spring and autumn, TRMM 3B43 had RMSE values of 33.4, 15.2 and 13.9, which were slightly lower than those of IMERG, which were 38.6, 19.1 and 16.7, respectively. In summer, 3B43 had lower RMSE values, 6.3, compared to those of IMERG, 8.7, respectively. Similar results occurred for MAE values between 3B43 and IMERG, with larger values noticed in winter (33.4 and 38.6, respectively) and lower in summer (3.8 and 4.9, respectively). These results may indicate that both SP products exhibit a similar error level, on a seasonal scale.

4.3. Annual Validation

Mean annual values for the study period (see Figure 6) were calculated for both the set of 136 ground stations and the satellite precipitation products (mean values of the available corresponding grid cells within the study area). It is found that, overall, both SP data exhibit an underestimation, although it is lower for IMERG, with the exception of 2015, when a slight overestimation by the IMERG product was noticed. It should be noted, however, that the available precipitation estimates for 2014 were limited to the period April to December, while for 2018 they were limited to January to June.
Figure 7 displays the variation of overestimation (>100%) or underestimation (<100%) of annual precipitation values at each of the corresponding SP grid cell, between the SP estimated and calculated mean annual gauge station records. We notice that, more or less, the SP estimates have the same behavior regarding the overestimation/ underestimation of annual rainfall. Underestimation is more evident in the central area of Cyprus (greater area of Troodos mountain range), where higher precipitation records are generally noticed, highlighting the known limitations of satellite products regarding heavy rainfall, while the overestimation is noticed in the coastal or rather flat areas, where again the estimation of precipitation still remains a challenge due to the difficulty in distinguishing between rain and non-rain pixels over a complex background [44]. Furthermore, there are no significant differences between the years, since the cells that generally overestimate/underestimate rainfall have a similar performance regardless of the year.
The performance of the IMERG product was slightly better than 3B43V7 with an R higher value (0.82 and 0.81, respectively), lower Bias values (−17.9 mm/month and −30.5 mm/month, respectively) and rBias values (3.1 and −3.0, respectively), while presenting worst performance in terms of RMSE (108.8 mm/month and 94.7 mm/month, respectively) and MAE (96.1 mm/month and 83.4 mm/month, respectively) values, as presented in Table 4 (minimum and maximum respective values are provided in brackets).

4.4. Influence of Elevation on Satellite Precipitation Products

To analyze further the influence of elevation and satellite precipitation products, we grouped all the rain gauge stations into three categories according to their elevation (0–300 m, 300–600 m, >600 m), and compared the evaluation metrics across the different elevation ranges. The annual rBias results for the both GPM and TRMM products are presented in Table 5 and Table 6, respectively. Minimum and maximum respective values are provided in brackets along with the corresponding number of satellite products cell for each elevation category.
Results as presented in Table 5 and Table 6, respectively, portray that, on an annual scale, both of the two SP products overestimate the precipitation below an altitude of 300 m, with IMERG presenting the largest overestimation (mean annual RB values: RBIMERG = 123.8%, RB3B43 = 107.7%). On the contrary, both SP products underestimate precipitation with increasing elevation, with 3B43v7 displaying a more apparent underestimation than IMERG, with RBIMERG = 93.0%, RB3B43 = 78.0% and RBIMERG = 70.3%, RB3B43 = 65.6% for elevation ranges between 300 and 600 m and >600 m, respectively. Regarding the Pearson correlation coefficient, the performance for 3B43 v7 was slightly better than IMERG at all of the categories, with r values increasing with elevation.
More evaluation metrics (Bias, RMSE, MAE) were used to evaluate the performance of GPM and TRMM monthly data according to elevation (Table 7). Overall, the performance of both satellite products metrics (Bias, RMSE, MAE) were worst in higher altitude areas than in lower altitude areas. Regarding Bias, findings established that TRMM performed better in the elevation range 0–300 m, while GPM exhibited lower bias values in higher altitudes. TRMM exhibited lower RMSE and MAE values than those of GPM in the elevation ranges 0–300 m and >600 m and higher values in the elevation range 300–600 m.
The monthly and annual spatio-temporal variations of bias for both satellite precipitation products for the study period are presented in Figure 8 and Figure 9, respectively, while the corresponding seasonal spatio-temporal variation is presented in Figure 10. It is clear that both SP products underestimate precipitation in higher elevation areas and overestimate in areas with lower elevation fluctuations. The underestimation is more evident in the winter.
These findings are in agreement with previous studies reported in the literature [45,46,47,48,49,50]. The performance of both SP products could be due to the products themselves and to topography. Both satellite precipitation products combine data from both satellite sensors and ground gauges. Since data from only one gauge station are used in mountainous areas in Cyprus, while three are located in rather flat areas, the accuracy of satellite precipitation products may be affect. Chen and Li [51] and Tang et al. [52] also reported that the accuracy of satellite precipitation products in high mountainous areas in west China could be attributed to the sparse gauge network. Moreover, estimated differences could be also attributed to the differences of the rainfall process, which is rather complicated in mountainous areas than in low altitude areas due to the influence of topography.

5. Conclusions

An evaluation of the monthly and annual IMERG and TRMM 3B43 product estimates with corresponding rain-gauges data over Cyprus for the period April 2014 to June 2018 was performed. Based on the analysis presented, it is found that, overall, both monthly satellite product estimates and rain gauge data presented a very good agreement; however, both IMERG and TRMM estimates tend to underestimate precipitation, especially during the rainy season, although, IMERG and rain gauge records seem to exhibit similar temporal patterns. Considering the annual values, we notice that both SP estimates underestimate annual precipitation records, although IMERG estimates are much closer to gauge station records. In terms of statistical scores analysis, it was found that on a monthly and annual basis, a slightly better performance of IMERG for R, Bias and rBias values was noticed, while 3B43 product performed better in terms of RMSE and MAE values. Seasonal analysis showed that both products exhibited a better performance during the rainy (winter) period, followed by autumn and spring seasons, while both products were able to detect the summer-time precipitation, although with high uncertainty in terms of relative bias values.
In summary, we conclude that although satellite products could be considered as quite accurate estimates of precipitation, indeed, their accuracy is not yet profound, and this issue is open to further elaboration. Nonetheless, IMERG estimates, due to their superiority in terms of spatial and temporal resolution, could serve as an alternative precipitation dataset, where in-situ precipitation records are limited.
The influence of elevation of both SP estimates was considered by grouping rain gauge stations in three categories, with respect to their elevation and it was found that both SP estimates underestimate precipitation with increasing elevation and overestimate it at lower elevations. Thus, it is suggested that one possible improvement would be the prospect of blending the SP data with more in situ data from rain gauges that are distributed evenly over the geographical area of Cyprus and especially in mountainous areas. Furthermore, it would be quite challenging to enhance the retrieval algorithms by implementing elevation correction or adjustment.
Although the results derived from this study are site specific for Cyprus, the methodology adopted could be “transferred” to other regions according to our understanding of how satellite-based precipitation estimates perform over different regions. For example, for study areas with characteristics similar to our area of study, in terms of geographic location, with no very complex topography, the methodology could be applied directly. For other areas, with complex topography or with various climatic zones the methodology should further consider these parameters.
The authors aim to expand their research in this field, by considering an evaluation over Cyprus of the newly released version of IMERG data that expands the SP products into a uniformly processed data set embracing the TRMM-era. The establishment of a uniform TRMM and GPM SP record will broaden the scientific challenges for further research in several meteorological and hydrological applications.

Author Contributions

All authors contributed extensively to the work presented in this paper. The manuscript was prepared by A.R. and revised by D.K., F.T. and S.M. D.K. and F.T. provided and analyzed data. All authors discussed the results and implications of the manuscript at all stages. All authors have read and agreed to the published version of the manuscript.

Funding

S.M. was supported by the EMME-CARE project that has received funding from the European Union’s Horizon 2020 Research and Innovation Programme, under grant agreement no. 856612, as well as matching co-funding by the Government of the Republic of Cyprus.

Acknowledgments

The authors acknowledge the provision of the rain gauge data by the Cyprus Department of Meteorology and the provision of the TMPA and IMERG data by the NASA/Goddard Space Flight Center’s Mesoscale Atmospheric Processes Laboratory and Precipitation Processing Center, U.S.A., which developed and computed them as a contribution to TRMM and GPM, respectively.

Conflicts of Interest

The authors declare no conflict of interest.

References

  1. Yilmaz, K.K.; Hogue, T.S.; Hsu, K.-L.; Sorooshian, S.; Gupta, H.V.; Wagener, T. Intercomparison of rain gauge, radar, and satellite-based precipitation estimates with emphasis on hydrologic forecasting. J. Hydrometeorol. 2005, 6, 497–517. [Google Scholar] [CrossRef]
  2. Shrestha, M.S.; Artan, G.A.; Bajracharya, S.R.; Sharma, R.R. Using satellite-based rainfall estimation for stream-flow modeling: Bagmati basin. J. Flood Risk Manag. 2008, 1, 88–89. [Google Scholar] [CrossRef]
  3. Tobin, K.J.; Bennett, M.E. Using SWAT to model streamflow in two river basins with ground and satellite precipitation data. J. Am. Water Resour. Assoc. 2009, 45, 253–271. [Google Scholar] [CrossRef]
  4. Bui, H.T.; Ishidaira, H.; Shaowei, N. Evaluation of the use of global satellite–gauge and satellite-only precipitation products in stream flow simulations. Appl. Water. Sci. 2019, 9, 53. [Google Scholar] [CrossRef] [Green Version]
  5. Akinyemi, D.F.; Ayanlade, O.S.; Nwaezeigwe, J.O. A Comparison of the accuracy of multi-satellite precipitation estimation and ground meteorological records οver southwestern Nigeria. Remote Sens. Earth Syst. Sci. 2019. [Google Scholar] [CrossRef]
  6. Levizzani, V.; Cattani, E. Satellite remote sensing of precipitation and the terrestrial water cycle in a changing climate. Remote Sens. 2019, 11, 2301. [Google Scholar] [CrossRef] [Green Version]
  7. Prigent, C. Precipitation retrieval from space: An overview. C. R. Geosci. 2010, 342, 380–389. [Google Scholar] [CrossRef]
  8. Kummerow, C.D.; Randel, D.L.; Kulie, M.; Wang, W.; Ferraro, R.; Joseph Munchak, S.; Petkovic, V. The evolution of the Goddard profiling algorithm to a fully parametric scheme. J. Atmos. Ocean. Technol. 2015, 32, 2265–2280. [Google Scholar] [CrossRef]
  9. Tapiador, F.J.; Navarro, A.; Levizzani, V.; García-Ortega, E.; Huffman, G.J.; Kidd, C.; Kucera, P.; Kummerow, C.D.; Masunaga, H.; Petersen, W.A.; et al. Global precipitation measurements for validating climate models. Atmos. Res. 2017, 94, 512–533. [Google Scholar] [CrossRef]
  10. Sun, Q.; Miao, C.; Duan, Q.; Ashouri, H.; Sorooshian, S.; Hsu, K.-L. A review of global precipitation data sets: Data sources, estimation, and inter-comparisons. Rev. Geophys. 2018, 56, 79–107. [Google Scholar] [CrossRef] [Green Version]
  11. Skofronick-Jackson, G.; Kulie, M.; Milani, L.; Munchak, S.J.; Wood, N.B.; Levizzani, V. Satellite Estimation of falling snow: A Global Precipitation Measurement (GPM) core observatory perspective. J. Appl. Meteorol. Climatol. 2019, 58, 1429–1448. [Google Scholar] [CrossRef]
  12. Dias, J.; Gehne, M.; Kiladis, G.N.; Sakaeda, N.; Bechtold, P.; Haiden, T. Experimental assimilation of the GPM core observatory DPR reflectivity profiles for typhoon Halong (2014). Mon. Wea. Rev. 2016, 144, 2307–2326. [Google Scholar] [CrossRef]
  13. Panegrossi, G.; Casella, D.; Dietrich, S.; Marra, A.C.; Sano, P.; Mugnai, A.; Baldini, L.; Roberto, N.; Adirosi, E.; Cremonini, R.; et al. Use of the GPM constellation for monitoring heavy precipitation events over the Mediterranean region. IEEE J. Sel. Top. Appl. Earth Obs. Remote Sens. 2016, 9, 2733–2753. [Google Scholar] [CrossRef]
  14. Skofronick-Jackson, G.; Petersen, W.A.; Beng, W.; Kidd, C.; Stocker, E.F.; Kirschbaum, D.B.; Kakar, R.; Braun, S.A.; Huffman, G.J.; Iguchi, T.; et al. The Global Precipitation Measurement (GPM) mission for science and society. Bull. Am. Meteorol. Soc. 2017, 98, 1679–1695. [Google Scholar] [CrossRef] [PubMed]
  15. Marra, A.C.; Porcù, F.; Baldini, L.; Petracca, M.; Casella, D.; Dietrich, S.; Mugnai, A.; Sanò, P.; Vulpiani, G.; Panegrossi, G. Observational analysis of an exceptionally intense hailstorm over the Mediterranean area: Role of the GPM Core Observatory. Atmos. Res. 2017, 192, 72–90. [Google Scholar] [CrossRef]
  16. Marra, A.C.; Federico, S.; Montopoli, M.; Avolio, E.; Baldini, L.; Casella, D.; D’Adderio, L.P.; Dietrich, S.; Sanò, P.; Torcasio, C.R.; et al. The Precipitation structure of the Mediterranean tropical-like cyclone Numa: Analysis of GPM Observations and Numerical Weather Prediction model simulations. Remote Sens. 2019, 11, 1690. [Google Scholar] [CrossRef] [Green Version]
  17. Panegrossi, G.; Marra, A.C.; Sanò, P.; Baldini, L.; Casella, D.; Porcù, F. Heavy precipitation systems in the Mediterranean area: The role of GPM. In Satellite Precipitation Measurement-Volume 1; Levizzani, V., Kidd, C., Kirschbaum, D.B., Kummerow, C.D., Nakamura, K., Turk, F.J., Eds.; Springer: Dordrecht, The Netherlands, 2020; pp. 819–841. ISBN 978-3-030-24567-2. [Google Scholar] [CrossRef]
  18. Liu, Z.; Ostrenga, D.; Vollmer, B.; Deshong, B.; Macritchie, K.; Greene, M.; Kempler, S. Global precipitation measurement mission products and services at the NASA GES DISC. Bull. Am. Meteorol. Soc. 2017, 98, 437–444. [Google Scholar] [CrossRef]
  19. Wang, Z.; Zhong, R.; Lai, C.; Chen, J. Evaluation of the GPM IMERG satellite-based precipitation products and the hydrological utility. Atmos. Res. 2017, 196, 151–163. [Google Scholar] [CrossRef]
  20. Wu, L.; Xu, Y.; Wang, S. Comparison of TMPA-3B42RT legacy product and the equivalent IMERG products over mainland China. Remote Sens. 2018, 10, 1778. [Google Scholar] [CrossRef] [Green Version]
  21. Anjum, M.N.; Ahmad, I.; Ding, Y.; Shangguan, D.; Zaman, M.; Ijaz, M.W.; Sarwar, K.; Han, H.; Yang, M. Assessment of IMERG-V06 precipitation product over different hydro-climatic regimes in the Tianshan. Remote Sens. 2019, 11, 2314. [Google Scholar] [CrossRef] [Green Version]
  22. Tan, M.L.; Duan, Z. Assessment of GPM and TRMM precipitation products over Singapore. Remote Sens. 2017, 9, 720. [Google Scholar] [CrossRef] [Green Version]
  23. Wang, X.; Ding, Y.; Zhao, C.; Wang, J. Similarities and improvements of GPM IMERG upon TRMM 3B42 precipitation product under complex topographic and climatic conditions over Hexi region, northeastern Tibetan Plateau. Atmos. Res. 2019, 218, 347–363. [Google Scholar] [CrossRef]
  24. Chen, C.; Chen, Q.; Duan, Z.; Zhang, J.; Mo, K.; Li, Z.; Tang, G. Multiscale comparative evaluation of the GPM IMERG v5 and TRMM 3B42 v7 precipitation products from 2015 to 2017 over a climate transition area of China. Remote Sens. 2018, 10, 944. [Google Scholar] [CrossRef] [Green Version]
  25. Wei, G.; Lü, H.; Crow, W.T.; Zhu, Y.; Wang, J.; Su, J. Comprehensive evaluation of GPM-IMERG, CMORPH, and TMPA precipitation products with gauged rainfall over mainland China. Adv. Meteorol. 2018, 3024190. [Google Scholar] [CrossRef] [Green Version]
  26. Sunilkumar, K.; Yatagai, A.; Masuda, M. Preliminary evaluation of GPM-IMERG rainfall estimates over three distinct climate zones with APHRODITE. Earth Space Sci. 2019, 6, 1321–1335. [Google Scholar] [CrossRef] [Green Version]
  27. Retalis, A.; Katsanos, D.; Michaelides, S. Precipitation climatology over the Mediterranean Basin–Validation over Cyprus. Atmos. Res. 2016, 169, 449–458. [Google Scholar] [CrossRef]
  28. Katsanos, D.; Retalis, A.; Michaelides, S. Validation of a high-resolution precipitation database (CHIRPS) over Cyprus for a 30-year period. Atmos. Res. 2016, 169, 459–464. [Google Scholar] [CrossRef]
  29. Katsanos, D.; Retalis, A.; Tymvios, F.; Michaelides, S. Analysis of precipitation extremes based on satellite (CHIRPS) and in-situ data set over Cyprus. Nat. Hazards 2016, 83, S53–S63. [Google Scholar] [CrossRef]
  30. Retalis, A.; Katsanos, D.; Tymvios, F.; Michaelides, S. Validation of the first years of GPM operation over Cyprus. Remote Sens. 2018, 10, 1520. [Google Scholar] [CrossRef] [Green Version]
  31. Nicolaides, K.A.; Michalelides, S.C.; Karacostas, T. Synoptic and dynamic characteristics of selected deep depressions over Cyprus. Adv. Geosci. 2006, 7, 175–180. [Google Scholar] [CrossRef] [Green Version]
  32. Nicolaides, K.; Savvidou, K.; Orphanou, A.; Michaelides, S.C.; Constantinides, P.; Papachristodoulou, C.; Savvides, M. An investigation of a baroclinic depression that affected the area of Cyprus. Adv. Geosci. 2008, 16, 117–124. [Google Scholar] [CrossRef] [Green Version]
  33. Michaelides, S.; Tymvios, F.; Michaelidou, T. Spatial and temporal characteristics of the annual rainfall frequency distribution in Cyprus. Atmos. Res. 2009, 94, 606–615. [Google Scholar] [CrossRef]
  34. Cyprus Department of Meteorology. The Climate of Cyprus. Available online: http://www.moa.gov.cy/moa/ms/ms.nsf/DMLcyclimate_en/DMLcyclimate_en? (accessed on 4 April 2020).
  35. Hou, A.Y.; Skofronick-Jackson, G.; Kummerow, C.D.; Shepherd, J.M. Global Precipitation Measurement. In Precipitation: Advances in Measurement, Estimation and Prediction; Michaelides, S., Ed.; Springer: Berlin, Germany, 2008; pp. 131–169. ISBN 978-3-540-77654-3. [Google Scholar]
  36. Gebregiorgis, A.S.; Kirstetter, P.-E.; Hong, Y.E.; Gourley, J.J.; Huffman, G.J.; Petersen, W.A.; Xue, X.; Shwaller, M. To what extent is the day 1 GPM IMERG satellite precipitation estimate improved as compared to TRMM TMPA-RT? J. Geophys. Res. Atmos. 2018, 123, 1694–1707. [Google Scholar] [CrossRef]
  37. Hou, A.Y.; Kakar, R.K.; Neeck, S.; Azarbarzin, A.A.; Kummerow, C.D.; Kojima, M.; Oki, R.; Nakamura, K.; Ihuchi, T. The Global Precipitation Measurement mission. Bull. Am. Meteorol. Soc. 2014, 95, 701–722. [Google Scholar] [CrossRef]
  38. Huffman, G.J.; Bolvin, D.T.; Nelkin, E.J. Integrated Multi-SatellitE Retrievals for GPM (IMERG) Technical Documentation; NASA/GSFC: Greenbelt, MD, USA, 2015.
  39. Elsaesser, G.S.; Kummerow, C.D. The Sensitivity of rainfall estimation to error assumptions in a Bayesian passive microwave retrieval algorithm. J. Appl. Meteor. Climatol. 2015, 54, 408–422. [Google Scholar] [CrossRef]
  40. Kummerow, C.; Barnes, W.; Kozu, T.; Shiue, J.; Simpson, J. The Tropical Rainfall Measuring Mission (TRMM) sensor package. J. Atmos. Ocean. Technol. 1998, 15, 809–817. [Google Scholar] [CrossRef]
  41. Kummerow, C.; Simpson, J.; Thiele, O.; Barnes, W.; Chang, A.T.C.; Stocker, E.; Adler, R.F.; Hou, A.; Kakar, R.; Wentz, F.; et al. The Status of the Tropical Rainfall Measuring Mission (TRMM) after 2 years in orbit. J. Appl. Meteorol. 2000, 39, 1965–1982. [Google Scholar] [CrossRef]
  42. Huffman, G.J.; Adler, R.F.; Bolvin, D.T.; Gu, G.; Nelkin, E.J.; Bowman, K.P.; Hong, Y.; Stocker, E.F.; Wolff, D.B. The TRMM Multisatellite Precipitation Analysis (TMPA): Quasi-global, multiyear, combined-sensor precipitation estimates at fine scales. J. Hydrometeorol. 2007, 8, 38–55. [Google Scholar] [CrossRef]
  43. Huffman, G.J. The Transition in Multi-Satellite Products from TRMM to GPM (TMPA to IMERG) (TMPA to IMERG). Available online: https://gpm.nasa.gov/resources/documents/transition-multi-satellite-products-trmm-gpm-tmpa-imerg (accessed on 2 April 2020).
  44. Munchak, S.J.; Skofronick-Jackson, G. Evaluation of precipitation detection over various surfaces from passive microwave imagers and sounders. Atmos. Res. 2013, 131, 81–94. [Google Scholar] [CrossRef]
  45. Jin, X.L.; Shao, H.; Zhang, C.; Yan, Y. The applicability evaluation of three satellite products in Tianshan Mountains. J. Nat. Resour. 2016, 31, 2074–2085. [Google Scholar] [CrossRef]
  46. Ma, Y.; Tang, G.; Long, D.; Yong, B.; Zhong, L.; Wan, W.; Hong, Y. Similarity and error intercomparison of the GPM and its predecessor-TRMM Multisatellite Precipitation Analysis using the best available hourly gauge network over the Tibetan Plateau. Remote Sens. 2016, 8, 569. [Google Scholar] [CrossRef] [Green Version]
  47. Xu, R.; Tian, F.; Yang, L.; Hu, H.; Lu, H.; Hou, A. Ground validation of GPM IMERG and TRMM 3B42V7 rainfall products over southern Tibetan Plateau based on a high-density rain gauge network. J. Geophys. Res. Atmos. 2017, 122, 910–924. [Google Scholar] [CrossRef]
  48. Fang, J.; Yang, W.; Luan, Y.; Du, J.; Lin, A.; Zhao, L. Evaluation of the TRMM 3B42 and GPM IMERG products for extreme precipitation analysis over China. Atmos. Res. 2019, 223, 24–38. [Google Scholar] [CrossRef]
  49. Wang, S.; Liu, J.; Wang, J.; Qiao, X.; Zhang, J. Evaluation of GPM IMERG V05B and TRMM 3B42V7 precipitation products over High Mountainous tributaries in Lhasa with dense rain gauges. Remote Sens. 2019, 11, 2080. [Google Scholar] [CrossRef] [Green Version]
  50. Wu, Y.; Zhang, Z.; Huang, Y.; Jin, Q.; Chen, X.; Chang, J. Evaluation of the GPM IMERG v5 and TRMM 3B42 v7 precipitation products in the Yangtze river basin, China. Water 2019, 11, 1459. [Google Scholar] [CrossRef] [Green Version]
  51. Chen, F.R.; Li, X. Evaluation of IMERG and TRMM 3B43 monthly precipitation products over mainland China. Remote Sens. 2016, 8, 472. [Google Scholar] [CrossRef] [Green Version]
  52. Tang, G.; Zeng, Z.; Long, D.; Guo, X.; Yong, B.; Zhang, W.; Hong, Y. Statistical and hydrological comparisons between TRMM and GPM level-3 products over a midlatitude basin: Is day-1 IMERG a good successor for TMPA 3B42V7? J. Hydrometeorol. 2016, 17, 121–137. [Google Scholar] [CrossRef]
Figure 1. Geomorphology map of Cyprus highlighting the distribution of the dense gauge station network grouped according to elevation.
Remotesensing 12 03212 g001
Figure 2. Distribution of rain gauge stations within Tropical Rainfall Measuring Mission (TRMM) 3B43 (a) and Integrated Multi-satellitE Retrievals (IMERG) (b) grids.
Remotesensing 12 03212 g002
Figure 3. Average monthly values calculated for gauges (dark blue) TRMM 3B43 estimates (light blue) and IMERG estimates (red line) for the period April 2014 to June 2018.
Remotesensing 12 03212 g003
Figure 4. Average difference (monthly values) between gauge stations data from 3B43 (blue line) and IMERG (red line) estimates, respectively.
Remotesensing 12 03212 g004
Figure 5. Correlation coefficient at grid cell level between the gauge stations and the TRMM (a) and IMERG (b) data.
Remotesensing 12 03212 g005
Figure 6. Mean annual values of gauge stations and Satellite Precipitation (SP) data.
Remotesensing 12 03212 g006
Figure 7. Underestimation/Overestimation of the annual satellite product estimates as compared with gauge station records at the corresponding grid cell: (a) TRMM—2014 (April–December); (b) GPM—2014 (April–December); (c) TRMM—2015; (d) GPM—2015; (e) TRMM—2016; (f) GPM—2016; (g) TRMM—2017; (h) GPM—2017; (i) TRMM—2018 (January–June); (j) GPM—2018 (January–June).
Remotesensing 12 03212 g007aRemotesensing 12 03212 g007b
Figure 8. Monthly bias for both precipitation products for the study period: (a) TRMM and (b) GPM.
Remotesensing 12 03212 g008
Figure 9. Annual bias for both precipitation products for the study period: (a) TRMM and (b) GPM.
Remotesensing 12 03212 g009
Figure 10. Seasonal bias for both precipitation products for the study period: (a) TRMM for September, October and November; (b) GPM for September, October and November; (c) TRMM for December, January and February; (d) GPM for December, January and February; (e) TRMM for March, April and May; (f) GPM for March, April and May; (g) TRMM for June, July and August; (h) GPM for June, July and August.
Remotesensing 12 03212 g010
Table 1. Summary of statistical indices used to evaluate the satellite precipitation products (Si: satellite estimates, Oi: observations).
UnitEquation
R (correlation coefficient)- i = 1 n O i O ¯ S i S ¯ i = 1 n O i O ¯ 2 i = 1 n S i S ¯ 2
Mean Error (Bias)mm i = 1 n S i O i n
Relative Bias- i = 1 n S i O i i = 1 n O i 100
RMSEmm i = 1 n S i O i 2 n
Mean Absolute Errormm i = 1 n S i O i n
Table 2. Performance evaluation metrics of monthly data from 3B43V7 and IMERG (the range of values is given in parentheses).
TRMM 3B43GPM IMERG
R (correlation coefficient)0.92 (0.84–0.96)0.91 (0.78–0.96)
Mean Error (Bias)−3.0 (−21.5–7.7)−1.6 (−31.8–13.0)
Relative Bias−3.0 (−38.6–35.0)3.6 (−45.6–58.7)
RMSE20.0 (11.6–37.2)23.8 (14.7–55.0)
Mean Absolute Error12.9 (8.7–24.3)15.1 (10.2–35.5)
Table 3. Performance evaluation metrics of seasonal data from 3B43V7 and IMERG (the range of values is given in parentheses).
TRMM 3B43GPM IMERG
MAMJJASONDJFMAMJJASONDJF
R (correlation coefficient)0.810.680.840.910.800.670.830.90
Mean Error (Bias)0.9−1.30.3−12.60.8−1.82.6−8.3
Relative Bias15.0440.76.4−9.917.5299.818.4−1.1
RMSE15.26.313.933.419.18.716.738.6
Mean Absolute Error12.23.811.025.614.64.912.729.2
Table 4. Performance evaluation metrics of annual data from 3B43V7 and IMERG and (the range of values is given in parentheses).
TRMM 3B43GPM IMERG
R (correlation coefficient)0.81 (0.46–0.99)0.82 (0.37–0.99)
Mean Error (Bias)−30.5 (−219.3–77.0)−17.9 (−324.4–132.2)
Relative Bias−3.0 (−38.6–35.0)3.1 (−45.6–58.7)
RMSE94.7 (37.5–234.8)108.8 (32.3–335.0)
Mean Absolute Error83.4 (30.2–219.3)96.1 (25.2–324.4)
Table 5. Annual rBias and Pearson correlation coefficient performance for GPM data according to elevation (the range of values is given in parentheses).
All Annual20142015201620172018
% of gauge123.8133.8133.8127.3118.1119.6
(90.9–158.7)(93.6–234.0)(86.5–185.2)(79.7–175.1)(76.4–196.8)(77.7–200.2)
correlation0.90Elevation: 0–300 m (30 cells)
(0.78–0.95)
% of gauge93.096.3107.189.893.781.9
(68.5–131.1)(68.8–144.7)(74.5–145.2)(58.5–127.9)(68.5–145.4)(52.6–143.4)
correlation0.91Elevation: 300–600 m (19 cells)
(0.85–0.96)
% of gauge70.377.982.765.868.858.3
(54.4–81.3)(61.8–109.4)(64.9–101.6)(50.3–92.9)(50.3–85.8)(44.0–72.8)
correlation0.92Elevation: >600 m (12 cells)
(0.88–0.94)
Table 6. Annual rBias and Pearson correlation coefficient performance for TRMM data according to elevation (the range of values is given in parentheses).
All Annual20142015201620172018
% of gauge107.7119.2125.5106.485.9107.8
(85.9–135.0)(91.9–166.8)(86.7–182.6)(77.4–139.3)(61.6–131.8)(82.5–160.7)
correlation0.92Elevation: 0–300 m (13 cells)
(0.84–0.96)
% of gauge78.083.199.374.868.160.6
(67.3–99.6)(73.8–102.6)(83.9–122.1)(61.1–106.9)(51.9–91.3)(52.6–66.7)
correlation0.92Elevation: 300–600 m (4 cells)
(0.88–0.94)
% of gauge65.674.177.357.263.156.5
(61.4–69.8)(72.1–76.1)(75.9–78.7)(51.2–63.1)(57.2–69.0)(52.6–60.5)
correlation0.94Elevation: >600 m (2 cells)
(0.93–0.94)
Table 7. Metrics (Bias, RMSE, MAE) performance for GMP and TRMM monthly data according to elevation (the range of values is given in parentheses).
Elevation (m)Bias (mm/month)RMSE (mm/month)MAE (mm/month)
GPMTRMMGPMTRMMGPMTRMM
0–3005.81.519.617.213.211.0
(−5.2–13.0)(−5.8–7.7)(14.7–28.6)(11.6–25.1)(10.2–17.2)(9.0–14.3)
300–600−3.9−10.223.124.514.315.3
(−17.0–8.1)(−15.8–-0.1)(15.4–42.1)(13.4–30.0)(10.3–21.8)(8.7–18.0)
>600−16.5−17.835.433.021.521.0
(−31.8–-8.7)(−21.5–-14.1)(23.2–55.0)(28.7–37.2)(15.0–35.5)(17.7–24.3)

