


Association of Lesion Topography with Functional Outcomes in Acute Ischemic Stroke Patients Considered for, or Receiving, Reperfusion Therapy: A Meta-Analysis
 ,
, 
Abstract
:1. Introduction
- What is the prevalence of infarcts for each ASPECTS region?
- What is the average of reported odds ratios for the association of infarcts in each ASPECTS region with functional outcomes at 90 days?
- What is the reported odds ratio (OR) for the infarcts in each ASPECTS region in left and right hemispheric stroke with functional outcomes at 90 days?
- Are ASPECTS score cut-offs of 6, 7 and 8 associated with functional outcomes at 90 days?
- Is there an association of continuous ASPECTS score with functional outcomes at 90 days?
2. Methods
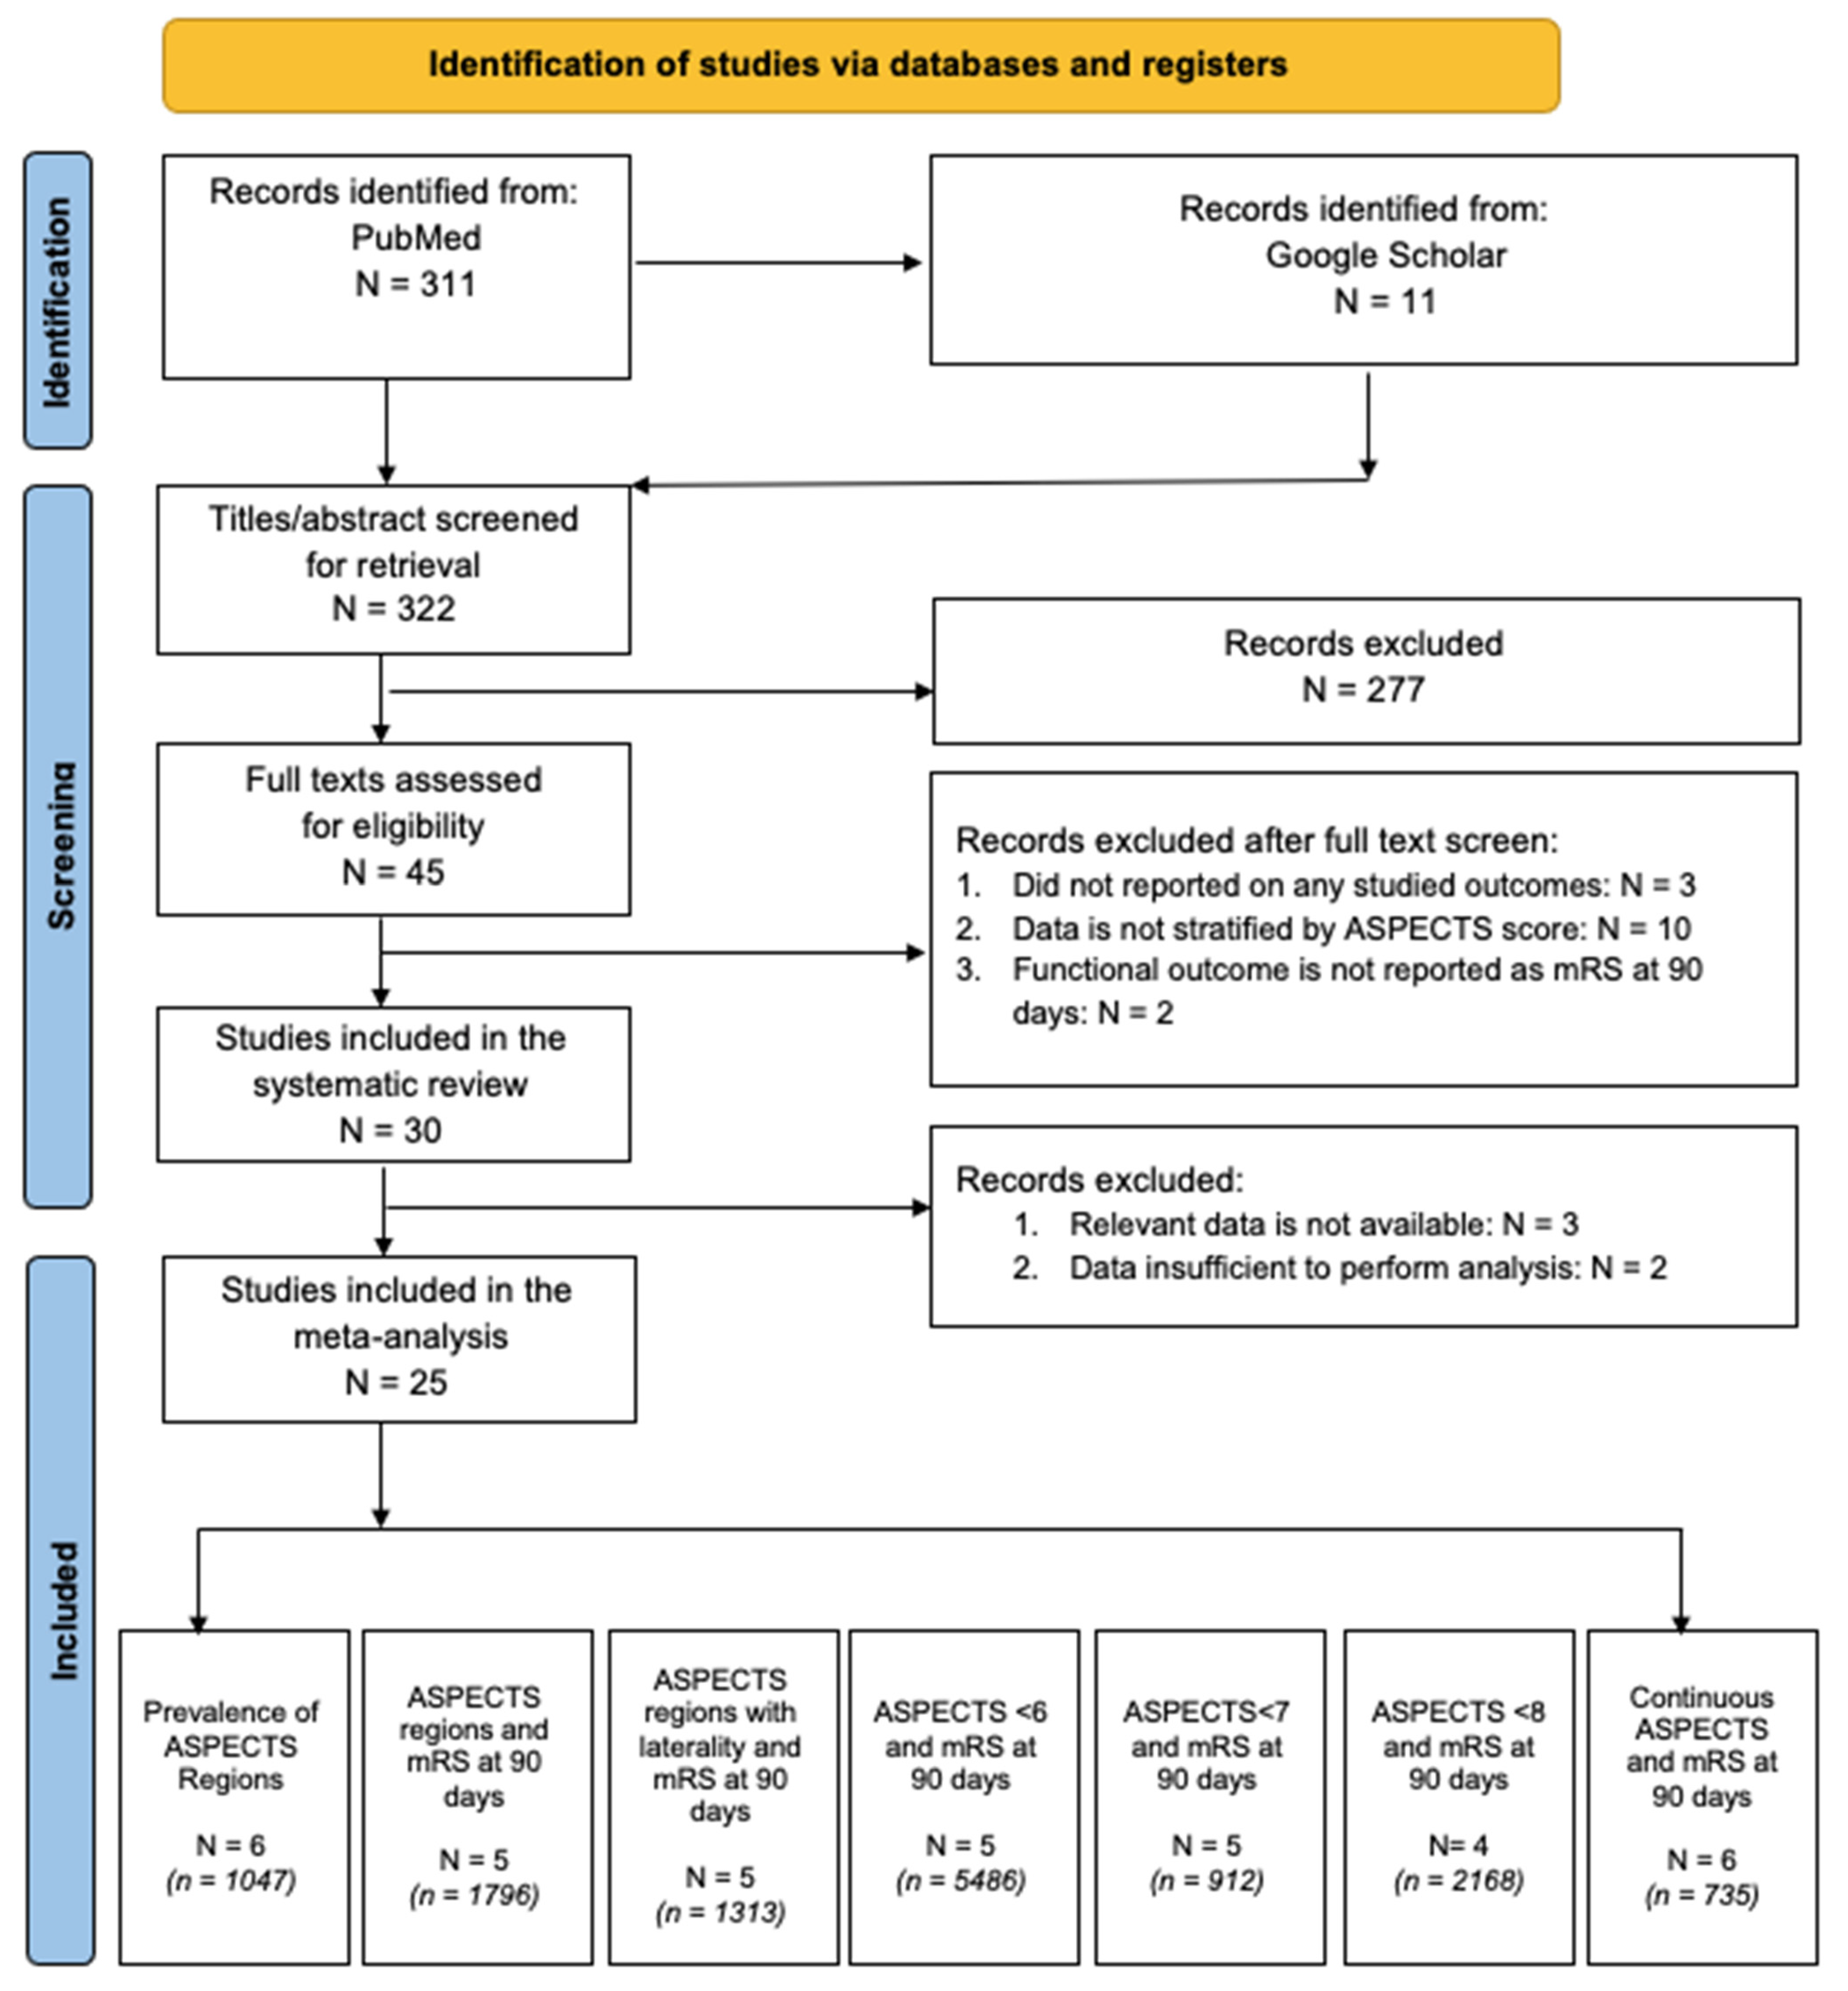
2.1. Literature Search: Identification and Selection of Studies
2.2. Inclusion and Exclusion Criteria
2.3. Data Extraction
2.4. Methodological Quality Assessment of Included Studies
2.5. Statistical Analysis
3. Results
3.1. Description of Included Studies

| ID | Authors | Year | Study Type | Cohort | Treatment | Age * | Male | LHS | HTN | Diabetes | Dyslipidaemia | AF | Previous Stroke | Smoking |
|---|---|---|---|---|---|---|---|---|---|---|---|---|---|---|
| 1 | Yu et al. [16] | 2021 | Prospective | 40 | No RT ± EVT | 60.1 ± 11.8 | 67.50% | 47.50% | 37.50% | 30.00% | ||||
| 2 | Rangaraju et al. [17] | 2015 | Retrospective | 213 | EVT | 66.1 ± 14.5 | 48.83% | |||||||
| 3 | Beare et al. [18] | 2015 | Prospective | 185 | No RT ± IVT | 67.5 ± 12.8 | 55.14% | 70.27% | 16.22% | |||||
| 4 | Van Horn et al. [19] | 2021 | Prospective | 123 | EVT ± IVT | 75.0 ± 14.0 | 59.35% | 65.85% | 18.70% | 15.45% | 37.40% | 16.26% | ||
| 5 | Payabvash et al. [20] | 2018 | Retrospective | 198 | No RT ± IVT ± EVT | 62.7 ± 16.9 | 62.63% | 47.47% | 76.77% | 29.80% | 54.55% | 20.71% | 41.41% | |
| 6 | Sheth et al. [15] | 2018 | Prospective | 342 | EVT ± IVT | 67.0 ± 13.0 | 42.98% | 47.08% | 64.91% | 16.08% | 38.01% | 16.08% | 16.96% | |
| 7 | Rosso et al. [21] | 2019 | Prospective | 405 | EVT ± IVT | 69.7 ± 16.4 | 54.81% | 46.91% | ||||||
| 8 | Esmael et al. [22] | 2020 | Prospective | 150 | No RT | 64.0 ± 11.5 | 52.67% | 68.00% | 26.00% | 14.67% | 18.67% | 40.00% | ||
| 9 | Yoo et al. [23] | 2016 | Prospective | 496 | IVT ± EVT | 58.47% | 53.43% | 45.36% | 13.51% | 25.81% | 27.22% | 10.89% | 28.63% | |
| 10 | Ohta et al. [24] | 2018 | Retrospective | 83 | IVT ± EVT | 80.6 ± 11.0 | 48.19% | 48.19% | 75.90% | 22.89% | 24.10% | 68.67% | 16.87% | 36.14% |
| 11 | Hungerford et al. [25] | 2016 | Prospective | 154 | EVT ± IVT | 67.2 ± 14.1 | 50.00% | 51.95% | ||||||
| 12 | Logan et al. [26] | 2018 | Prospective | 355 | EVT ± IVT | 67.0 ± 14.0 | 55.49% | 23.10% | 1.69% | 7.89% | 7.61% | 3.38% | 3.38% | |
| 13 | Shin et al. [27] | 2020 | Prospective | 350 | IVT ± EVT | 63.8 ± 12.7 | 60.29% | 56.29% | 22.00% | 27.71% | 13.14% | 32.57% | ||
| 14 | Oki et al. [28] | 2021 | Prospective | 688 | No RT ± IVT ± EVT | 77.0 ± 10.0 | 52.76% | 67.15% | 15.70% | 29.36% | 100.00% | 15.99% | ||
| 15 | Ozdemir et al. [29] | 2017 | Prospective | 70 | EVT ± IVT | 57.0 ± 10.4 | 58.57% | 60.00% | 30.00% | 58.57% | 34.29% | 45.71% | ||
| 16 | Wollenweber et al. [30] | 2019 | Prospective | 2637 | EVT ± IVT | 73.7 ± 13.7 | 49.62% | 75.65% | 20.92% | 33.86% | 40.94% | 15.25% | ||
| 17 | Ghodsi et al. [31] | 2021 | Prospective | 553 | No RT | 65.5 ± 14.4 | 50.99% | 38.52% | 66.73% | 73.24% | 33.27% | |||
| 18 | Seyedsaadat et al. [32] | 2021 | Prospective | 353 | EVT ± IVT | |||||||||
| 19 | Cheng et al. [33] | 2021 | Retrospective | 200 | EVT ± IVT | 66.2 ± 10.8 | 58.00% | 68.50% | 20.50% | 41.50% | 30.00% | |||
| 20 | Spiotta et al. [34] | 2015 | Retrospective | 149 | EVT ± IVT | 66.1 ± 15.1 | 42.95% | 53.69% | ||||||
| 21 | Jovin et al. [6] | 2015 | Prospective | 206 | IVT ± EVT | 66.5 ± 10.4 | 52.91% | 65.05% | 19.90% | 14.56% | ||||
| 22 | Schregel et al. [35] | 2018 | Prospective | 102 | EVT | 72.8 ± 10.9 | 47.06% | 75.49% | 23.53% | 42.16% | ||||
| 23 | Deb-Chatterji et al. [36] | 2020 | Prospective | 1700 | EVT ± IVT | 73.7 ± 13.8 | 48.94% | 50.58% | 74.82% | 20.92% | 32.64% | 40.78% | 15.4% | |
| 24 | Kaesmacher et al. [37] | 2019 | Prospective | 1532 | EVT ± IVT | |||||||||
| 25 | Baek et al. [38] | 2015 | Prospective | 120 | IVT | 66.2 ± 13.2 | 63.33% | 60.83% | 22.50% | 30.00% | 37.5% | 18.33% | ||
| Overall | 11,404 | 65.2 ± 14.3 8720/11,404 | 51.9% 4828/9305 | 50.58% 1888/3733 | 66.00% 5650/8561 | 22.48% 1925/8565 | 34.37% 2484/7228 | 42.19% 3168/7508 | 11.94% 203/1726 | 20.05% 1488/7422 | ||||
| Outcome | Study Groups | Effect Measure | Summary Effects | Heterogeneity ¶ | Heterogeneity Variance Estimate † | |||
|---|---|---|---|---|---|---|---|---|
| Value (95% CI) | Tests of Overall Effect | Cochran’s Q | I2 ≤ * | p-Value | τ2 ≤ | |||
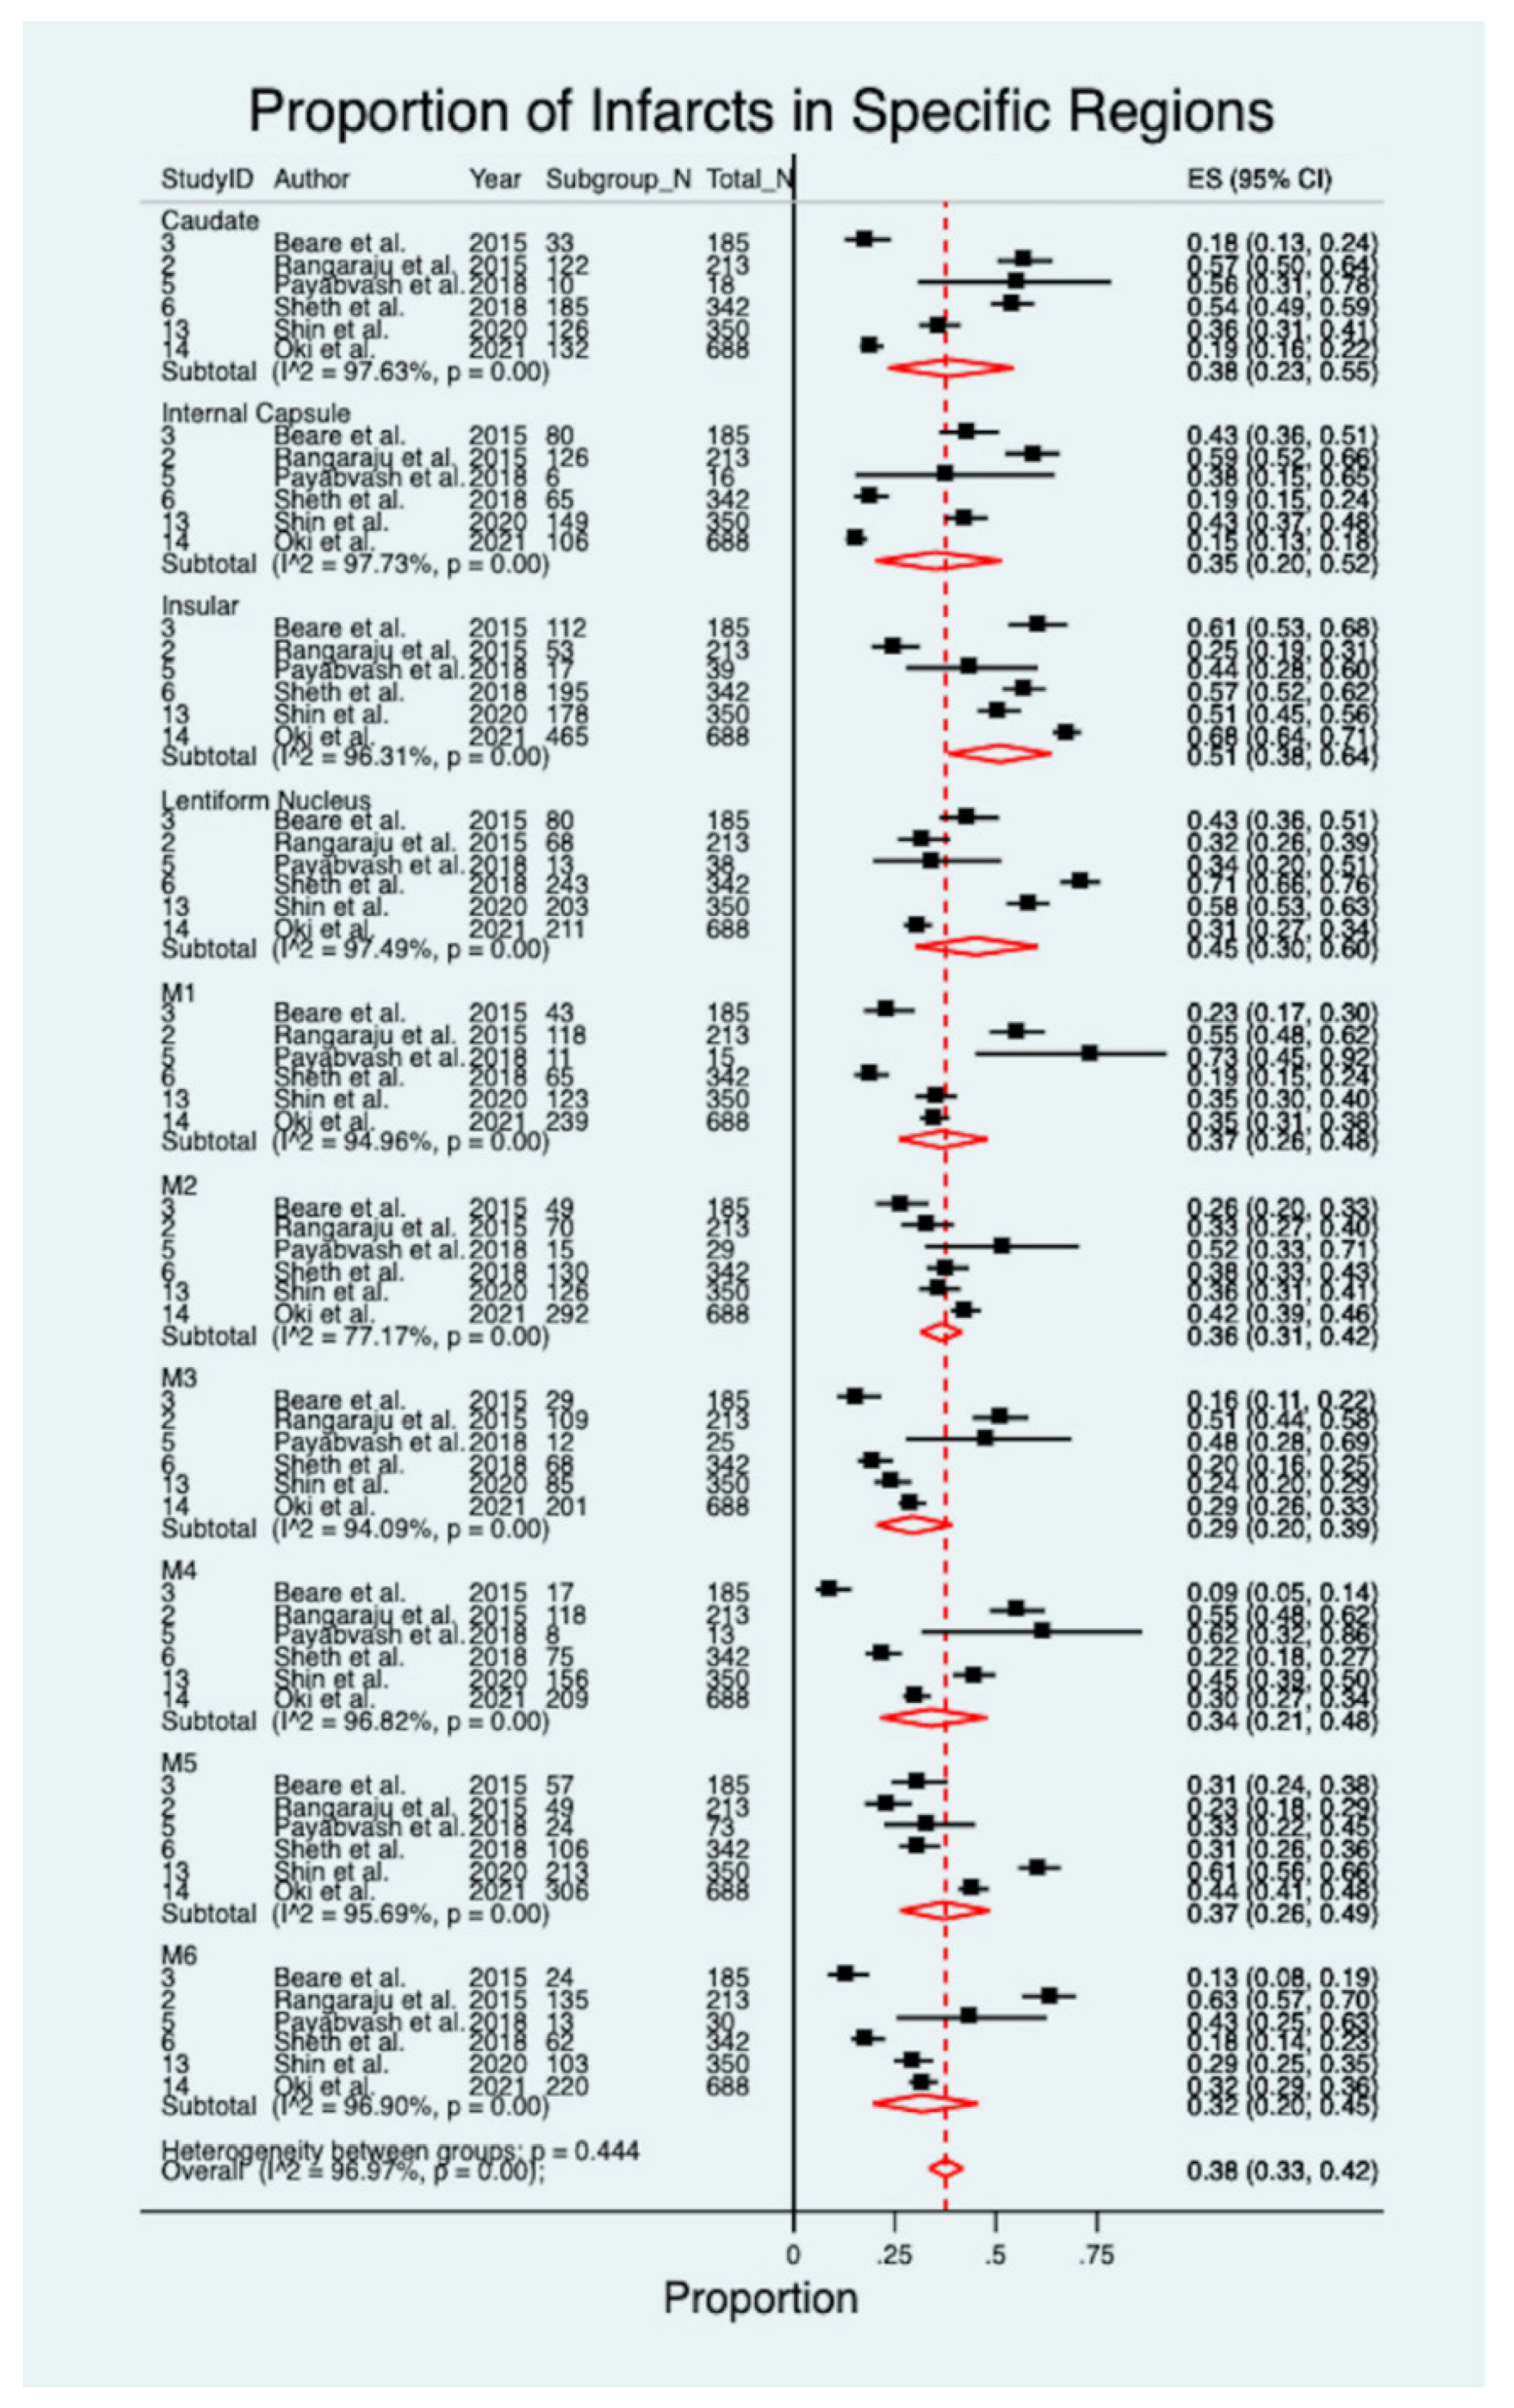
| Prevalence of infarcts in ASPECTS region | Overall | Prevalence | 0.38 (0.33–0.42) | z = 27.91, p < 0.001 | 1945.44 | 96.97% | p < 0.001 | 8.93 |
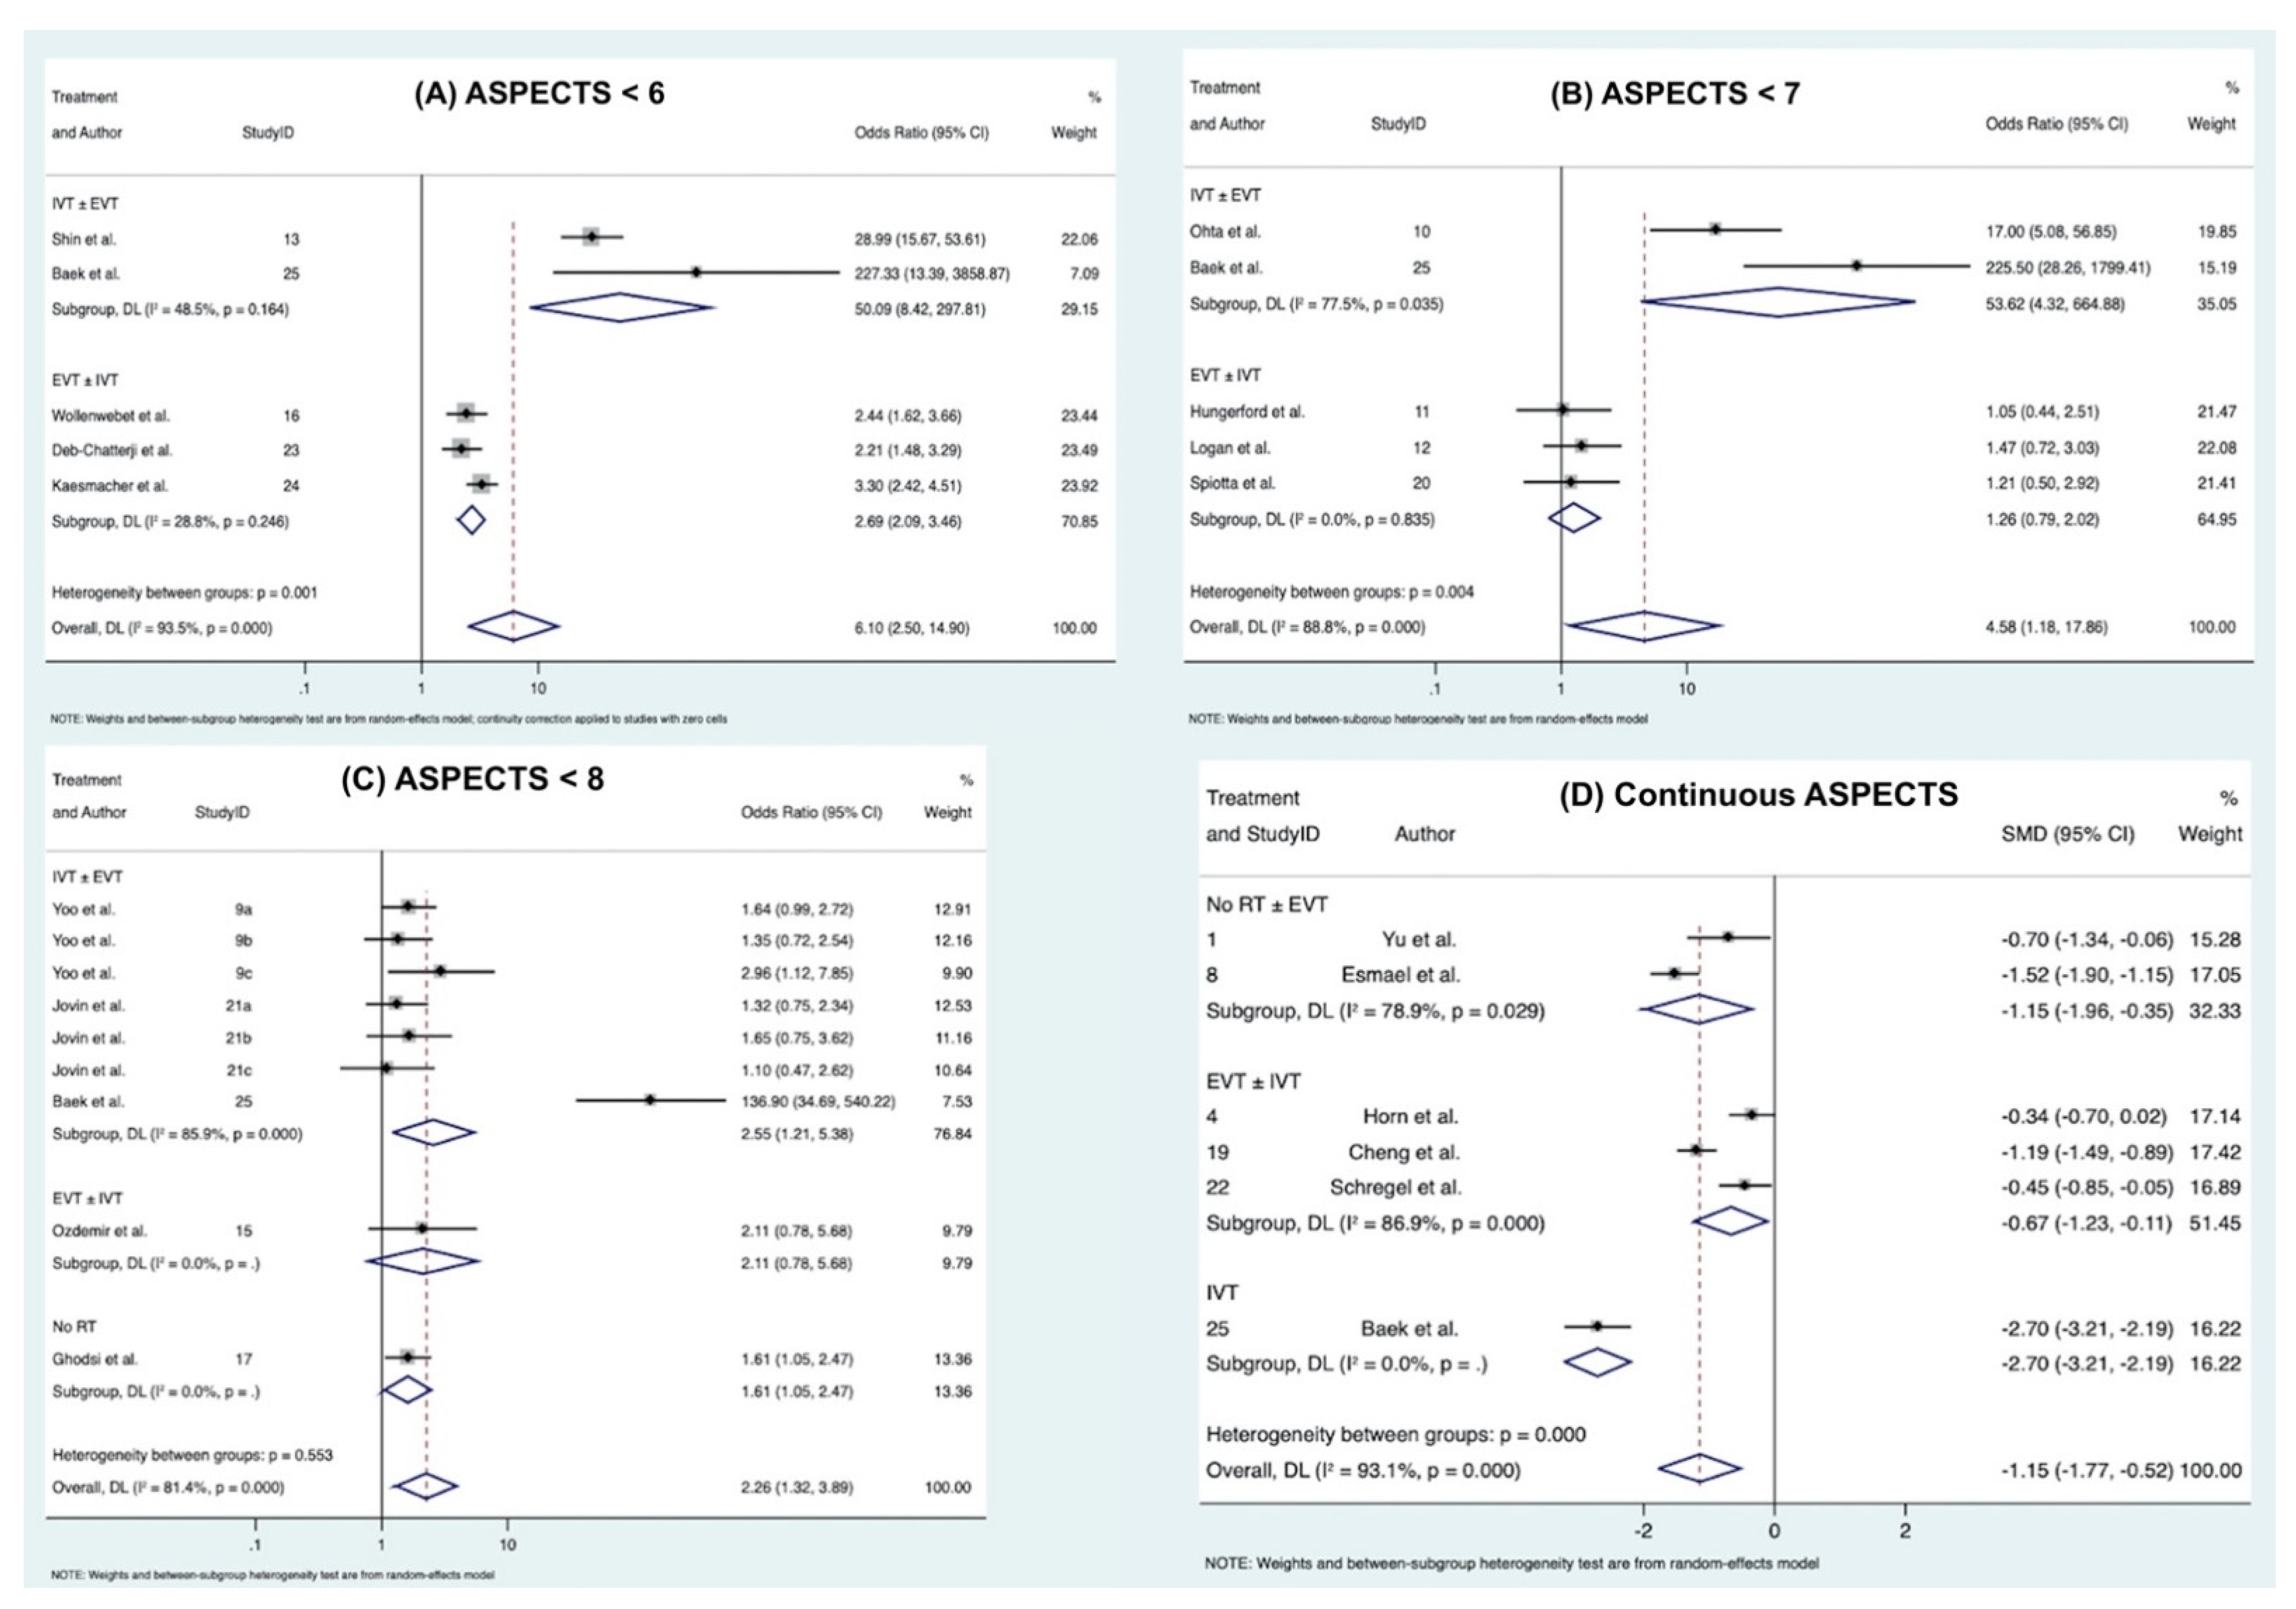
| ASPECTS < 6 with poor functional outcome | Overall | OR | 6.10 (2.50–14.90) | z = 3.97, p < 0.0001 | 62.01 | 93.5% | p < 0.0001 | 57.19 |
| IVT ± EVT | 28.99 (15.67–53.61) | z = 10.73, p < 0.0001 | 0.00 | N/A | NG $ | |||
| EVT ± IVT | 2.69 (2.09–3.46) | z = 7.67, p < 0.0001 | 2.81 | 28.8% | p = 0.246 | |||
| IVT | 227.33(13.39–3858.87) | z = 3.76, p < 0.0001 | 0.00 | NA | NG $ | |||
| ASPECTS < 7 with poor functional outcome | Overall | OR | 4.58 (1.18–17.86) | z = 2.19, p = 0.028 | 35.84 | 88.4% | p < 0.0001 | 35.48 |
| IVT ± EVT | 17.00 (5.08–56.85) | z = 4.60, p < 0.0001 | 0.00 | N/A | NG $ | |||
| EVT ± IVT | 1.26 (0.79–2.02) | z = 0.97, p = 0.330 | 0.36 | 0.0% | p = 0.835 | |||
| IVT | 225.50(28.26–1799.41) | z = 5.11, p < 0.0001 | 0.00 | NA | NG $ | |||
| ASPECTS < 8 with poor functional outcome | Overall | OR | 2.26 (1.32–3.89) | z = 2.95, p = 0.003 | 42.90 | 81.4% | p < 0.0001 | 1.95 |
| IVT ± EVT | 1.49 (1.02–2.18) | z = 2.06, p = 0.040 | 0.30 | 0.0% | p = 0.582 | |||
| IVT + EVT | 1.46 (0.89–2.39) | z = 1.52, p = 0.129 | 0.15 | 0.0% | p = 0.699 | |||
| EVT ± IVT | 2.11 (0.78–5.68) | z = 1.47, p= 0.140 | 0.00 | NA | NG $ | |||
| IVT | 7.25 (0.59–88.54) | z = 1.55, p = 0.1.21 | 34.32 | 94.2% | p < 0.0001 | |||
| No RT | 1.61 (1.05–2.47) | z = 2.21, p = 0.027 | 0.00 | NA | NG $ | |||
| ASPECTS with poor functional outcome | Overall | SMD | −1.15 (−1.77–−0.52) | z = −3.57, p < 0.0001 | 71.97 | 93.1% | p < 0.00001 | 52.52 |
| EVT± IVT | −0.77 (−1.60–−0.06) | z = −1.82, p = 0.069 | 12.55 | 92.0% | p < 0.00001 | |||
| EVT | −0.45 (−0.85–−0.05) | z = −2.19, p = 0.029 | 0.00 | NA | NG $ | |||
| IVT | −2.70 (−3.21–−2.19) | z = −10.39, p < 0.0001 | 0.00 | NA | NG $ | |||
| No RT | −1.52 (−1.90–−1.15) | z = 7.97, p < 0.0001 | 0.00 | NA | NG $ | |||
| No RT ± EVT | −0.70 (−1.34–−0.06) | z = −2.14, p = 0.032 | 0.00 | NA | NG $ | |||
3.2. Prevalence of ASPECTS Region in AIS Patients
| ASPECTS Region | Study ID | Author | Year | Crude Prevalence | Random Pooled Estimate | 95% CI | Significance Test | Heterogeneity Statistic | Heterogeneity p Value | I2 |
|---|---|---|---|---|---|---|---|---|---|---|
| Caudate | Overall | 0.34 | 0.38 | 0.23–0.55 | z = 7.48, p < 0.001 | 211.00 | p < 0.001 | 97.63% | ||
| 2 | Rangaraju et al. [17] | 2015 | 0.57 | 0.57 | 0.50–0.64 | |||||
| 3 | Beare et al. [18] | 2015 | 0.18 | 0.18 | 0.13–0.24 | |||||
| 5 | Payabvash et al. [20] | 2018 | 0.56 | 0.56 | 0.31–0.78 | |||||
| 6 | Sheth et al. [15] | 2018 | 0.52 | 0.52 | 0.47–0.57 | |||||
| 13 | Shin et al. [27] | 2020 | 0.36 | 0.36 | 0.31–0.41 | |||||
| 14 | Oki et al. [28] | 2021 | 0.19 | 0.19 | 0.16–0.22 | |||||
| Internal Capsule | Overall | 0.30 | 0.35 | 0.20–0.52 | z = 6.88, p < 0.001 | 219.84 | p < 0.001 | 97.73% | ||
| 2 | Rangaraju et al. [17] | 2015 | 0.59 | 0.59 | 0.52–0.66 | |||||
| 3 | Beare et al. [18] | 2015 | 0.43 | 0.43 | 0.36–0.51 | |||||
| 5 | Payabvash et al. [20] | 2018 | 0.38 | 0.38 | 0.15–0.65 | |||||
| 6 | Sheth et al. [15] | 2018 | 0.19 | 0.19 | 0.15–0.24 | |||||
| 13 | Shin et al. [27] | 2020 | 0.43 | 0.43 | 0.37–0.48 | |||||
| 14 | Oki et al. [28] | 2021 | 0.15 | 0.15 | 0.13–0.18 | |||||
| Insular | Overall | 0.56 | 0.51 | 0.38–0.64 | z = 11.61, p < 0.001 | 135.49 | p < 0.001 | 96.31% | ||
| 2 | Rangaraju et al. [39] | 2015 | 0.25 | 0.25 | 0.19–0.31 | |||||
| 3 | Beare et al. [18] | 2015 | 0.61 | 0.61 | 0.53–0.68 | |||||
| 5 | Payabvash et al. [20] | 2018 | 0.44 | 0.44 | 0.28–0.60 | |||||
| 6 | Sheth et al. [15] | 2018 | 0.55 | 0.55 | 0.50–0.60 | |||||
| 13 | Shin et al. [27] | 2020 | 0.51 | 0.51 | 0.45–0.56 | |||||
| 14 | Oki et al. [28] | 2021 | 0.68 | 0.68 | 0.64–0.71 | |||||
| Lentiform Nucleus | Overall | 0.45 | 0.45 | 0.30–0.60 | z = 8.86, p < 0.001 | 198.91 | p < 0.001 | 97.49% | ||
| 2 | Rangaraju et al. [17] | 2015 | 0.32 | 0.32 | 0.26–0.39 | |||||
| 3 | Beare et al. [18] | 2015 | 0.43 | 0.43 | 0.36–0.51 | |||||
| 5 | Payabvash et al. [20] | 2018 | 0.34 | 0.34 | 0.20–0.51 | |||||
| 6 | Sheth et al. [15] | 2018 | 0.70 | 0.70 | 0.65–0.75 | |||||
| 13 | Shin et al. [27] | 2020 | 0.58 | 0.58 | 0.53–0.63 | |||||
| 14 | Oki et al. [28] | 2021 | 0.31 | 0.45 | 0.30–0.60 | |||||
| M1 | Overall | 0.33 | 0.37 | 0.26–0.48 | z = 10.32, p < 0.001 | 99.22 | p < 0.001 | 94.96% | ||
| 2 | Rangaraju et al. [17] | 2015 | 0.55 | 0.55 | 0.48–0.62 | |||||
| 3 | Beare et al. [18] | 2015 | 0.23 | 0.23 | 0.17–0.30 | |||||
| 5 | Payabvash et al. [20] | 2018 | 0.73 | 0.73 | 0.45–0.92 | |||||
| 6 | Sheth et al. [15] | 2018 | 0.19 | 0.19 | 0.15–0.24 | |||||
| 13 | Shin et al. [27] | 2020 | 0.35 | 0.35 | 0.30–0.30 | |||||
| 14 | Oki et al. [28] | 2021 | 0.35 | 0.35 | 0.31–0.38 | |||||
| M2 | Overall | 0.38 | 0.36 | 0.31–0.42 | z = 22.27, p < 0.001 | 21.90 | p < 0.001 | 77.17% | ||
| 2 | Rangaraju et al. [17] | 2015 | 0.33 | 0.33 | 0.27–0.40 | |||||
| 3 | Beare et al. [18] | 2015 | 0.26 | 0.26 | 0.20–0.33 | |||||
| 5 | Payabvash et al. [20] | 2018 | 0.52 | 0.52 | 0.33–0.71 | |||||
| 6 | Sheth et al. [15] | 2018 | 0.38 | 0.38 | 0.33–0.43 | |||||
| 13 | Shin et al. [27] | 2020 | 0.36 | 0.36 | 0.31–0.41 | |||||
| 14 | Oki et al. [28] | 2021 | 0.42 | 0.42 | 0.39–0.46 | |||||
| M3 | Overall | 0.28 | 0.29 | 0.20–0.39 | z = 10.06, p < 0.001 | 84.63 | p < 0.001 | 94.09% | ||
| 2 | Rangaraju et al. [17] | 2015 | 0.51 | 0.51 | 0.44–0.58 | |||||
| 3 | Beare et al. [18] | 2015 | 0.16 | 0.16 | 0.11–0.22 | |||||
| 5 | Payabvash et al. [20] | 2018 | 0.48 | 0.48 | 0.28–0.69 | |||||
| 6 | Sheth et al. [15] | 2018 | 0.20 | 0.20 | 0.16–0.25 | |||||
| 13 | Shin et al. [27] | 2020 | 0.24 | 0.24 | 0.20–0.29 | |||||
| 14 | Oki et al. [28] | 2021 | 0.15 | 0.18 | 0.12–0.27 | |||||
| M4 | Overall | 0.33 | 0.34 | 0.21–0.48 | z = 7.83, p < 0.001 | 157.09 | p < 0.001 | 96.82% | ||
| 2 | Rangaraju et al. [17] | 2015 | 0.55 | 0.55 | 0.48–0.62 | |||||
| 3 | Beare et al. [18] | 2015 | 0.09 | 0.09 | 0.05–0.14 | |||||
| 5 | Payabvash et al. [20] | 2018 | 0.62 | 0.62 | 0.32–0.86 | |||||
| 6 | Sheth et al. [15] | 2018 | 0.22 | 0.22 | 0.18–0.27 | |||||
| 13 | Shin et al. [27] | 2020 | 0.45 | 0.45 | 0.39–0.50 | |||||
| 14 | Oki et al. [28] | 2021 | 0.30 | 0.30 | 0.27–0.34 | |||||
| M5 | Overall | 0.41 | 0.37 | 0.26–0.49 | z = 10.53, p < 0.001 | 115.99 | p < 0.001 | 95.69% | ||
| 2 | Rangaraju et al. [17] | 2015 | 0.23 | 0.23 | 0.18–0.29 | |||||
| 3 | Beare et al. [18] | 2015 | 0.31 | 0.31 | 0.24–0.38 | |||||
| 5 | Payabvash et al. [20] | 2018 | 0.33 | 0.33 | 0.22–0.45 | |||||
| 6 | Sheth et al. [15] | 2018 | 0.30 | 0.30 | 0.25–0.35 | |||||
| 13 | Shin et al. [27] | 2020 | 0.61 | 0.61 | 0.56–0.66 | |||||
| 14 | Oki et al. [28] | 2021 | 0.44 | 0.44 | 0.41–0.48 | |||||
| M6 | Overall | 0.31 | 0.32 | 0.20–0.45 | z = 7.80, p < 0.001 | 161.28 | p < 0.001 | 96.90% | ||
| 2 | Rangaraju et al. [17] | 2015 | 0.63 | 0.63 | 0.57–0.70 | |||||
| 3 | Beare et al. [18] | 2015 | 0.13 | 0.13 | 0.08–0.19 | |||||
| 5 | Payabvash et al. [20] | 2018 | 0.43 | 0.43 | 0.25–0.63 | |||||
| 6 | Sheth et al. [15] | 2018 | 0.28 | 0.28 | 0.23–0.33 | |||||
| 13 | Shin et al. [27] | 2020 | 0.29 | 0.29 | 0.25–0.35 | |||||
| 14 | Oki et al. [28] | 2021 | 0.32 | 0.32 | 0.29–0.36 | |||||
| Overall ASPECTS Region | 0.37 | 0.38 | 0.33–0.42 | z = 27.91, p < 0.001 | 1945.44 | p < 0.001 | 96.97% | |||
| Between Subgroups | 8.93 | p = 0.44 | ||||||||
3.3. Association of Region-Specific ASPECTS and Laterality with Functional Outcome at 90 Days
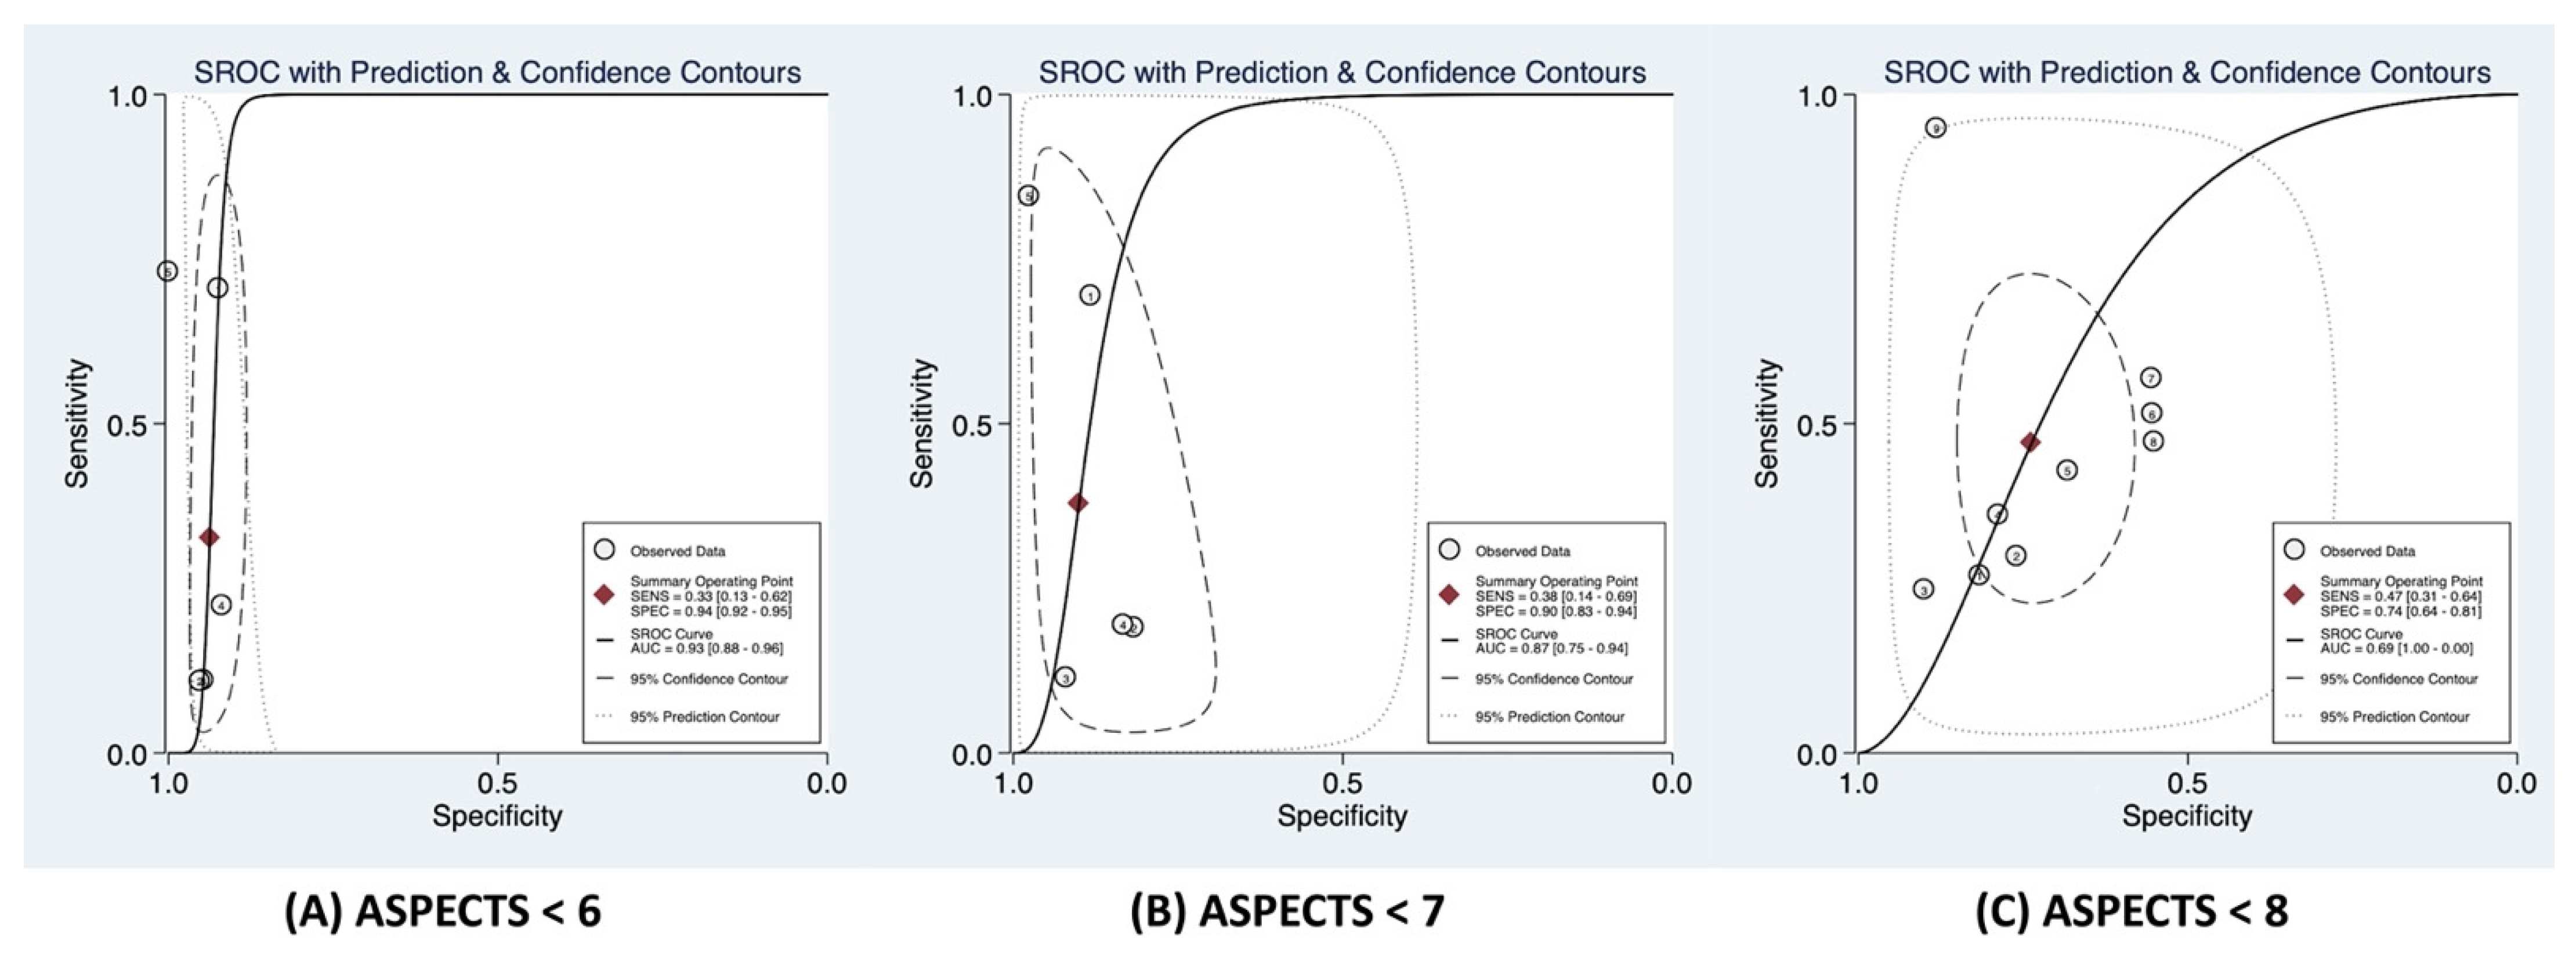
3.4. Association of ASPECTS < 6 with Functional Outcome at 90 Days
3.5. Association of ASPECTS < 7 with Functional Outcome at 90 Days
3.6. Association of ASPECTS < 8 with Functional Outcome at 90 Days
3.7. Association of Continuous ASPECTS with Functional Outcome at 90 Days
4. Discussion
4.1. Infarct Location
4.2. ASPECTS Value
4.3. Limitations
5. Conclusions
Supplementary Materials
Author Contributions
Funding
Institutional Review Board Statement
Informed Consent Statement
Data Availability Statement
Conflicts of Interest
References
- Badhiwala, J.H.; Nassiri, F.; Alhazzani, W.; Selim, M.H.; Farrokhyar, F.; Spears, J.; Kulkarni, A.V.; Singh, S.; Alqahtani, A.; Rochwerg, B.; et al. Endovascular Thrombectomy for Acute Ischemic Stroke: A Meta-analysis. JAMA 2015, 314, 1832–1843. [Google Scholar] [CrossRef] [PubMed] [Green Version]
- Campbell, B.C.; Mitchell, P.J.; Kleinig, T.J.; Dewey, H.M.; Churilov, L.; Yassi, N.; Yan, B.; Dowling, R.J.; Parsons, M.W.; Oxley, T.J.; et al. Endovascular therapy for ischemic stroke with perfusion-imaging selection. N. Engl. J. Med. 2015, 372, 1009–1018. [Google Scholar] [CrossRef] [Green Version]
- Goyal, M.; Demchuk, A.M.; Menon, B.K.; Eesa, M.; Rempel, J.L.; Thornton, J.; Roy, D.; Jovin, T.G.; Willinsky, R.A.; Sapkota, B.L.; et al. Randomized assessment of rapid endovascular treatment of ischemic stroke. N. Engl. J. Med. 2015, 372, 1019–1030. [Google Scholar] [CrossRef] [Green Version]
- Saver, J.L.; Goyal, M.; Bonafe, A.; Diener, H.C.; Levy, E.I.; Pereira, V.M.; Albers, G.W.; Cognard, C.; Cohen, D.J.; Hacke, W.; et al. Stent-retriever thrombectomy after intravenous t-PA vs. t-PA alone in stroke. N. Engl. J. Med. 2015, 372, 2285–2295. [Google Scholar] [CrossRef] [Green Version]
- Berkhemer, O.A.; Fransen, P.S.; Beumer, D.; van den Berg, L.A.; Lingsma, H.F.; Yoo, A.J.; Schonewille, W.J.; Vos, J.A.; Nederkoorn, P.J.; Wermer, M.J.; et al. A randomized trial of intraarterial treatment for acute ischemic stroke. N. Engl. J. Med. 2015, 372, 11–20. [Google Scholar] [CrossRef] [Green Version]
- Jovin, T.G.; Chamorro, A.; Cobo, E.; de Miquel, M.A.; Molina, C.A.; Rovira, A.; San Roman, L.; Serena, J.; Abilleira, S.; Ribo, M.; et al. Thrombectomy within 8 hours after symptom onset in ischemic stroke. N. Engl. J. Med. 2015, 372, 2296–2306. [Google Scholar] [CrossRef] [Green Version]
- Bracard, S.; Ducrocq, X.; Mas, J.L.; Soudant, M.; Oppenheim, C.; Moulin, T.; Guillemin, F.; Investigators, T. Mechanical thrombectomy after intravenous alteplase versus alteplase alone after stroke (THRACE): A randomised controlled trial. Lancet Neurol. 2016, 15, 1138–1147. [Google Scholar] [CrossRef]
- Katyal, A.; Bhaskar, S. CTP-guided reperfusion therapy in acute ischemic stroke: A meta-analysis. Acta Neurol. Scand. 2021, 143, 355–366. [Google Scholar] [CrossRef] [PubMed]
- Powers, W.J.; Rabinstein, A.A.; Ackerson, T.; Adeoye, O.M.; Bambakidis, N.C.; Becker, K.; Biller, J.; Brown, M.; Demaerschalk, B.M.; Hoh, B.; et al. 2018 Guidelines for the Early Management of Patients With Acute Ischemic Stroke: A Guideline for Healthcare Professionals From the American Heart Association/American Stroke Association. Stroke 2018, 49, e46–e110. [Google Scholar] [CrossRef]
- Seyedsaadat, S.M.; Neuhaus, A.A.; Pederson, J.M.; Brinjikji, W.; Rabinstein, A.A.; Kallmes, D.F. Location-Specific ASPECTS Paradigm in Acute Ischemic Stroke: A Systematic Review and Meta-Analysis. AJNR Am. J. Neuroradiol. 2020, 41, 2020–2026. [Google Scholar] [CrossRef] [PubMed]
- Wu, O.; Cloonan, L.; Mocking, S.J.; Bouts, M.J.; Copen, W.A.; Cougo-Pinto, P.T.; Fitzpatrick, K.; Kanakis, A.; Schaefer, P.W.; Rosand, J.; et al. Role of Acute Lesion Topography in Initial Ischemic Stroke Severity and Long-Term Functional Outcomes. Stroke 2015, 46, 2438–2444. [Google Scholar] [CrossRef] [PubMed] [Green Version]
- Shen, Y.-W.; Zhang, X.-M.; Lv, M.; Chen, L.; Qin, T.-J.; Wang, F.; Yang, J.; Liu, P.-J.; Yang, J. Utility of gonadotropin-releasing hormone agonists for prevention of chemotherapy-induced ovarian damage in premenopausal women with breast cancer: A systematic review and meta-analysis. Onco Targets Ther. 2015, 8, 3349–3359. [Google Scholar] [CrossRef] [PubMed] [Green Version]
- Saunders, R.; Struys, M.; Pollock, R.F.; Mestek, M.; Lightdale, J.R. Patient safety during procedural sedation using capnography monitoring: A systematic review and meta-analysis. BMJ Open. 2017, 7, e013402. [Google Scholar] [CrossRef] [PubMed] [Green Version]
- Wan, X.; Wang, W.; Liu, J.; Tong, T. Estimating the sample mean and standard deviation from the sample size, median, range and/or interquartile range. BMC Med. Res. Methodol. 2014, 14, 135. [Google Scholar] [CrossRef] [PubMed] [Green Version]
- Sheth, S.A.; Malhotra, K.; Liebeskind, D.S.; Liang, C.W.; Yoo, A.J.; Jahan, R.; Nogueira, R.G.; Pereira, V.; Gralla, J.; Albers, G.; et al. Regional Contributions to Poststroke Disability in Endovascular Therapy. Interv. Neurol. 2018, 7, 533–543. [Google Scholar] [CrossRef] [PubMed]
- Yu, F.; Bai, X.; Sha, A.; Zhang, M.; Shan, Y.; Guo, D.; Dmytriw, A.A.; Ma, Q.; Jiao, L.; Lu, J. Multimodal CT Imaging Characteristics in Predicting Prognosis of Wake-Up Stroke. Front. Neurol. 2021, 12, 702088. [Google Scholar] [CrossRef]
- Rangaraju, S.; Streib, C.; Aghaebrahim, A.; Jadhav, A.; Frankel, M.; Jovin, T.G. Relationship Between Lesion Topology and Clinical Outcome in Anterior Circulation Large Vessel Occlusions. Stroke 2015, 46, 1787–1792. [Google Scholar] [CrossRef] [Green Version]
- Beare, R.; Chen, J.; Phan, T.G.; Collaboration, V.I.-A. Googling Stroke ASPECTS to Determine Disability: Exploratory Analysis from VISTA-Acute Collaboration. PLoS ONE 2015, 10, e0125687. [Google Scholar] [CrossRef] [PubMed]
- van Horn, N.; Kniep, H.; Leischner, H.; McDonough, R.; Deb-Chatterji, M.; Broocks, G.; Thomalla, G.; Brekenfeld, C.; Fiehler, J.; Hanning, U.; et al. Predictors of poor clinical outcome despite complete reperfusion in acute ischemic stroke patients. J. Neurointerv. Surg. 2021, 13, 14–18. [Google Scholar] [CrossRef]
- Payabvash, S.; Benson, J.C.; Tyan, A.E.; Taleb, S.; McKinney, A.M. Multivariate Prognostic Model of Acute Stroke Combining Admission Infarct Location and Symptom Severity: A Proof-of-Concept Study. J. Stroke Cerebrovasc. Dis. 2018, 27, 936–944. [Google Scholar] [CrossRef]
- Rosso, C.; Blanc, R.; Ly, J.; Samson, Y.; Lehéricy, S.; Gory, B.; Marnat, G.; Mazighi, M.; Consoli, A.; Labreuche, J.; et al. Impact of infarct location on functional outcome following endovascular therapy for stroke. J. Neurol. Neurosurg. Psychiatry 2019, 90, 313–319. [Google Scholar] [CrossRef] [PubMed] [Green Version]
- Esmael, A.; Elsherief, M.; Eltoukhy, K. Predictive Value of the Alberta Stroke Program Early CT Score (ASPECTS) in the Outcome of the Acute Ischemic Stroke and Its Correlation with Stroke Subtypes, NIHSS, and Cognitive Impairment. Stroke Res. Treat. 2021, 2021, 5935170. [Google Scholar] [CrossRef] [PubMed]
- Yoo, A.J.; Berkhemer, O.A.; Fransen, P.S.S.; van den Berg, L.A.; Beumer, D.; Lingsma, H.F.; Schonewille, W.J.; Sprengers, M.E.S.; van den Berg, R.; van Walderveen, M.A.A.; et al. Effect of baseline Alberta Stroke Program Early CT Score on safety and efficacy of intra-arterial treatment: A subgroup analysis of a randomised phase 3 trial (MR CLEAN). Lancet Neurol. 2016, 15, 685–694. [Google Scholar] [CrossRef]
- Ohta, T.; Morimoto, M.; Okada, K.; Fukuda, M.; Onishi, H.; Masahira, N.; Matsuoka, T.; Tsuno, T.; Takemura, M. Mechanical thrombectomy in anterior circulation occlusion could be more effective than medical management even in low DWI-ASPECTS patients. Neurol. Med. Chir. 2018, 58, 156–163. [Google Scholar] [CrossRef] [PubMed] [Green Version]
- Hungerford, J.P.; Hyer, M.; Turk, A.S.; Turner, R.D.; Chaudry, M.I.; Fargen, K.M.; Spiotta, A.M. Impact of ASPECT scores and infarct distribution on outcomes among patients undergoing thrombectomy for acute ischemic stroke with the ADAPT technique. J. Neurointerv. Surg. 2017, 9, 823–829. [Google Scholar] [CrossRef] [PubMed]
- Logan, C.; Maingard, J.; Phan, K.; Motyer, R.; Barras, C.; Looby, S.; Brennan, P.; O’Hare, A.; Brooks, D.M.; Chandra, R.V.; et al. Borderline Alberta Stroke Programme Early CT Score Patients with Acute Ischemic Stroke Due to Large Vessel Occlusion May Find Benefit with Endovascular Thrombectomy. World Neurosurg. 2018, 110, e653–e658. [Google Scholar] [CrossRef]
- Shin, D.H.; Shin, D.J.; Kim, J.R. Do All ASPECT Score Regions have the Same Predictive Power for Functional Outcomes? J. Stroke Cerebrovasc. Dis. 2020, 29, 104516. [Google Scholar] [CrossRef]
- Oki, Y.; Sakakibara, F.; Uchida, K.; Kageyama, H.; Yasaka, M.; Toyoda, K.; Mori, E.; Hirano, T.; Hamasaki, T.; Yamagami, H.; et al. ASPECTS-Region-Dependent Functional Outcomes after Endovascular Therapy in Patients with Cardioembolic Stroke. J. Stroke Cerebrovasc. Dis. 2021, 30, 105814. [Google Scholar] [CrossRef]
- Ozdemir, O.; Giray, S.; Arlier, Z.; Baş, D.F.; Inanc, Y.; Colak, E. Predictors of a Good Outcome after Endovascular Stroke Treatment with Stent Retrievers. Sci. World. J. 2015, 2015, 403726. [Google Scholar] [CrossRef] [Green Version]
- Wollenweber, F.A.; Tiedt, S.; Alegiani, A.; Alber, B.; Bangard, C.; Berrouschot, J.; Bode, F.J.; Boeckh-Behrens, T.; Bohner, G.; Bormann, A.; et al. Functional Outcome Following Stroke Thrombectomy in Clinical Practice. Stroke 2019, 50, 2500–2506. [Google Scholar] [CrossRef]
- Ghodsi, H.; Abouei Mehrizi, M.A.; Khoshdel, A.R.; Shekarchi, B. Evaluation of combining Alberta Stroke Program Early CT Score (ASPECTS) with mean platelet volume, plateletcrit, and platelet count in predicting short- and long-term prognosis of patients with acute ischemic stroke. Clin. Neurol. Neurosurg. 2021, 208, 106830. [Google Scholar] [CrossRef] [PubMed]
- Seyedsaadat, S.M.; Neuhaus, A.A.; Nicholson, P.J.; Polley, E.C.; Hilditch, C.A.; Mihal, D.C.; Krings, T.; Benson, J.; Mark, I.; Kallmes, D.F.; et al. Differential Contribution of ASPECTS Regions to Clinical Outcome after Thrombectomy for Acute Ischemic Stroke. AJNR Am. J. Neuroradiol. 2021, 42, 1104–1108. [Google Scholar] [CrossRef] [PubMed]
- Cheng, Z.; Geng, X.; Rajah, G.B.; Gao, J.; Ma, L.; Li, F.; Du, H.; Ding, Y. NIHSS Consciousness Score Combined with ASPECTS is a Favorable Predictor of Functional Outcome post Endovascular Recanalization in Stroke Patients. Aging Dis. 2021, 12, 415–424. [Google Scholar] [CrossRef]
- Spiotta, A.M.; Vargas, J.; Hawk, H.; Turner, R.; Chaudry, M.I.; Battenhouse, H.; Turk, A.S. Impact of the ASPECT scores and distribution on outcome among patients undergoing thrombectomy for acute ischemic stroke. J. Neurointerv. Surg. 2015, 7, 551–558. [Google Scholar] [CrossRef] [PubMed]
- Schregel, K.; Tsogkas, I.; Peter, C.; Zapf, A.; Behme, D.; Schnieder, M.; Maier, I.L.; Liman, J.; Knauth, M.; Psychogios, M.N. Outcome Prediction Using Perfusion Parameters and Collateral Scores of Multi-Phase and Single-Phase CT Angiography in Acute Stroke: Need for One, Two, Three, or Thirty Scans? J. Stroke 2018, 20, 362–372. [Google Scholar] [CrossRef] [Green Version]
- Deb-Chatterji, M.; Pinnschmidt, H.; Flottmann, F.; Leischner, H.; Broocks, G.; Alegiani, A.; Brekenfeld, C.; Fiehler, J.; Gerloff, C.; Thomalla, G. Predictors of independent outcome of thrombectomy in stroke patients with large baseline infarcts in clinical practice: A multicenter analysis. J. Neurointerv. Surg. 2020, 12, 1064–1068. [Google Scholar] [CrossRef]
- Kaesmacher, J.; Chaloulos-Iakovidis, P.; Panos, L.; Mordasini, P.; Michel, P.; Hajdu, S.D.; Ribo, M.; Requena, M.; Maegerlein, C.; Friedrich, B.; et al. Mechanical Thrombectomy in Ischemic Stroke Patients With Alberta Stroke Program Early Computed Tomography Score 0–5. Stroke 2019, 50, 880–888. [Google Scholar] [CrossRef]
- Baek, J.H.; Kim, K.; Lee, Y.-B.; Park, K.-H.; Park, H.-M.; Shin, D.-J.; Sung, Y.H.; Shin, D.H.; Bang, O.Y. Predicting Stroke Outcome Using Clinical- versus Imaging-based Scoring System. J. Stroke Cerebrovasc. Dis. 2015, 24, 642–648. [Google Scholar] [CrossRef]
- Ravindran, A.V.; Killingsworth, M.C.; Bhaskar, S. Cerebral collaterals in acute ischaemia: Implications for acute ischaemic stroke patients receiving reperfusion therapy. Eur. J. Neurosci. 2021, 53, 1238–1261. [Google Scholar] [CrossRef]
- Türe, U.; Yaşargil, M.G.; Al-Mefty, O.; Yaşargil, D.C. Arteries of the insula. J. Neurosurg. 2000, 92, 676–687. [Google Scholar] [CrossRef]
- Mejdoubi, M.; Calviere, L.; Boot, B. Isolated Insular Infarction following Successful Intravenous Thrombolysis of Middle Cerebral Artery Strokes. Eur. Neurol. 2009, 61, 308–310. [Google Scholar] [CrossRef] [PubMed]
- Arnold, M.; Slezak, A.; El-Koussy, M.; Lüdi, R.; Findling, O.; Mono, M.L.; Heldner, M.R.; Fischer, U.; Mordasini, P.; Schroth, G.; et al. Occlusion Location of Middle Cerebral Artery Stroke and Outcome after Endovascular Treatment. Eur. Neurol. 2015, 74, 315–321. [Google Scholar] [CrossRef] [PubMed] [Green Version]
- Cheng, B.; Forkert, N.D.; Zavaglia, M.; Hilgetag, C.C.; Golsari, A.; Siemonsen, S.; Fiehler, J.; Pedraza, S.; Puig, J.; Cho, T.-H.; et al. Influence of Stroke Infarct Location on Functional Outcome Measured by the Modified Rankin Scale. Stroke 2014, 45, 1695–1702. [Google Scholar] [CrossRef] [PubMed]
- Page, M.J.; McKenzie, J.E.; Bossuyt, P.M.; Boutron, I.; Hoffmann, T.C.; Mulrow, C.D.; Shamseer, L.; Tetzlaff, J.M.; Akl, E.A.; Brennan, S.E.; et al. The PRISMA 2020 statement: An updated guideline for reporting systematic reviews. BMJ 2021, 10, 89. [Google Scholar]


| ASPECTS Region | No. of Studies Included | Mean OR * ± SD | Median OR * (IQR) |
|---|---|---|---|
| Caudate | 5 | 1.97 ± 0.78 | 1.74 (1.50–2.09) |
| Internal Capsule | 6 | 4.07 ± 6.17 | 1.72 (1.03–2.58) |
| Insular | 6 | 2.00 ± 0.90 | 1.66 (1.36–2.46) |
| Lentiform Nucleus | 6 | 1.90 ± 1.05 | 1.42 (1.22–2.86) |
| M1 | 5 | 1.84 ± 1.38 | 1.75 (1.07–1.94) |
| M2 | 5 | 3.00 ± 2.00 | 1.90 (1.55–4.19) |
| M3 | 5 | 4.10 ± 5.70 | 1.33 (0.86–3.50) |
| M4 | 6 | 2.38 ± 0.91 | 2.80 (1.66–2.94) |
| M5 | 6 | 2.56 ± 0.97 | 1.84 (1.51–3.10) |
| M6 | 6 | 2.98 ± 1.68 | 2.68 (1.67–3.00) |
| ASPECTS Region | No. of Studies | Left | Right | ||
|---|---|---|---|---|---|
| Mean OR * ± SD | Median OR * (IQR) | Mean OR * ± SD | Median OR * (IQR) | ||
| Caudate | 4 | 1.67 ± 1.43 | 1.72 (0.50–2.84) | 1.84 ± 1.25 | 2.37 (0.42–2.74) |
| Internal Capsule | 4 | 2.23 ± 2.61 | 1.14 (0.80–3.66) | 1.12 ± 0.78 | 1.32 (0.63–1.62) |
| Insular | 4 | 1.49 ± 1.06 | 1.71 (0.84−2.14) | 1.49 ± 1.30 | 1.41 (0.57–2.40) |
| Lentiform Nucleus | 4 | 1.49 ± 1.12 | 1.72 (0.64–2.35) | 0.57 ± 0.46 | 0.81 (0.04–0.87) |
| M1 | 4 | 1.65 ± 1.13 | 1.44 (0.79–2.50) | 1.41 ± 1.27 | 1.09 (0.64–2.18) |
| M2 | 4 | 1.68 ± 0.51 | 1.76 (1.34–2.02) | 2.07 ± 1.40 | 2.27 (1.09–3.04) |
| M3 | 4 | 1.93 ± 1.21 | 1.98 (0.91–2.96) | 1.68 ± 2.23 | 0.75 (0.36–3.01) |
| M4 | 4 | 3.15 ± 1.88 | 2.95 (1.98–4.33) | 2.46 ± 1.19 | 2.62 (1.59–3.34) |
| M5 | 4 | 2.77 ± 0.60 | 2.73 (2.37–3.17) | 1.46 ± 1.00 | 1.69 (0.73–2.19) |
| M6 | 4 | 1.48 ± 1.17 | 1.00 (0.84–2.12) | 3.79 ± 2.69 | 4.43 (1.89–5.69) |
Publisher’s Note: MDPI stays neutral with regard to jurisdictional claims in published maps and institutional affiliations. |
© 2022 by the authors. Licensee MDPI, Basel, Switzerland. This article is an open access article distributed under the terms and conditions of the Creative Commons Attribution (CC BY) license (https://creativecommons.org/licenses/by/4.0/).
Share and Cite
Chen, S.; Spring, K.J.; Killingsworth, M.C.; Calic, Z.; Beran, R.G.; Bhaskar, S.M.M. Association of Lesion Topography with Functional Outcomes in Acute Ischemic Stroke Patients Considered for, or Receiving, Reperfusion Therapy: A Meta-Analysis. Neurol. Int. 2022, 14, 903-922. https://doi.org/10.3390/neurolint14040073
Chen S, Spring KJ, Killingsworth MC, Calic Z, Beran RG, Bhaskar SMM. Association of Lesion Topography with Functional Outcomes in Acute Ischemic Stroke Patients Considered for, or Receiving, Reperfusion Therapy: A Meta-Analysis. Neurology International. 2022; 14(4):903-922. https://doi.org/10.3390/neurolint14040073
Chicago/Turabian StyleChen, Shuyue, Kevin J. Spring, Murray C. Killingsworth, Zeljka Calic, Roy G. Beran, and Sonu M. M. Bhaskar. 2022. "Association of Lesion Topography with Functional Outcomes in Acute Ischemic Stroke Patients Considered for, or Receiving, Reperfusion Therapy: A Meta-Analysis" Neurology International 14, no. 4: 903-922. https://doi.org/10.3390/neurolint14040073