1. Introduction
Worldwide, transportation accounted for 39% of the world’s total CO
2 emissions from final use in 2022 [
1]. Despite being among the hardest hit by the COVID-19 outbreak, emissions have recently surged again because of rising demand and slow acceptance of alternative fuels. Particularly impressive is the expansion in developing and emerging economies [
1,
2]. To get transportation on track with the Net Zero Scenario [
3], a wide range of policies must be implemented to promote modal shifts to alternative fuel vehicles and to incorporate operational energy efficiency measures to reduce the carbon intensity of all transport modes.
While public transportation is essential to the ease of urban and interurban mobility and the minimization of traffic congestion and other traffic externalities, it is also the primary contributor to hazardous air pollutants. Public transportation, in particular, is a major emitter, nearly 70%, of particulate matter, PM
2.5 and PM
10, which cause lung diseases and cardiovascular illnesses [
4,
5]. Fine particle pollution is responsible for an estimated 4.2 million premature deaths annually [
4].
In Morocco, over 17 million inhabitants rely on public buses as an essential transportation means [
6], and demand for the public transportation system is predicted to rise. With more people using public transportation and more people being exposed to dangerous levels of photochemical smog and particulate matter, research into alternative fuel buses is becoming increasingly important. Currently, hybrid diesel-electric buses, battery-electric buses, and fuel-cell buses are three of the most popular alternatives proposed by the national ministry of energy in Morocco [
7]. The most thorough technique for gauging the value of these alternative fuels involves considering the full scope of their life cycle, from fuel extraction through final use.
Using the LCA framework, researchers around the world have recently begun to pay more attention to the environmental footprints associated with fuel extraction, fuel refining, and vehicle use. There have been a number of attempts to assess the energy and ecological effects of using alternative fuels in public transportation. Gabriel et al. [
8] used the GREET model and Ecoinvent life cycle inventory to conduct a comparative life cycle analysis of electric, compressed natural gas, and diesel buses in Bangkok, Thailand. It was shown that switching from diesel to electric or compressed natural gas buses will reduce human and environmental health impact by 54–55% or 37–41%, respectively, resource depletion by 88% or 80%, and lifetime expenditures by 48% or 60%. Bangkok’s 14,127 diesel buses might reduce PM
2.5 transportation emissions by 21% and 18% if converted to electric or compressed natural gas buses, respectively. Chang et al. [
9] measured the carbon footprint of different fuel buses in Tainan City, Taiwan, using ISO/TS 14,067:2013 in a case study. Liquefied natural gas buses emitted 63.14 g CO
2e per km, diesel buses 54.6, LPG buses 47.4, plug-in electric buses 37.82, and hydrogen fuel-cell buses 29.17, which makes the latter the best alternative in terms of CO
2e emissions. Iannuzzi et al. [
10] studied fuel-cell bus alternative to diesel buses in the city of Rosario, Argentina, using the input–output hybrid LCA method. The authors considered different hydrogen production processes, from grey hydrogen to green hydrogen. Jwa and Lim [
11] performed a life cycle study for lithium-ion battery-electric buses and diesel buses using the GREET model. The diesel bus and electric bus were evaluated for energy consumption and pollutants. From an energy and environmental perspective, electric buses were better than diesel buses. As for Morocco, Jelti et al. [
12] conducted an environmental LCA of diesel buses, hybrid buses, electric buses, and fuel-cell buses in the city of Oujda, using the GREET model and Ecoinvent life cycle inventory. It was found that electric and fuel-cell buses are efficient and sustainable alternatives to public transport throughout the operational phase, and their deployment in Oujda city might reduce greenhouse gas (GHG) emissions and air pollutants during the well-to-tank (WTT) and tank-to-wheel (TTW) phases.
Despite the presence of numerous city-based case studies in the literature, the parliamentary opposition parties in Morocco [
7,
13,
14] opposed the decision of switching to alternative fuel buses and state that electric propulsion changes the location of pollutant emissions to energy production sites, and especially that Morocco relies heavily on coal. Furthermore, while earlier studies focused on bus transportation in a single city, this article provides a nationwide perspective, comparing and contrasting the efficacy of alternative buses to that of conventional diesel buses. Ultimately, this research aims to investigate the energy and environmental impacts of alternative fuel buses in Morocco on a nationwide scale, from a well-to-wheel (WTW) standpoint. This paper is the first research done, on a national level, in North Africa regarding alternative fuel buses, as all countries in the region rely heavily on fossil fuels to satisfy their energy needs, in contrast to developed countries. The evaluated alternatives are hybrid diesel-electric buses, battery-electric buses, and fuel-cell buses.
2. Materials and Methods
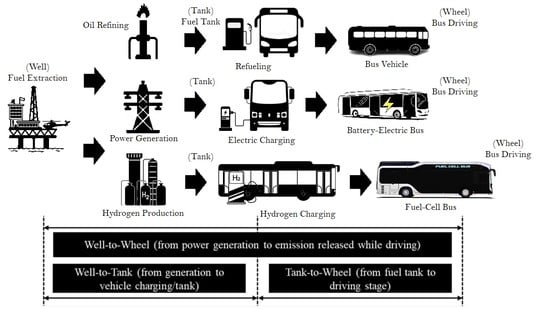
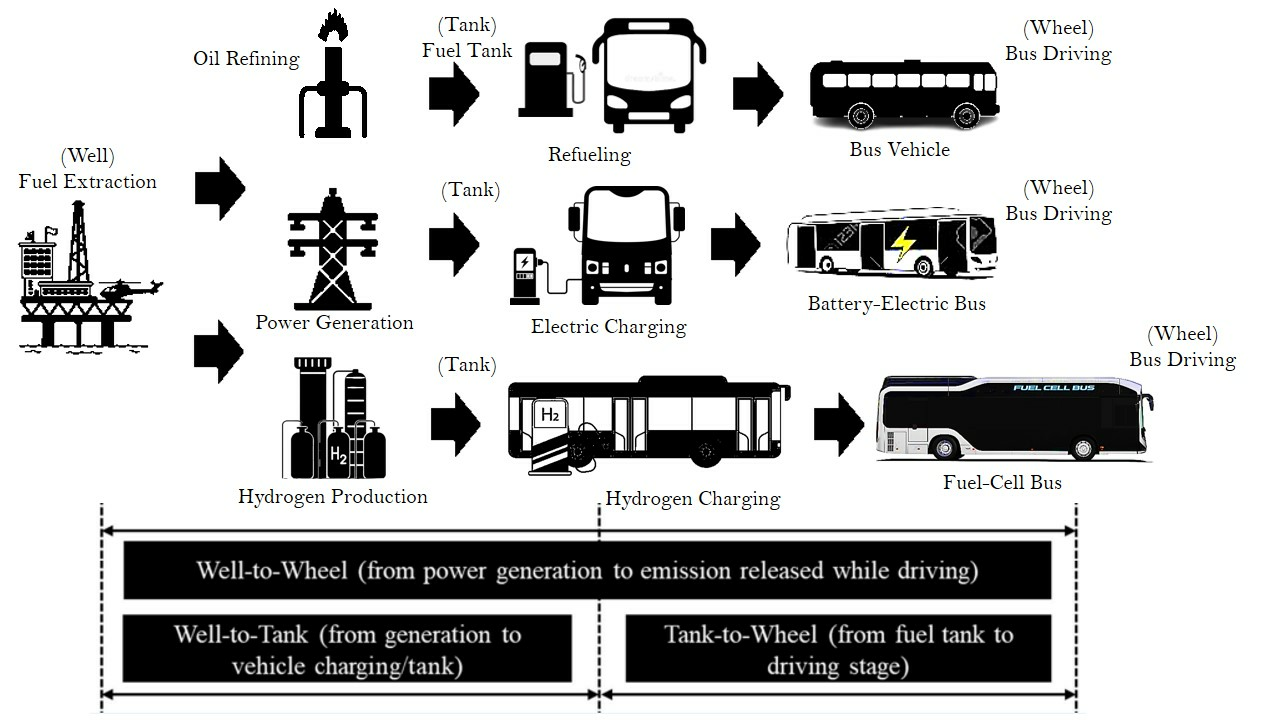
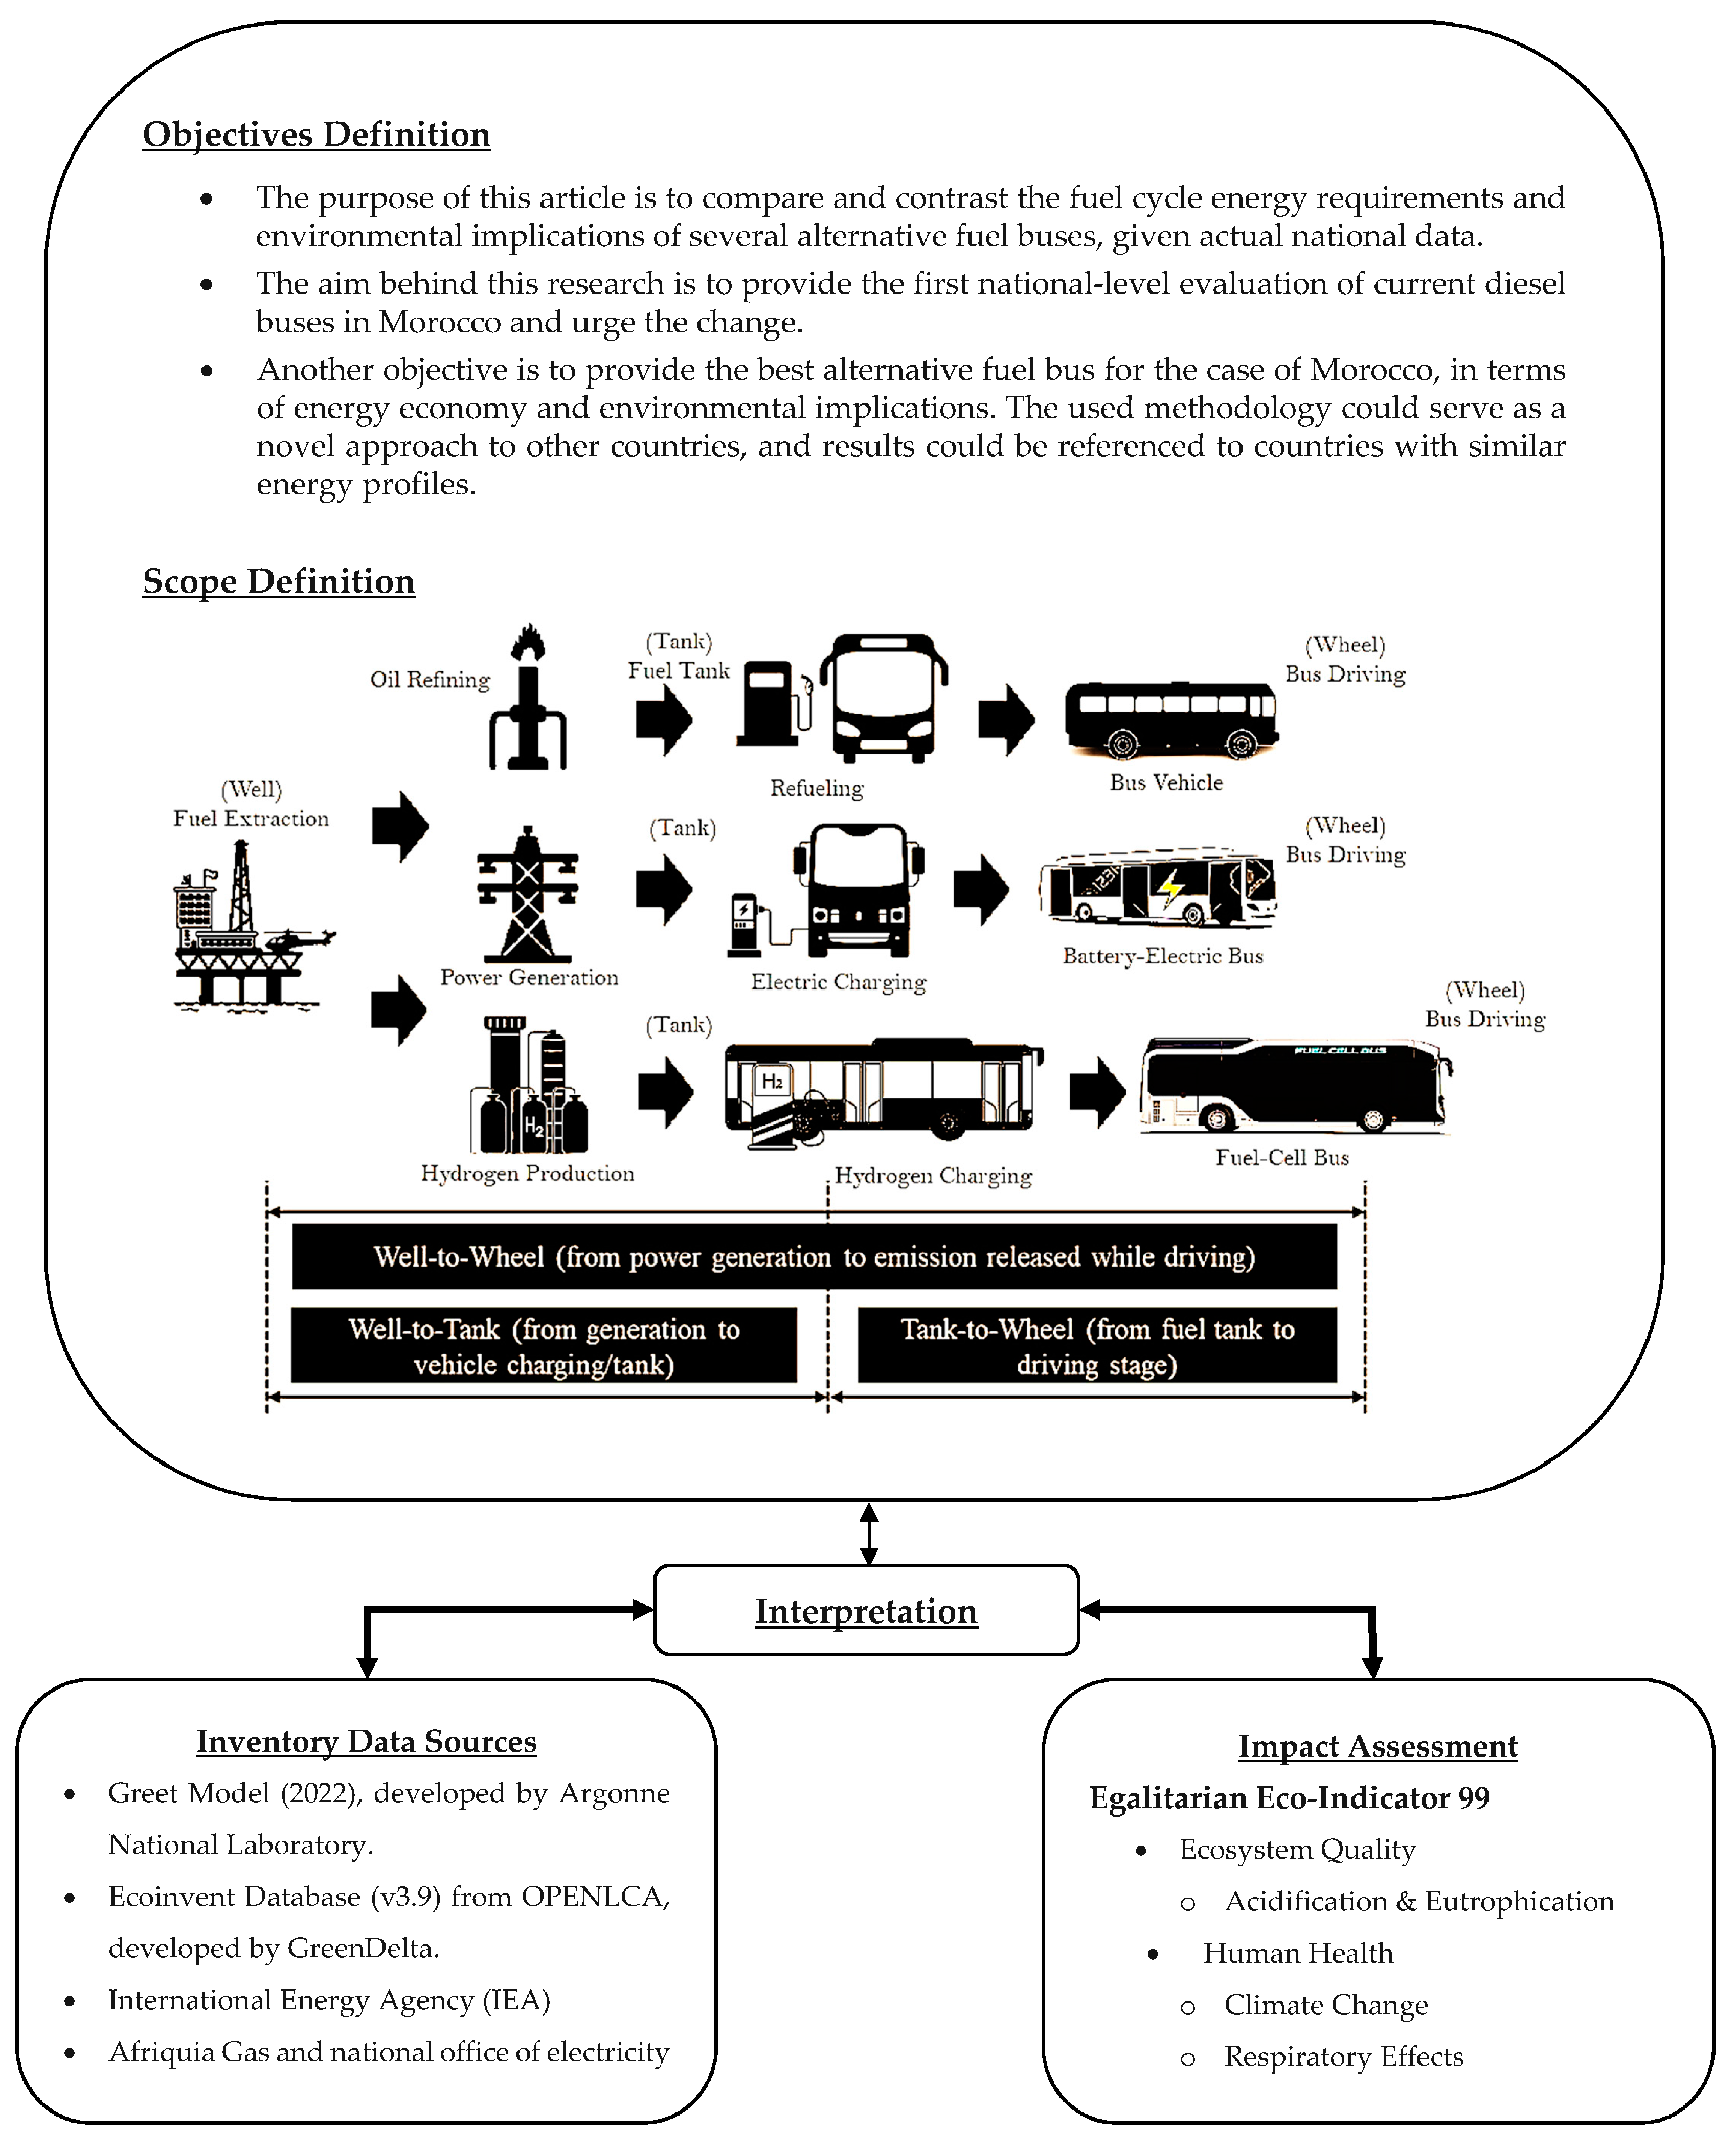
Several fuel options for city buses are analyzed, and their respective environmental impacts are quantified by means of WTW LCA. From raw material extraction and processing to power generation and vehicle operation, the full fuel lifecycle is considered in this evaluation. The ISO 14,040–14,043 standards served as the foundation for the LCA procedures shown in
Figure 1; thus, the structure shall be:
Objectives and scope;
Inventory data;
Impact assessment;
Interpretation.
2.1. Objectives and Scope
The purpose of this research is to add to the current body of knowledge by analyzing the energy and environmental implications of four different bus types over their entire life cycles: conventional diesel buses, hybrid diesel-electric buses, battery-electric buses, and fuel-cell buses, in Morocco. Considering the current bus routes and fleets in Morocco, this was done to find the best eco-friendly and energy-effective solution for public transportation. By conducting an LCA of existing EURO buses and potential bus alternatives, this article aims to fill a need in the present research, and the focus of this research goes well beyond a localized “city-level examination” to encompass a broad national evaluation with a focus on fuel cycles. To that end, authorities in Morocco might use the information in this paper to better enhance public transit in the region. We take into account the replacement of all 3217 diesel buses in Morocco, not just those owned by the government. Findings from this study in Morocco can be extrapolated to other countries across the world where diesel buses are used for public transportation.
In addition, a national-level analysis of the environmental effects of switching to alternative fuels was conducted, using data collected from the companies already running public transportation buses in Morocco to reflect the conditions under which they function in practice.
2.2. Inventory Data
The data used in this analysis were gathered from a variety of different sources. This includes (but is not limited to) (1) the Ecoinvent database version 3.9 published by the Ecoinvent Centre in the OPENLCA software (Version 1.11) developed by GreenDelta, (2) the GREET model (2022) developed by Argonne National Laboratory, (3) the International Energy Agency [
15], and (4) various stakeholders in Morocco.
The gathered documentation is geographical data, energy profile info, and bus routes and fleets findings. International impact assessment metrics, imported from Ecoinvent Centre, will be discussed in the Impact Assessment section.
2.2.1. Geographical Data
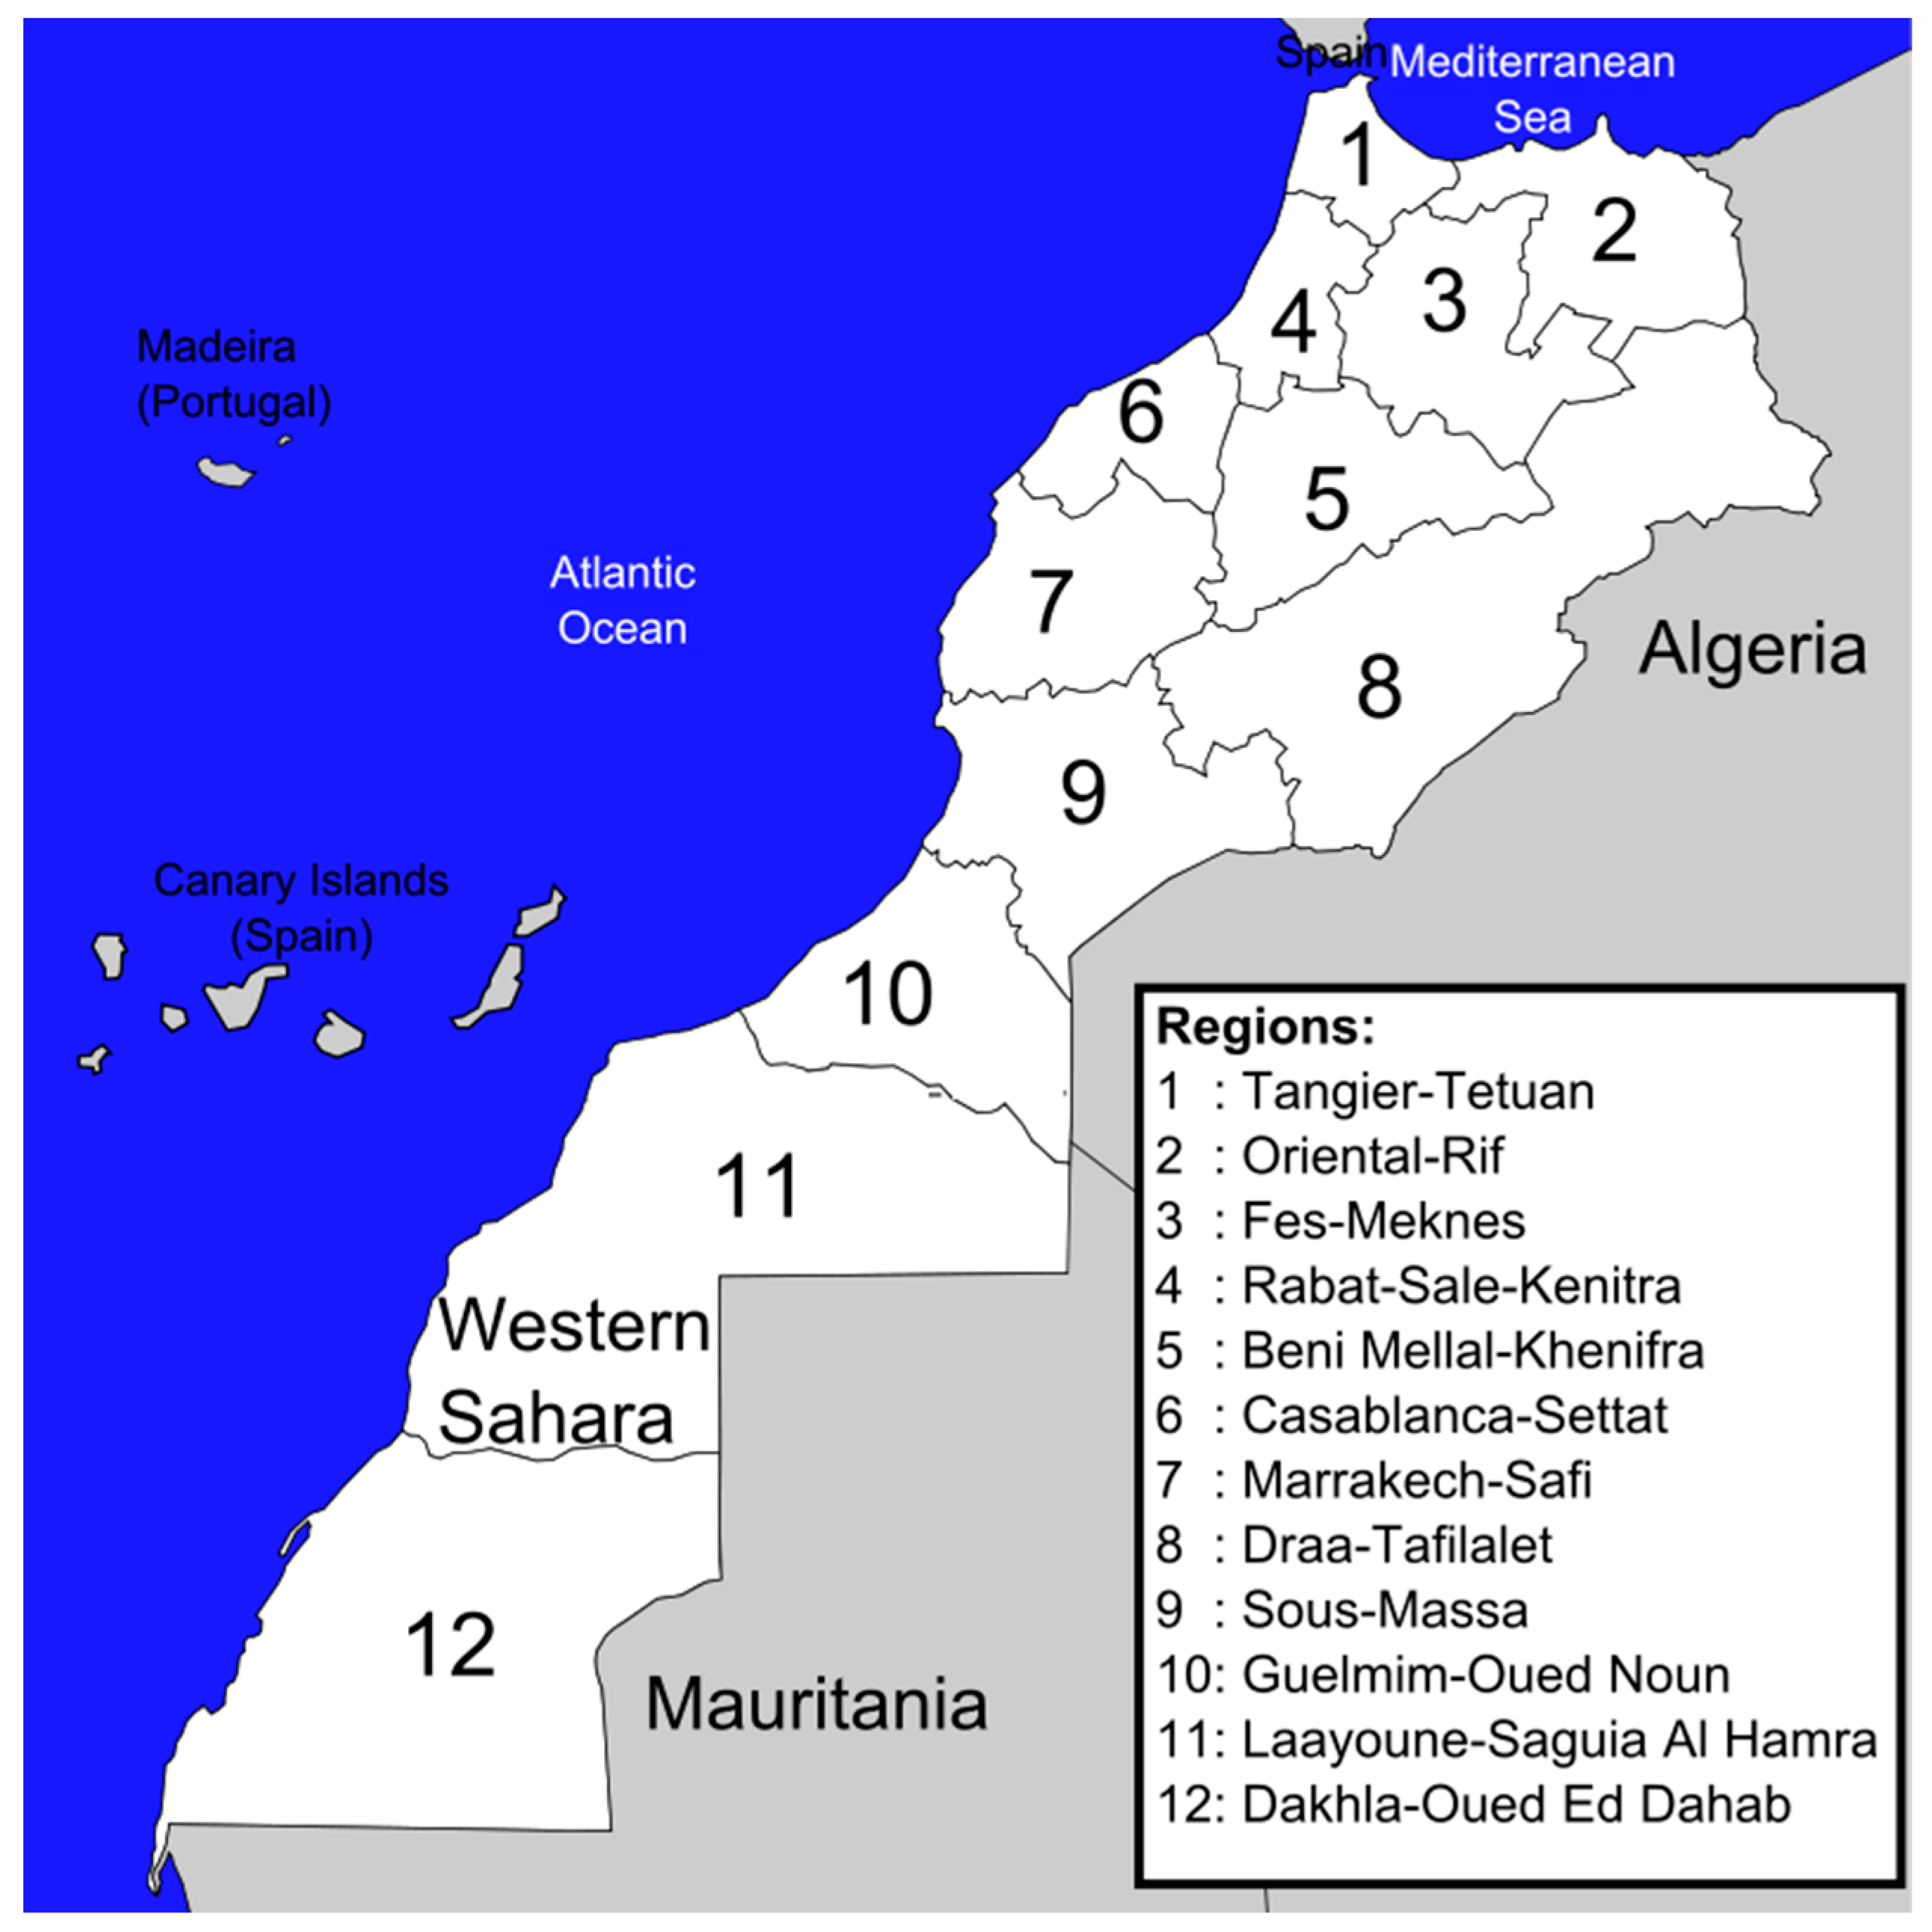
Since 2015, Morocco has formally administered 12 regions, three of which are located in Western Sahara, a territory whose sovereignty is contested. There are a total of 75 prefectures and provinces at the subnational level, further dividing the regions.
Figure 2 shows the Moroccan map subdivided into national official regions by zone code, and
Table 1 reveals the regional distributions along with the number of provinces and prefectures by region and supplement data regarding the population per region, according to the latest statistics. Additionally, approximately 23.0 million inhabitants, 62.8% of the national population, are urban, whereas 13.6 million inhabitants live in rural areas and represent 37.2% of the total population.
Figure 2.
Regional Divisions in Morocco by Zone Code [
16].
Figure 2.
Regional Divisions in Morocco by Zone Code [
16].
Table 1.
Regional Distribution in Morocco.
Table 1.
Regional Distribution in Morocco.
| Zone Code | Number of Provinces | Number of Inhabitants [17,18] |
|---|
| 1 | 8 | 3,900,365 |
| 2 | 8 | 2,505,730 |
| 3 | 9 | 4,460,667 |
| 4 | 7 | 4,962,561 |
| 5 | 5 | 2,642,554 |
| 6 | 9 | 7,596,040 |
| 7 | 8 | 4,857,033 |
| 8 | 5 | 1,712,526 |
| 9 | 6 | 2,977,128 |
| 10 | 4 | 450,486 |
| 11 | 4 | 412,005 |
| 12 | 2 | 193,127 |
| Total (Morocco) | 75 | 36,670,222 |
2.2.2. Energy Profile Information
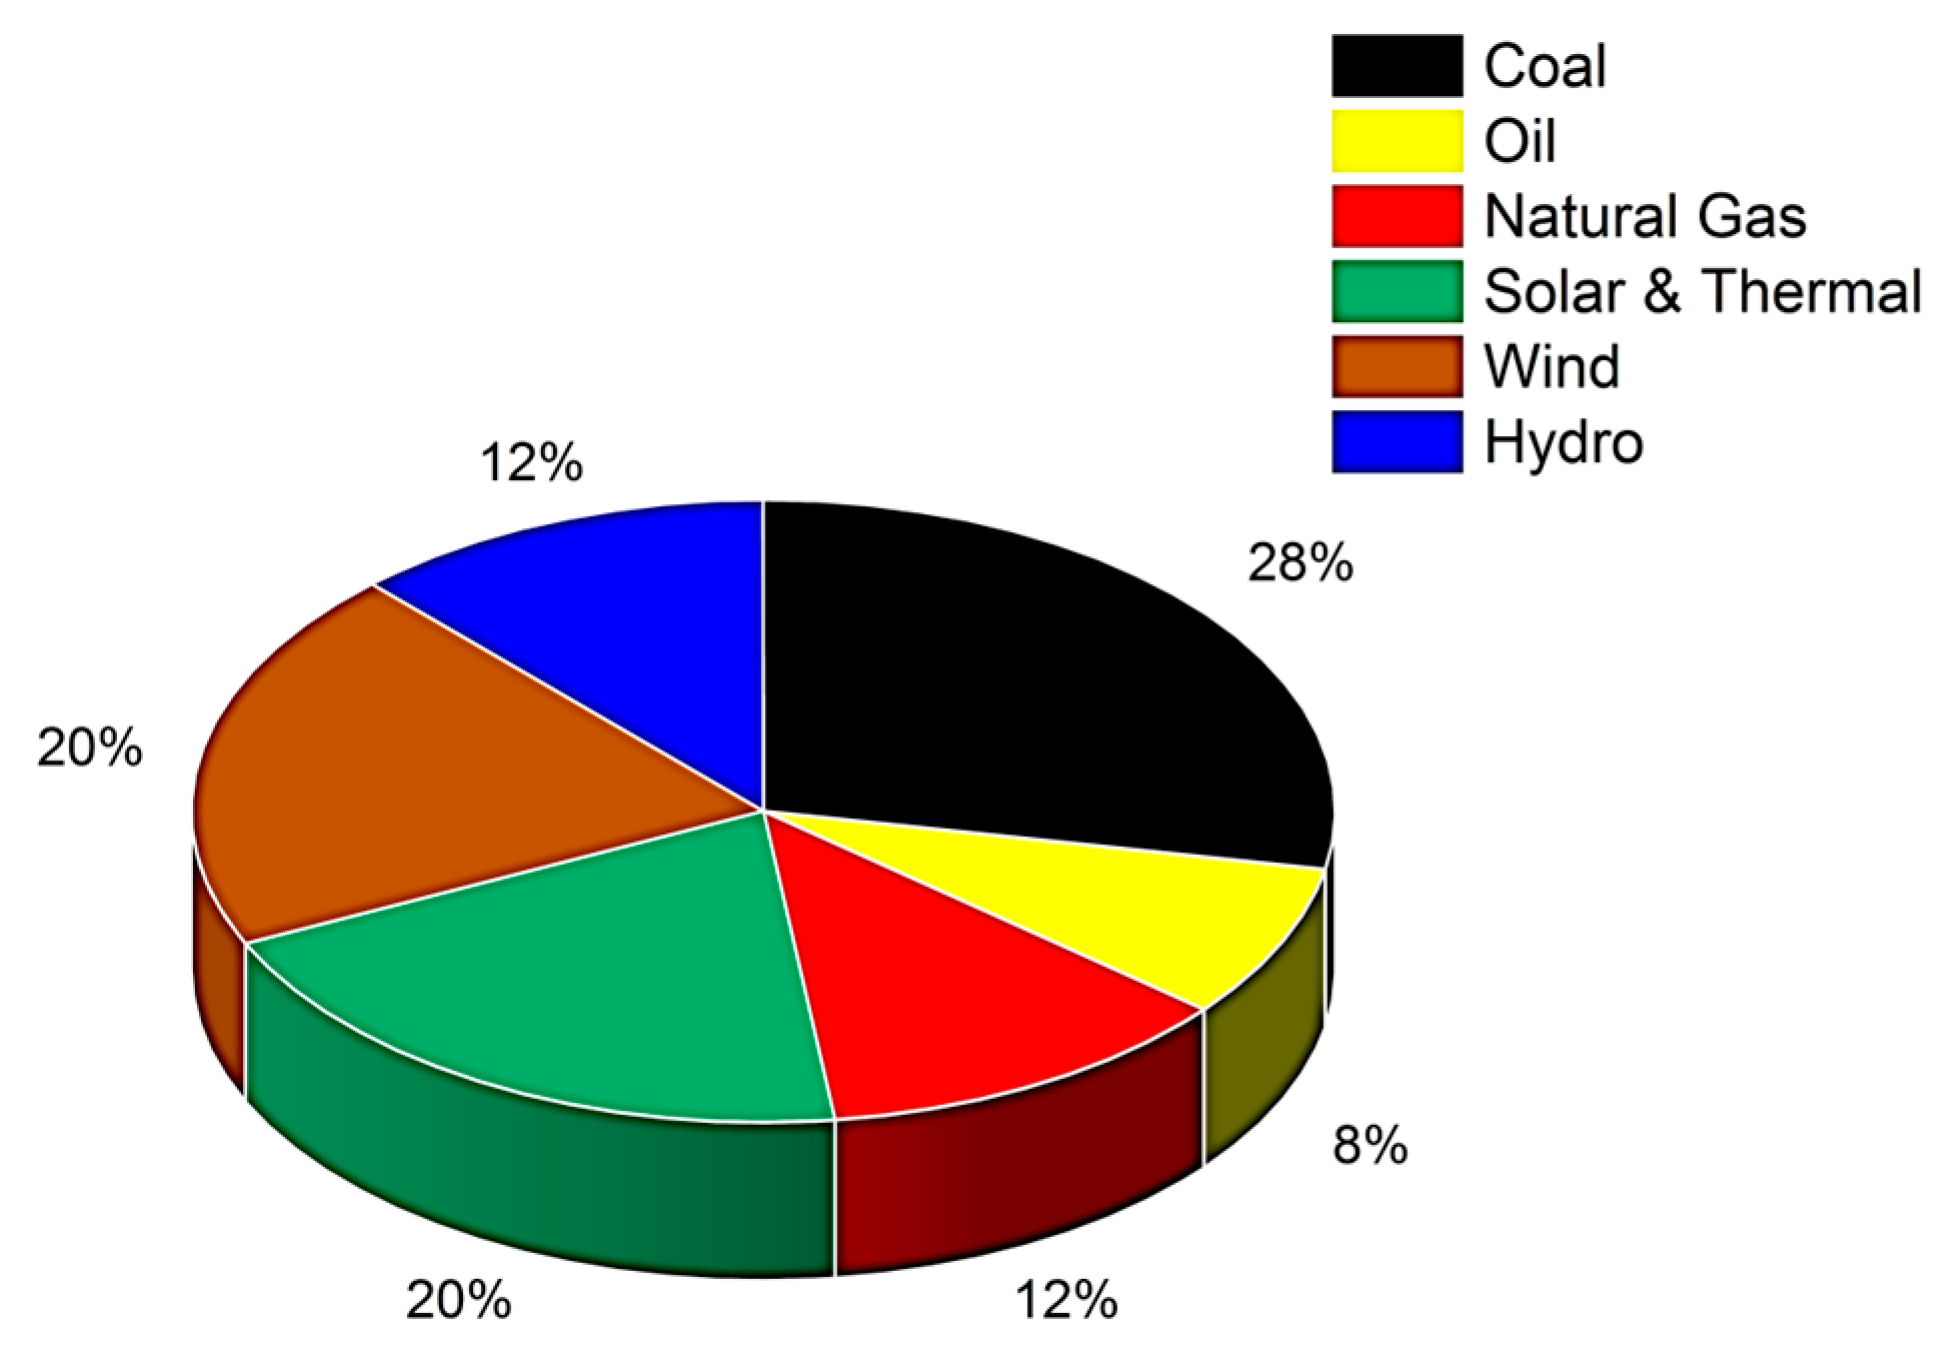
As stated in the Introduction, Morocco aims to replace all its diesel buses with electric buses in 2030; hence, the authors decided to conduct the LCA considering the electric buses charged by the Moroccan electricity generation scenario of 2030, shown in
Figure 3, published by the national authorities in their National Low Carbon Strategy of 2050 [
7], Cox et al. [
19], and the International Energy Agency [
15,
20].
The WTT process differs from one vehicle technology to another. Diesel buses are powered with diesel fuel, battery-electric buses with electricity, and fuel-cell buses with gaseous hydrogen. It is assumed that all hybrid diesel-electric buses are powered solely by diesel pumps while battery-electric buses are powered from the grid by the power generation mix shown in
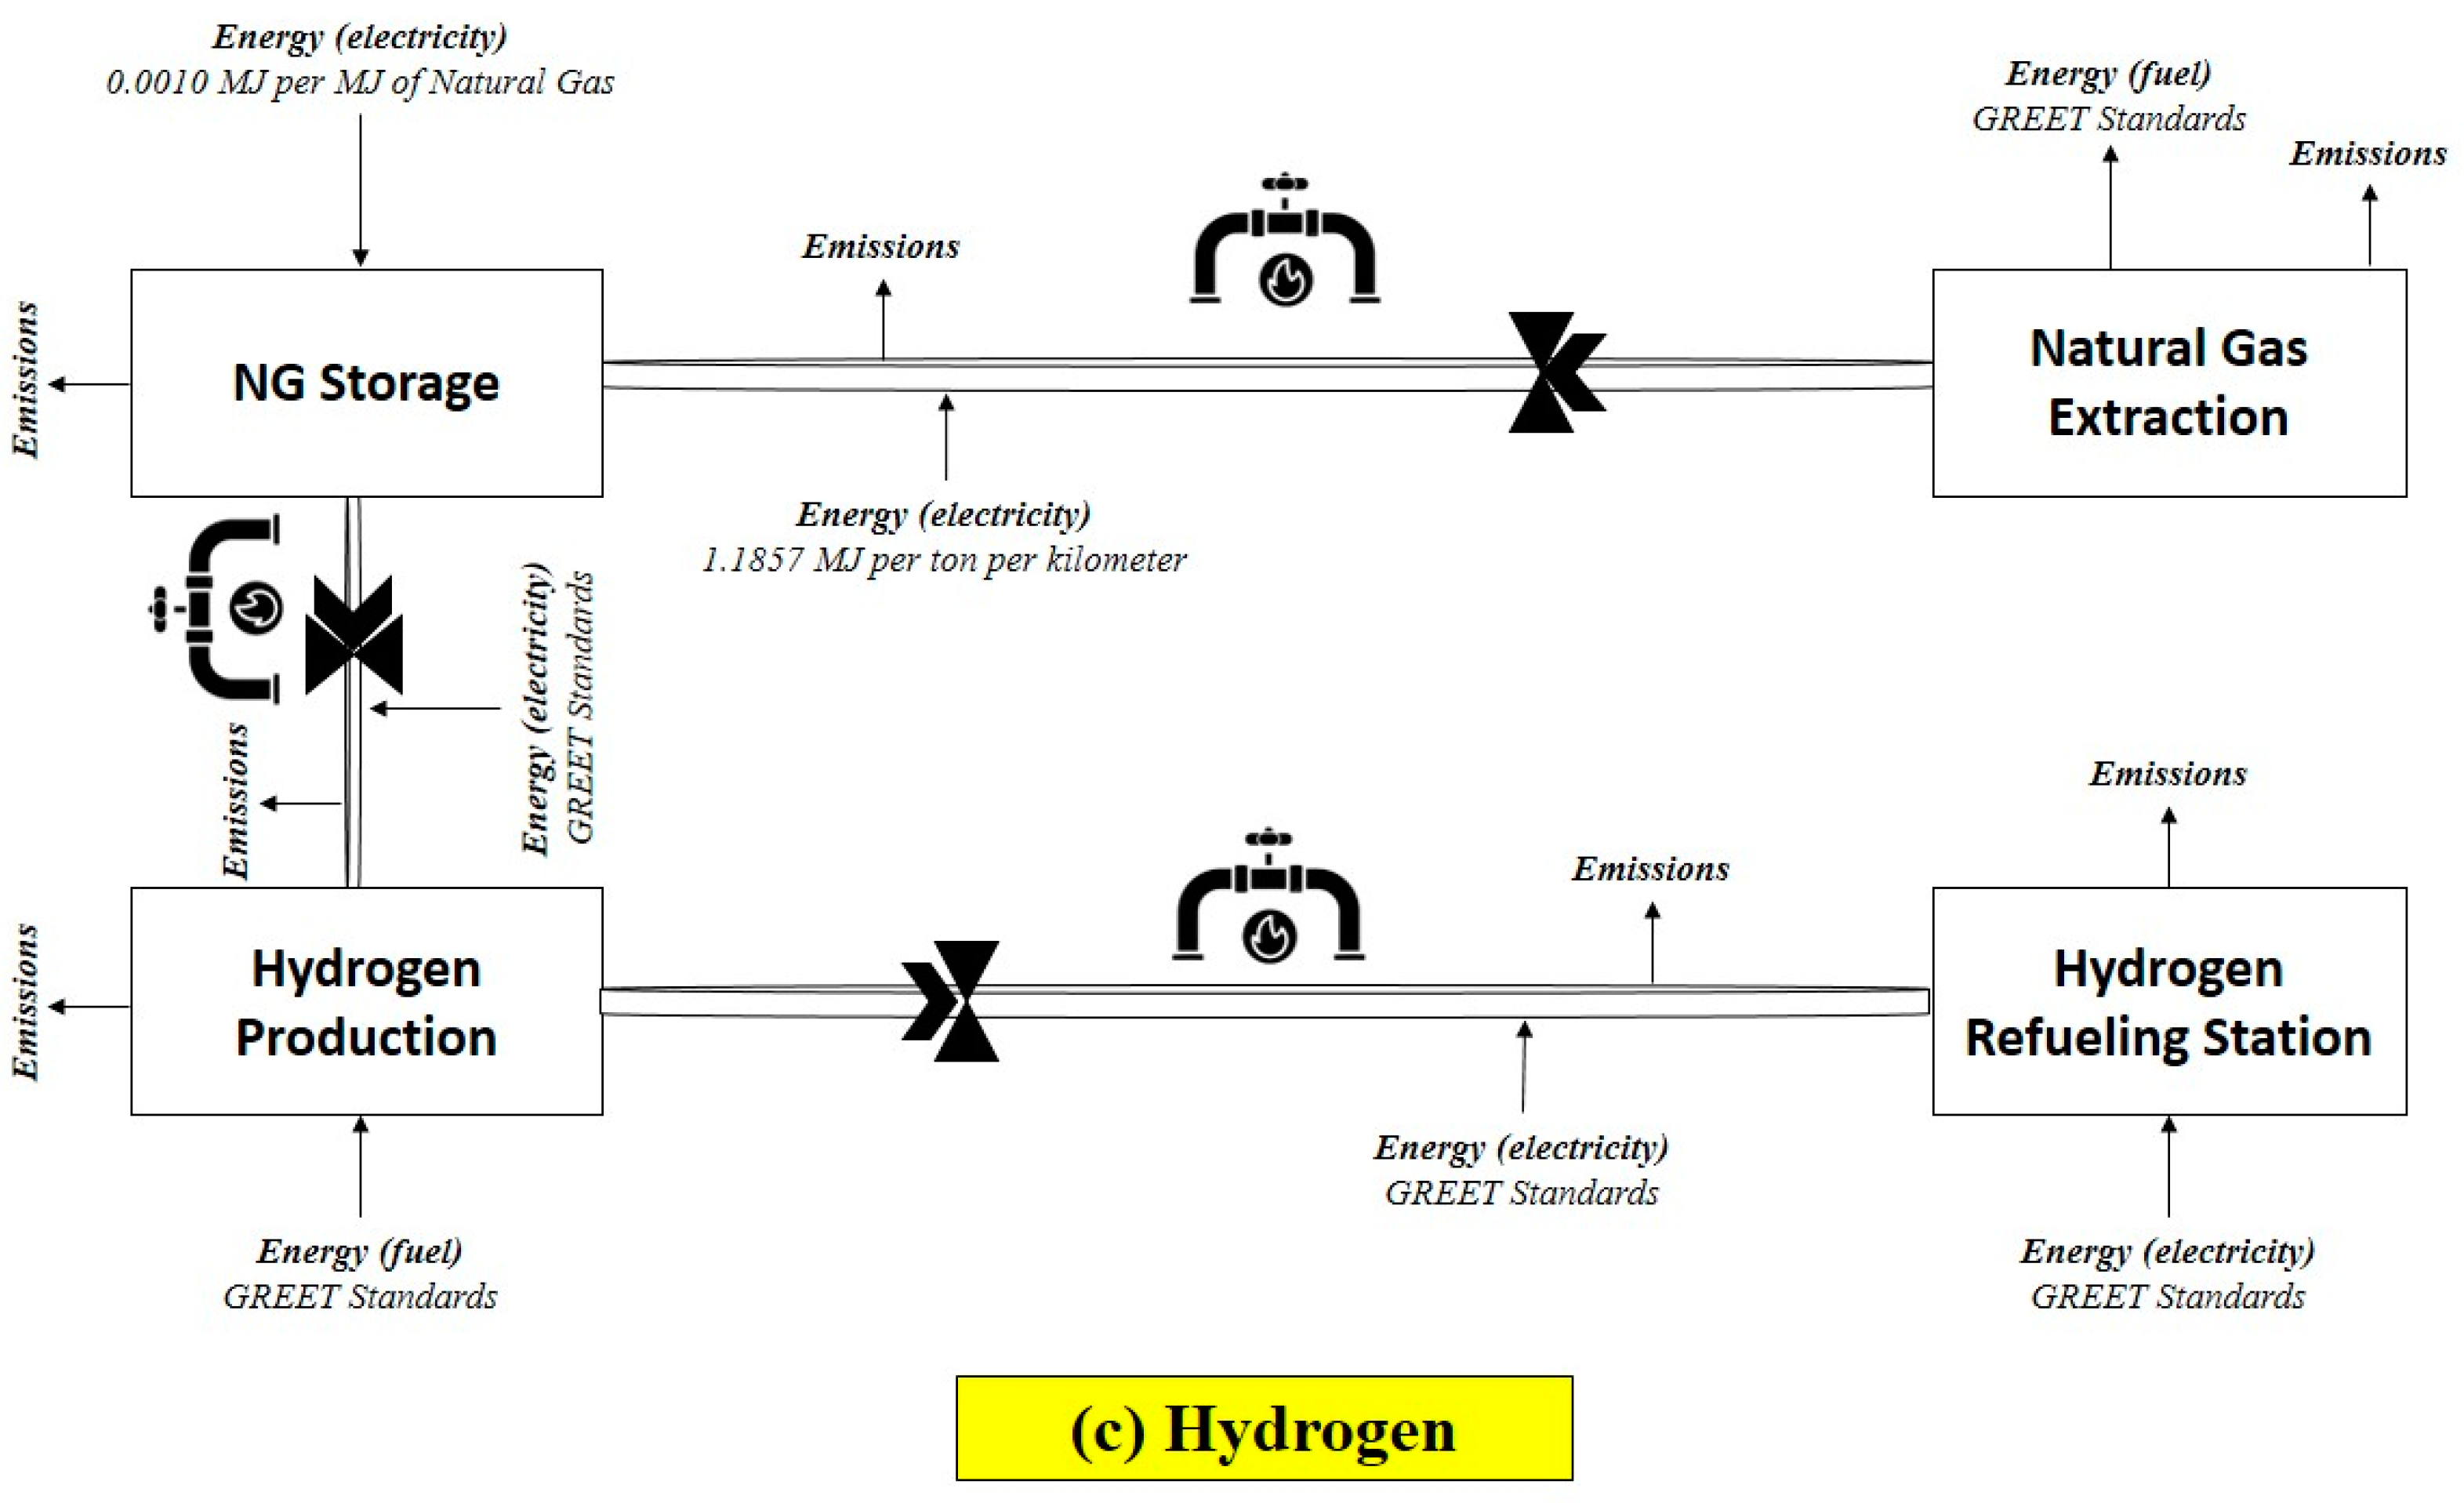
Figure 3, and gaseous hydrogen is produced from natural gas, hence blue hydrogen. Natural gas was chosen for different reasons. First, it is abundant in the Maghreb region with reasonable prices. Second, according to the National Low Carbon Strategy in 2050 [
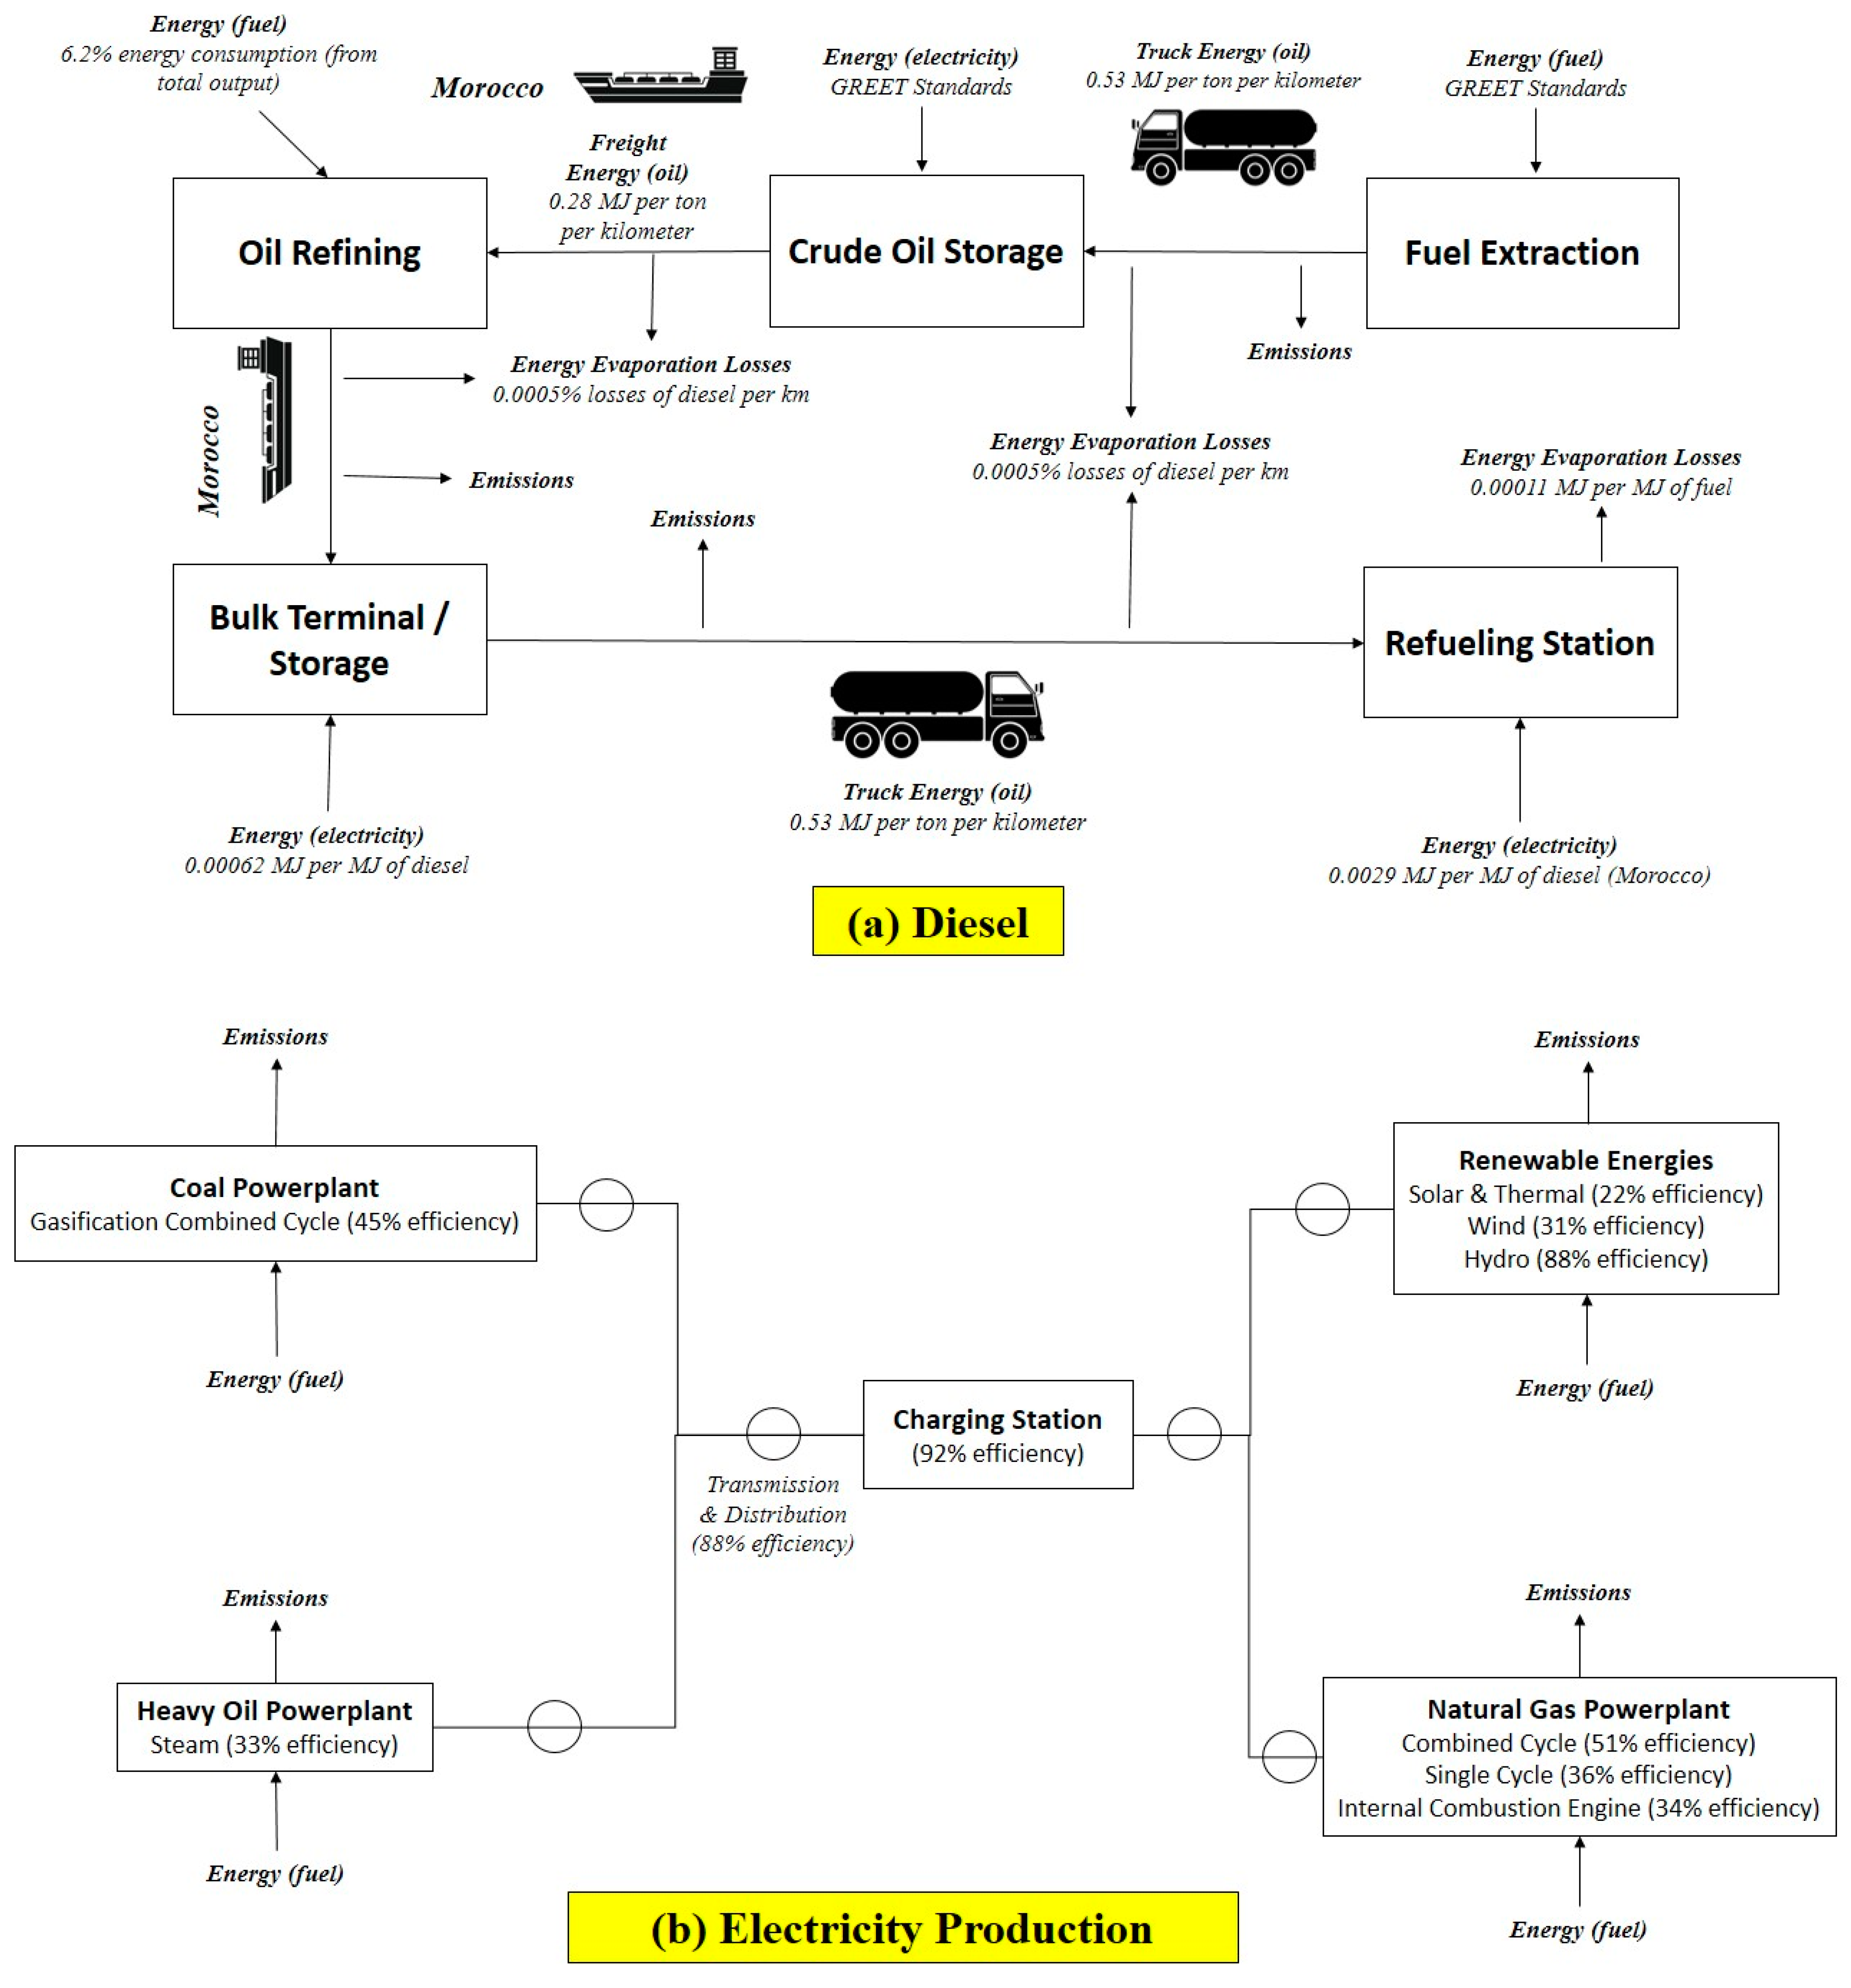
7], Morocco plans to orient blue hydrogen to the transportation sector, while green hydrogen will be served to agricultural and industrial sectors. Subsequently, in this paper, it is assumed that hydrogen is produced only from natural gas. Given the stated assumptions,
Figure 4a–c depict the current and prospective energy pathways of diesel, electricity, and hydrogen, respectively. Fuel import was considered according to UNFCCC Parties [
21,
22]. The given energy profiles are input to the GREET model.
Figure 4a depicts diesel storage, transport, and dispensing. Power is used in storage to run fuel pumps and other loading devices because of the floating roofs installed on Morocco’s fuel storage tanks to prevent evaporation and operational losses. The GREET model uses these data as the amount of energy needed to load/unload 1 MJ of the related fuel. Trucks deliver fuel within the kingdom. Finally, vehicle emissions models account for energy used in station refueling and evaporation wastes owing to pump slits and inefficiencies. Energy losses were modeled to account for pump fuel spills.
Figure 4b shows the current power plant infrastructure, given their real-life efficiency and emissions data. Hydropower, photovoltaic, thermal, and wind power are all future options for renewable energy in the kingdom. It is important to note that the given solar and thermal efficiency was estimated and averaged given an approximate number of photovoltaic panels, concentrated photovoltaic panels, parabolic through collectors, and thermal plants to meet the 20% of the anticipated power needed in 2030. As for fossil fuels, all process energy consumption and emissions were taken into consideration from extraction to electricity production.
Figure 4c reveals a potential hydrogen pathway in Morocco from natural gas using assumptions from GREET. Compressed natural gas would be imported and distributed to existing storage locations. From natural gas storage to hydrogen production to refueling stations, the energy and emissions data were based on the GREET model.
2.2.3. Bus Routes and Fleets
Public bus transportation in prefectures is handled by a private corporation under the terms of a contract between the local government and the corporation. To ensure the safety of their passengers, urban buses are outfitted with Euro engines, electronic systems, security cameras, intelligent transport systems that include GPS and Wi-Fi networks, and a means of access for persons with impaired mobility. However, some companies in the south of Morocco still perform with old fleet buses that do not respect safety or environmental measures. Data on public buses, broken down by province, are included in
Table 2. These include information on bus power engines, bus companies, bus fleets, and average daily trips by province. A simple version of
Table 2 is found in the
Appendix A (
Table A1).
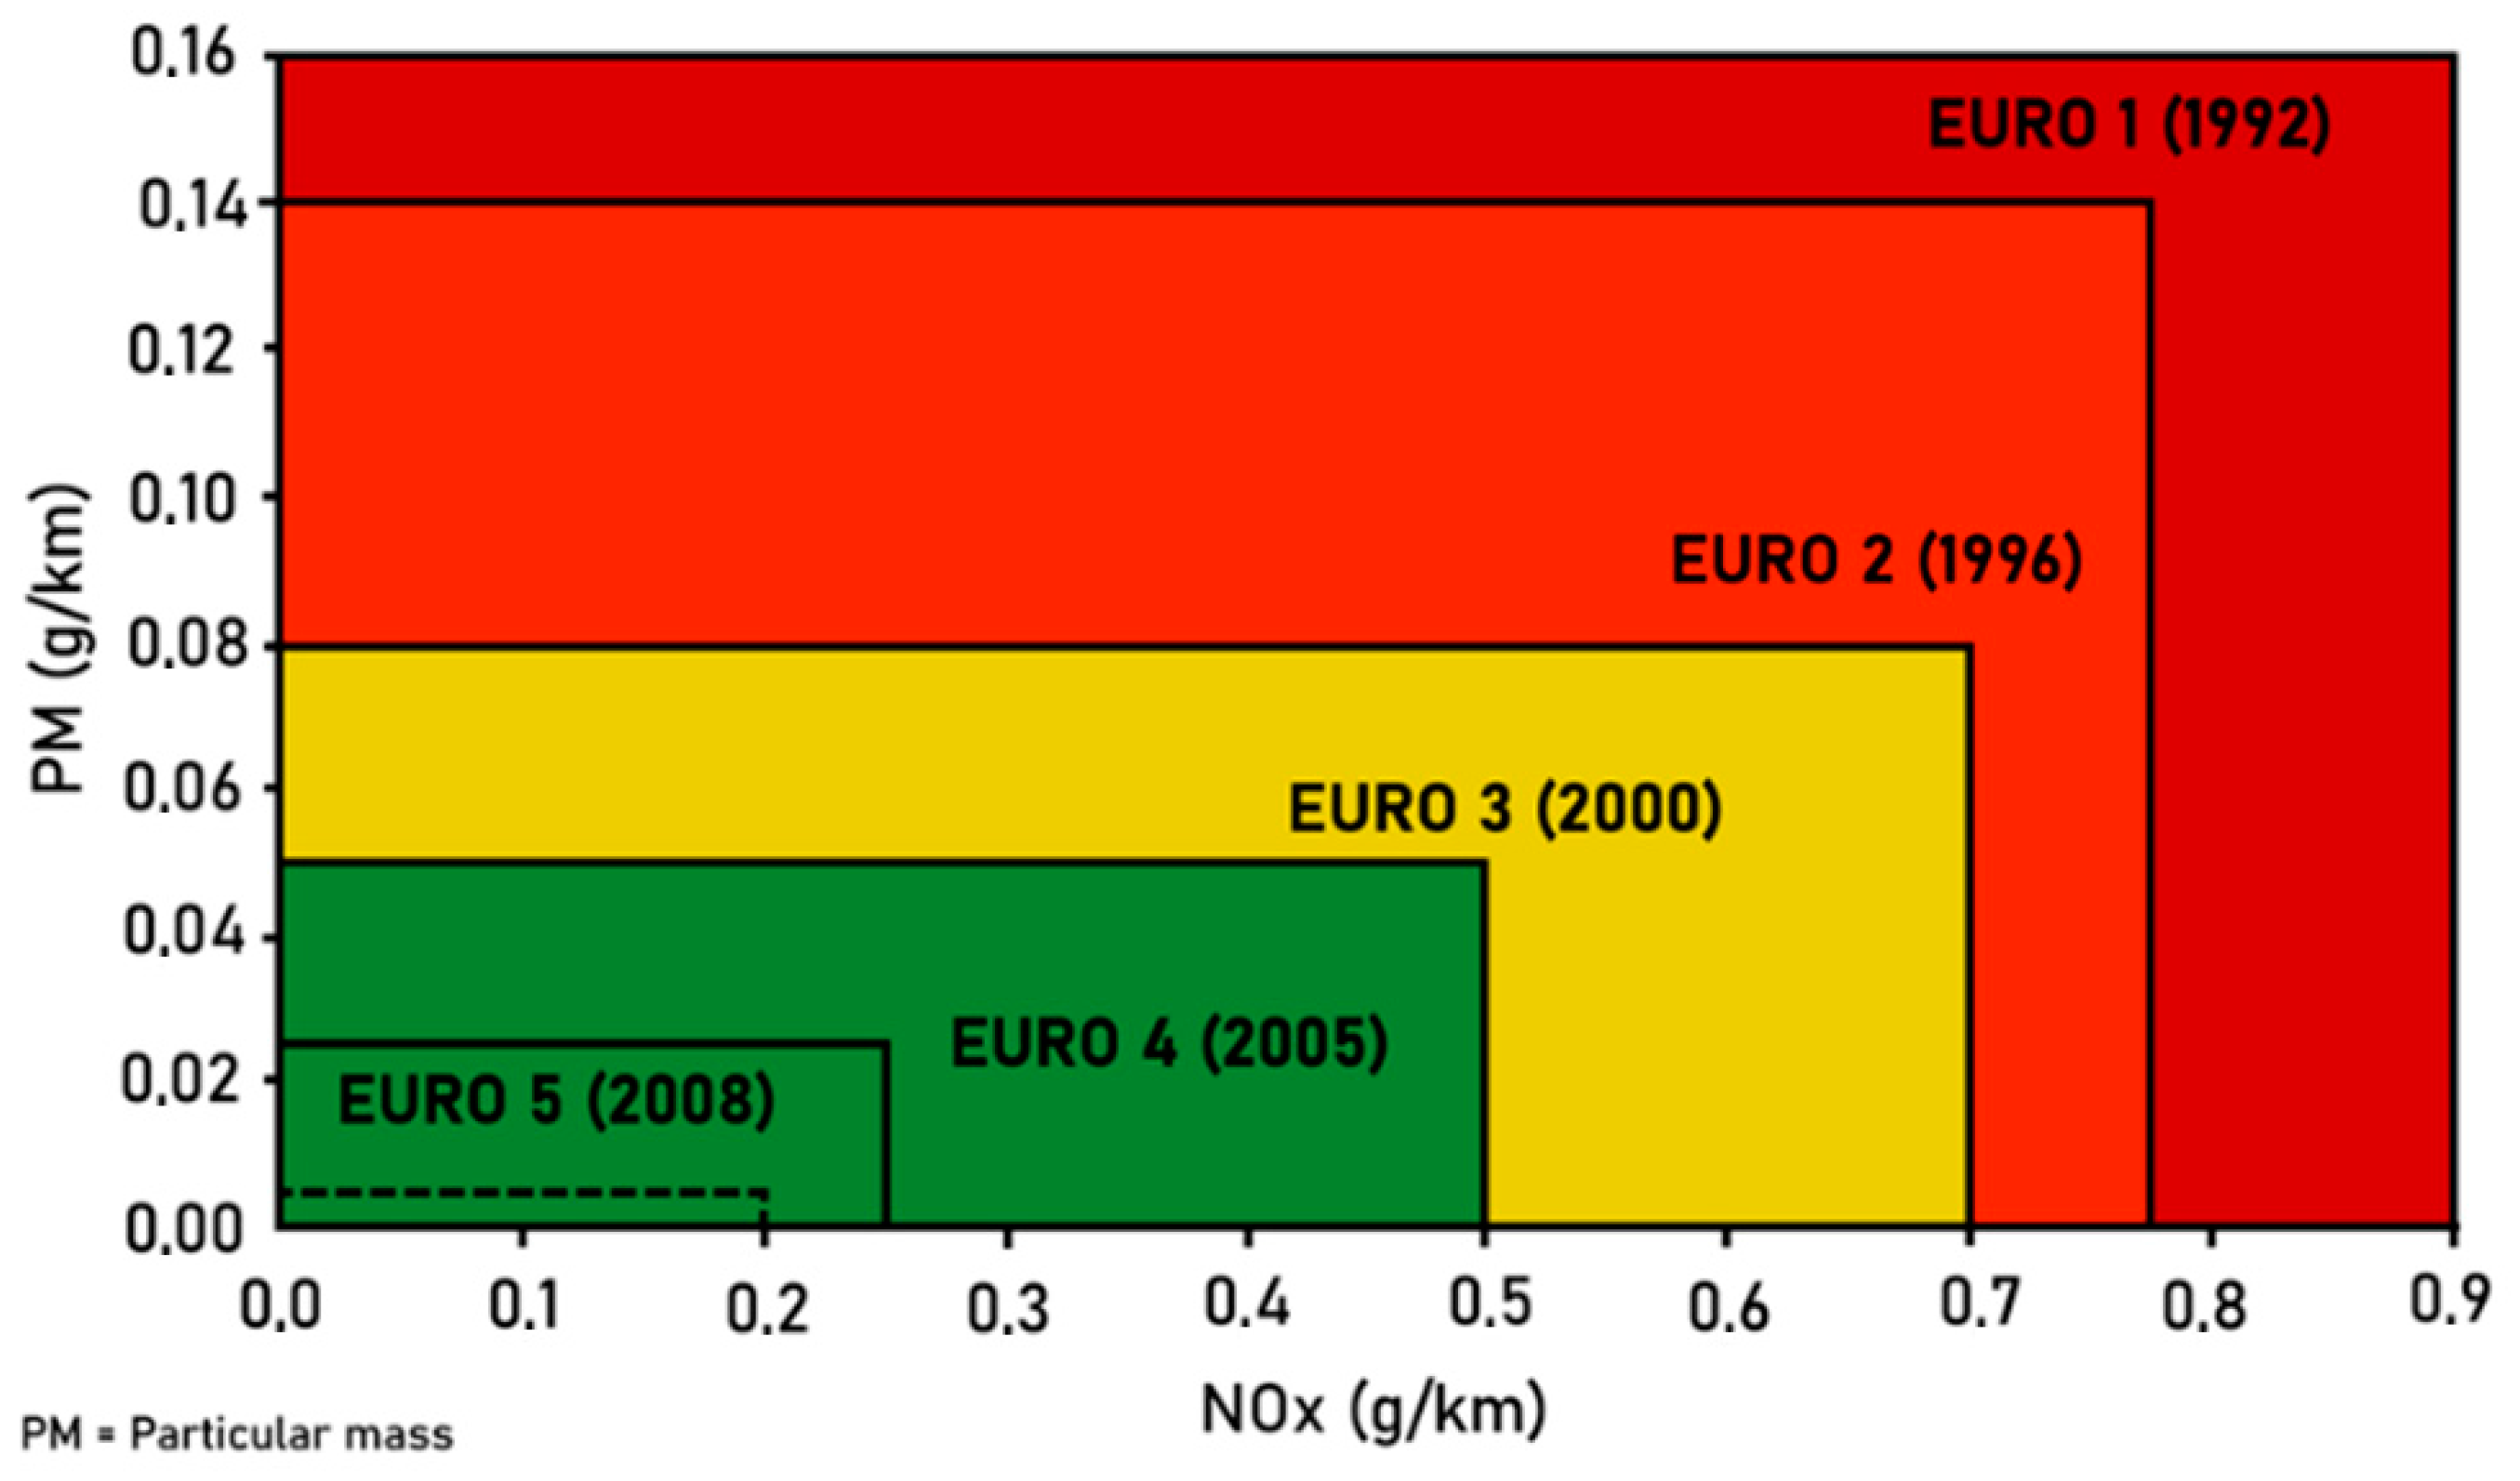
In Morocco, the bus power engine type follows the EURO standard. From
Table 2, diesel buses in Morocco comprise 43.95% of EURO 6, 47.16% of EURO 5, 8.39% of EURO 4, and 0.50% of EURO 3. Hence, EURO 6 has 1416 bus fleets, 1515 buses are EURO 5, 270 buses are EURO 4, and 16 buses are EURO 3. The European Union (EU) enacted the Euro Emissions Standards in 1992 to regulate the allowable levels of exhaust emissions for automobiles sold in the EU. Morocco follows the same Euro emissions standards as Europe and has already banned EURO 3 and EURO 4 taxis nationally. Atmosphere-harming emissions of the following substances are targeted by the standards of carbon monoxide (CO), oxides of nitrogen (NO
x), volatile organic compound (VOC), sulfur oxide (SO
x), and particulate matters (PM
2.5 and PM
10).
Figure 5 shows the change in GHG exhausts for diesel vehicles from EURO 1 to EURO 6. This latter is represented in dash lines below EURO 5. Diesel EURO 6 buses emit 0.5 g of CO, 0.09 g of HC, 0.2 g of NO
x, and 0.004 g of PM per kilometer, whereas diesel EURO 5 buses emit 0.5 g of CO, 0.05 g of HC, 0.25 g of NO
x, 0.024 g of PM per kilometer. On the other hand, EURO 4 and EURO 3 buses emit 0.5 g and 0.66 g of CO, 0.05 g and 0.06 g of HC, 0.5 g and 0.7 g of NO
x, and 0.05 g and 0.7 g of PM per kilometer, respectively [
23]. EURO 1 and EURO 2 are not part of the studied bus fleets, and therefore are not concerned.
Table A2 summarizes the emissions standards for diesel engines.
Some regions are characterized by old bus fleets of EURO 3 and EURO 4. Low gross domestic product and low income per capita are both features of these regions that are susceptible to respiratory illnesses, climate change, and water pollution.
2.3. Impact Assessment
The environmental assessment employs the Egalitarian Eco-indicator 99, which addresses human health and environmental quality, mainly climate change, respiratory effects, and acidification and eutrophication. The relative importance of the various air pollutant emissions was displayed in
Table 3. One point (Pt) reflects the environmental load, and this score is displayed as a weighted sum of the various air pollution emissions.
Eco-indicator 99 combines a realistic approach to environmental effect assessment with life cycle evaluation. It provides a metric by which numerous environmental consequences can be measured, and displays the aggregated score.
3. Results and Discussion
Results of the well-to-wheel analysis include energy use, greenhouse gas emissions, air pollutant emissions, and impact assessment of current diesel buses versus alternative fuel buses. The outcomes are shown on a daily timescale.
3.1. Energy Use
Energy use of national public buses depends on WTT and TTW analysis. WTT depends on power generation mix and energy profile pathway, whereas TTW relies on the technical specifications of the buses (
Table 4), bus fleets, and daily distance traveled. Energy consumption is stated assuming ideal driving behavior, ambient temperature [
24], carried weight, friction [
25], and road infrastructure.
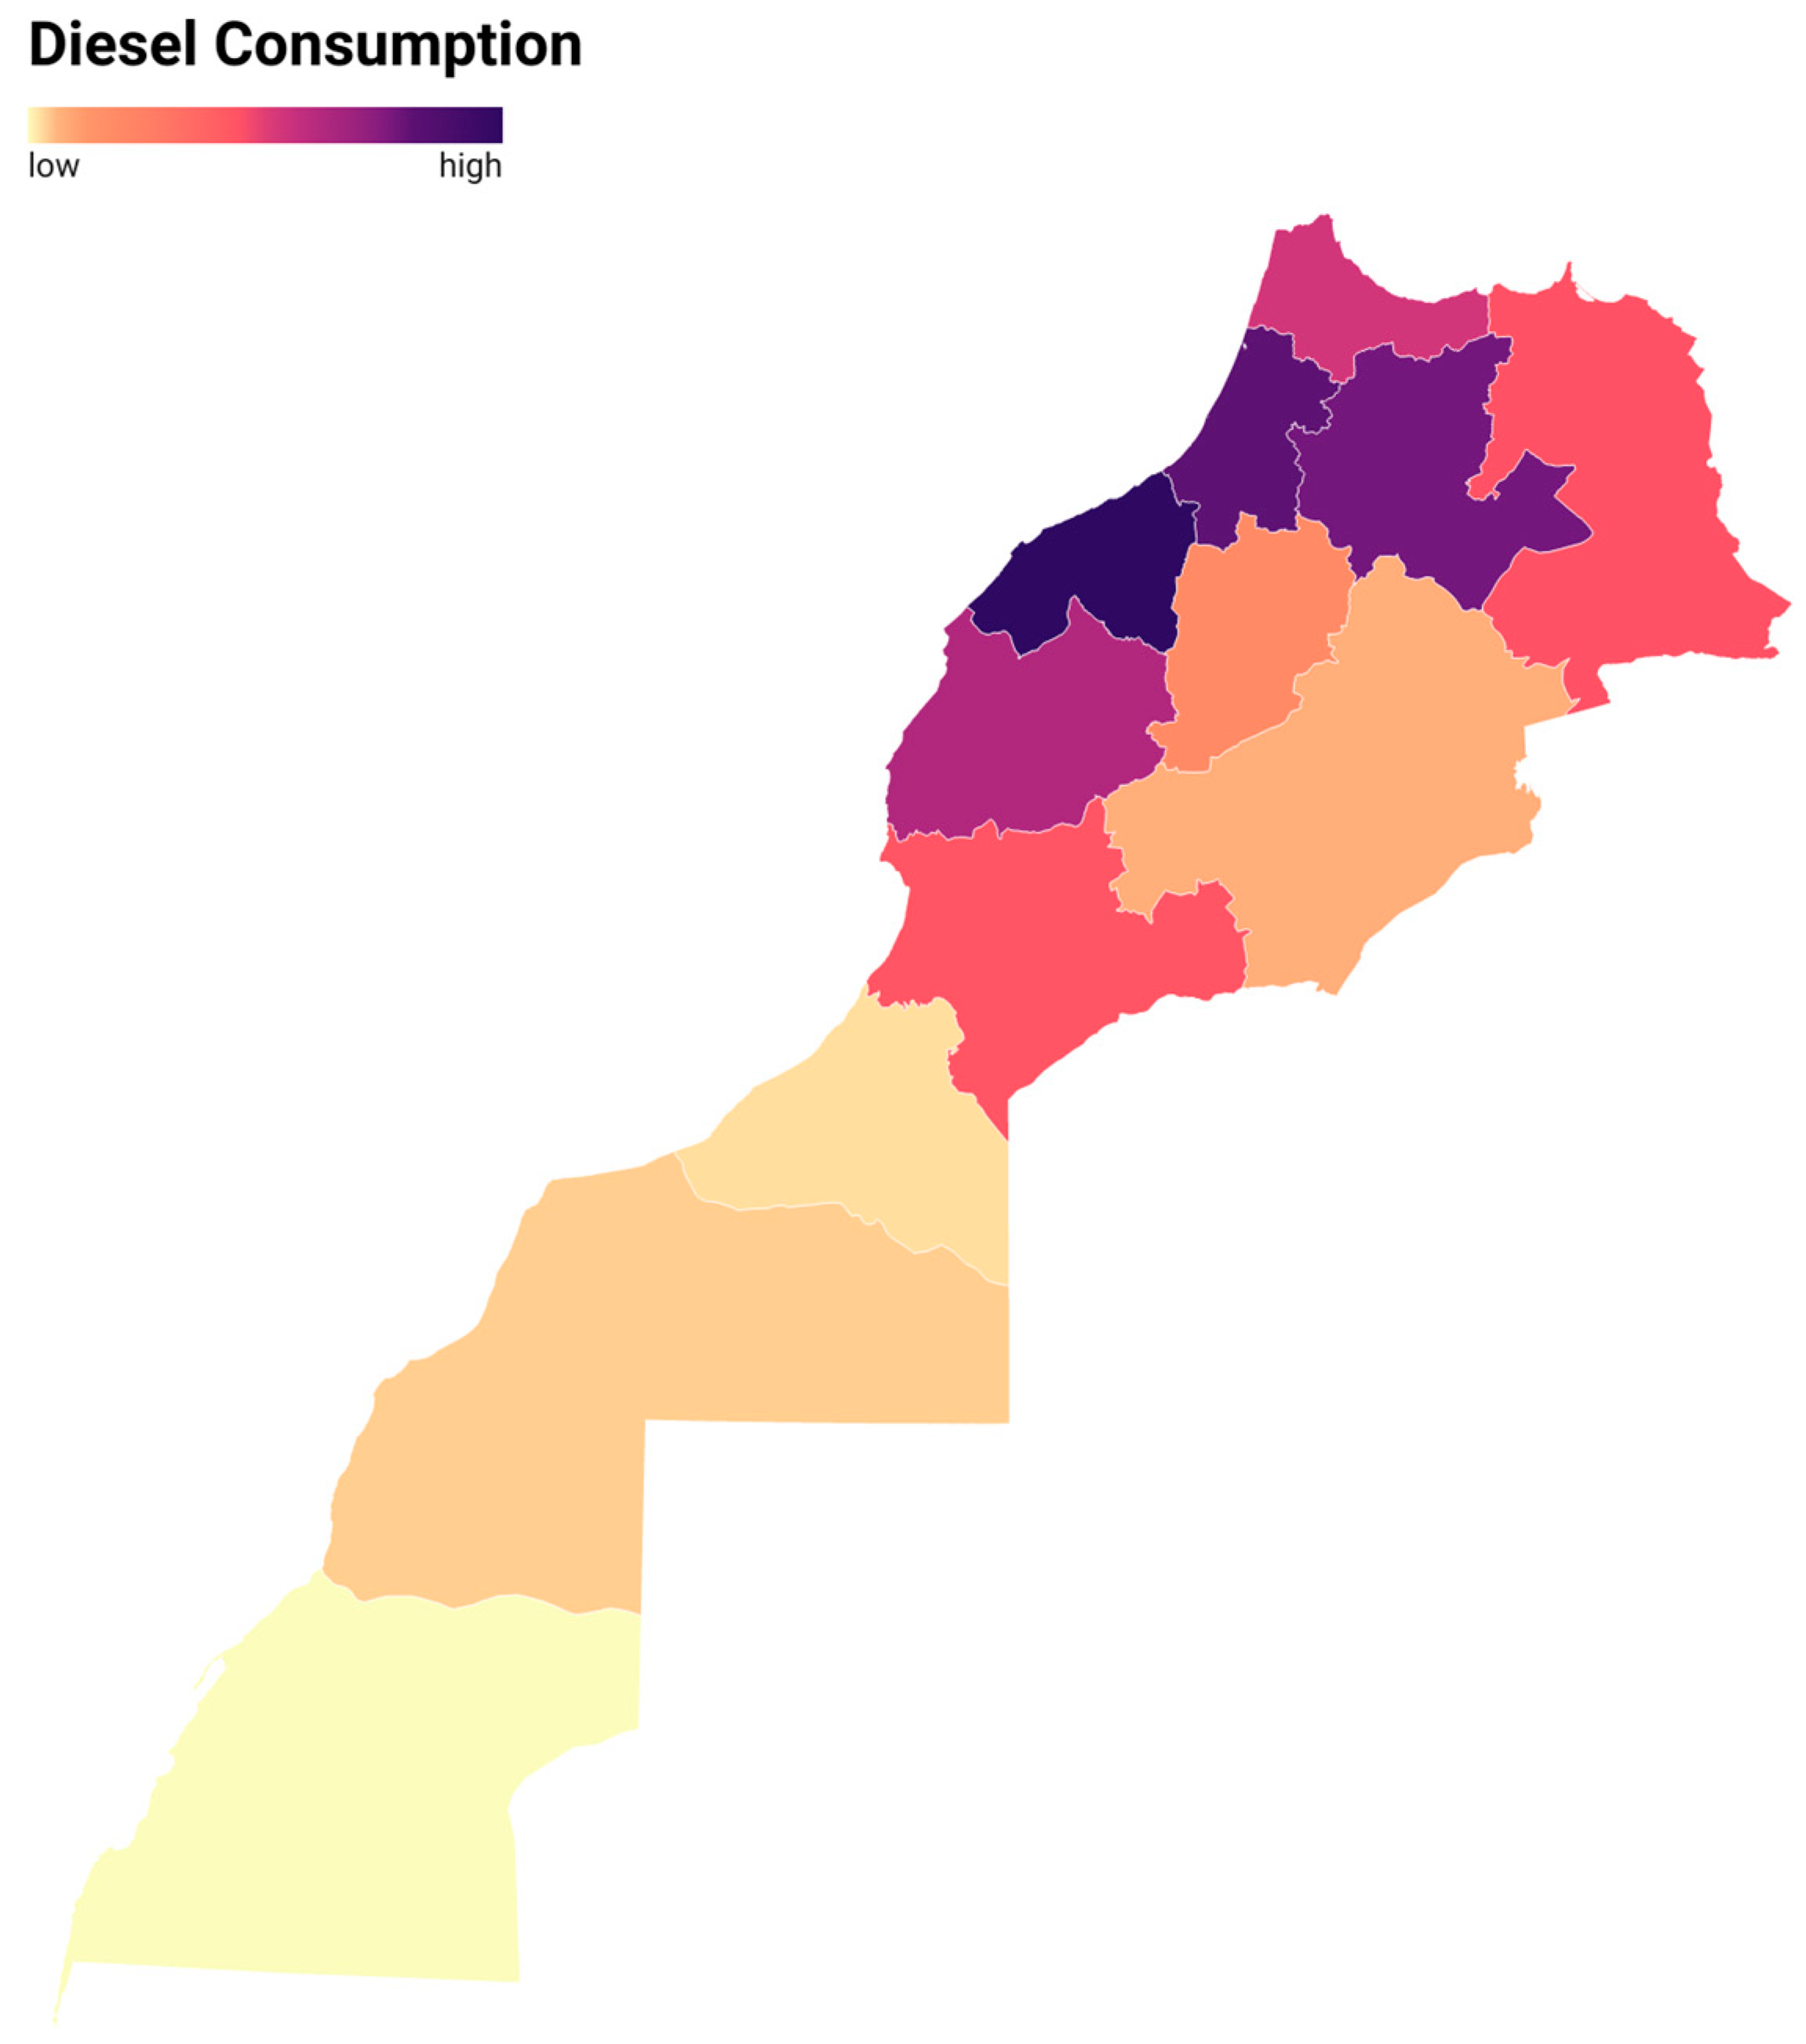
It is worth mentioning that one tank of gaseous hydrogen has a mass of 39 kg net. In other words, fuel-cell buses consume around 12.8 kg of gaseous hydrogen per kilometer driven. A choropleth map of Morocco is drawn to summarize the results of energy consumption in Morocco by region under current diesel buses; the choropleth map was extrapolated to values in
Table A3. From
Figure 6, Zone 6 is the most energy-consuming region because of its largest bus fleet and largest daily journeys though 96% of the buses are EURO 6. Zone 6 contains the biggest metropolitan city in Morocco, Casablanca, which justifies the results. The Western Saharan regions record the lowest energy consumption of public buses. The link between energy consumption and economic growth is the subject of four competing theories of causation. The first is the so-called “growth hypothesis,” which states that more energy usage leads to a flourishing economy. The second theory is the “conservation hypothesis,” which states that an increased population demands more energy. Third, the “feedback hypothesis,” which proposes a two-way causal relationship between energy consumption and development, is discussed. Last but not least, the “neutrality hypothesis” proposes that growth and energy use have no statistically meaningful relationship [
26]. However, according to [
27] in 2020, three regions dominate Morocco’s GDP by roughly 61%, which are Zone 1 (12%), Zone 4 (16%), and Zone 6 (33%). The western Saharan regions barely contributed by 7% [
27]. Therefore, there is a link between the region’s public bus energy consumption and GDP, in the presence of other links such as power engine types and mismanagement of public buses, which could be deduced from Zone 3 which contributes 7% GDP only but still emits and consumes more than Zone 1 (12%).
It is important to consider both renewable and nonrenewable energy sources when estimating the total amount of energy needed by alternative fuels. The three main types of non-renewable energy are coal, oil, and natural gas. There is a danger that these power sources would increase atmospheric pollution. In contrast, solar, wind, and hydropower are clean and are the key renewable resources in Morocco’s energy mix in 2030. There are daily updates that reflect the aforementioned scenario over all of Morocco. Daily energy consumption is provided that is consistent with the earlier mentioned situation in every region in Morocco.
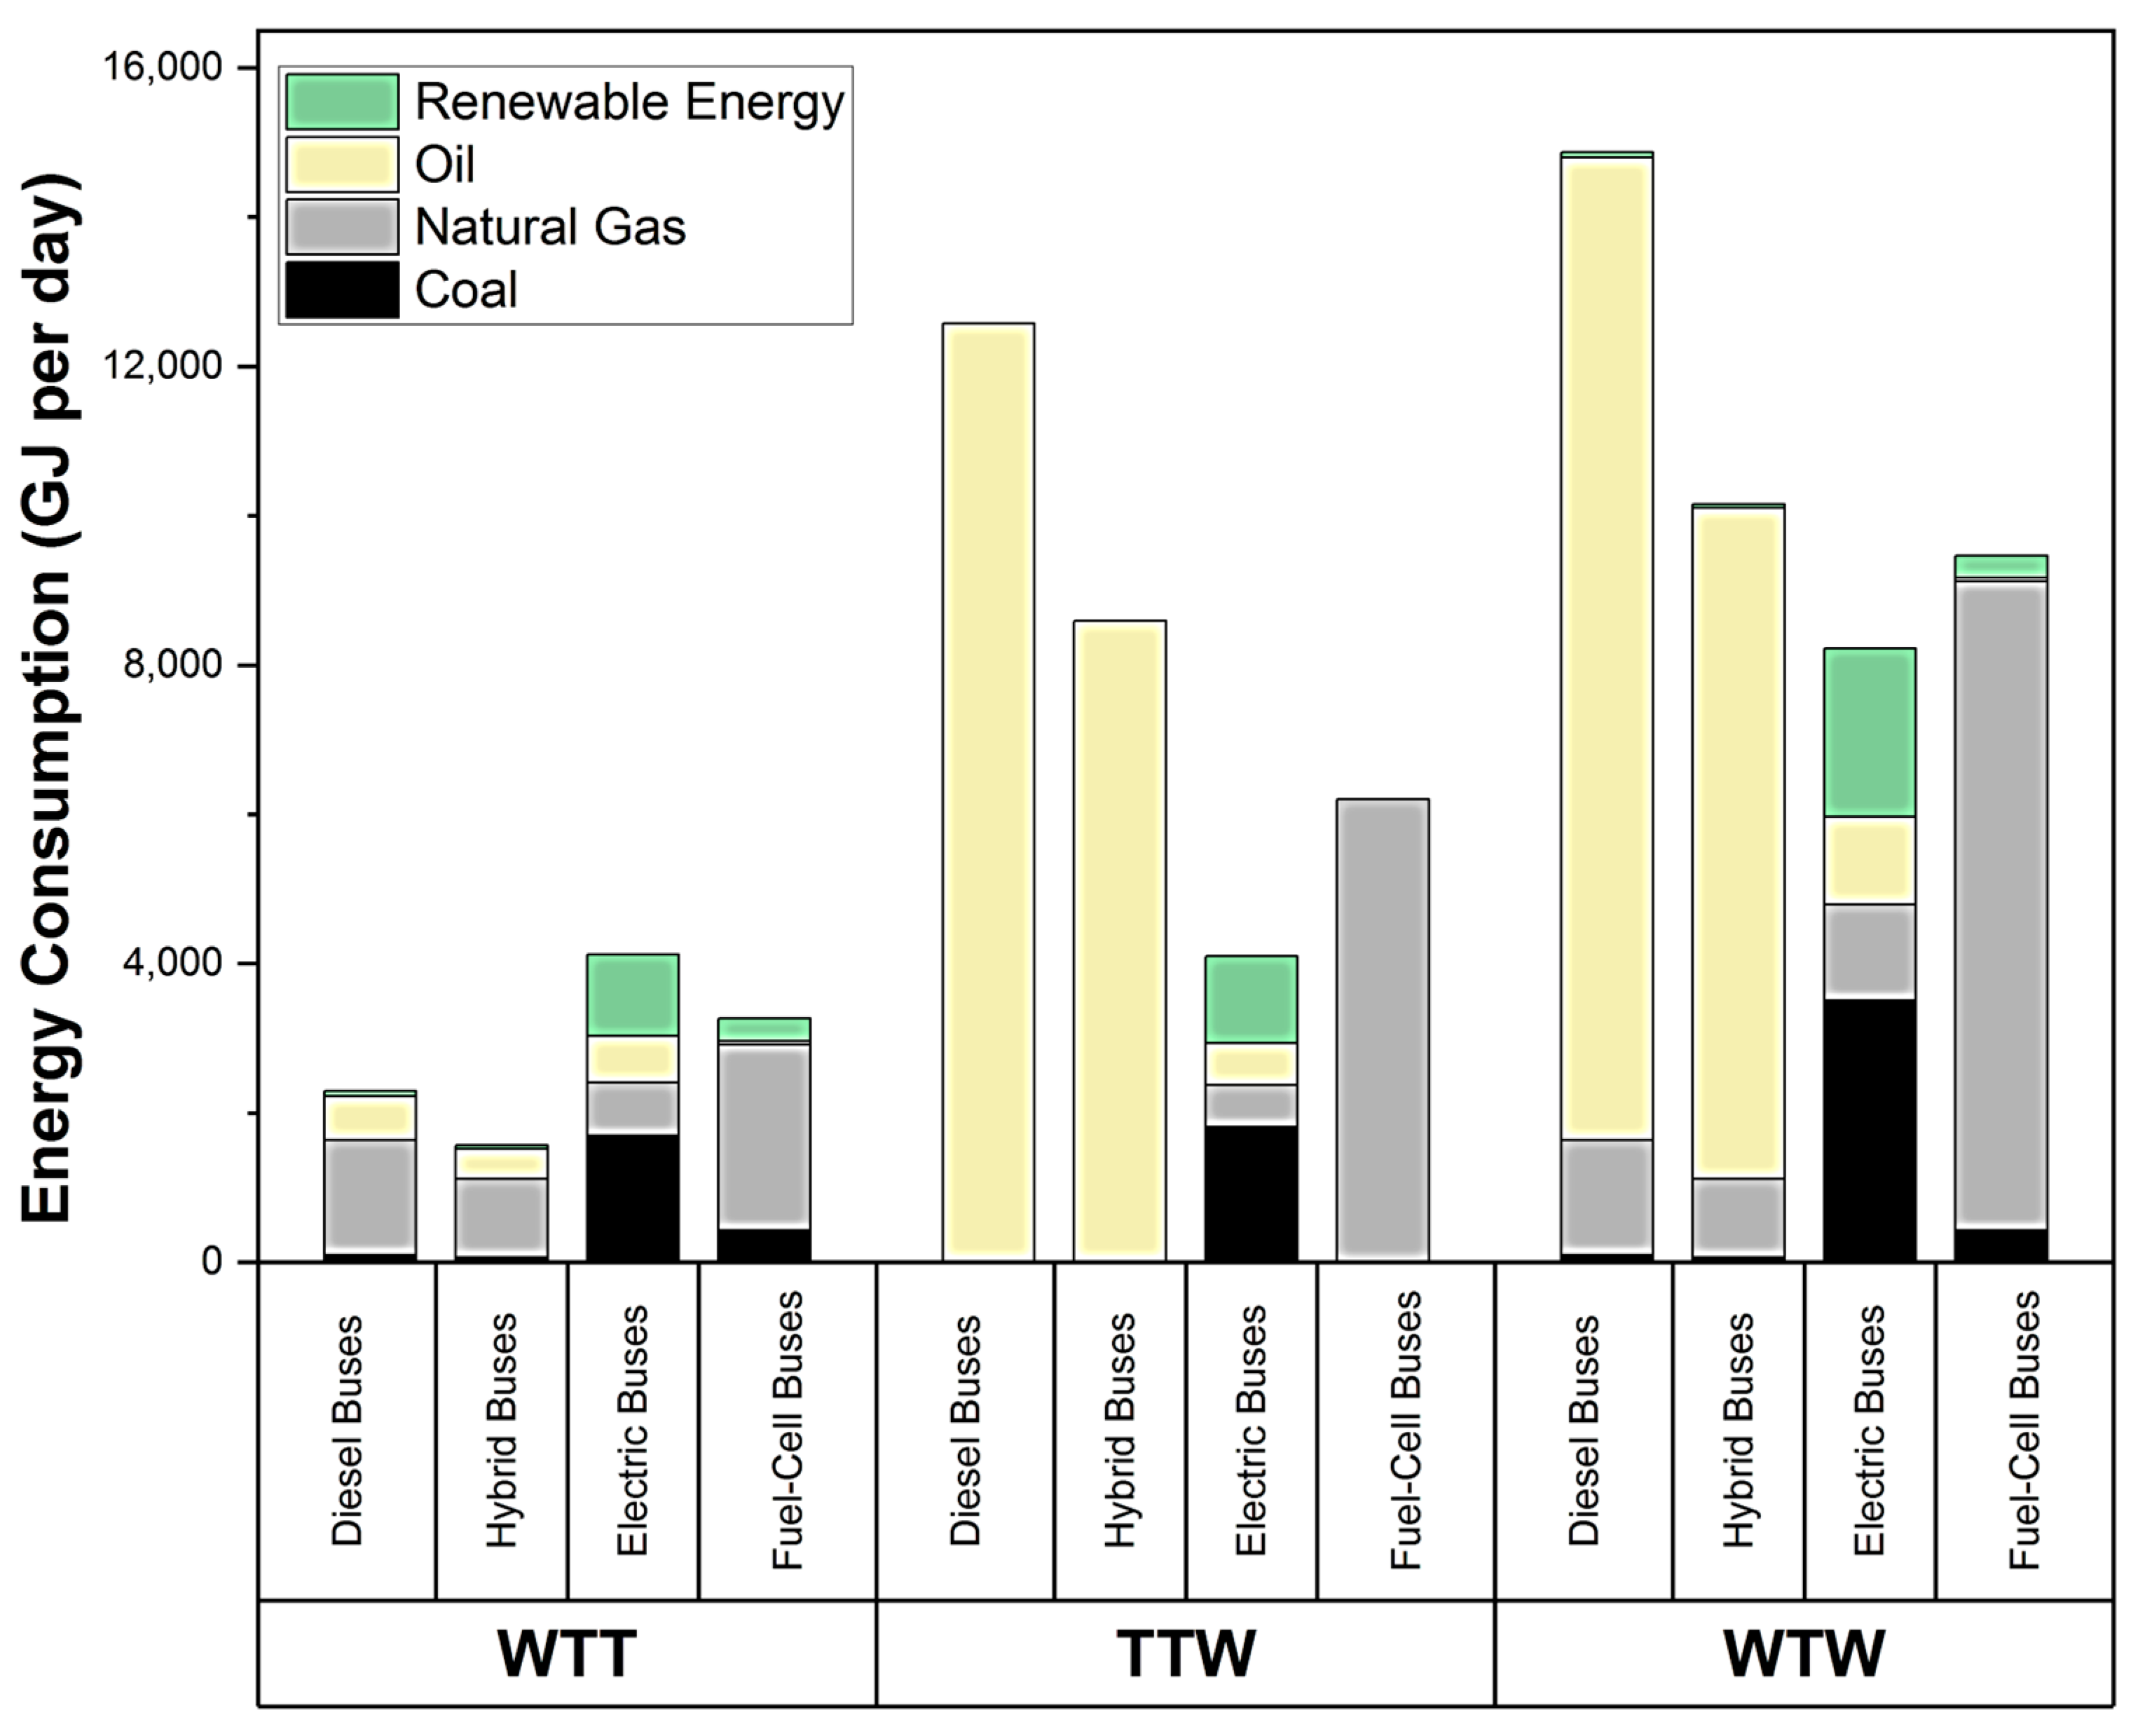
Figure 7 shows the energy consumption of the various bus technologies in TTW, WTT, and WTW.
Diesel buses are used as a reference in the analysis. Hybrid buses reduce oil consumption by 31% compared to diesel buses in the WTW phase. The average oil usage of electric buses and fuel-cell buses is 90 and 99% percent less, respectively. Hydrogen buses are nearly independent of oil. In contrast, the WTT and TTW stages of electric buses are distinguished by a substantial quantity of coal. This conclusion makes sense when thinking about the nation’s energy mix, which features higher shares of coal and renewable energy. When compared to diesel buses, the 1.28 TJ and 1.05 TJ of natural gas consumed by electric and hybrid buses are significantly lower. The WTT and TTW stages of a fuel-cell bus operation are, however, much more natural gas-intensive. The electric and fuel-cell buses use far more renewable energy than the other choices: 2.25 TJ and 0.30 TJ, respectively. When compared to other bus options, electric buses make exceptional use of renewable energy during their operation phase.
On the national level, hybrid diesel-electric buses have the lowest energy consumption in the WTT phase, whereas electric buses are the highest. In the TTW phase, taking diesel buses as a reference, hybrid-electric buses have the highest energy consumption, while electric buses are the lowest. At first sight, there has been a shift of energy consumption from TTW to WTT; nevertheless, the energy consumption in the whole WTW analysis is reduced from the reference for all alternative fuel buses but with different ratios. Battery-electric buses proved to be the most energy-efficient alternative fuel technology with a reduction of 44.7% in energy use. Hydrogen buses come second with a reduction of 36.3%, while hybrid buses come third with an energy economy of 31.7%.
3.2. Greenhouse Gas Emissions
Greenhouse gases are composed of CO
2, CH
4, and N
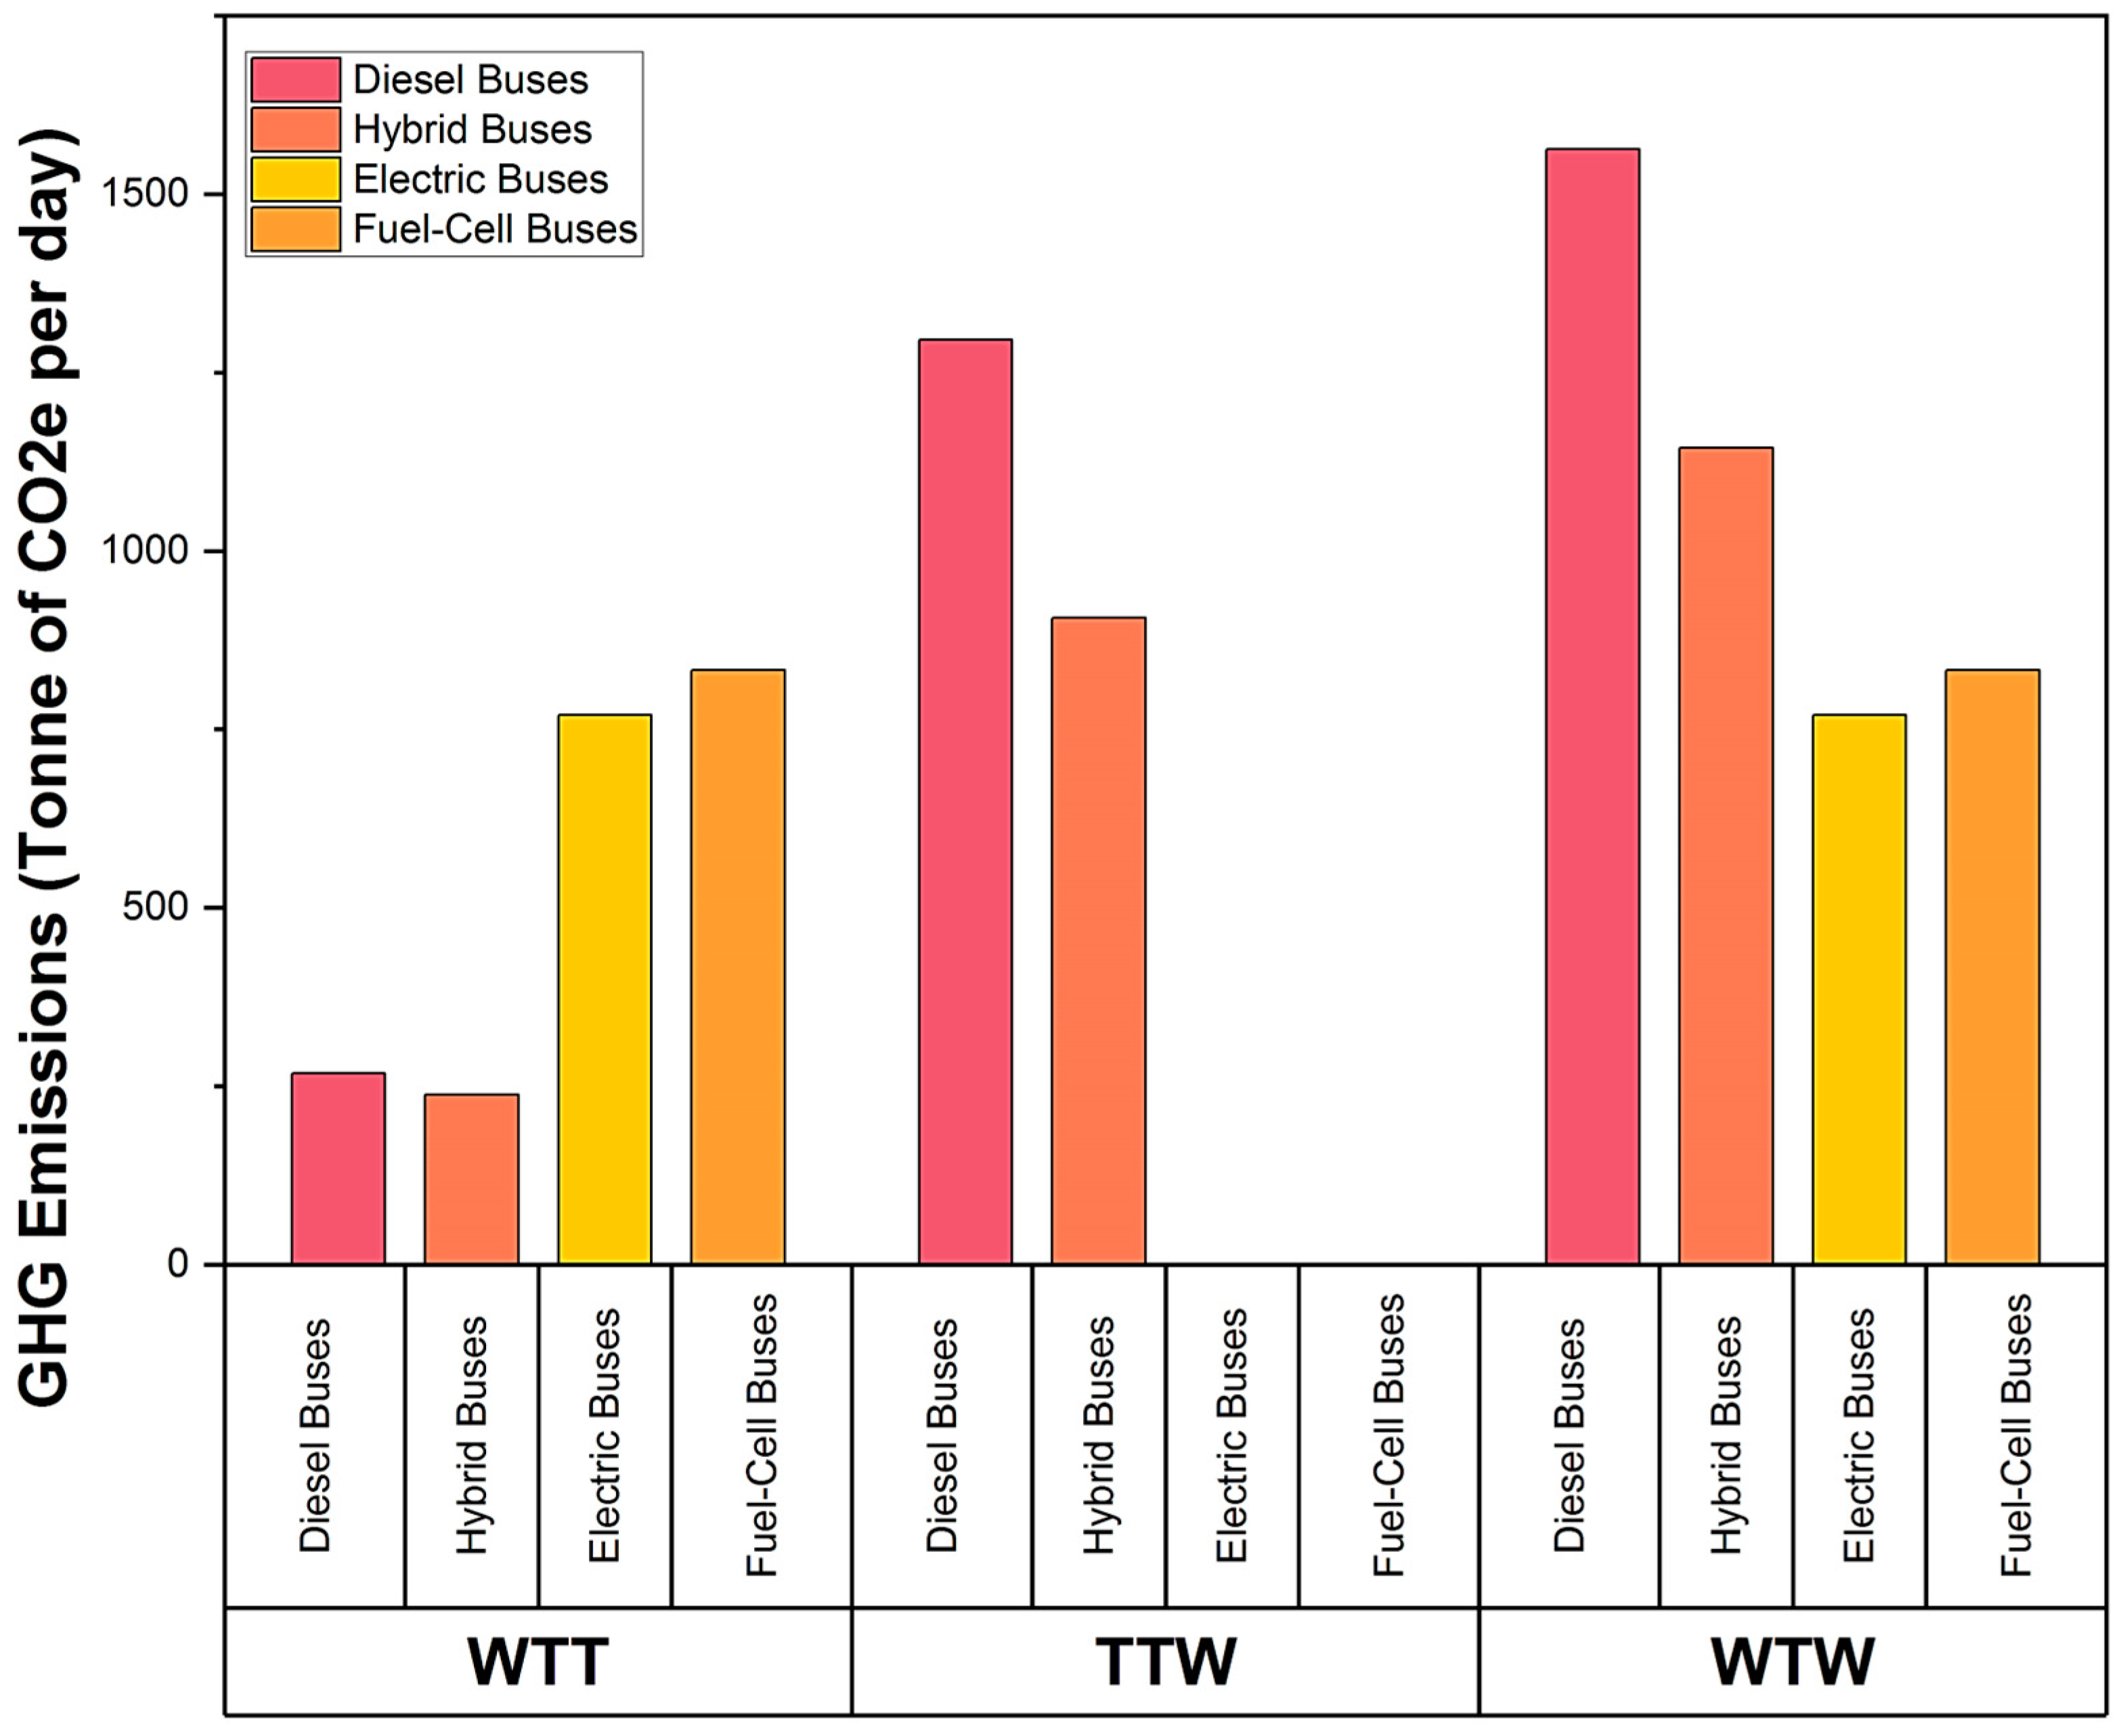
2O and are emitted from various bus options across the fuel life cycle. National daily GHG emissions of alternative fuel buses are displayed in
Figure 8 below. In the WTT phase, hybrid buses are observed to create the lowest GHG emissions compared to the other options, whereas fuel-cell buses and electric buses generate much higher values, in comparison with diesel buses. One reason for this is that fossil natural gas, and methane (CH
4) in particular, is utilized extensively in the steam methane reforming (SMR) process to produce hydrogen gas. To achieve the high temperature necessary to reform, the SMR process consumes a lot of energy and releases a lot of carbon dioxide. The zero-emissions, eco-friendly operation of electric and fuel-cell buses is on full display during the TTW phase. Hybrid buses, alternately, release a significant amount of GHG due to their limited operation on diesel fuel, but their emission level is still 30% lower with reference to diesel buses.
In the overall WTW analysis, electric buses emit the lowest CO2e emissions with a total of nearly 770 tons of CO2e, which is 50.8% less than current diesel buses. Hydrogen buses come next, emitting 833 tons of CO2e, nearly 46.7% less than the reference. Hybrid diesel-electric buses come third with daily GHG emissions of 1144 tons of CO2e, which represents a decrease of 26.8% in comparison with current diesel buses.
3.3. Air Pollutant Emissions
NO
x, SO
x, CO, VOC, PM
10, and PM
2.5 are all criteria air pollutants that hinder the functioning of urban transportation systems. Smog formation is facilitated by these air pollutants, which in turn contributes to a wide range of health issues including respiratory disorders, cardiovascular ailments, etc. [
28]. Nitrogen dioxide exposure causes respiratory discomfort. Short-term exposure to elevated amounts of sulfur dioxide when exercising moderately may cause breathing difficulties, such as dyspnea, chest pain, or breathing difficulty. Carbon monoxide decreases the blood’s oxygen-carrying capacity, reducing oxygen flow to tissues and organs like the heart. People with heart disease have a diminished capacity to pump oxygenated blood to the heart, which can induce myocardial ischemia (reduced oxygen to the heart) and chest pain (angina) during exercise or stress. The stratospheric ozone layer protects the globe from dangerous solar UV radiation, while ground-level ozone can affect human health. Short-term exposure to ground-level ozone can induce lung inflammation, impaired lung function, and respiratory symptoms such as cough, wheezing, chest pain, and shortness of breath. Particulate matter (PM) is a vast class of chemically and physically varied particles (liquid droplets or solids) of varying sizes. EPA regulates fine and coarse particles based on size. PM
10 denotes inhalable particles with an aerodynamic diameter less than or equal to 10 μm. PM
10 is composed of PM
10–2.5 or thoracic coarse particles (particles with an aerodynamic diameter less than or equal to 10 m and larger than 2.5 m) and PM
2.5 or fine particles [
29].
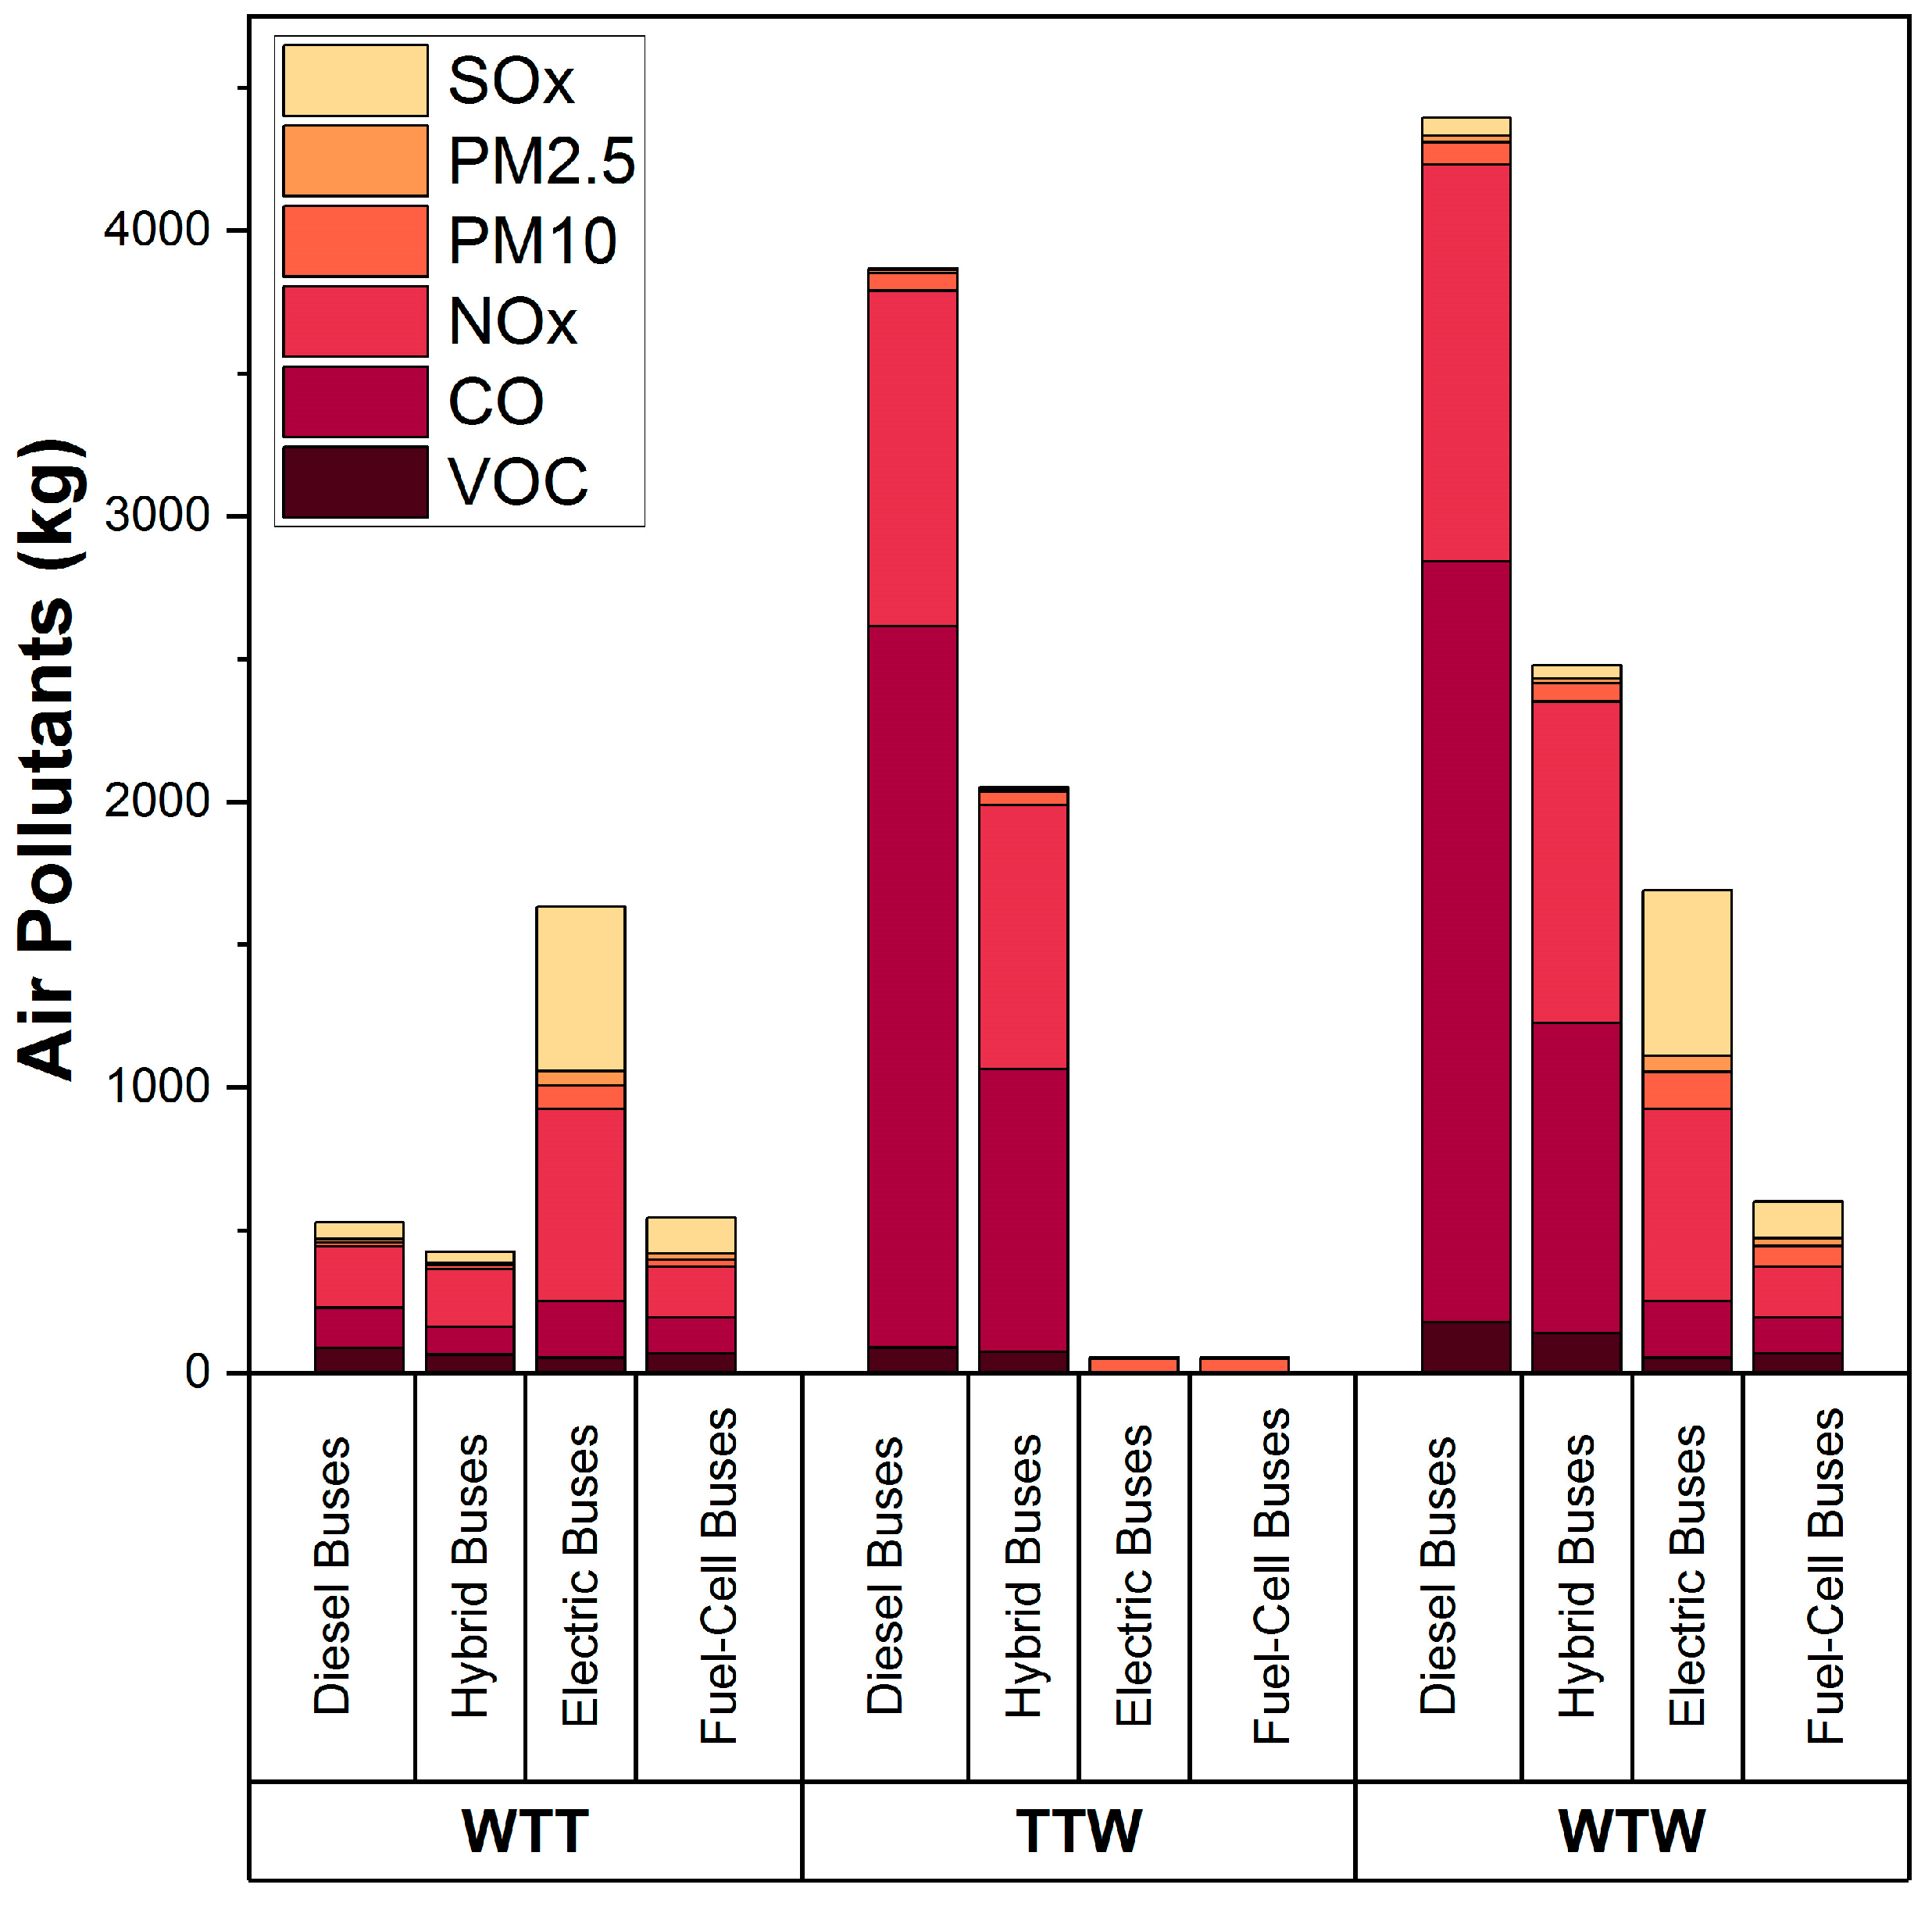
Figure 9 depicts the well-to-wheel study of the potential bus technologies in terms of the air pollution they generate. During the WTT phase, it is evident that electric buses produce a great deal of SO
x emissions as a result of battery depreciation, whereas hybrid buses produce far less SO
x outflows than other alternative buses, saving 31.2% compared to diesel buses. Emissions of nitrogen oxides (NO
x) are decreased by around 5.8% in hybrid buses and by 16.4% in fuel-cell buses compared to diesel buses. These toxins are noticeable for electric buses because they are two times higher. There is clear evidence that hybrid buses and hydrogen buses emit less carbon monoxide than their diesel counterparts. By putting them to use, they can cut emissions by about 30% and 11%, respectively. However, the amount of CO emissions from electric buses is larger. In addition, electric, hybrid, and fuel-cell buses may be able to reduce volatile organic compound emissions by 26.9%, 38.8%, and 21.4%, respectively, compared to diesel buses. Ultimately, when compared to conventional buses, electric and fuel-cell buses produce significantly more PM
10 and PM
2.5 emissions. Hybrid buses, on the other hand, reduce PM
10 and PM
2.5 emissions by 22% when compared to diesel buses.
Results from the TTW phase show that both electric and fuel-cell buses produce zero emissions of harmful gases such as NOx, SOx, CO, and VOC and fewer PM10 and PM2.5 emissions. Furthermore, it is clear that hybrid buses, in comparison with other options, produce more NOx and VOC emissions while still being very near to the reference diesel buses. As opposed to diesel buses, hybrid buses reduce emissions by 2% for SOx and 61% for CO. Overall, taking into consideration both phases of the WTW, electric and hybrid buses will daily reduce all air pollutant emissions, whereas hydrogen cells decrease all emissions except for PM2.5 and SOx, which they increase by 15.8% and 100%, respectively.
3.4. Environmental Impact Assessment
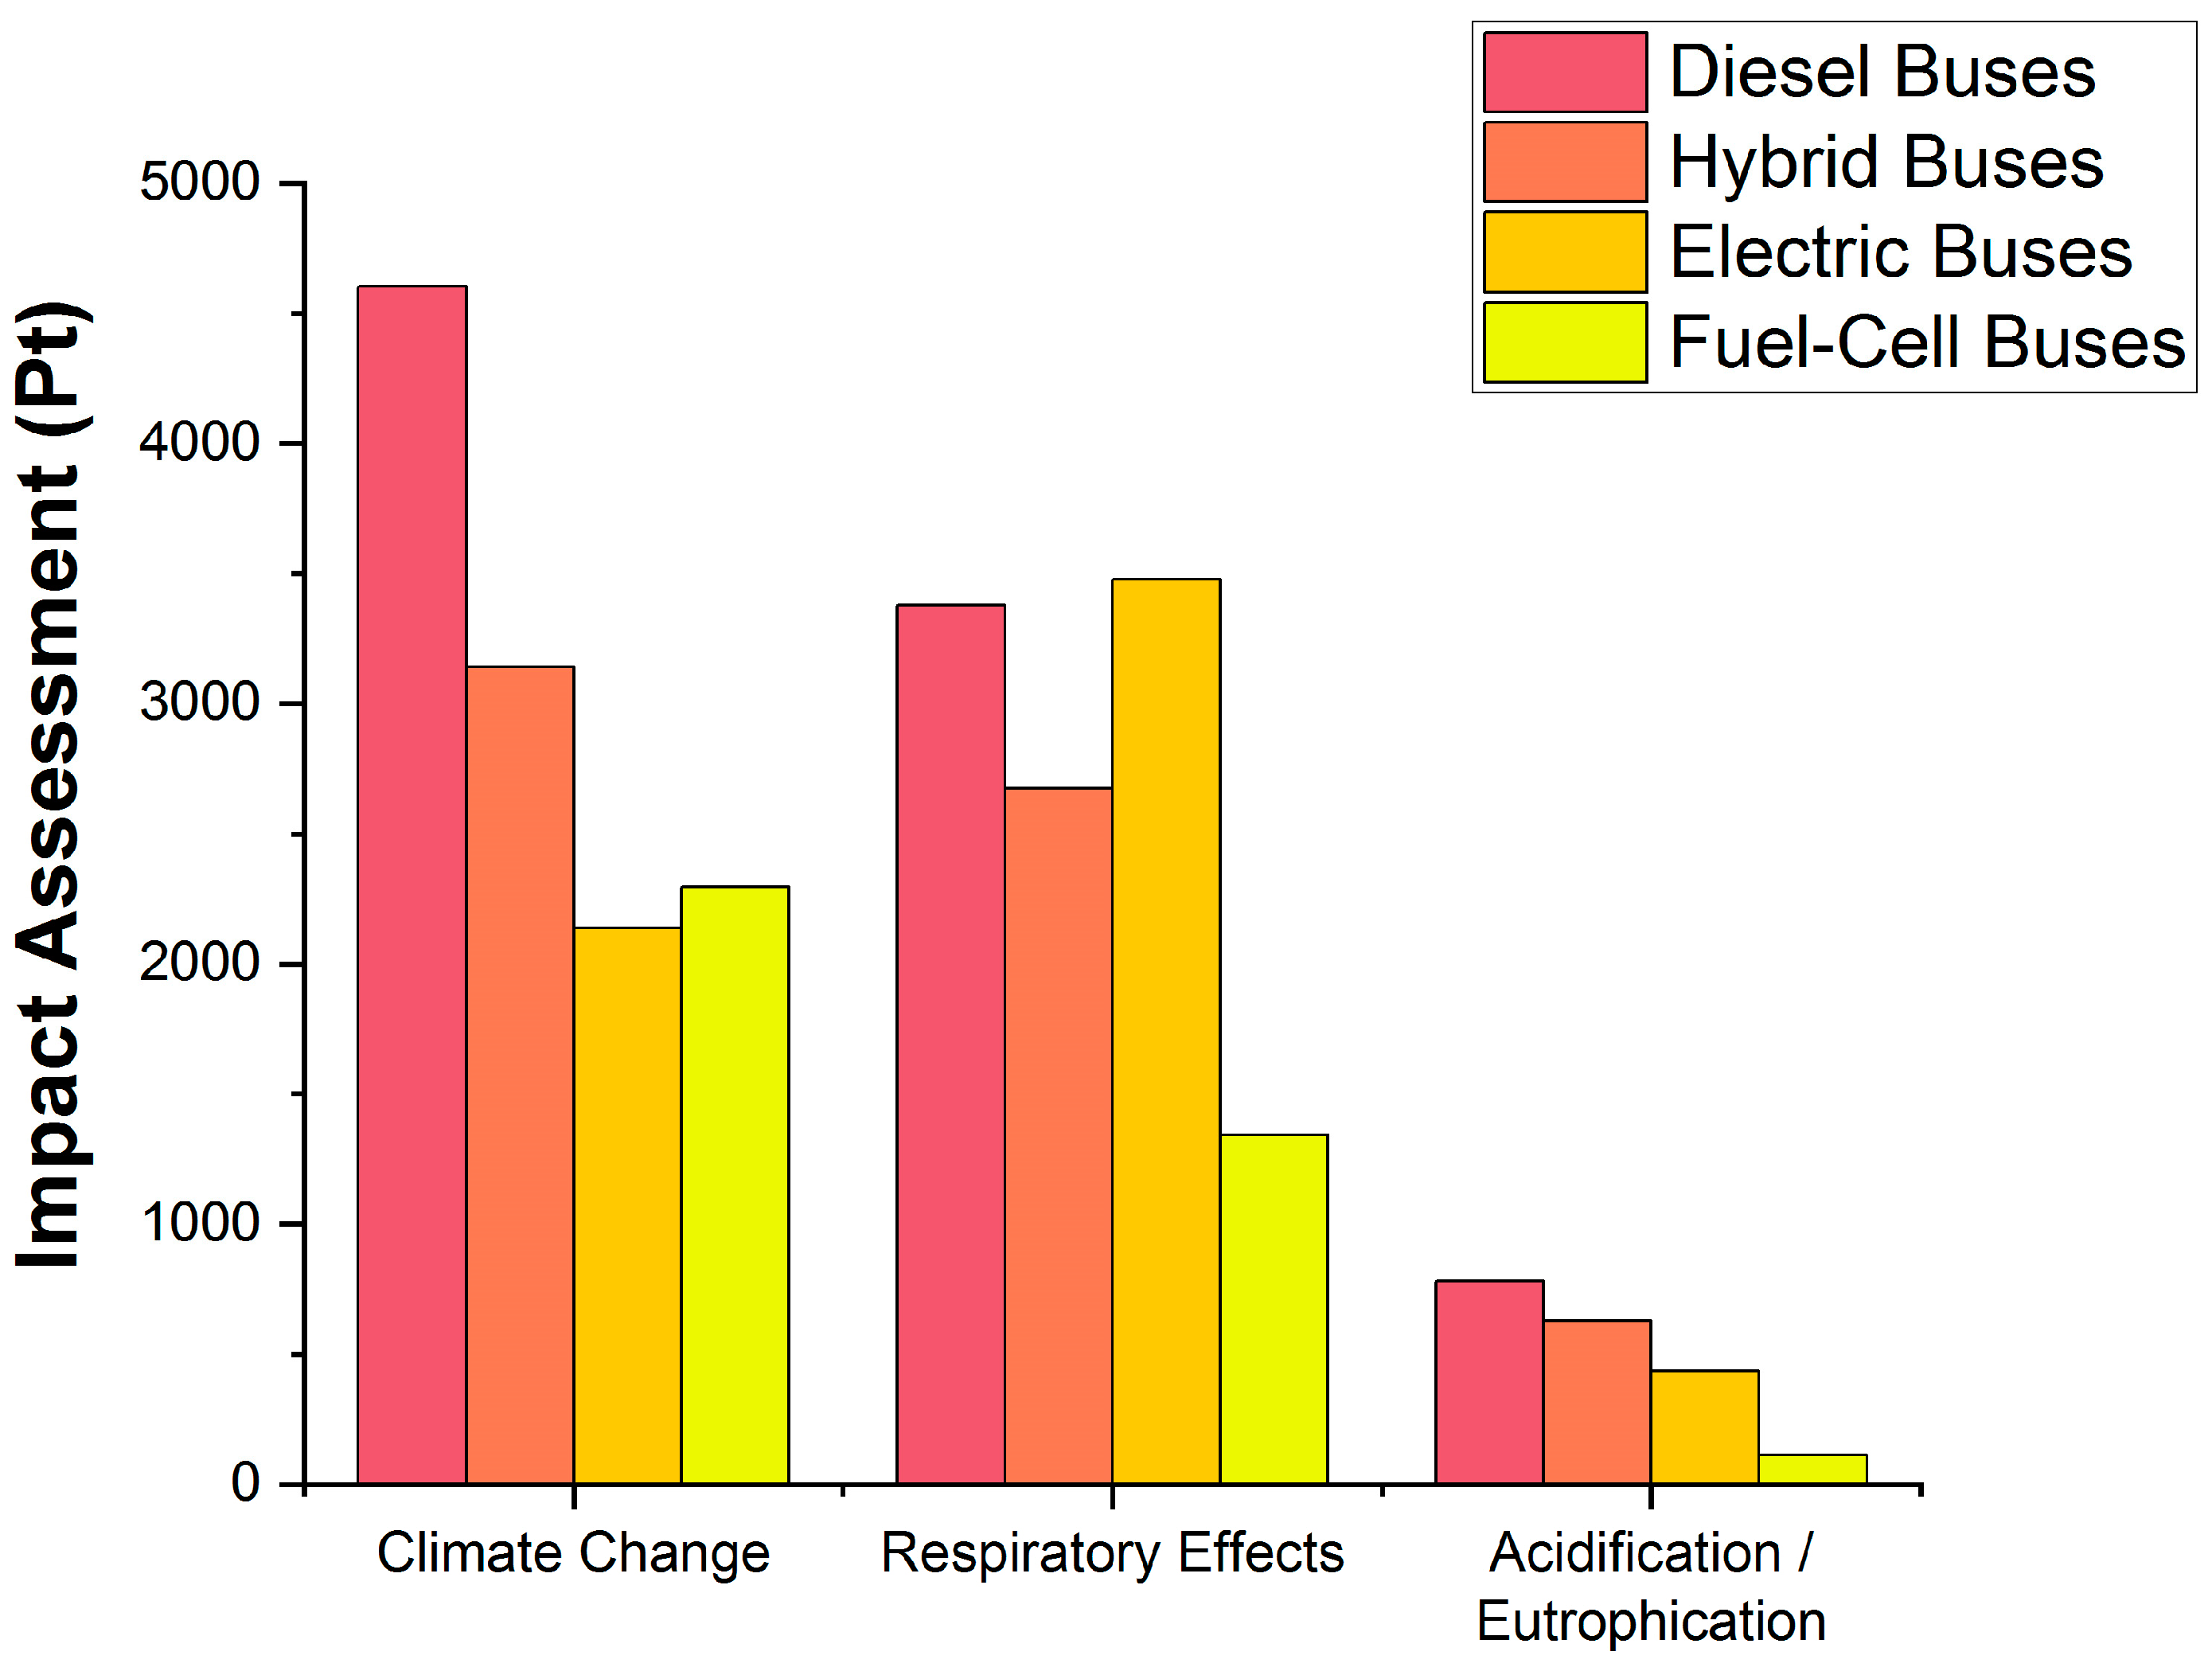
Climate change, respiratory effects, and acidification/eutrophication are computed to give a complete picture of the daily environmental impact assessment of different bus options and are summarized in
Figure 10. When compared to other options, the reduced effects of climate change are most evident in the case of electric and fuel-cell buses, which have the lowest CO
2 scores (2000 points for electric buses and 2200 points for fuel-cell buses). In terms of environmental impact assessment, electric buses and fuel-cell buses have the lowest environmental impacts in climate change, respiratory effects, acidification, and eutrophication. Diesel buses come last with double the climate change impact, three times the respiratory effects, and seven times more impact than fuel-cell buses. This latter is found to have a smaller impact on respiratory impacts compared to electric buses due to their lower scores for NO
x emissions. Plus, fuel-cell buses are viewed as an alternate option with a far smaller influence on acidification and eutrophication than electric buses due to their lower NO
x emissions. Thus, hydrogen is the best in terms of respiratory effects and acidification/eutrophication, whereas electric buses are better in terms of climate change impacts. On the other hand, hybrid buses have higher environmental impact but are still better than diesel buses. Overall, fuel-cell buses are the best alternative fuel buses in terms of environmental impact.
3.5. Summary and Discussion
Results have shown that battery-electric buses are the best alternative fuel buses in terms of energy use because fuel-cell buses are better in connection with environmental impact. Results and preferences are directly related to the national energy profile and power generation mix; therefore, the outcome could have been different considering other factors, such as on-site renewable energy generation or green hydrogen use. However, the authors preferred assessing alternative fuel buses within the Moroccan low-carbon strategy scope [
7].
This study allows future decarbonization plans for Morocco’s public transport system to include an economic assessment based on avoided carbon price criteria and LCA carbon footprint evaluations on various fuel mixtures or technology. Furthermore, a total cost of ownership is needed to evaluate the return on investment and payback period for the studied alternative fuel buses and convince companies to shift to cleaner fuel buses.
Alternative fuel buses are typically implemented by transit agencies and other government agencies with transportation interests. Hence, governmental agencies are the most influential stakeholder, and understanding constraints from their perspective is crucial. The barriers listed in
Table 5 are not meant to deter policymakers from the transition to cleaner public transportation systems but to warn them of potential mistakes and risks. The barriers were derived from [
30,
31,
32] and were listed into technological, financial, and institutional challenges. The major trade space elements concerned with the barriers are operators and agencies, vehicles, and charging infrastructure. Hybrid buses are not concerned with the listed challenges as they operate on fuel whilst guaranteeing a reduction in energy consumption and environmental impact. Therefore, hybrid buses are regarded as the safest alternative to conventional diesel buses, though they would consume 19.0% more energy than battery-electric buses and 16.7% more energy than fuel-cell buses in addition to a surplus of 32.7% and 27.2% of GHG emissions with regards to battery-electric buses and fuel-cell buses, respectively.
4. Conclusions
This research used a fuel life cycle (well-to-wheel) analysis to evaluate alternative buses (hybrids, electrics, and fuel cells) against conventional diesel buses in a national setting, by province. The research relies heavily on daily mileage covered to evaluate energy use, GHG emissions, criterion air pollutants, and environmental impact assessment of the studied buses.
With its electricity production mix in 2030, Morocco could reduce the energy consumption of public buses by 44.7% with battery-electric buses, by 36.3% with fuel-cell buses, or by 31.7% with hybrid diesel-electric buses. In the same fashion, this would lead to a reduction of GHG emissions by 50.8% with battery-electric buses, 46.7% with fuel-cell buses, and 26.9% with hybrid diesel-electric buses. However, fuel-cell buses are the best in terms of environmental impacts, according to the results of the research. In summary, electric buses are the best alternative in terms of energy consumption, while fuel-cell buses are better with respect to environmental impacts.
To fully put battery-electric buses or fuel-cell buses in service, Morocco has to overcome technological, financial, and institutional barriers on the level of operators and agencies, vehicles and batteries, and grid and charging infrastructure. Hybrid diesel-electric buses are not concerned with any of the barriers, which makes this alternative the safest option in case Morocco faced challenges in overcoming the mentioned barriers. Still, hybrid diesel-electric buses guarantee a reduction in energy consumption and GHG emissions by 31.7% and 26.9%, respectively, with regard to current diesel buses in service.
The outcome of the study was based on the energy profile of Morocco, but it can be applied to developing economies with comparable energy profiles, particularly those that rely heavily on coal for electricity generation. It should be noted that the study’s assumptions impacted the choice of the most suitable alternative fuel bus, and the results could have been different if green hydrogen or self-powered charging stations from renewable sources had been evaluated. However, these alternatives were not considered in the study since they are not part of the national low carbon strategy for 2050. As a result, forthcoming studies should involve an evaluation of alternative fuel vehicles that considers a sensitivity analysis of various fuel source scenarios at the national level.


