Article

Restoring Subtropical Forests: Alleviating P Limitation and Introducing C Limitation Using Evergreen Broad-Leaved Tree Species

Hubei Key Laboratory of Regional Development and Environmental Response, Faculty of Resources and Environmental Sciences, Hubei University, Wuhan 430062, China
*
Author to whom correspondence should be addressed.
Forests 2024, 15(3), 568; https://doi.org/10.3390/f15030568
Submission received: 28 January 2024 / Revised: 19 March 2024 / Accepted: 20 March 2024 / Published: 21 March 2024
(This article belongs to the Special Issue Microbial Community Composition and Function in Forest Soil)

Abstract

:
Determining which species to utilize for the artificial restoration of subtropical secondary forests has become a focal point in forestry and ecology. To compare the effects of the subtropical secondary forest artificial restoration model on soil microbial nutrient acquisition and limitation, we examined secondary forests (CKs), evergreen coniferous forests (GCPs), evergreen coniferous mixed broad-leaved forests (GCBMs), evergreen mixed broad-leaved forests (GBMs), and natural deciduous broad-leaved mixed forests (DBMs) as research subjects. Among them, GCPs, GCBMs, and GBMs were dominated by the species of the early, middle, and climax stages of subtropical forest succession, respectively. The activities and stoichiometry of β-1,4-glucosidase (BG), β-1,4-N-acetylglucosaminidase (NAG), leucine aminopeptidase (LAP), and acid phosphatase (ACP) in the topsoil were analyzed. The results showed that the forest type significantly affects the activities of BG and LAP rather than NAG or ACP. The BG activity in DBMs was the lowest, while the LAP activity in CKs was significantly higher than that in plantations. Furthermore, the nutrient limitation of microbes was quantitatively analyzed by using the vector analysis of enzyme stoichiometry. The soil microbes in the study area were co-limited by C and P, and the nutrient limitation was in the order of C > P > N. Among the forests, the enzyme stoichiometric ratios in GCPs and DBMs were closest to 1:1:1. From CKs to GBMs, the microbial C limitation was increased, while the P limitation was decreased. The C limitation in DBMs was slightly lower than that in CKs. Overall, the P limitation in evergreen plantations was less than that in CKs. The soil bulk density, C/P, and N/P significantly influenced enzyme activities and stoichiometry. These results suggest that the artificial restoration of subtropical forests using evergreen species alleviated P limitation, while using deciduous broad-leaved species offered potential for alleviating microbial C limitation. Compared with evergreen broad-leaved species, employing pioneer and mid-successional or deciduous broad-leaved species can better achieve balanced microbial nutrient requirements.

1. Introduction

Subtropical forests hold significant ecological and scientific value, as they feature the zonal vegetation of evergreen broad-leaved mixed forests. China serves as the primary distribution area for evergreen broad-leaved forests, and it boasts the most abundant subtropical forest resources. However, historical factors have led to the degradation of natural forests into secondary forests, making their restoration a critical task. Employing secondary plant succession emerges as an effective approach for the restoration of degraded ecosystems [1,2]. This method encompasses natural and artificial restoration models. Establishing plantations to facilitate natural regeneration and expedite forest succession is considered a rapid method. Such plantations notably contribute to carbon stock growth in forest ecosystems, representing a key strategy for mitigating global warming [3]. The selection of suitable species for artificial restoration is pivotal. Therefore, determining which species to utilize for the artificial restoration of subtropical secondary forests has become a focal point in forestry and ecology.
Evergreen coniferous forest (GCP), evergreen coniferous mixed broad-leaved forest (GCBM), and evergreen mixed broad-leaved forest (GBM) represent the early, middle, and climax stages of subtropical forest succession, respectively. Throughout this succession, the proportion of evergreen broad-leaved tree species increases. Additionally, natural deciduous broad-leaved mixed forests (DBMs) are widespread in upland and subtropical to temperate transition zones. This suggests the consideration of various successional or deciduous broad-leaved tree species for artificially restoring secondary forests. Most studies on secondary forest restoration have focused on comparing coniferous, mixed coniferous and broad-leaved, and broad-leaved forests [2]. However, they often overlook DBMs despite their significance in subtropical forests in China. Therefore, investigating the impact of using tree species from different succession stages and deciduous broad-leaved species in the artificial restoration of subtropical secondary forests is essential.
Soil microbes are highly sensitive to environmental fluctuations and respond rapidly to changes in soil nutrient availability [4,5]. Insufficient soil nutrients can limit microbial growth and metabolism, altering microbial extracellular enzyme activity (EEA) [6,7]. These enzymes drive soil organic matter decomposition, regulating soil nutrient cycling and energy flux. EEAs effectively mirror the biochemical balance between soil nutrient availability and microbial nutritional demands [8,9]. In nutrient-deficient conditions, microbes synthesize extracellular enzymes to meet their nutritional needs, which is a critical mechanism for maintaining nutrient balance [10].
It is widely acknowledged that soil microbes secrete β-1,4-glucosidase (BG) and phosphatase (ACP) as C and P hydrolases while secreting β-1,4-N-acetylglucosaminidase (NAG) and leucine aminopeptidase (LAP) to acquire N [8,9]. Globally, the relative activity of microbial C, N, and P extracellular enzymes, which is known as EEA stoichiometric ratio, in topsoil is ~1:1:1 after logarithmic transformation [11]. However, soil microbes secrete specific extracellular enzymes to obtain limited nutrients, altering the EEA stoichiometric ratios [12], which are linked to resource availability. According to the “optimal allocation” model of ecological economics, soil microbes allocate more resources to acquire limited nutrients [13]. For example, studies on cross-latitude gradients in Chinese forests indicate that the C/N EEA ratio is less than 1:1 [14], suggesting microbial N limitation. The addition of N shifts microbes from N limitation to C limitation, significantly increasing the BG activity but decreasing N-related EEA [15]. Therefore, changes in EEA and its stoichiometric ratio can indicate nutrient limitation and microbial nutrient requirements.
Biological and abiotic factors’ impacts on EEA have garnered attention. Climate factors wield greater influence on a broad scale compared to soil factors [14,16]. However, regionally, alterations in soil physicochemical properties (e.g., pH, soil moisture, soil C and N contents) directly or indirectly affect EEA and stoichiometric ratios [17,18,19,20,21], with these factors being highly responsive to climate shifts [6]. Xu et al. [22] observed significant negative correlations between the C/P and N/P of EEA and the soil C/P and soil N/P, respectively, in their study of Chinese forest ecosystems. Additionally, vegetation diversity, species richness, and genus characteristics contribute to understanding changes in regional-scale EEA and stoichiometric ratios [21,23].
Therefore, to evaluate the artificial restoration model for subtropical secondary forests, we examined secondary forests, GCPs, GCBMs, GBMs, and DBMs as our research subjects. Our analysis focused on soil microbial nutrient limitation and its influencing factors viewed from the perspective of EEA and its stoichiometry. As vegetation succession progresses, mineral nutrients increasingly limit microbes, thereby altering EEA stoichiometry [24,25]. Microbial C limitation intensifies as secondary forest succession proceeds [26]. Therefore, we first hypothesized that C limitation in evergreen plantations intensifies with the increase in broad-leaved tree species. Second, because the subtropics are generally considered to be P-limited [27,28], we hypothesized that the P limitation is weakened in plantations compared to that in secondary forests. Finally, we hypothesized that differences in EEA and stoichiometric ratios stem from differences in soil nutrients. This study enhances the comprehension of microbial nutrient requirements in the artificial restoration of subtropical secondary forests, offering guidance for the sustainable development of subtropical forests.

2. Materials and Methods

2.1. Study Area Description

The study area, which is located in Jiufeng National Forest Park of Hubei Academy of Forestry (114°20′50″ E, 30°31′04″ N), Wuhan City, Hubei Province, China, spans 333.3 hectares. It typifies a subtropical monsoon climate characterized by simultaneous precipitation and high temperatures alongside high humidity and abundant rainfall. The annual average temperature stands at 16.3 °C, with the annual precipitation ranging from 1200 to 1400 mm annually and an average relative humidity of 79%. The vegetation predominantly comprises subtropical evergreen broad-leaved forests, coniferous forests, and mixed evergreen coniferous and broad-leaved forests, with an overall forest coverage rate of ~90%.

2.2. Experimental Design and Soil Sampling

At the study site, representative secondary forests (CKs), GCPs, GCBMs, GBMs, and DBMs were selected (Table 1). Except for the CKs, the other four forests were planted simultaneously in secondary forests, and they shared similar initial site conditions and planting density. The dominant species in the GCPs, GCBMs, and GBMs represented the pioneer, middle, and late stages of the subtropical forest succession, respectively, and DBM is another forest type that is widespread in subtropical upland and subtropical to temperate transition zones. The dominant species in the GCPs was Pinus massoniana, those in the GCBMs were Cunninghamia lanceolata and Symplocos sumuntia, those in the GBMs were Quercus glauca and Elaeocarpus decipiens, and those in the DBMs were Liquidambar formosana and Quercus variabilis. These were the dominant tree species in the corresponding forest succession stages. The dominant understory vegetation included Mallotus tenuifolius, Phyllostachys sulphurea, Loropetalum chinense, Choerospondias axillaris, Zanthoxylum schinifolium, Quercus chenii, Diospyros kaki, and Dryopteris austriaca.
For each forest type, three 20 × 20 m plots were randomly assigned ~100 m away from surrounding agricultural areas, roads, or forests of varying ages. Soil samples (0–10 cm) were collected in October 2022 from ten random locations on each plot and combined to create composite samples. In the laboratory, the soil samples were divided into three sections. One section was kept fresh at 4 °C to facilitate nitrogen extraction and water content determination. Another section was preserved at −80 °C for EEA assessment. The remaining soil was air-dried and used to measure pH, total organic carbon (TOC), total nitrogen (TN), total phosphorus (TP), and other nutrients.

2.3. Soil Physicochemical Analyses

During soil sampling, soil temperature and water content were measured using a soil meter (W.E.T.-2, Delta-T Devices Ltd., Cambridge, UK). Soil pH was determined in the laboratory with a compound electrode (MP551, Shjingmi, Shanghai, China) using a 1:2.5 (w/w) soil–water suspension ratio. TOC and TN contents were analyzed with an elemental analyzer (Vario Macro Cube, Elementar, Langenselbold, Germany). The TP and available phosphorus (AP) were measured using the molybdenum antimony blue colorimetric method and ammonium acetate extraction method, respectively [29].

2.4. Soil Enzyme Activities

Four hydrolases (related to C, N, and P) were selected for analysis (Table 2). After soil suspension and substrate incubation, EEA determination was performed using 96-microtiter plates and detection kits from Baihui Organisms Ltd., Beijing, China. The specific methods were referred to in a previous study [30], and the kits’ instructions were strictly followed. The hydrolase fluorescence intensities were measured by utilizing a multifunctional enzyme marker (M200 PRO, Tecan, Männedorf, Switzerland) with an excitation wavelength of 365 nm and an emission wavelength of 450 nm.

2.5. Calculation and Statistical Analysis

The soil enzyme stoichiometric ratio was calculated with the ratio of hydrolase activity as follows:
C/NEEA = ln(BG):ln(NAG + LAP)
C/PEEA = ln(BG):ln(ACP)
N/PEEA = ln(NAG + LAP):ln(ACP),
where C/NEEA, C/PEEA, and N/PEEA refer to the C:N enzyme activity ratio, C:P enzyme activity ratio, and N:P enzyme activity ratio, respectively.
The microbial nutrient limitation was measured with the vector length (Vector L) and vector angle (Vector A) [31] as follows:
X = (BG):(BG + ACP)
Y = (BG):(BG + NAG + LAP)
Vector L = Sqrt (X2 + Y2)
Vector A = Degrees [Atan2(X, Y)]
Vector L indicates the microbial C relative to N and P limitation, where the longer the vector, the more C limitation microbes faced; Vector A indicates microbial P limitation relative to N limitation, where Vector A > 45° and < 45° indicate microbial P limitation and N limitation, respectively.
One-way analysis of variance (ANOVA) and Duncan’s multiple-range test were performed to examine the differences among the soil physicochemical properties, EEA, and the stoichiometric ratios in different forests. Prior to the ANOVA, tests for normality (Shapiro–Wilks) and homogeneity of variances (Hartley’s F test) were executed. Linear regressions analyzed correlations between soil enzyme activities. The Pearson correlation was used to assess the correlations between soil physicochemical properties and EEA alongside the stoichiometric ratios. Redundancy analysis (RDA) was used to explore the significant influences of soil physicochemical properties on EEA and the stoichiometric ratios. Monte Carlo permutation tests of explanatory variables were performed for RDA. All statistical analyses were performed using R (v. 4.3.1), with RDA being executed via the “vegan” package (v.2.6-4). Significance was set at p < 0.05 unless specified otherwise.

3. Results

3.1. Soil Physicochemical Properties

The forest type significantly affected the soil temperature, bulk density, pH, and TOC (p < 0.05, Table 3). Compared to CKs, both GCPs and GCBPs exhibited lower soil temperatures (p < 0.05), while CKs had significantly higher bulk density and pH (p < 0.05). Among the five forest types, CKs also had the lowest TOC, which was significantly lower than that in GCPs, GCBPs, and DBMs (p < 0.05). However, soil moisture, TN, TP, AP, C/N, C/P, and N/P were not significantly affected by the forest type (p > 0.05).

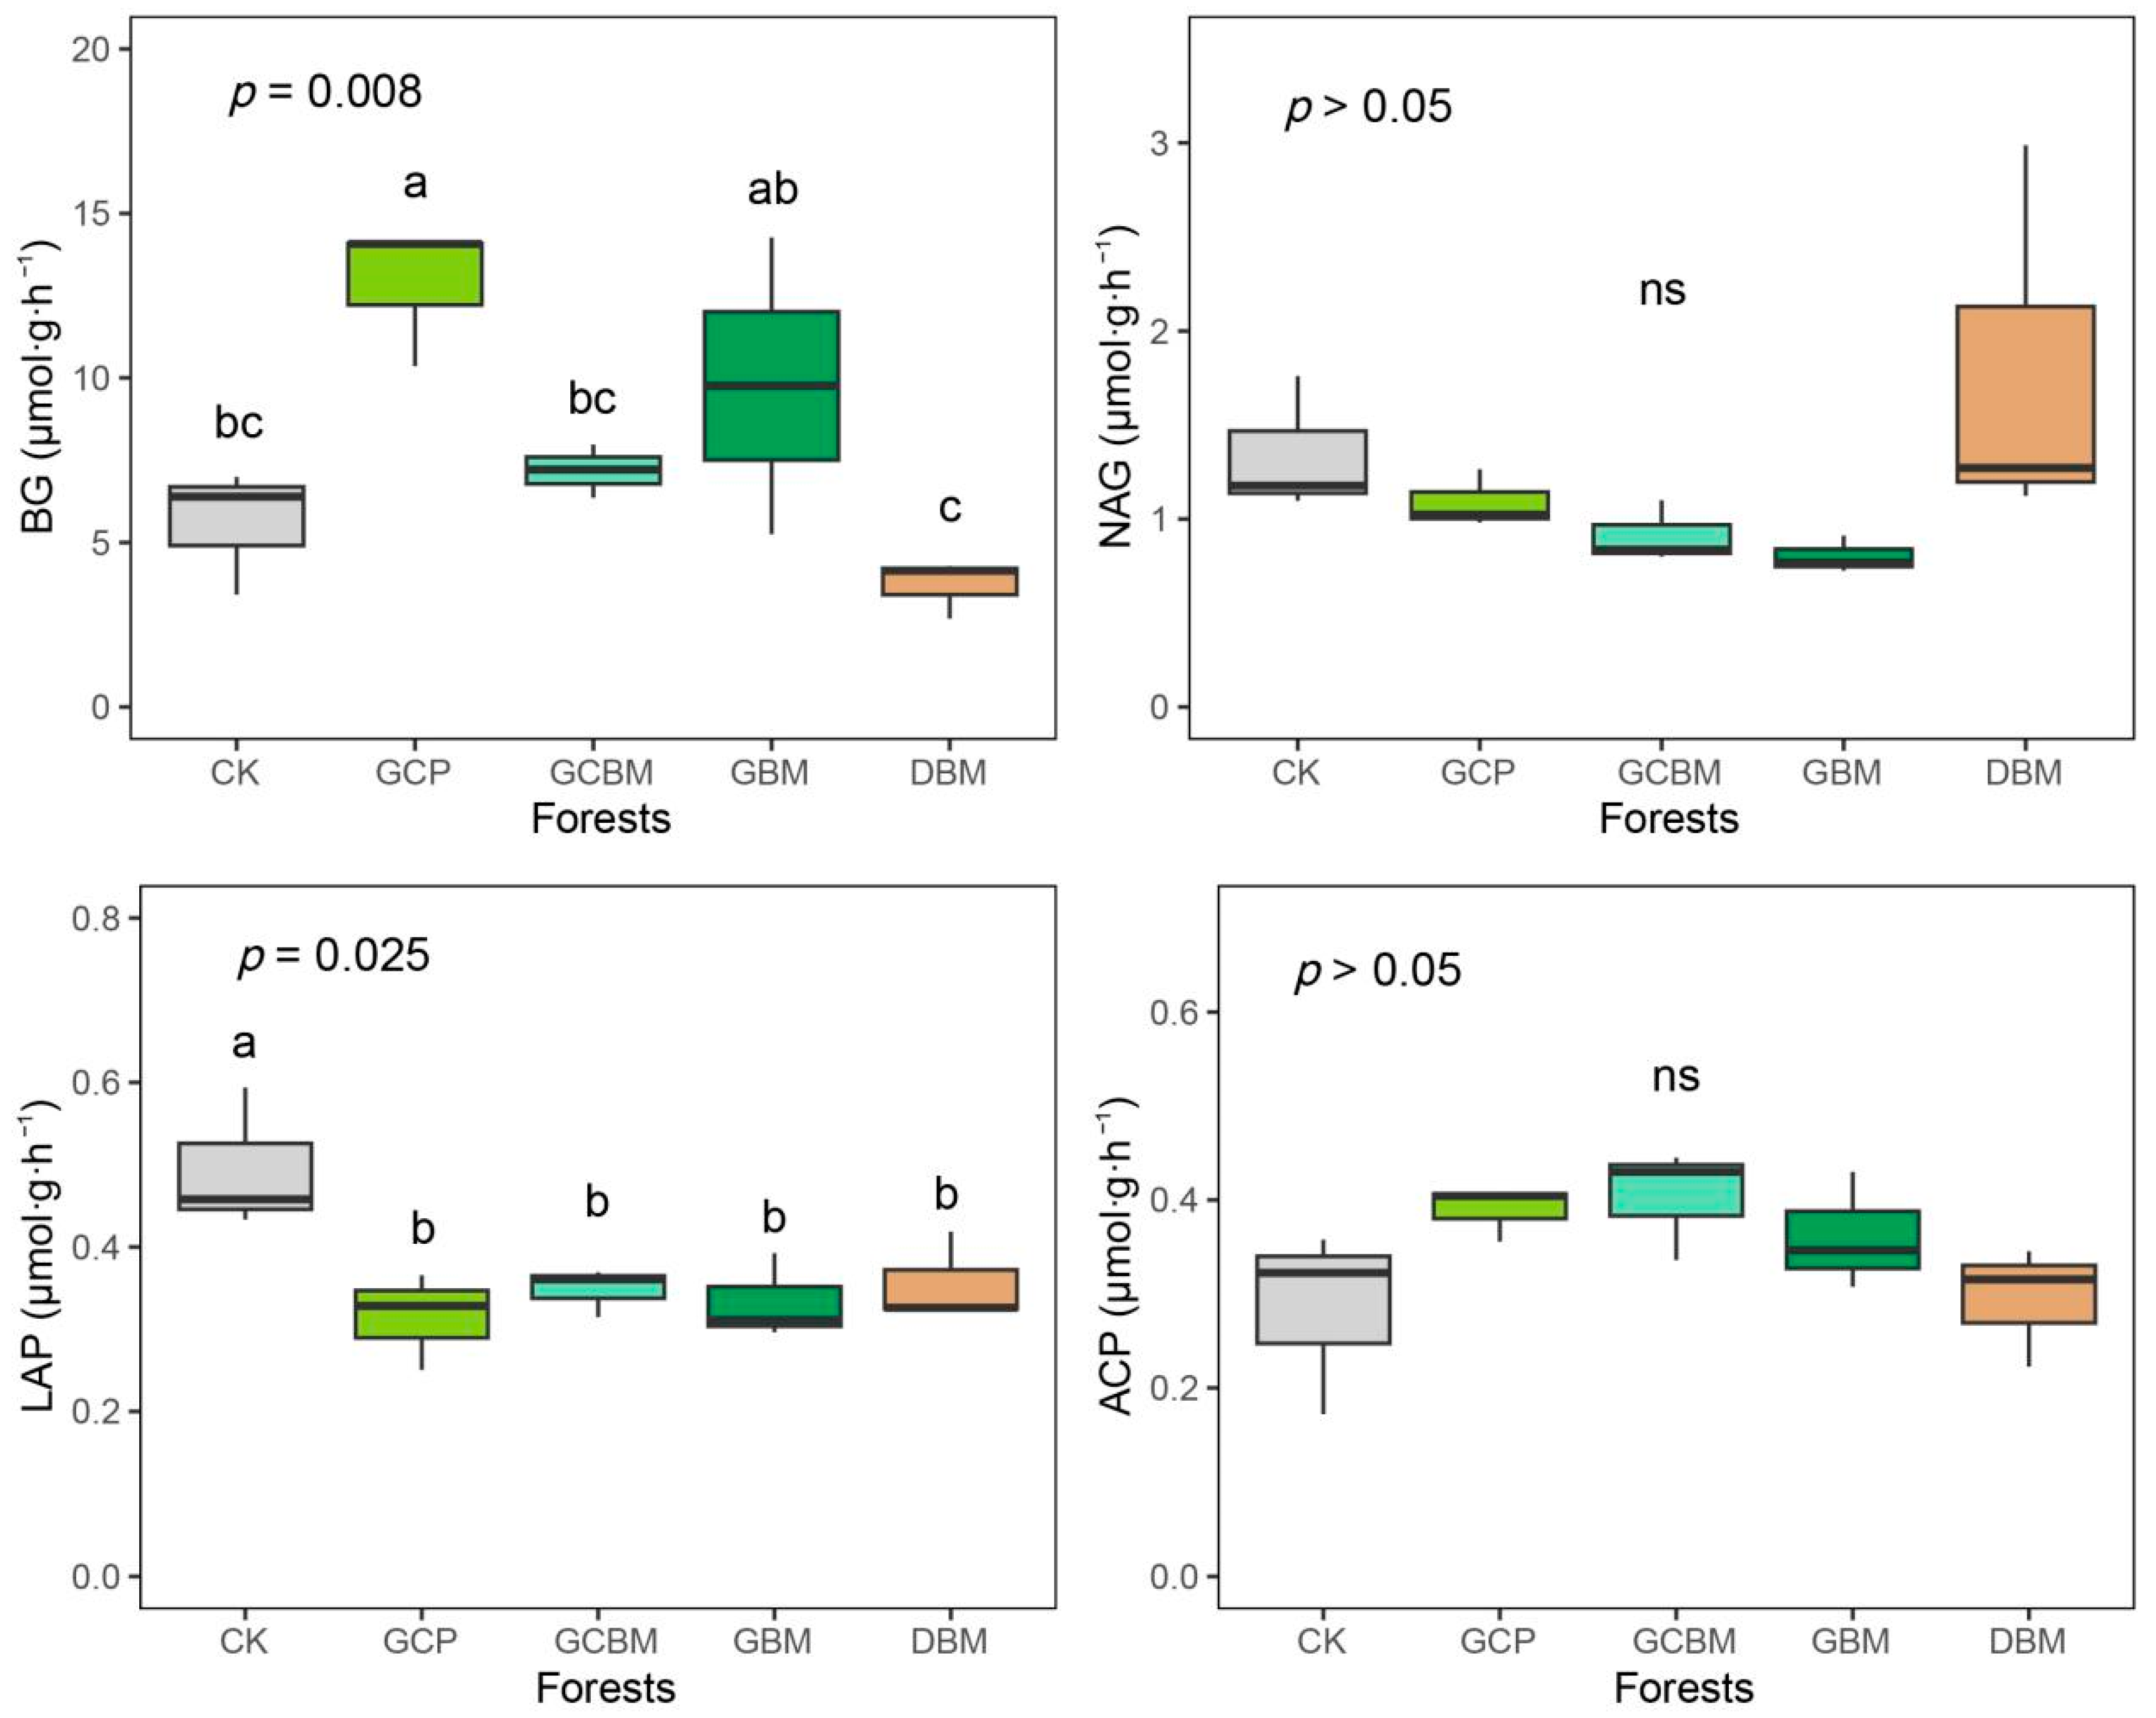
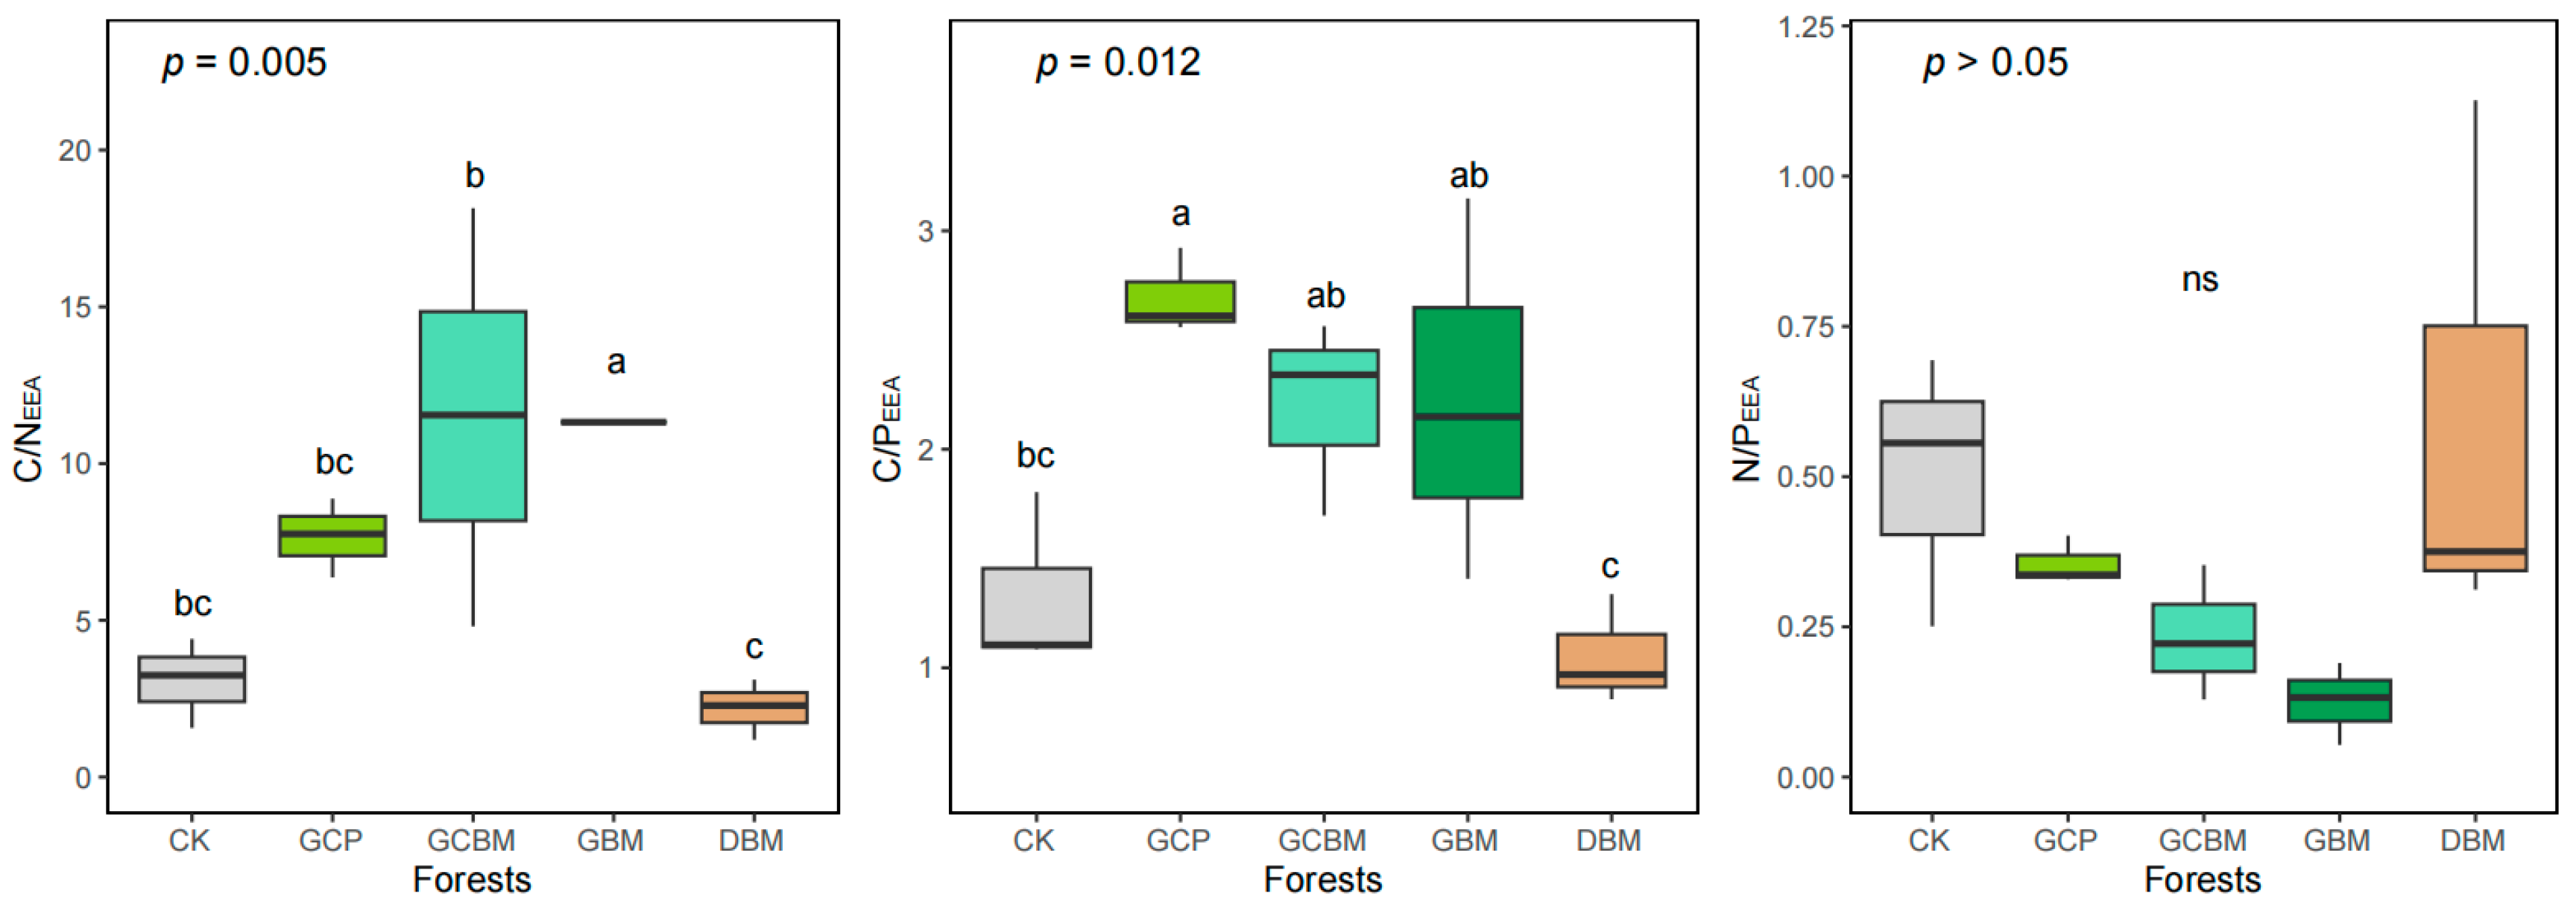
3.2. Soil Enzyme Activities and Their Stoichiometry

The forest type had significant effects on the BG and LAP activities (p < 0.05) but not on the NAG and ACP activities (p > 0.05, Figure 1). Compared with that in CKs, the BG activity in GCPs significantly increased (p < 0.05), while there were no significant differences among GCBMs, GBMs, DBMs, and CKs (p > 0.05). The LAP activities in the four plantations were all significantly lower than that in CKs, and there were no significant differences among these plantations.
Compared to that in CKs, the C/N EEA significantly increased from GCPs to GBMs (p < 0.05, Figure 2), while the C/N EEA of DBMs was only slightly lower than that of CKs (p > 0.05). The C/P EEA showed a trend of GCP > (GCBM or GBM) > CK > DBM. However, no significant differences in the N/P EEA among the forest types were observed (p > 0.05).
The microbes in our study site were co-limited by C and P, and the C/N/P ratio of EEA in the study area was ~1.00:0.25:0.62 (Figure 3). As the intersection points of dotted lines in the figure represent the EEA stoichiometric ratio of 1:1:1, the ratio in GCPs and DBMs was closest to 1:1:1 among the plantations. The vector length and angle results also indicated C and P limitation, with all vector angles exceeding 45° (Figure 4). Compared to that in CKs, the vector length gradually increased from GCPs to GBMs in evergreen plantations but slightly decreased in DBMs. Conversely, the vector angle gradually decreased compared to that in CKs, with no significant difference between DBMs and CKs.

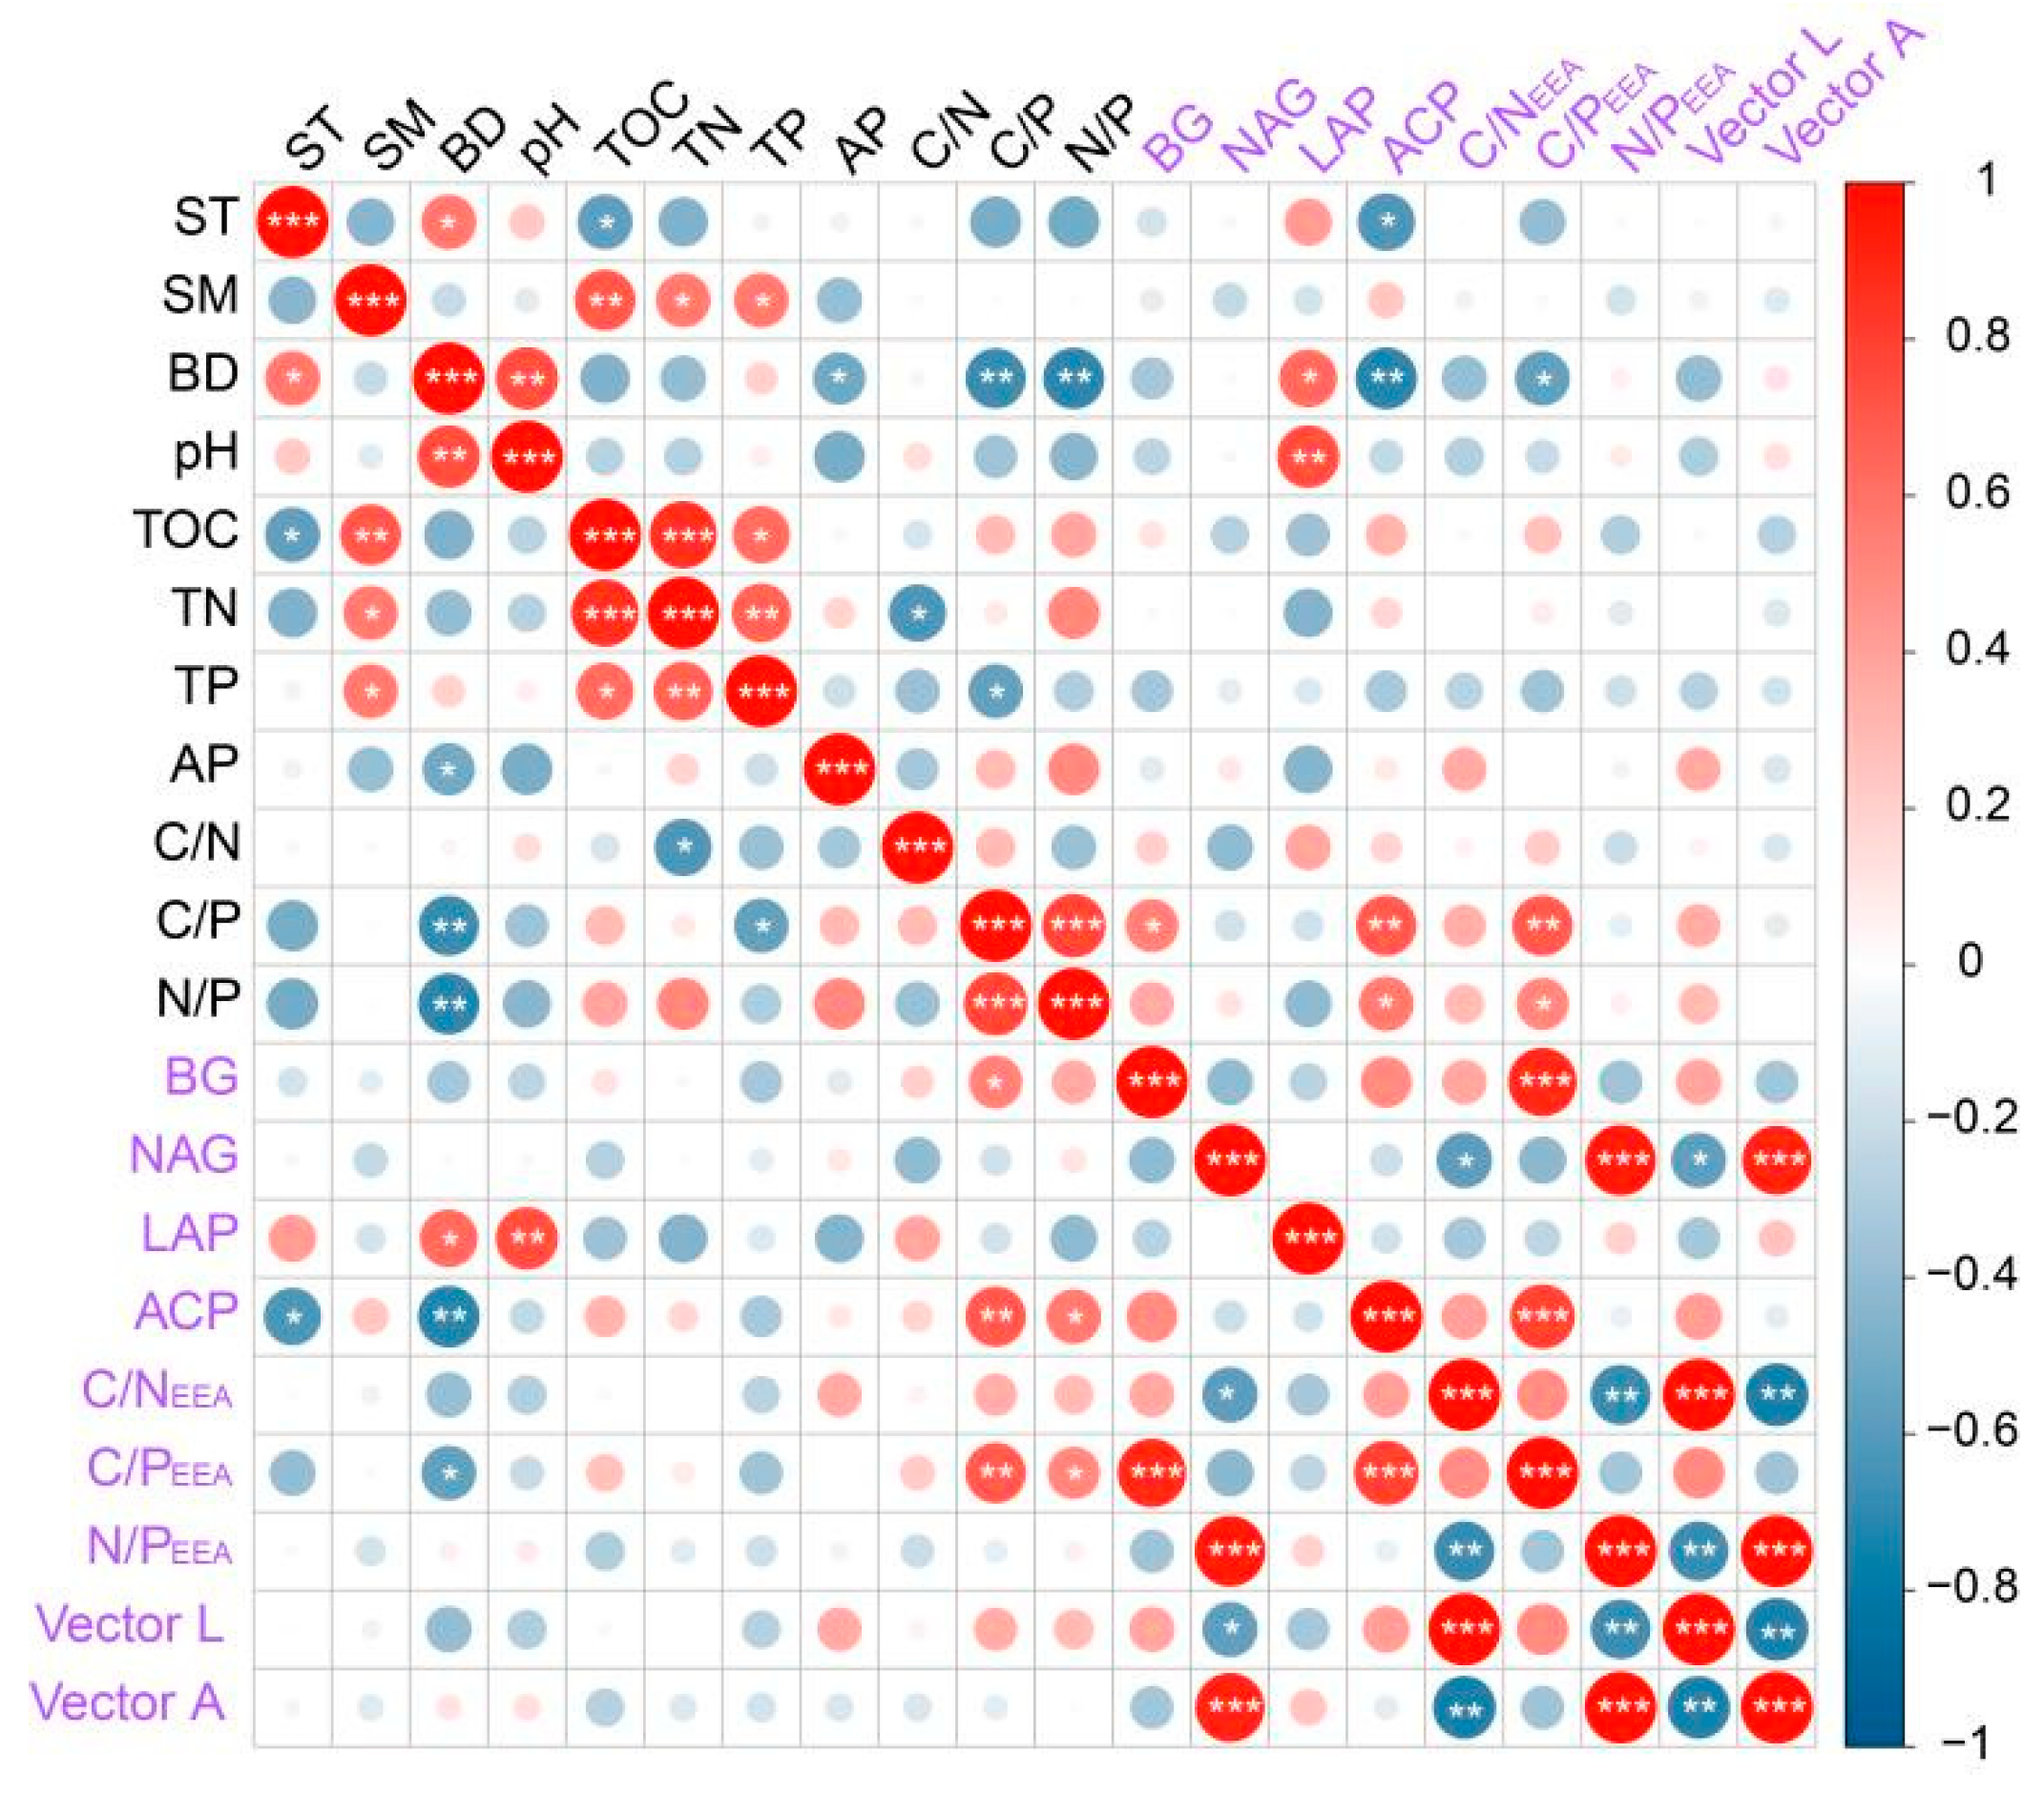
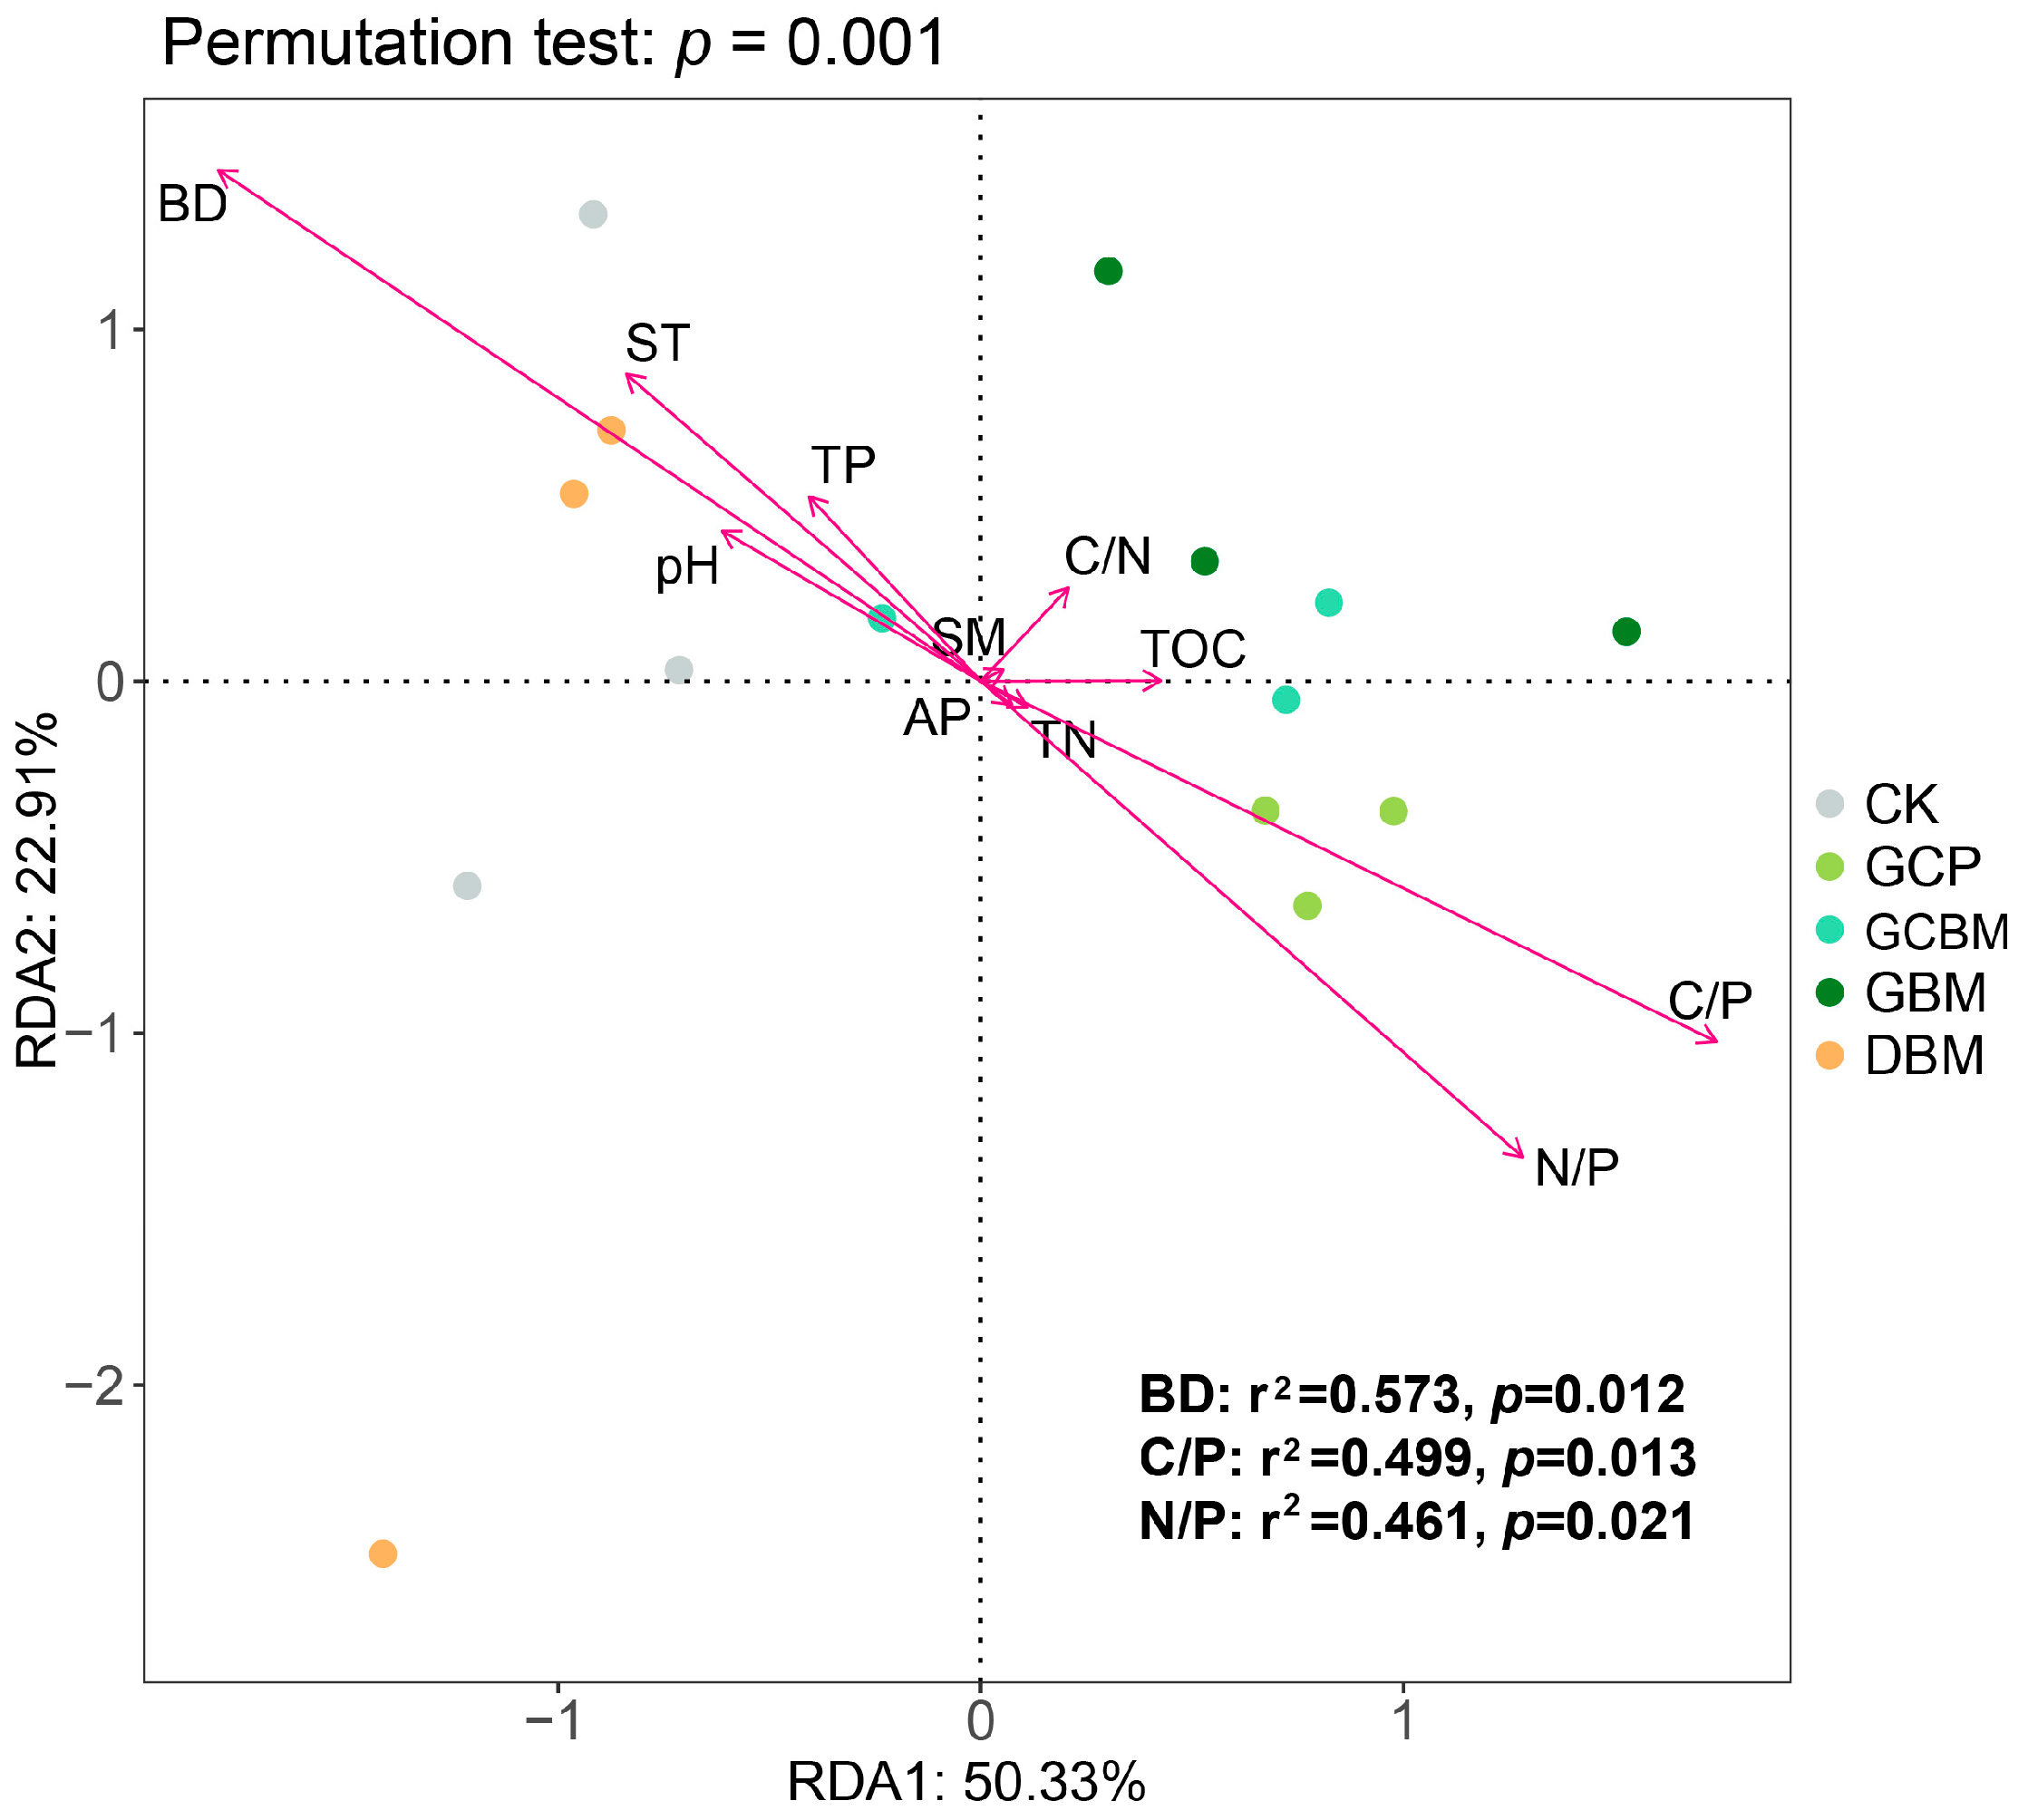
3.3. Relations between Soil Physicochemical Properties and Soil Enzymes

Although no significant correlations were found among the EEAs (p > 0.05, Figure 5), the BG activity positively correlated with soil C/P (p < 0.05), LAP activity positively correlated with soil bulk density and pH (p < 0.05), and ACP activity negatively correlated with soil temperature and bulk density but positively correlated with soil C/P and N/P (p < 0.05). Furthermore, C/P EEA negatively correlated with bulk density but positively correlated with soil C/P and N/P (p < 0.05), while the other EEA stoichiometric ratios showed no correlations with soil physicochemical properties (p > 0.05).
The first two axes (RDA1 and RDA2) in the RDA explained 73.24% of the total variations in EEA and the stoichiometric ratios (Figure 6). They were significantly influenced by soil bulk density (r2 = 0.573), soil C/P (r2 = 0.499), and soil N/P (r2 = 0.461).

4. Discussion

4.1. Soil Enzyme Activities

In this study, the BG activity surpassed the EEA of both N and P (Figure 1), indicating reduced microbial availability of C compared to N and P. The BG activity peaked in GCPs but hit its lowest point in DBMs, with overall higher levels being observed in evergreen than in deciduous plantations. This implies that secondary forest restoration with pioneer conifer species may decrease active soil organic carbon (SOC) content, while deciduous species could offer richer C sources for microbes. Previous studies have shown that forest EEA varies with litter input and root functional traits. Coniferous forest soil typically harbors high lignin and cellulose levels [32]. During the decomposition of soil organic matter, microbes preferentially decompose cellulose, with BG breaking down glucose dimers and cellulose oligosaccharides into small glucose molecules [33]. Conversely, due to their greater litterfall and easily decomposable chemical compositions, deciduous forests generate more active SOC. Studies have highlighted the superior litter quality in deciduous broad-leaved forests compared to their evergreen counterparts [34], suggesting that evergreen species’ litter releases fewer nutrients into the soil than that of deciduous species does. Additionally, microbes derive C from roots and their exudates [35]. However, since root traits, including biomass and exudates, were not studied, differences in root-related characteristics may also contribute to variations in BG secretion among the forests.
Compared to secondary forests, plantations showed significantly decreased LAP activity (Figure 1). Because LAP represents the function of proteolysis (Table 2), the lower LAP activity in artificially restored forests indicates less N demand from proteolysis in these forests, which means an enhanced N bioavailability. This can be supported by the higher TN content but lower soil C/N in plantations (Table 3) because lower soil C/N implies more organic matter mineralization, which increases the available N content in soil. In addition, the positive correlation between LAP and bulk density (Figure 5) reinforces this inference, as plantations exhibited lower bulk density (i.e., larger soil porosity, Table 3), favoring the mineralization of organic matter.

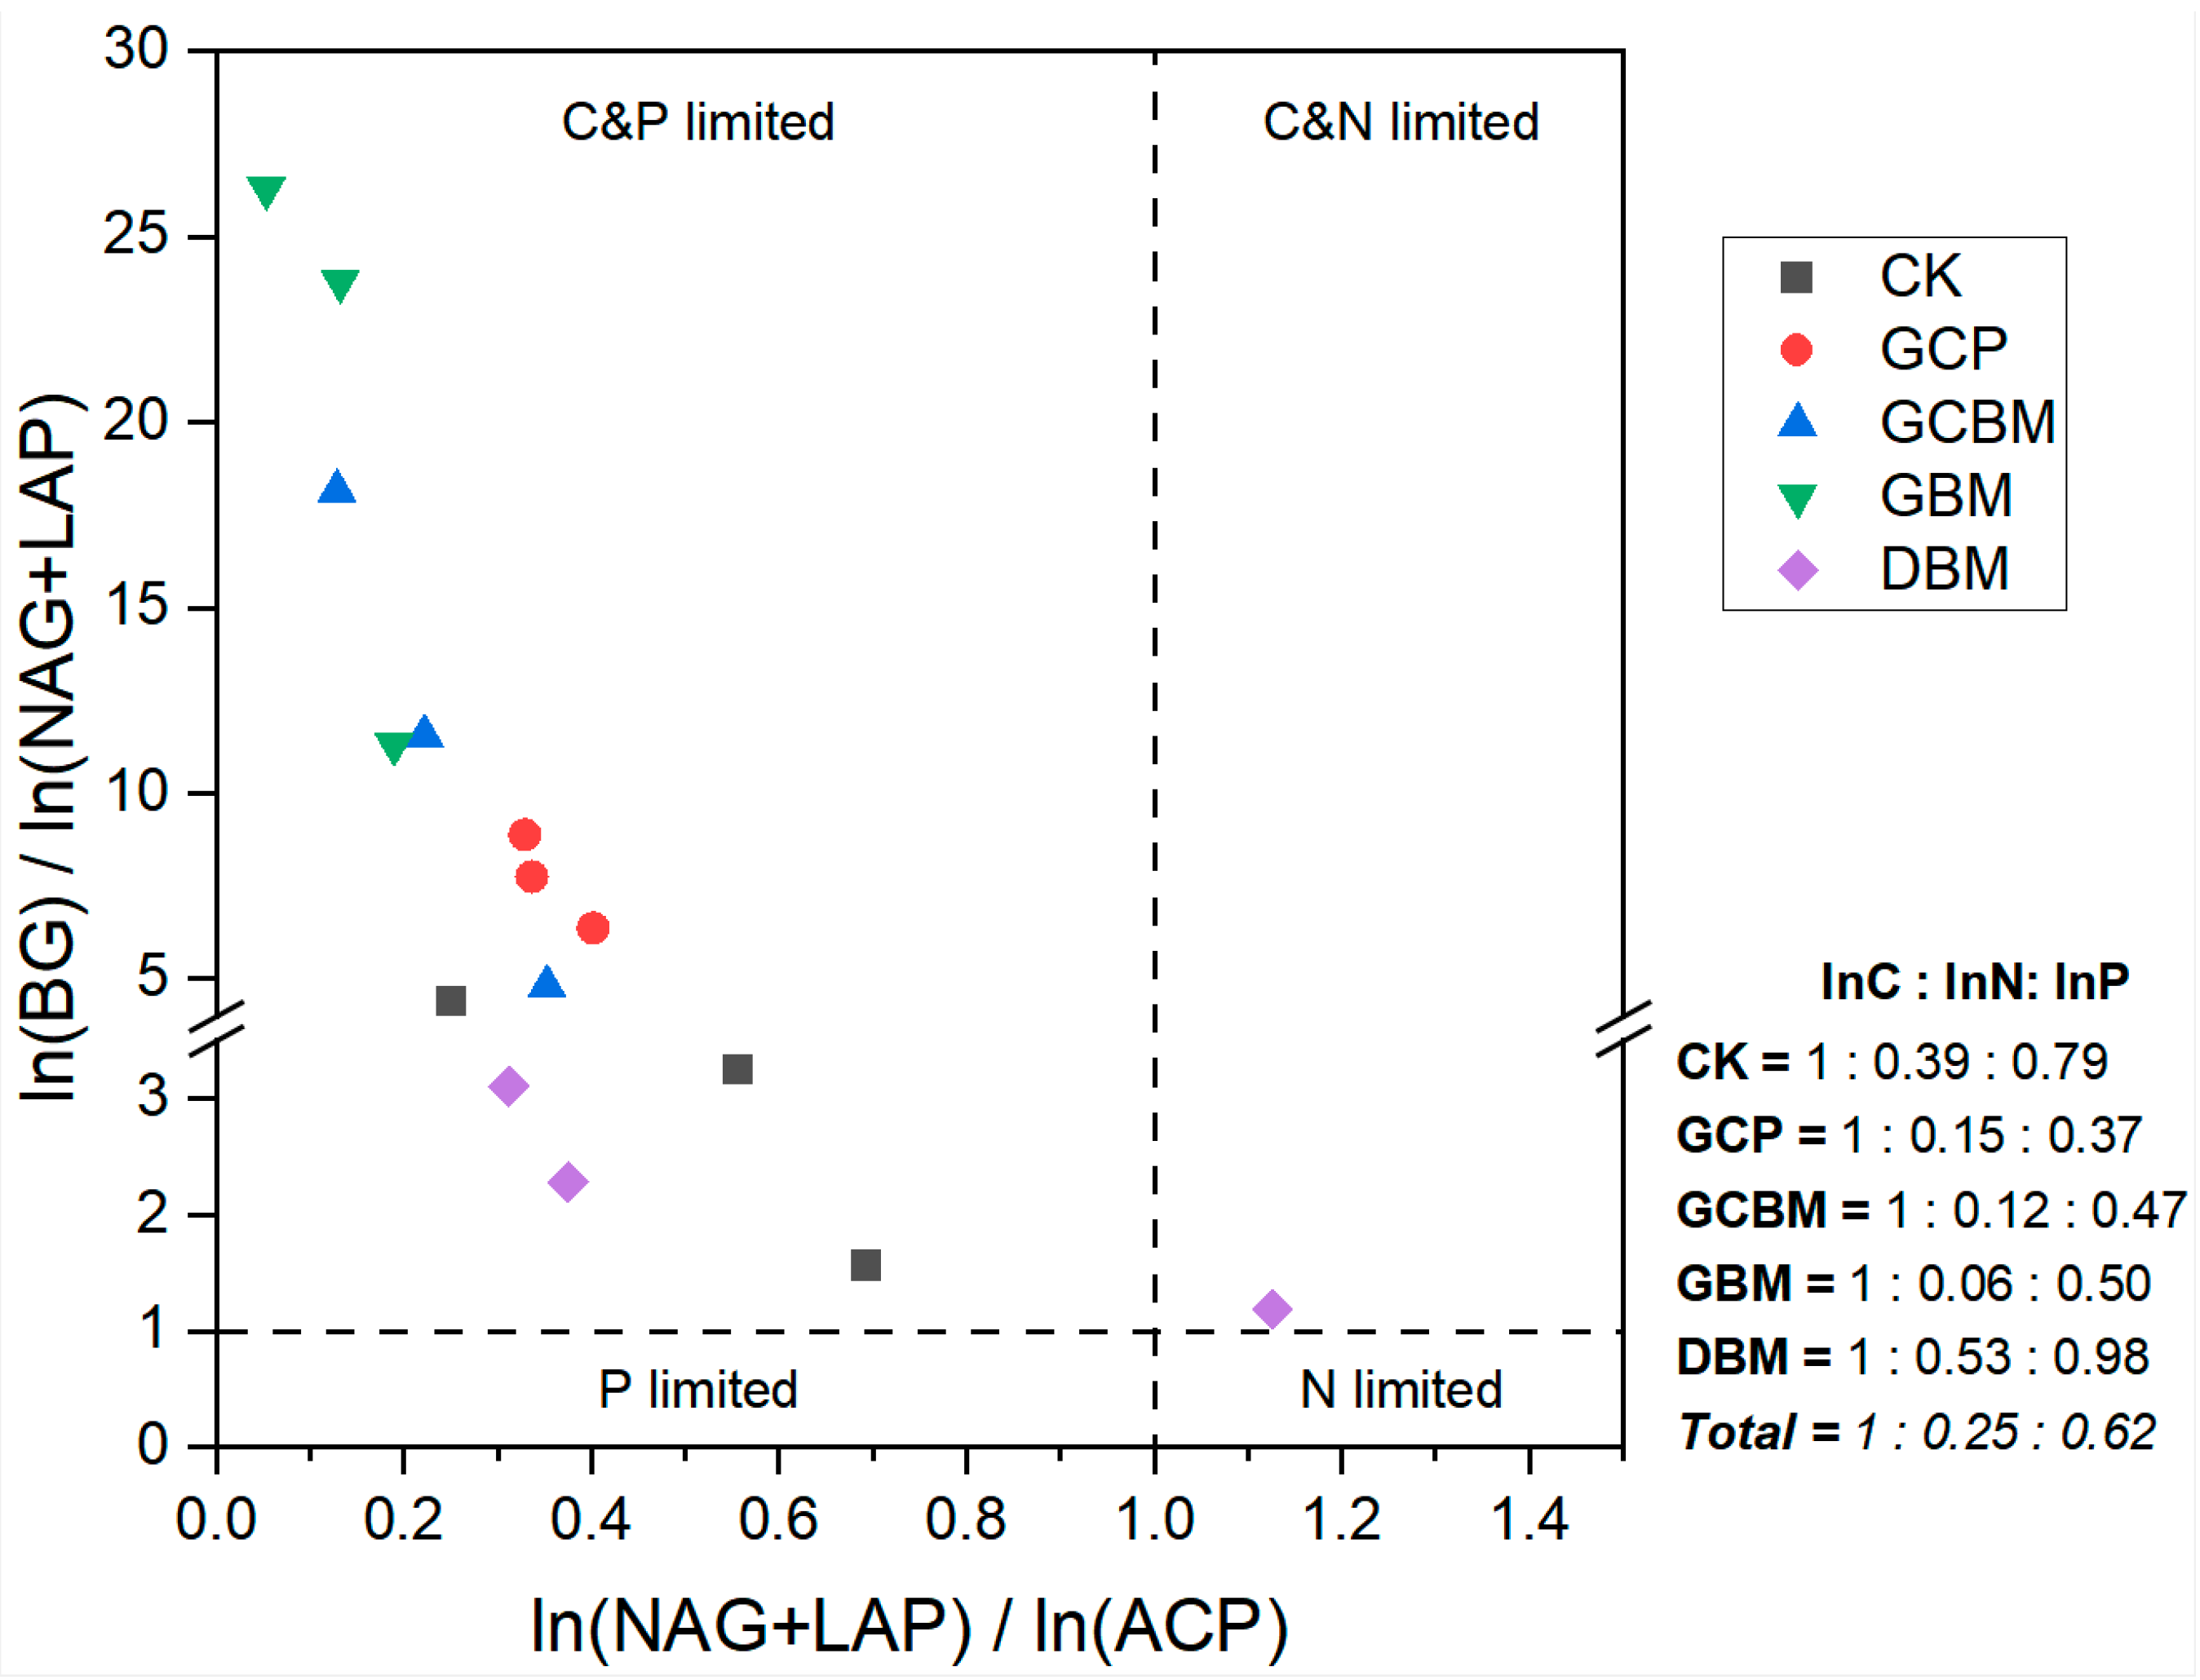
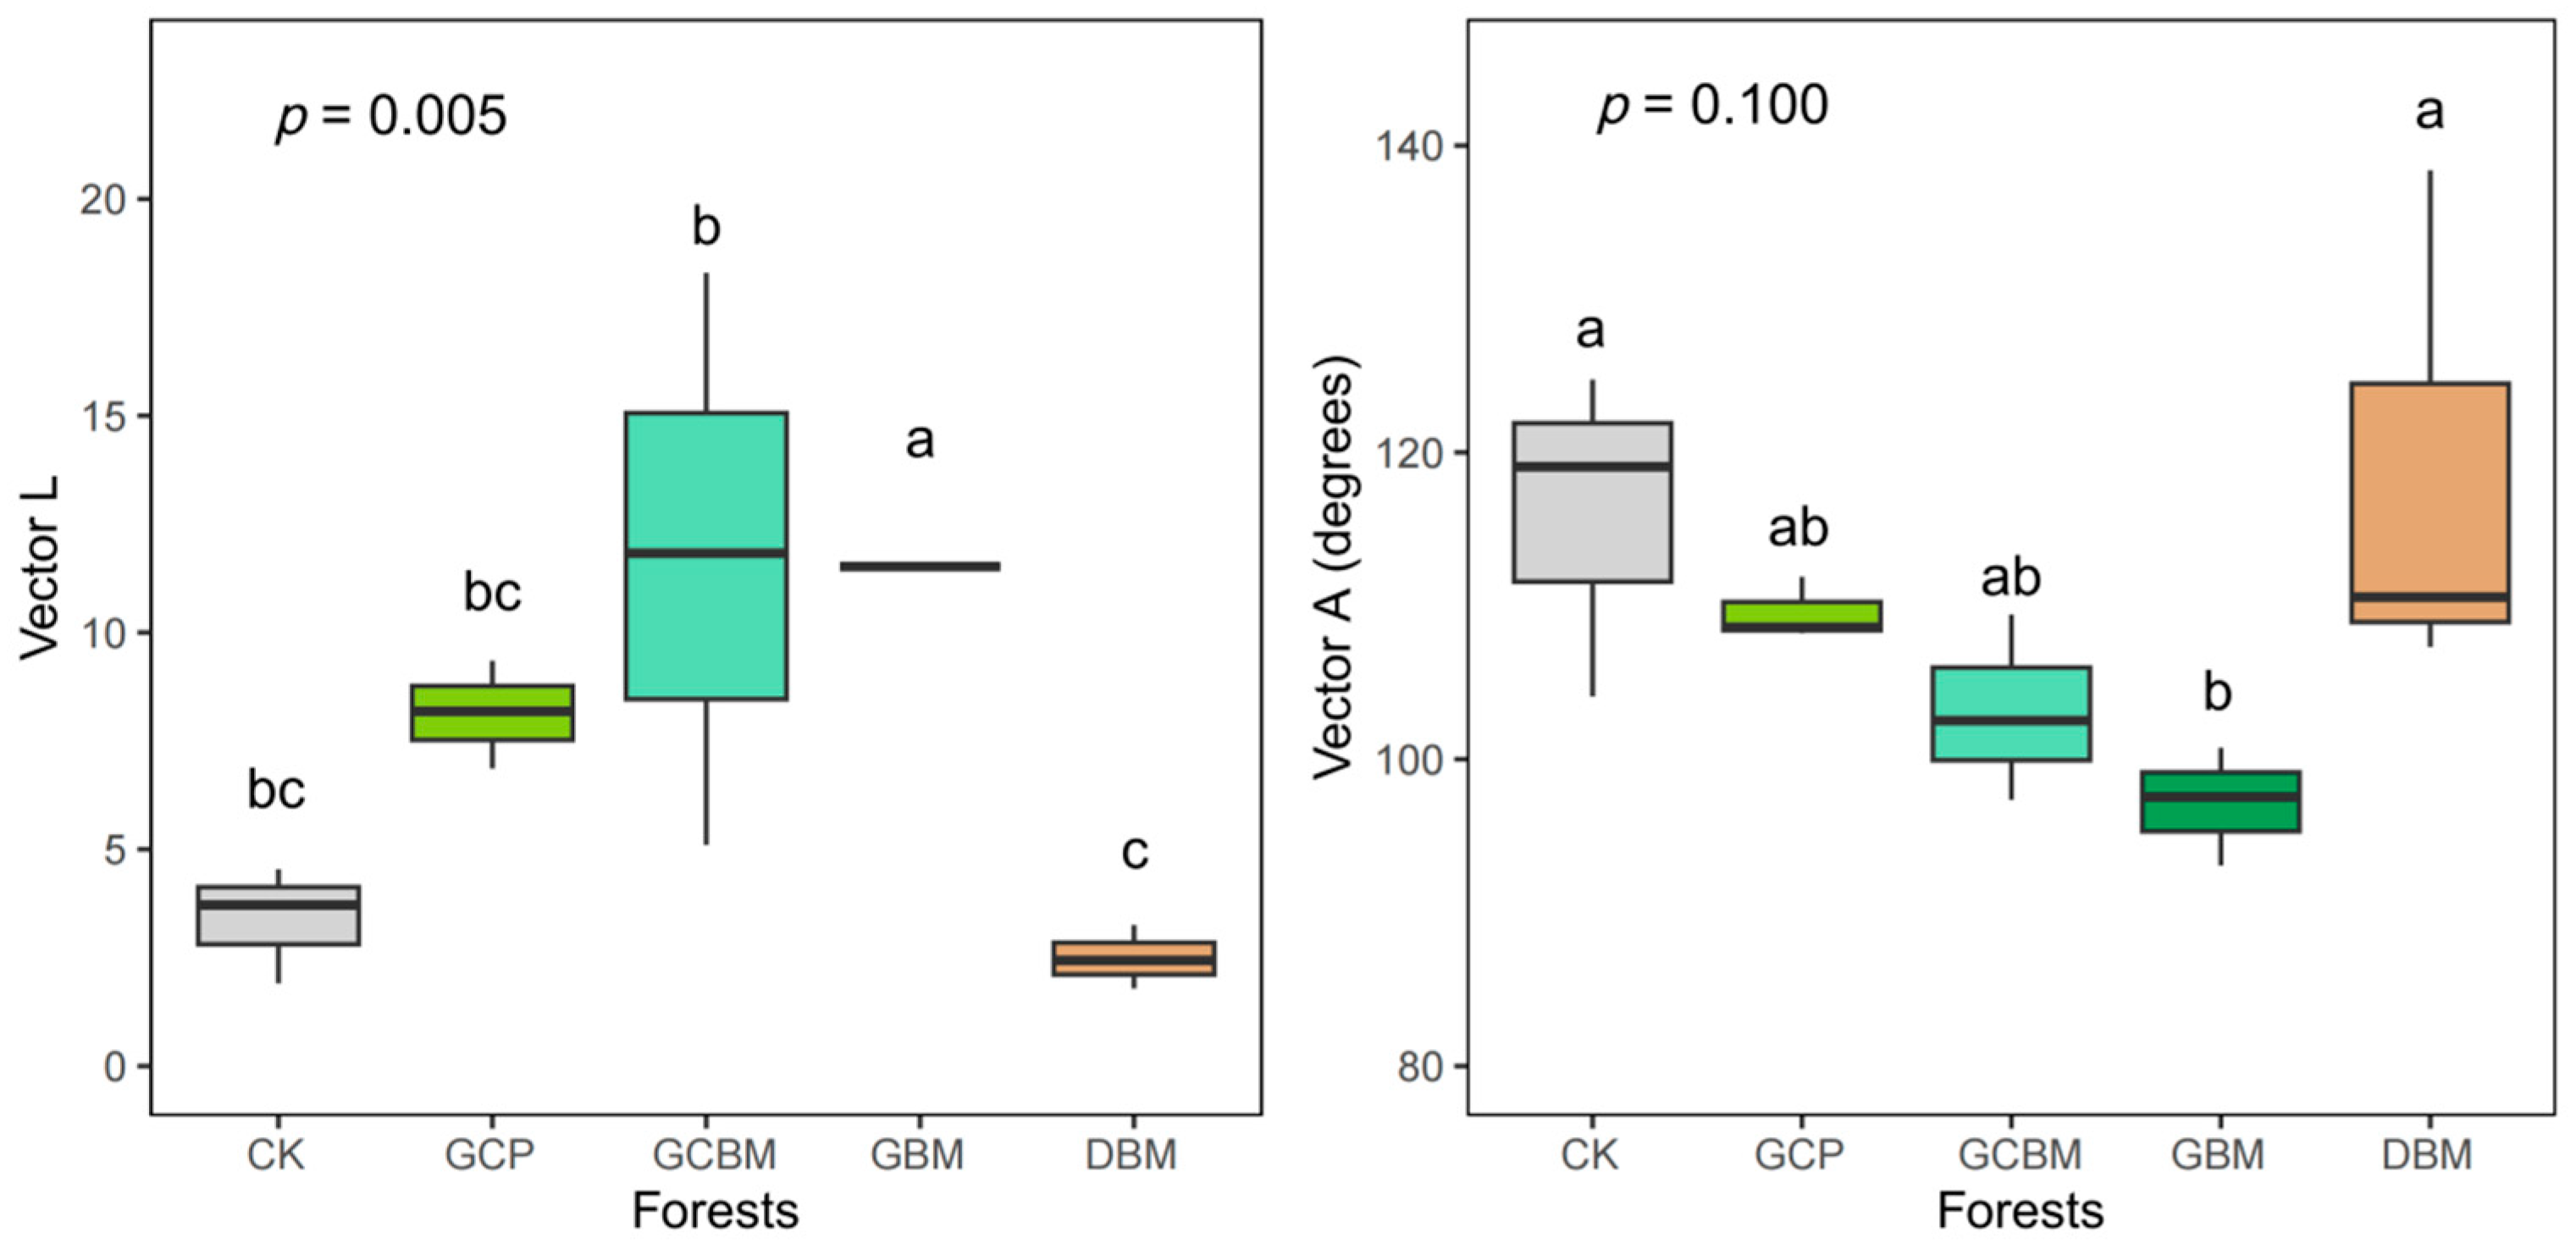
4.2. Nutrient Limitation Status of Soil Microbes

EEA stoichiometric ratios reflect soil microbial nutrient acquisition and limitation status [9]. Numerous studies have investigated forest EEA and its stoichiometry [16,21,36,37,38]. In our study, soil microbes were co-limited by C and P (Figure 3). With a C/N/P EEA ratio of ~1.00:0.25:0.62, microbial nutrient limitation was observed in the order of C > P > N. This finding aligns with that of a previous study indicating that subtropical forest microbes at various elevations are primarily limited by C and P [36]. The EEA stoichiometric ratios of GCPs and DBMs were closest to 1:1:1 (Figure 3). Therefore, even with restoration using pioneer or deciduous tree species, soil microbes in secondary forests can maintain relative nutrient homeostasis.
In vector analysis, the vector length positively reflects the relative degree of C limitation among nutrients for microbes [31]. Compared with that in CKs, it was higher in evergreen plantations and increased with succession from pioneer to climax tree species, while it was slightly lower in deciduous forests (Figure 4). This indicated that among C, N, and P, the limitation of C worsens when secondary forests are restored with evergreen species, especially with the proportion of broad-leaved species, but this is improved with deciduous species, confirming Hypothesis 1. When microbes face C limitation, they secrete more BG to promote organic matter mineralization, alleviating C limitation [8]. This seems to make BG activity increase with broad-leaved species, which conflicts with our results (Figure 1). However, the vector length reflects the relative limitation of C among all nutrients, while EEA is an indication of microbial demand for a nutrient. Therefore, the results of vector length and EEA are not always consistent. In our study, increasing evergreen broad-leaved tree species intensified microbial C limitation, indicating reduced microbial C sources. This may have been due to insufficient C input into soils and fixed SOC from soil protection or an increase in recalcitrant SOC [39,40,41]. However, considering litter quality and composition, the first reason seems invalid. Thus, the intensified microbial C limitation under artificial restoration using climax succession species may likely arise from increased stable or protected SOC components. According to the formation of SOC [40], these increases are conducive to SOC accumulation, as shown in Table 3. Although this aligns with numerous studies suggesting that broad-leaved forests favor SOC fixation over coniferous forests, we need more detailed studies on SOC components. Conversely, the lower C limitation in deciduous plantations is primarily due to higher amounts of easily decomposed litterfall, weakening microbial C limitation.
The soil microbes faced P limitation, as was evident with vector angles of >45° (Figure 4) [31], which was consistent with previous findings [16,23,27,28,42]. In rainfall-rich subtropical regions, soil P content decreased due to leaching, runoff losses, or absorption by iron and aluminum oxides, reducing the bioavailability of P [23]. Compared with CKs, evergreen plantation areas exhibited weakened P limitation (Figure 4), indicating that artificial restoration of secondary forests using evergreen species may alleviate P limitation, partly supporting our Hypothesis 2. This is supported by the slightly higher AP in these plantations (Table 3). However, no significant difference was detected between the vector angle in DBMs and CKs, suggesting that this is not an effective way to reduce the microbial P limitation. The reasons remain to be studied.
As in previous studies [17,36], we also found that EEA and stoichiometric ratios were influenced by bulk density, soil C/P, and N/P (Figure 6), indicating that soil properties impact enzyme stoichiometry, confirming Hypothesis 3. Notably, bulk density emerged as the most significant factor in our study site. While bulk density may affect EEA by altering soil mineralization, some studies asserted that EEA and its stoichiometry solely correlate with soil pH [43,44], while others cited influences from soil nutrients and biological factors (e.g., vegetation, litter, and microbial community characteristics) [14,17,18,19,20,21,23]. Therefore, future studies aiming to elucidate the mechanisms of microbial C and P limitation in subtropical secondary forest restoration should incorporate the nutrient characteristics of plant leaves, litter components, soil microbes, and various SOC components. Additionally, the potential variability of findings across diverse regions and forest types and long-term studies should also be considered in the future.

5. Conclusions

In conclusion, the type of subtropical forest significantly affects the activities of BG and LAP over NAG or ACP. Our study revealed the co-limitation of microbial C and P, with C limitation prevailing over that of N or P. The artificial restoration of subtropical secondary forests using evergreen species alleviated P limitation while exacerbating C limitation, particularly with succession climax species. Conversely, deciduous broad-leaved plantations offer the potential to alleviate microbial C limitation. Therefore, our findings emphasize the importance of employing pioneer and mid-successional species or deciduous broad-leaved species to achieve balanced microbial nutrient requirements. They can be used in the restoration of subtropical secondary forests.

Author Contributions

Y.Y.: Conceptualization, Methodology, Supervision, Writing—review and editing. W.X.: Investigation, Writing—original draft. Y.F.: Data curation, Writing—review and editing. Y.C.: Writing—review and editing, Fieldwork assistance. J.X.: Writing—review and editing. W.Y.: Writing—review and editing. All authors have read and agreed to the published version of the manuscript.

Funding

This research was supported by the Natural Science Foundation of China (32001298), the Key Project of the Education Department of Hubei Province (D20201001), and the Postgraduate Education and Teaching Reform Project of Hubei University (JGYJS202225).

Data Availability Statement

The data that support the findings of this study are available from the corresponding author upon reasonable request.

Acknowledgments

We would like to thank Yuan Liu, Xiaoyu Wu, and Yilin Zhang for participating in the field and laboratory work. The authors would like to express their gratitude to Baihuitech (www.baihuitech.cn) which is accessed on 15 March 2023 for the experimental detection.

Conflicts of Interest

The authors declare that they have no known competing financial interests or personal relationships that could have appeared to influence the work reported in this paper.

References

  1. Lozano, Y.M.; Hortal, S.; Armas, C.; Pugnaire, F.I. Interactions among soil, plants, and microorganisms drive secondary succession in a dry environment. Soil Biol. Biochem. 2014, 78, 298–306. [Google Scholar] [CrossRef]
  2. Li, X.; Liu, Y.; Wu, G.; Lie, Z.; Sheng, H.; Aguila, L.C.R.; Khan, M.S.; Liu, X.; Zhou, S.; Wu, T.; et al. Mixed plantations do not necessarily provide higher ecosystem multifunctionality than monoculture plantations. Sci. Total Environ. 2024, 914, 170156. [Google Scholar] [CrossRef]
  3. Xu, H.; Yue, C.; Zhang, Y.; Liu, D.; Piao, S. Forestation at the right time with the right species can generate persistent carbon benefits in China. Proc. Natl. Acad. Sci. USA 2023, 120, e2304988120. [Google Scholar] [CrossRef]
  4. Bahram, M.; Hildebrand, F.; Forslund, S.K.; Anderson, J.L.; Soudzilovskaia, N.A.; Bodegom, P.M.; Bengtsson-Palme, J.; Anslan, S.; Coelho, L.P.; Harend, H.; et al. Structure and function of the global topsoil microbiome. Nature 2018, 560, 233–237. [Google Scholar] [CrossRef]
  5. Berg, G.; Smalla, K. Plant species and soil type cooperatively shape the structure and function of microbial communities in the rhizosphere. FEMS Microbiol. Ecol. 2009, 68, 1–13. [Google Scholar] [CrossRef]
  6. Zuccarini, P.; Sardans, J.; Asensio, L.; Peñuelas, J. Altered activities of extracellular soil enzymes by the interacting global environmental changes. Glob. Chang. Biol. 2023, 29, 2067–2091. [Google Scholar] [CrossRef]
  7. Henry, H.A.L. Soil extracellular enzyme dynamics in a changing climate. Soil Biol. Biochem. 2012, 47, 53–59. [Google Scholar] [CrossRef]
  8. Sinsabaugh, R.L.; Belnap, J.; Findlay, S.G.; Shah, J.J.F.; Hill, B.H.; Kuehn, K.A.; Kuske, C.R.; Litvak, M.E.; Martinez, N.G.; Moorhead, D.L.; et al. Extracellular enzyme kinetics scale with resource availability. Biogeochemistry 2014, 121, 287–304. [Google Scholar] [CrossRef]
  9. Sinsabaugh, R.L.; Hill, B.H.; Follstad Shah, J.J. Ecoenzymatic stoichiometry of microbial organic nutrient acquisition in soil and sediment. Nature 2009, 462, 795–798. [Google Scholar] [CrossRef]
  10. Sinsabaugh, R.L.; Shah, J.J.F. Ecoenzymatic Stoichiometry and Ecological Theory. Annu. Rev. Ecol. Evol. Syst. 2012, 43, 313–343. [Google Scholar] [CrossRef]
  11. Sinsabaugh, R.L.; Lauber, C.L.; Weintraub, M.N.; Ahmed, B.; Zeglin, L.H. Stoichiometry of soil enzyme activity at global scale. Ecol. Lett. 2008, 11, 1252–1264. [Google Scholar] [CrossRef]
  12. Burns, R.G.; DeForest, J.L.; Marxsen, J.; Sinsabaugh, R.L.; Stromberger, M.E.; Wallenstein, M.D.; Weintraub, M.N.; Zoppini, A. Soil enzymes in a changing environment: Current knowledge and future directions. Soil Biol. Biochem. 2013, 58, 216–234. [Google Scholar] [CrossRef]
  13. Sinsabaugh, R.L.; Moorhead, D.L. Resource allocation to extracellular enzyme production: A model for nitrogen and phosphorus control of litter decomposition. Soil Biol. Biochem. 1994, 26, 1305–1311. [Google Scholar] [CrossRef]
  14. Zhou, L.; Liu, S.; Shen, H.; Zhao, M.; Xu, L.; Xing, A.; Fang, J. Soil extracellular enzyme activity and stoichiometry in China’s forests. Funct. Ecol. 2020, 34, 1461–1471. [Google Scholar] [CrossRef]
  15. Yuan, X.; Niu, D.; Gherardi, L.A.; Liu, Y.; Wang, Y.; Elser, J.J.; Fu, H. Linkages of stoichiometric imbalances to soil microbial respiration with increasing nitrogen addition: Evidence from a long-term grassland experiment. Soil Biol. Biochem. 2019, 138, 107580. [Google Scholar] [CrossRef]
  16. Jian, Z.; Ni, Y.; Zeng, L.; Lei, L.; Xu, J.; Xiao, W.; Li, M.-H. Latitudinal patterns of soil extracellular enzyme activities and their controlling factors in Pinus massoniana plantations in subtropical China. For. Ecol. Manag. 2021, 495, 119358. [Google Scholar] [CrossRef]
  17. Zuo, Y.; Li, J.; Zeng, H.; Wang, W. Vertical pattern and its driving factors in soil extracellular enzyme activity and stoichiometry along mountain grassland belts. Biogeochemistry 2018, 141, 23–39. [Google Scholar] [CrossRef]
  18. Zheng, H.; Liu, Y.; Zhang, J.; Chen, Y.; Yang, L.; Li, H.; Wang, L. Factors influencing soil enzyme activity in China’s forest ecosystems. Plant Ecol. 2018, 219, 31–44. [Google Scholar] [CrossRef]
  19. Guo, Z.; Zhang, X.; Green, S.M.; Dungait, J.A.J.; Wen, X.; Quine, T.A. Soil enzyme activity and stoichiometry along a gradient of vegetation restoration at the Karst Critical Zone Observatory in Southwest China. Land Degrad. Dev. 2019, 30, 1916–1927. [Google Scholar] [CrossRef]
  20. Nwe, T.Z.; Maaroufi, N.I.; Allan, E.; Soliveres, S.; Kempel, A. Plant attributes interact with fungal pathogens and nitrogen addition to drive soil enzymatic activities and their temporal variation. Funct. Ecol. 2023, 37, 564–575. [Google Scholar] [CrossRef]
  21. Wu, L.; Zou, B.; Wang, S.; Zhou, L.; Zheng, Y.; Huang, Z.; He, J.-Z. Effects of multispecies restoration on soil extracellular enzyme activity stoichiometry in Pinus massoniana plantations of subtropical China. Soil Biol. Biochem. 2023, 178, 108967. [Google Scholar] [CrossRef]
  22. Xu, Z.W.; Yu, G.R.; Zhang, X.Y.; He, N.P.; Wang, Q.F.; Wang, S.Z.; Wang, R.L.; Zhao, N.; Jia, Y.L.; Wang, C.Y. Soil enzyme activity and stoichiometry in forest ecosystems along the North-South Transect in eastern China (NSTEC). Soil Biol. Biochem. 2017, 104, 152–163. [Google Scholar] [CrossRef]
  23. Huang, Y.-X.; Wu, Z.-J.; Zong, Y.-Y.; Li, W.-Q.; Chen, F.-S.; Wang, G.G.; Li, J.-J.; Fang, X.-M. Mixing with coniferous tree species alleviates rhizosphere soil phosphorus limitation of broad-leaved trees in subtropical plantations. Soil Biol. Biochem. 2022, 175, 108853. [Google Scholar] [CrossRef]
  24. Fanin, N.; Fromin, N.; Buatois, B.; Hättenschwiler, S. An experimental test of the hypothesis of non-homeostatic consumer stoichiometry in a plant litter–microbe system. Ecol. Lett. 2013, 16, 764–772. [Google Scholar] [CrossRef]
  25. Xiao, L.; Liu, G.; Li, P.; Li, Q.; Xue, S. Ecoenzymatic stoichiometry and microbial nutrient limitation during secondary succession of natural grassland on the Loess Plateau, China. Soil Tillage Res. 2020, 200, 104605. [Google Scholar] [CrossRef]
  26. Liu, G.; Wang, H.; Yan, G.; Wang, M.; Jiang, S.; Wang, X.; Xue, J.; Xu, M.; Xing, Y.; Wang, Q. Soil enzyme activities and microbial nutrient limitation during the secondary succession of boreal forests. Catena 2023, 230, 107268. [Google Scholar] [CrossRef]
  27. Peng, Z.; Wu, Y.; Guo, L.; Yang, L.; Wang, B.; Wang, X.; Liu, W.; Su, Y.; Wu, J.; Liu, L. Foliar nutrient resorption stoichiometry and microbial phosphatase catalytic efficiency together alleviate the relative phosphorus limitation in forest ecosystems. New Phytol. 2023, 238, 1033–1044. [Google Scholar] [CrossRef]
  28. Du, E.Z.; Terrer, C.; Pellegrini, A.F.A.; Ahlström, A.; van Lissa, C.J.; Zhao, X.; Xia, N.; Wu, X.H.; Jackson, R.B. Global patterns of terrestrial nitrogen and phosphorus limitation. Nat. Geosci. 2020, 13, 221–226. [Google Scholar] [CrossRef]
  29. Cai, L.; Yang, Y.; Chong, Y.; Xiong, J.; Wu, J.; Ai, X.; Guo, Q.; Yuan, Y.; Li, Z. Higher soil aggregate stability in subtropical coniferous plantations than natural forests due to microbial and aggregate factors. Forests 2022, 13, 2110. [Google Scholar] [CrossRef]
  30. Saiya-Cork, K.R.; Sinsabaugh, R.L.; Zak, D.R. The effects of long term nitrogen deposition on extracellular enzyme activity in an Acer saccharum forest soil. Soil Biol. Biochem. 2002, 34, 1309–1315. [Google Scholar] [CrossRef]
  31. Moorhead, D.L.; Sinsabaugh, R.L.; Hill, B.H.; Weintraub, M.N. Vector analysis of ecoenzyme activities reveal constraints on coupled C, N and P dynamics. Soil Biol. Biochem. 2016, 93, 1–7. [Google Scholar] [CrossRef]
  32. Liu, R.; Zhang, Y.; Hu, X.-F.; Wan, S.; Wang, H.; Liang, C.; Chen, F.-S. Litter manipulation effects on microbial communities and enzymatic activities vary with soil depth in a subtropical Chinese fir plantation. For. Ecol. Manag. 2021, 480, 118641. [Google Scholar] [CrossRef]
  33. Šnajdr, J.; Valášková, V.; Merhautová, V.; Herinková, J.; Cajthaml, T.; Baldrian, P. Spatial variability of enzyme activities and microbial biomass in the upper layers of Quercus petraea forest soil. Soil Biol. Biochem. 2008, 40, 2068–2075. [Google Scholar] [CrossRef]
  34. Pérez-Suárez, M.; Arredondo-Moreno, J.T.; Huber-Sannwald, E.; Vargas-Hernández, J.J. Production and quality of senesced and green litterfall in a pine–oak forest in central-northwest Mexico. For. Ecol. Manag. 2009, 258, 1307–1315. [Google Scholar] [CrossRef]
  35. Liang, C.; Schimel, J.P.; Jastrow, J.D. The importance of anabolism in microbial control over soil carbon storage. Nat. Microbiol. 2017, 2, 17105. [Google Scholar] [CrossRef]
  36. Cao, X.W.; Shi, Z.M.; Chen, J.; Liu, S.; Zhang, M.M.; Chen, M.; Xu, G.X.; Wu, J.M.; Xing, H.S.; Li, F.F. Extracellular enzyme characteristics and microbial metabolic limitation in soil of subalpine forest ecosystems on the eastern Qinghai-Tibetan Plateau. Plant Soil 2022, 479, 337–353. [Google Scholar] [CrossRef]
  37. Yan, B.; Duan, M.; Wang, R.; Li, J.; Wei, F.; Chen, J.; Wang, J.; Wu, Y.; Wang, G. Planted forests intensified soil microbial metabolic nitrogen and phosphorus limitation on the Loess Plateau, China. Catena 2022, 211, 105982. [Google Scholar] [CrossRef]
  38. Zhou, M.J.; Wang, J.L.; Hu, H.B.; Chen, J.Y.; Zhu, Z.Y.; Heng, Y.C.; Feng, Y.Y. Simulated Nitric Acid Rain Aggravated the C and P Limits of Forest Soil Microorganisms. Forests 2023, 14, 1044. [Google Scholar] [CrossRef]
  39. Lehmann, J.; Kleber, M. The contentious nature of soil organic matter. Nature 2015, 528, 60–68. [Google Scholar] [CrossRef]
  40. Cotrufo, M.F.; Ranalli, M.G.; Haddix, M.L.; Six, J.; Lugato, E. Soil carbon storage informed by particulate and mineral-associated organic matter. Nat. Geosci. 2019, 12, 989–994. [Google Scholar] [CrossRef]
  41. Xiang, H.M.; Luo, X.Z.; Zhang, L.L.; Hou, E.Q.; Li, J.; Zhu, Q.D.; Wen, D.Z. Forest succession accelerates soil carbon accumulation by increasing recalcitrant carbon stock in subtropical forest topsoils. Catena 2022, 212, 106030. [Google Scholar] [CrossRef]
  42. Vitousek, P.M.; Farrington, H. Nutrient limitation and soil development: Experimental test of a biogeochemical theory. Biogeochemistry 1997, 37, 63–75. [Google Scholar] [CrossRef]
  43. Chen, Y.; Li, S.; Zeng, L.; An, B.; Xiao, T.; Mao, R.; Zhang, Y. Effects of Mycorrhizal and Extraradical Hyphae of Subtropical Native Tree Species on Soil Enzyme Activities and Their Stoichiometric Ratios. Forests 2023, 14, 2112. [Google Scholar] [CrossRef]
  44. DeForest, J.L.; Moorhead, D.L. Effects of elevated pH and phosphorus fertilizer on soil C, N and P enzyme stoichiometry in an acidic mixed mesophytic deciduous forest. Soil Biol. Biochem. 2020, 150, 107996. [Google Scholar] [CrossRef]
Figure 1. Effects of the forest type on soil enzyme activities. CK, secondary forest; GCP, pure evergreen coniferous forest; GCBM, evergreen coniferous and broad-leaved mixed forest; GBM, evergreen broad-leaved mixed forest; DBM, deciduous broad-leaved mixed forest. Different lowercase letters indicate that there were significant differences in different forests (p < 0.05). ns, p > 0.05.
Forests 15 00568 g001
Figure 2. Effects of the forest type on soil enzyme stoichiometry. CK, secondary forest; GCP, pure evergreen coniferous forest; GCBM, evergreen coniferous and broad-leaved mixed forest; GBM, evergreen broad-leaved mixed forest; DBM, deciduous broad-leaved mixed forest. C/NEEA, ln(BG):ln(NAG + LAP); C/PEEA, ln(BG):ln(ACP); N/PEEA, ln(NAG + LAP):ln(ACP). Different lowercase letters indicate that there were significant differences in different forests (p < 0.05). ns, p > 0.05.
Forests 15 00568 g002
Figure 3. Distribution of the soil enzyme C/N and N/P stoichiometry. CK, secondary forest; GCP, pure evergreen coniferous forest; GCBM, evergreen coniferous and broad-leaved mixed forest; GBM, evergreen broad-leaved mixed forest; DBM, deciduous broad-leaved mixed forest.
Forests 15 00568 g003
Figure 4. Effects of the forest type on the vector length (Vector L) and vector angle (Vector A) for soil enzymes. CK, secondary forest; GCP, pure evergreen coniferous forest; GCBM, evergreen coniferous and broad-leaved mixed forest; GBM, evergreen broad-leaved mixed forest; DBM, deciduous broad-leaved mixed forest. Different lowercase letters indicate that there were significant differences in different forests (p < 0.05).
Forests 15 00568 g004
Figure 5. Correlations between soil physicochemical properties and enzymes. Asterisks indicate the significance of Pearson’s correlation coefficient. *, p < 0.05; **, p < 0.01; ***, p < 0.001. ST, soil temperature; SM, soil mass water content; BD, bulk density; TOC, total organic carbon; TN, total nitrogen; TP, total phosphorus; AP, available phosphorus. C/NEEA, ln(BG):ln(NAG + LAP); C/PEEA, ln(BG):ln(ACP); N/PEEA, ln(NAG + LAP):ln(ACP). Vector L, vector length; Vector A, vector angle.
Forests 15 00568 g005
Figure 6. Redundancy analysis (RDA) of soil enzyme and stoichiometric ratios and their possible influencing factors. CK, secondary forest; GCP, pure evergreen coniferous forest; GCBM, evergreen coniferous and broad-leaved mixed forest; GBM, evergreen broad-leaved mixed forest; DBM, deciduous broad-leaved mixed forest. ST, soil temperature; SM, soil mass water content; BD, bulk density; TOC, total organic carbon; TN, total nitrogen; TP, total phosphorus; AP, available phosphorus.
Forests 15 00568 g006
Table 1. Stand characteristics of the studied forests. CK, secondary forest; GCP, pure evergreen coniferous forest; GCBM, evergreen coniferous and broad-leaved mixed forest; GBM, evergreen broad-leaved mixed forest; DBM, deciduous broad-leaved mixed forest.
ForestForest TypeLongitude
(E)
Latitude
(N)
Altitude
(m)
Slope (°)Aspect Stand AgeCanopy Density
1CK114.491727430.5067658113.515South200.60
2CK114.491677230.5067728110.114South200.65
3CK114.491414930.5067738117.912South200.80
4GCP114.490596930.5068831121.529South200.55
5GCP114.490545130.5068259115.527South200.50
6GCP114.490642730.5067447122.636South200.60
7GCBM114.489161230.5065437123.712South150.70
8GCBM114.48926930.5067259125.416South150.75
9GCBM114.489192730.506788127.415South150.66
10GBM114.496520930.506843710721South250.78
11GBM114.496541430.5066902107.826South250.75
12GBM114.496280730.50674195.823South250.85
13DBM114.499047130.507140486.315Southeast230.70
14DBM114.499357630.50733865.116Southeast230.75
15DBM114.499295430.507370972.616Southeast230.68
Table 2. Soil enzymes included in this study. EC, enzyme commission number.
EnzymeAbbreviationECFunction
β-1,4-glucosidaseBG3.2.1.21Cellulose degradation: hydrolyzes glucose from cellobiose
β-1,4-N-acetylglucosaminidaseNAG3.2.1.14Chitin and peptidoglycan degradation: hydrolyzes glucosamine from chitobiose
Leucine aminopeptidaseLAP3.4.11.1Proteolysis: hydrolyzes leucine and other hydrophobic amino acids from the N terminus of polypeptides
Acid phosphataseACP3.1.3.1Hydrolyzes phosphate from phosphosaccarides and phospholipids
Table 3. Effects of the forest type on soil physicochemical properties (mean ± SD). CK, secondary forest; GCP, pure evergreen coniferous forest; GCBM, evergreen coniferous and broad-leaved mixed forest; GBM, evergreen broad-leaved mixed forest; DBM, deciduous broad-leaved mixed forest. ST, soil temperature; SM, soil mass water content; BD, bulk density; TOC, total organic carbon; TN, total nitrogen; TP, total phosphorus; AP, available phosphorus. Different lowercase letters indicate that there were significant differences in different forests (p < 0.05).
Soil PropertiesCKGCPGCBMGBMDBMp-Value
ST (°C)25.61 ± 1.05 a23.42 ± 0.29 b23.15 ± 0.17 b25.44 ± 0.27 a24.69 ± 0.08 ab0.018
SM (%)9.17 ± 1.5610.64 ± 2.3912.73 ± 1.958.24 ± 0.5610.95 ± 2.19>0.05
BD (g/cm3)1.20 ± 0.12 a0.71 ± 0.06 b0.73 ± 0.06 b0.75 ± 0.02 b0.81 ± 0.09 b0.005
pH5.79 ± 0.13 a4.23 ± 0.10 c5.02 ± 0.17 b4.28 ± 0.15 c4.27 ± 0.02 c<0.001
TOC (g/kg)31.27 ± 0.89 c36.85 ± 0.96 ab39.28 ± 1.96 a32.48 ± 1.05 bc37.20 ± 2.15 ab0.017
TN (g/kg)2.16 ± 0.142.54 ± 0.122.76 ± 0.272.24 ± 0.102.75 ± 0.06>0.05
TP (g/kg)0.70 ± 0.050.69 ± 0.020.75 ± 0.070.64 ± 0.030.79 ± 0.07>0.05
AP (mg/kg)5.83 ± 0.868.00 ± 1.848.70 ± 0.559.81 ± 0.959.40 ± 1.17>0.05
C/N 14.62 ± 1.0214.54 ± 0.3414.39 ± 0.7614.54 ± 0.2113.52 ± 0.49>0.05
C/P45.09 ± 3.6653.53 ± 1.0953.03 ± 2.4150.88 ± 3.6347.51 ± 1.48>0.05
N/P3.08 ± 0.043.69 ± 0.153.71 ± 0.253.50 ± 0.283.53 ± 0.24>0.05
Disclaimer/Publisher’s Note: The statements, opinions and data contained in all publications are solely those of the individual author(s) and contributor(s) and not of MDPI and/or the editor(s). MDPI and/or the editor(s) disclaim responsibility for any injury to people or property resulting from any ideas, methods, instructions or products referred to in the content.

