
Multi-Trophic Species Diversity Contributes to the Restoration of Soil Multifunctionality in Degraded Karst Forests through Cascading Effects
 and
and
Abstract
:1. Introduction
2. Data and Methods
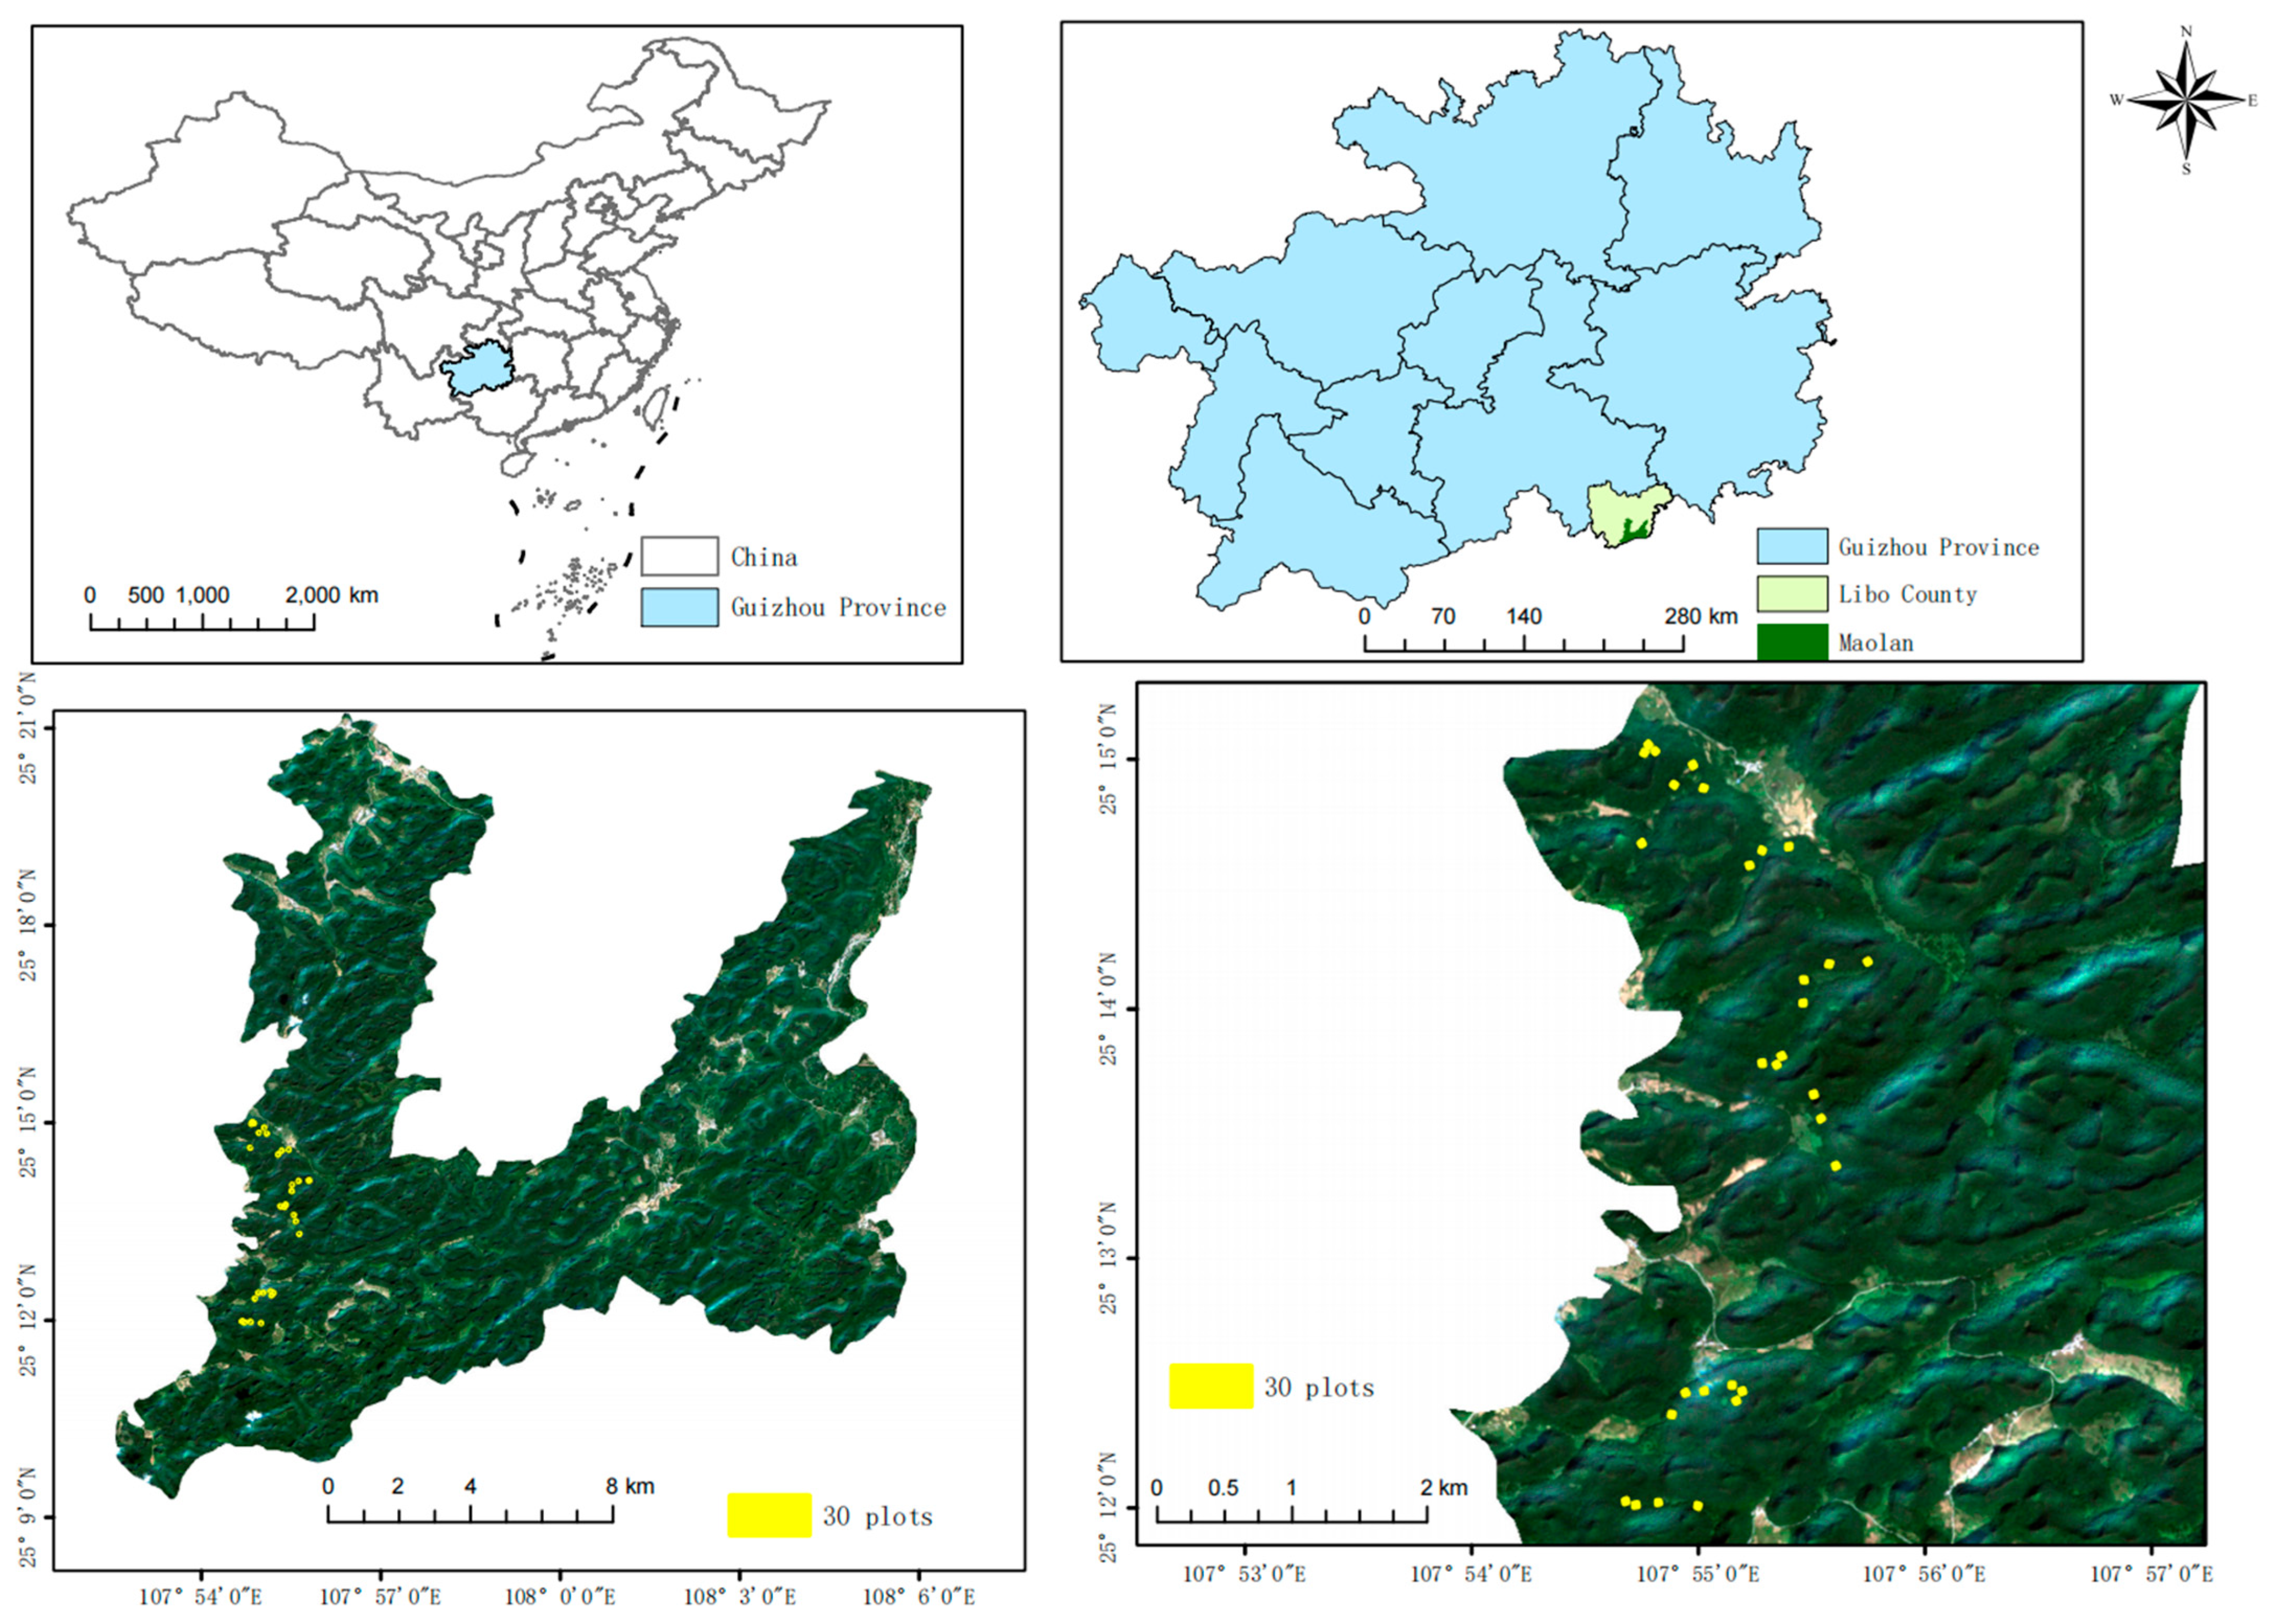
2.1. Study Area
2.2. Sample Plot Setting
2.3. Data Acquisition
2.3.1. Soil Sampling and Plant Survey
2.3.2. Soil DNA Extraction and Metagenomic Sequencing
2.3.3. Soil Fauna Taxa Selection
2.3.4. Soil Microorganism Taxa Selection
2.3.5. Determination of Soil Physical and Chemical Properties
2.3.6. Species Diversity Calculations
2.3.7. Calculation of SMF
2.4. Data Analysis
3. Results
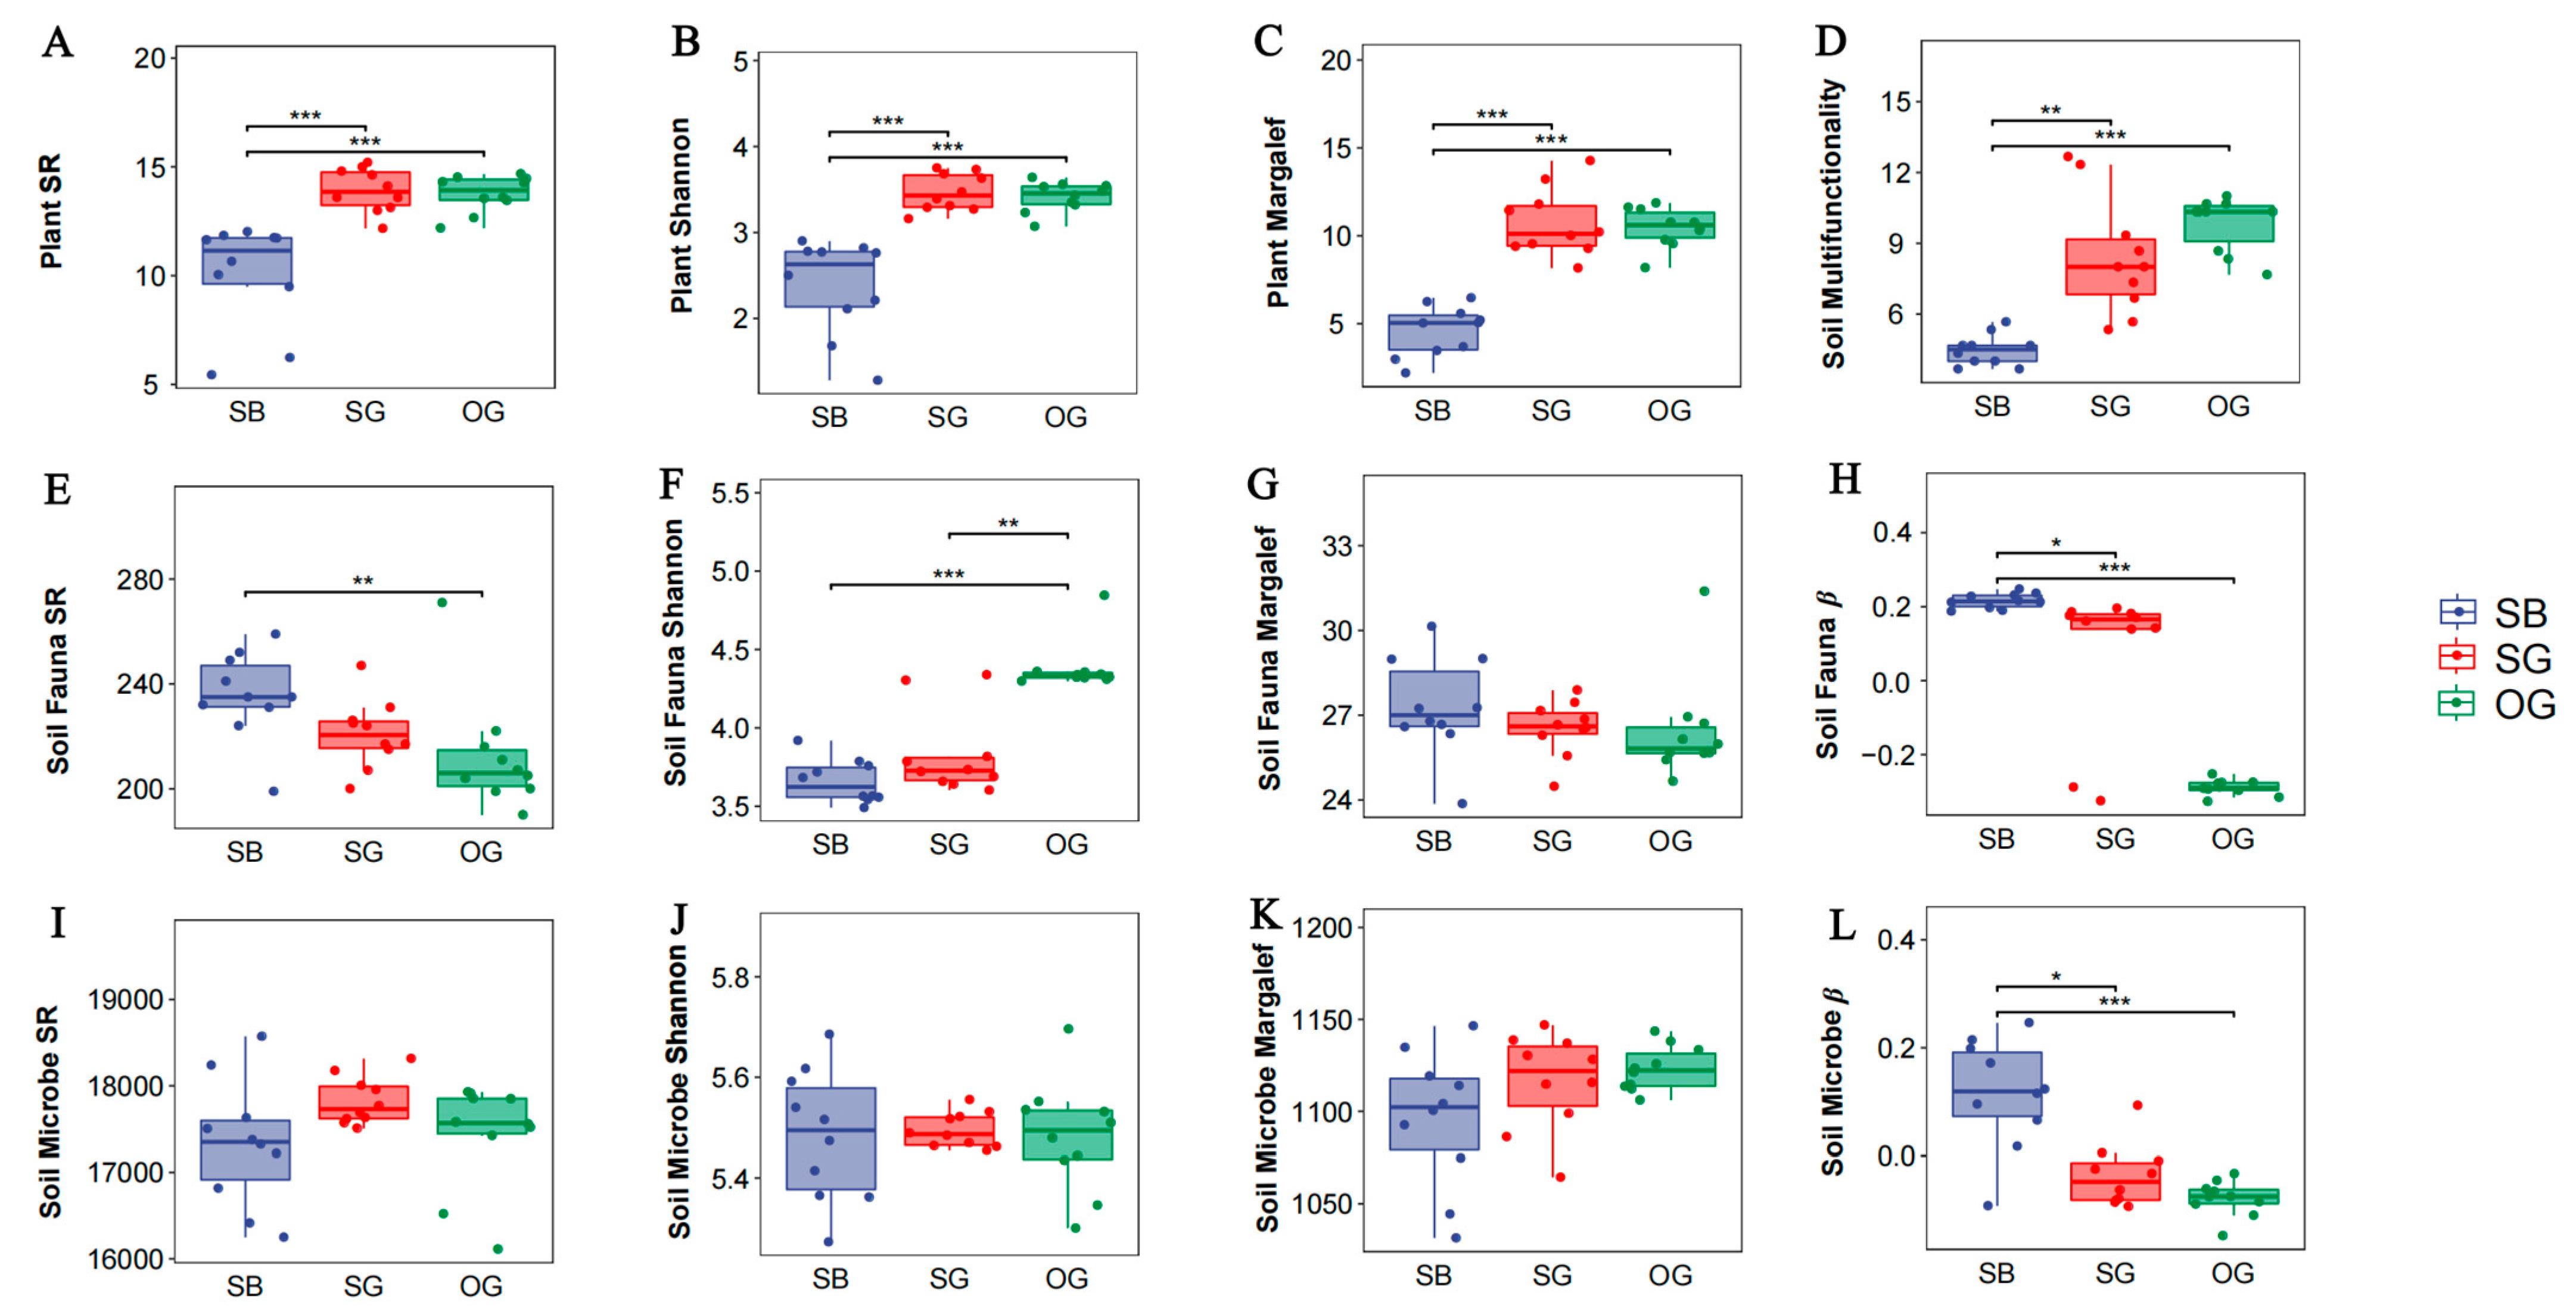
3.1. Responses of Plant Species Diversity, Soil Fauna Diversity, Soil Microbial Diversity, and SMF to the Restoration Stage
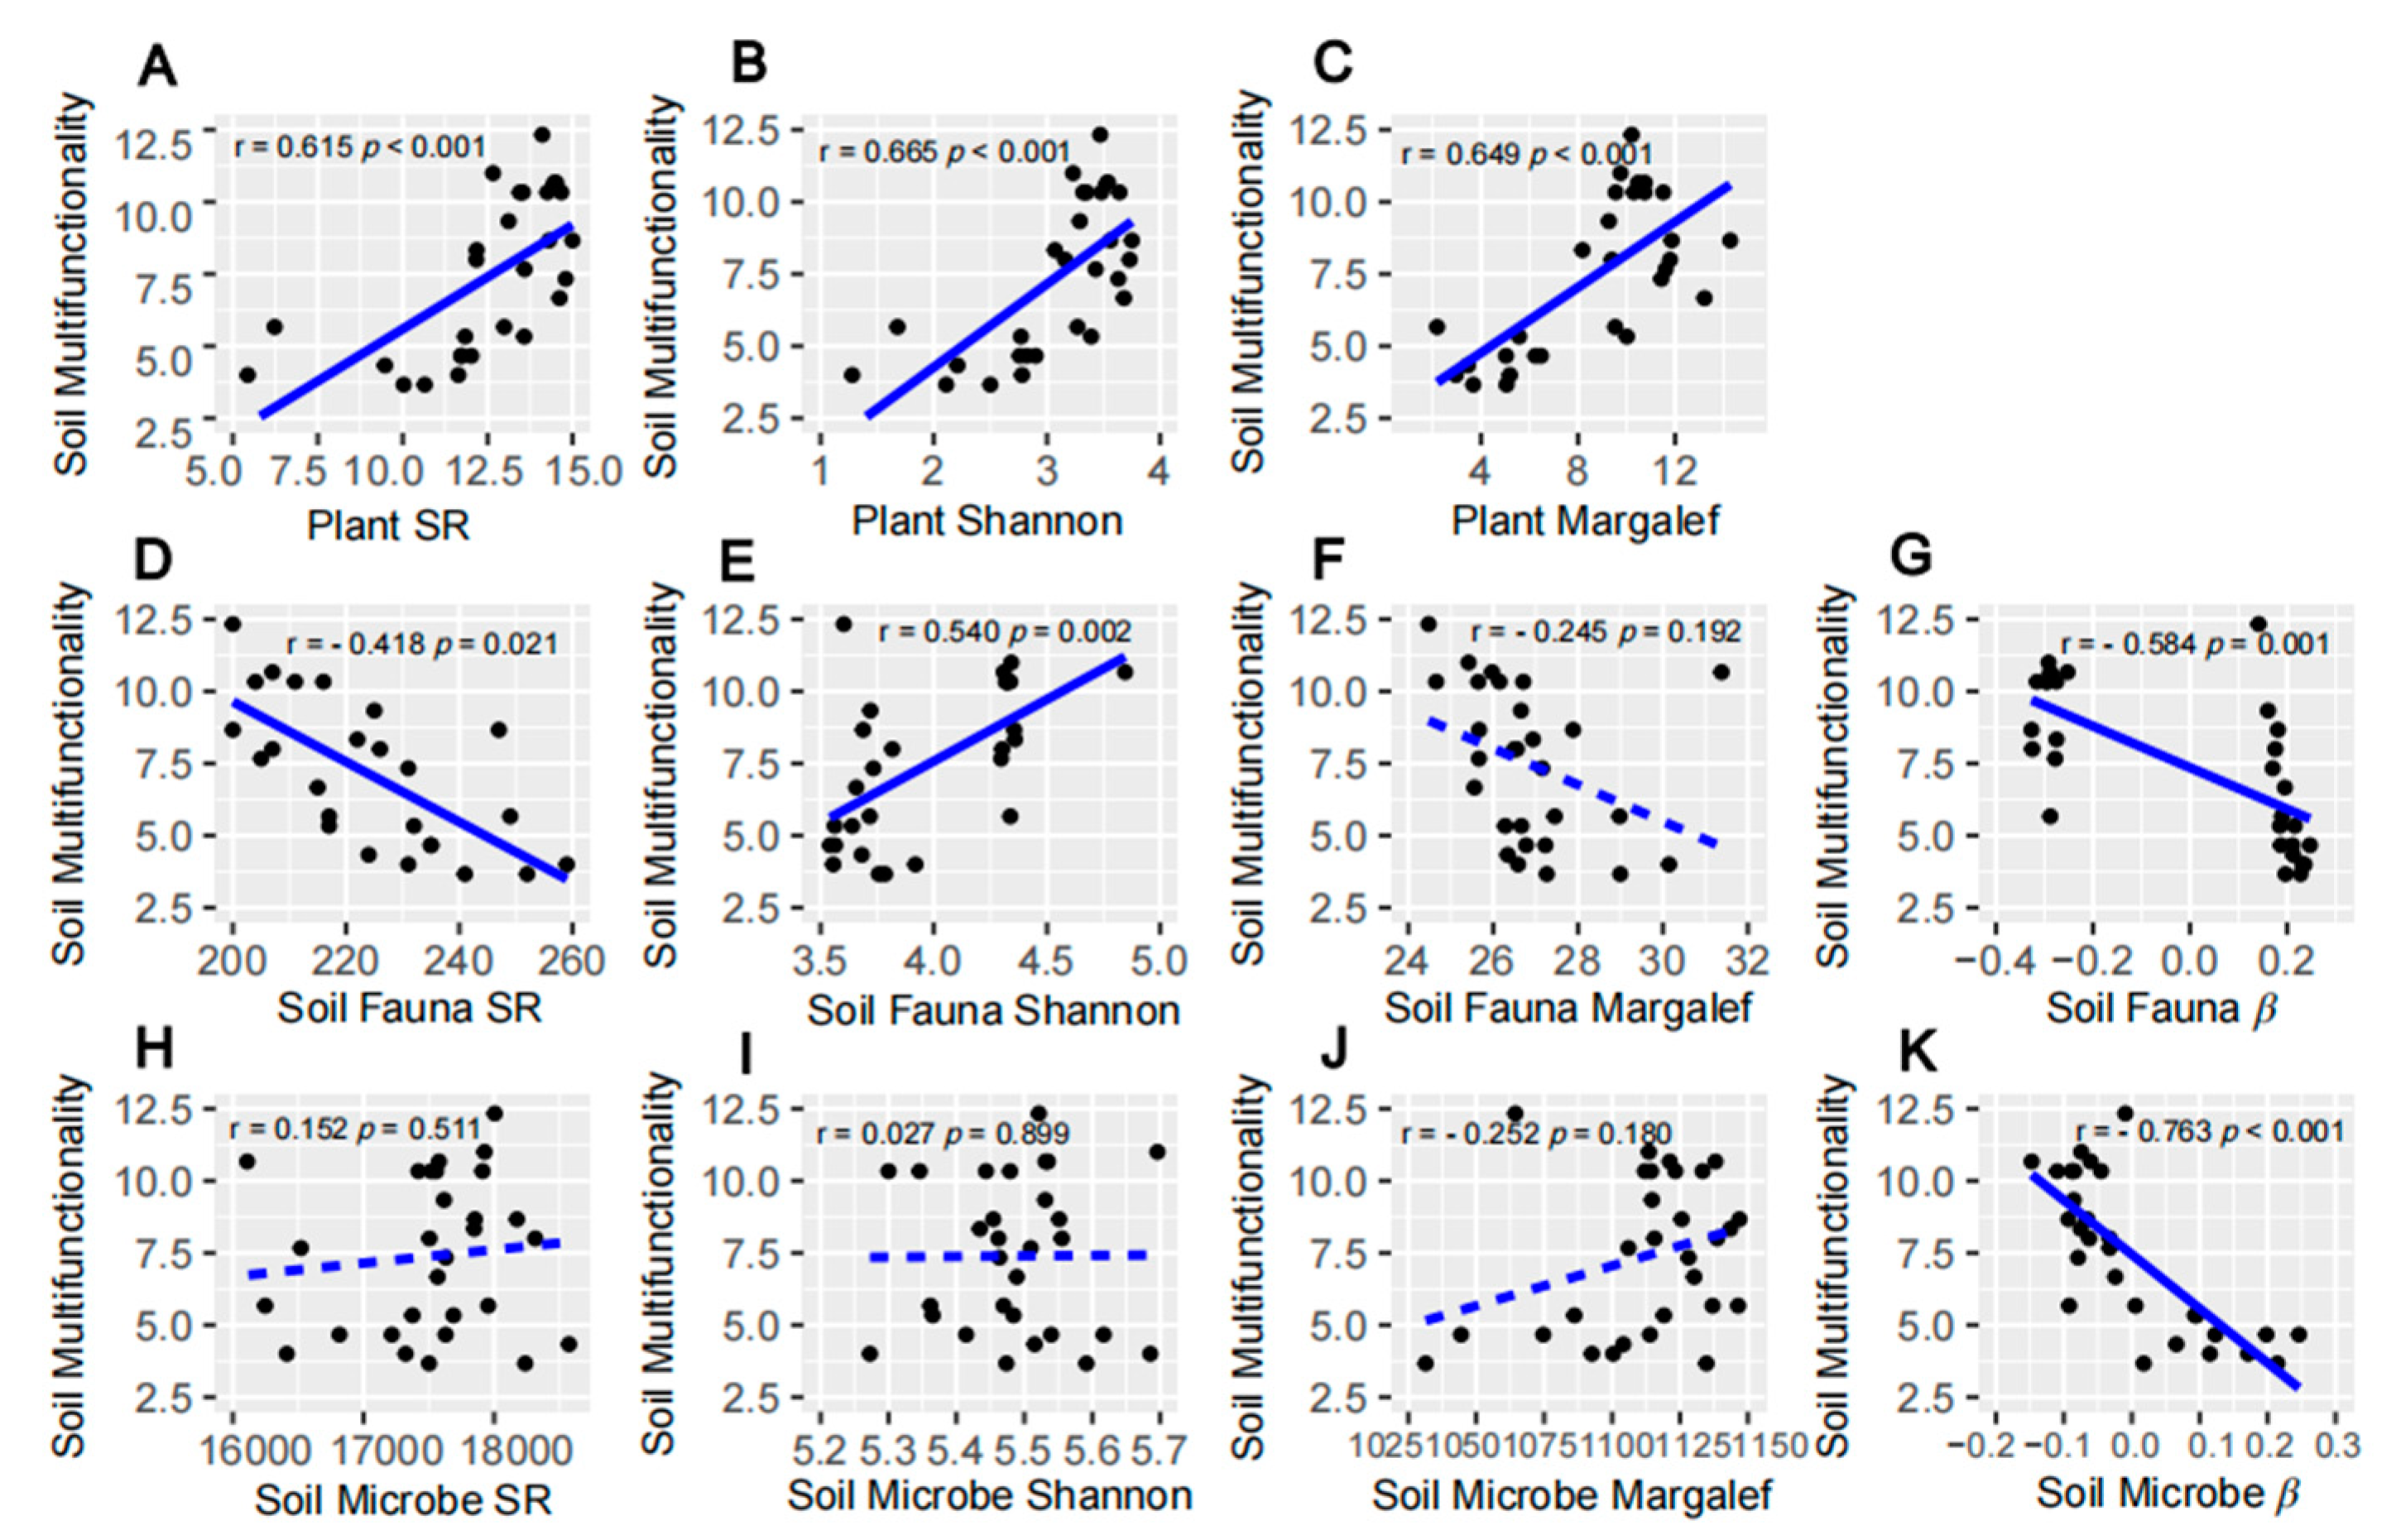
3.2. Relationship between Species Diversity at Multiple Trophic Levels and SMF
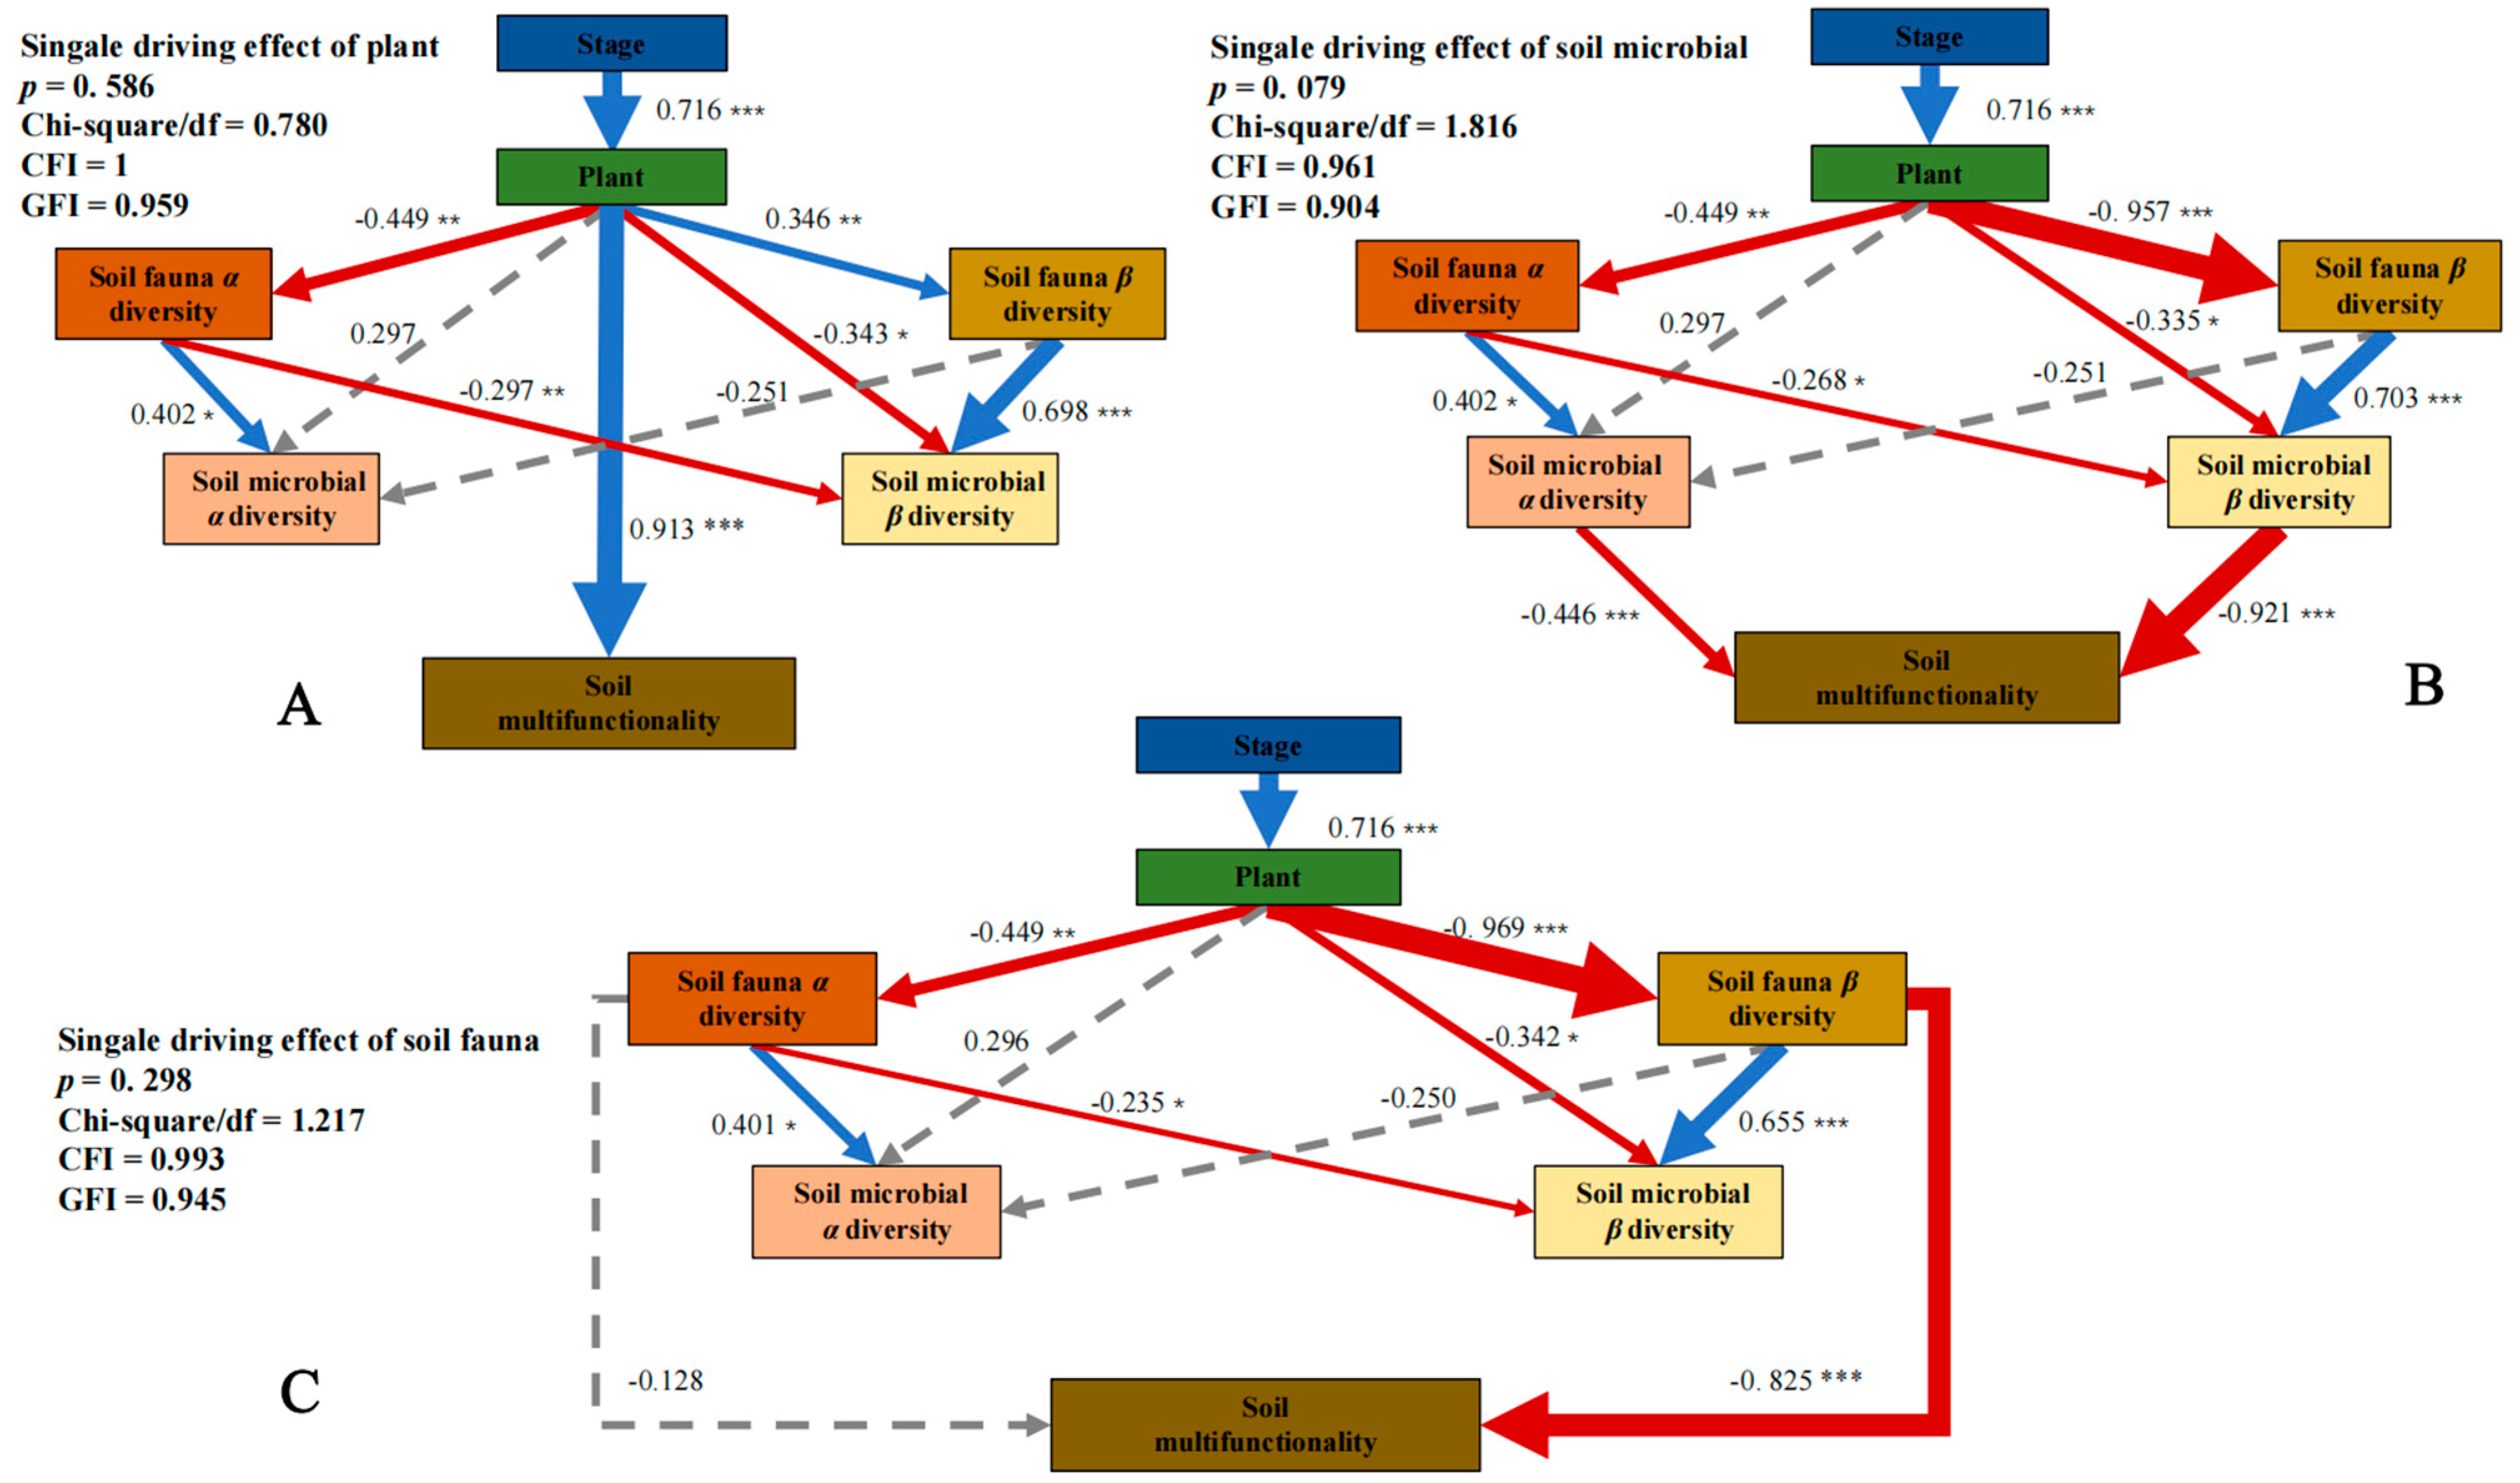
3.3. Driving Mechanism of Single Trophic Levelon SMF
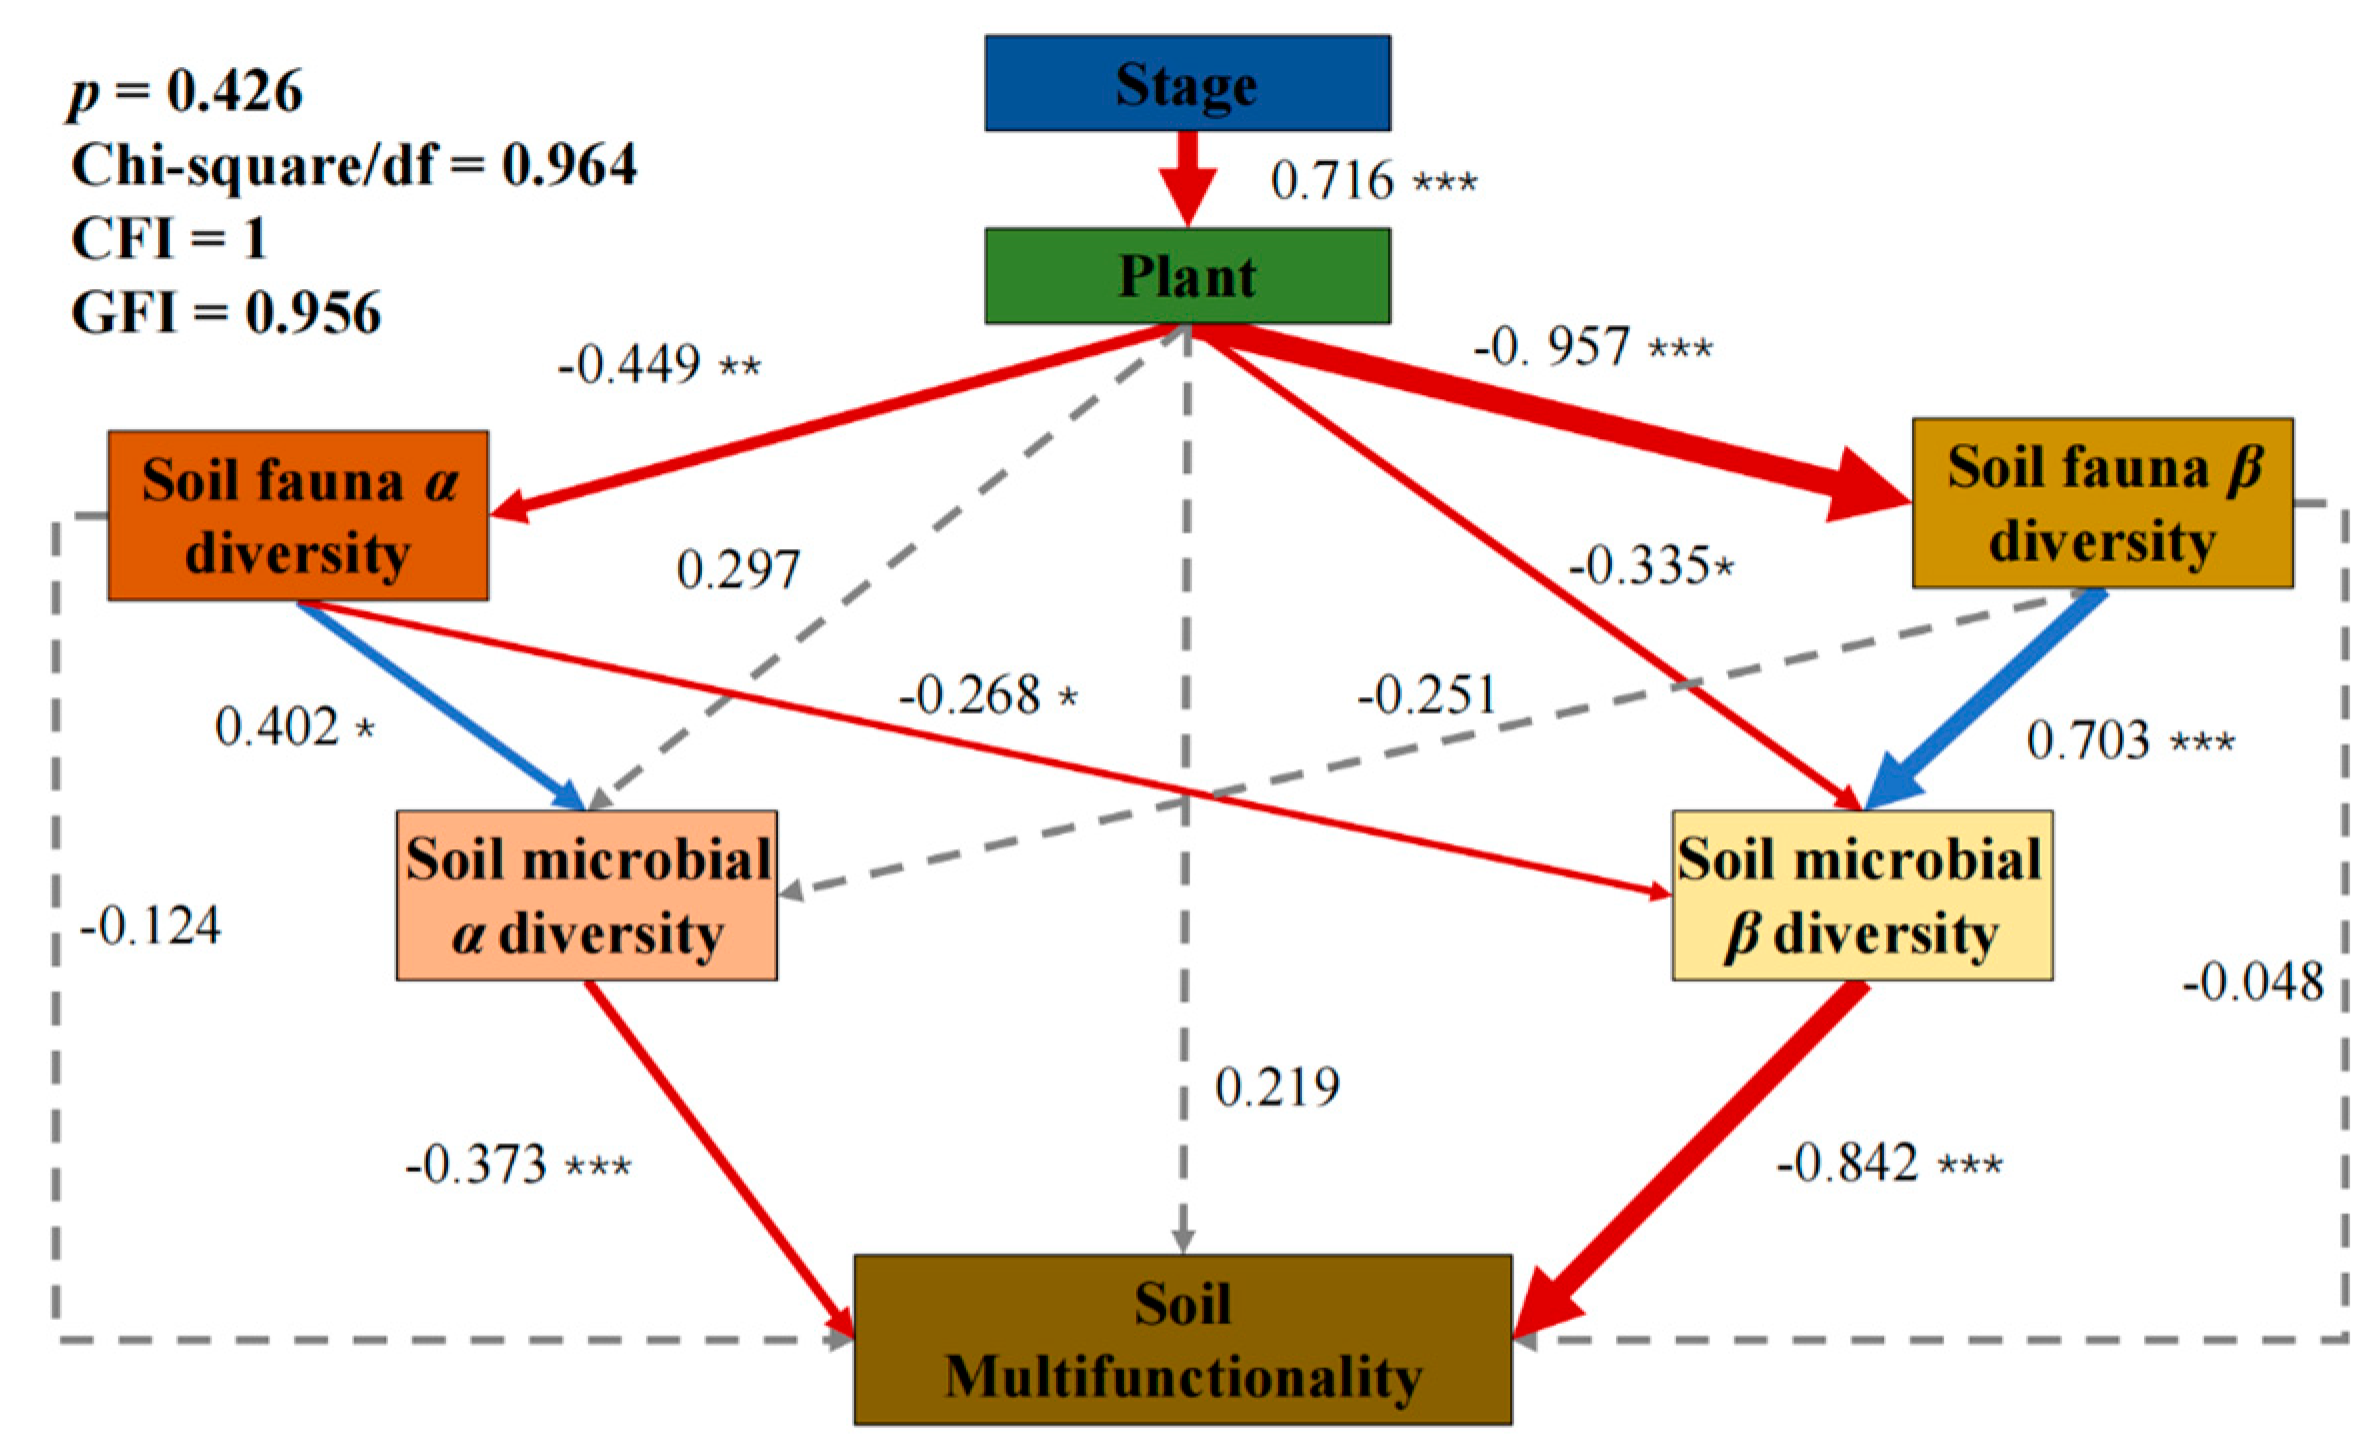
3.4. Driving Mechanism of Species Diversity at Multiple Trophic Levels on SMF
4. Discussion
4.1. Species Diversity at Multiple Trophic Levels and SMF Respond Differently to Restoration
4.2. Stepwise Action of Multiple Trophic Levels Ultimately Drives the Increase in SMF
5. Conclusions
Supplementary Materials
Author Contributions
Funding
Data Availability Statement
Acknowledgments
Conflicts of Interest
References
- Wall, D.H.; Nielsen, U.N.; Six, J. Soil biodiversity and human health. Nature 2015, 528, 69–76. [Google Scholar] [CrossRef]
- Song, S.; Xiong, K.; Chi, Y.; He, C.; Fang, J.; He, S. Effect of Cultivated Pastures on Soil Bacterial Communities in the Karst Rocky Desertification Area. Front. Microbiol. 2022, 13, 922989. [Google Scholar] [CrossRef] [PubMed]
- Creamer, R.E.; Barel, J.M.; Bongiorno, G.; Zwetsloot, M.J. The life of soils: Integrating the who and how of multifunctionality. Soil Biol. Biochem. 2022, 166, 108561. [Google Scholar] [CrossRef]
- Manning, P.; van der Plas, F.; Soliveres, S.; Allan, E.; Maestre, F.T.; Mace, G.; Whittingham, M.J.; Fischer, M. Redefining ecosystem multifunctionality. Nat. Ecol. Evol. 2018, 2, 427–436. [Google Scholar] [CrossRef] [PubMed]
- Wang, L.; Delgado-Baquerizo, M.; Wang, D.; Isbell, F.; Liu, J.; Feng, C.; Liu, J.; Zhong, Z.; Zhu, H.; Yuan, X.; et al. Diversifying livestock promotes multidiversity and multifunctionality in managed grasslands. Proc. Natl. Acad. Sci. USA 2019, 116, 6187–6192. [Google Scholar] [CrossRef] [PubMed]
- Xu, Y.; Dong, K.; Jiang, M.; Liu, Y.; He, L.; Wang, J.; Zhao, N.; Gao, Y. Soil moisture and species richness interactively affect multiple ecosystem functions in a microcosm experiment of simulated shrub encroached grasslands. Sci. Total Environ. 2022, 803, 149950. [Google Scholar] [CrossRef]
- Zheng, Q.; Hu, Y.; Zhang, S.; Noll, L.; Boeckle, T.; Dietrich, M.; Herbold, C.W.; Eichorst, S.A.; Woebken, D.; Richter, A.; et al. Soil multifunctionality is affected by the soil environment and by microbial Choo community composition and diversity. Soil Biol. Biochem. 2019, 136, 107521. [Google Scholar] [CrossRef]
- Zhao, Y.; Li, Z.; Zhang, J.; Song, H.; Liang, Q.; Tao, J.; Cornelissen, J.H.C.; Liu, J. Do shallow soil, low water availability, or their combination increase the competition between grasses with different root systems in karst soil? Environ. Sci. Pollut. Res. 2017, 24, 10640–10651. [Google Scholar] [CrossRef]
- Zeng, F.; Jiang, Z.; Shen, L.; Chen, W.; Yang, Q.; Zhang, C. Assessment of multiple and interacting modes of soil loss in the karst critical zone, Southwest China (SWC). Geomorphology 2018, 322, 97–106. [Google Scholar] [CrossRef]
- Lan, X.; Ding, G.; Dai, Q.; Yan, Y. Assessing the degree of soil erosion in karst mountainous areas by extenics. Catena 2022, 209, 105800. [Google Scholar] [CrossRef]
- Xiong, L.; Li, R. Assessing and decoupling ecosystem services evolution in karst areas: A multi-model approach to support land management decision-making. J. Environ. Manag. 2024, 350, 119632. [Google Scholar] [CrossRef]
- Zhang, Z.; Zhang, F.; Yang, X.; Zhang, J. The occurrence and distributions characteristics of microplastics in soils of different land use patterns in Karst Plateau, Southwest China. Sci. Total Environ. 2024, 906, 167651. [Google Scholar] [CrossRef]
- Eisenhauer, N.; Schielzeth, H.; Barnes, A.D.; Barry, K.E.; Bonn, A.; Brose, U.; Bruelheide, H.; Buchmann, N.; Buscot, F.; Ebeling, A.; et al. A multitrophic perspective on biodiversity-ecosystem functioning research. In Mechanisms Underlying the Relationship between Biodiversity and Ecosystem Function; Eisenhauer, N., Bohan, D.A., Dumbrell, A.J., Eds.; Advances in Ecological Research; Elsevier: Amsterdam, The Netherlands, 2019; Volume 61, pp. 1–54. [Google Scholar]
- Jiang, K.; Zhang, Q.; Wang, Y.; Li, H.; Yang, Y.; Reyimu, T. The Combination of Plant Diversity and Soil Microbial Diversity Directly and Actively Drives the Multifunctionality of Grassland Ecosystems in the Middle Part of the Northern Slopes of the Tian Shan under Grazing Disturbance. Sustainability 2023, 15, 5673. [Google Scholar] [CrossRef]
- van den Hoogen, J.; Geisen, S.; Routh, D.; Ferris, H.; Traunspurger, W.; Wardle, D.A.; de Goede, R.G.M.; Adams, B.J.; Ahmad, W.; Andriuzzi, W.S.; et al. Soil nematode abundance and functional group composition at a global scale. Nature 2019, 572, 194. [Google Scholar] [CrossRef]
- Tilman, D.; Lehman, C.L.; Thomson, K.T. Plant diversity and ecosystem productivity: Theoretical considerations. Proc. Natl. Acad. Sci. USA 1997, 94, 1857–1861. [Google Scholar] [CrossRef]
- Lefcheck, J.S.; Byrnes, J.E.K.; Isbell, F.; Gamfeldt, L.; Griffin, J.N.; Eisenhauer, N.; Hensel, M.J.S.; Hector, A.; Cardinale, B.J.; Duffy, J.E. Biodiversity enhances ecosystem multifunctionality across trophic levels and habitats. Nat. Commun. 2015, 6, 6936. [Google Scholar] [CrossRef] [PubMed]
- de Vries, F.T.; Manning, P.; Tallowin, J.R.B.; Mortimer, S.R.; Pilgrim, E.S.; Harrison, K.A.; Hobbs, P.J.; Quirk, H.; Shipley, B.; Cornelissen, J.H.C.; et al. Abiotic drivers and plant traits explain landscape-scale patterns in soil microbial communities. Ecol. Lett. 2012, 15, 1230–1239. [Google Scholar] [CrossRef] [PubMed]
- Srivastava, D.S.; Cardinale, B.J.; Downing, A.L.; Duffy, J.E.; Jouseau, C.; Sankaran, M.; Wright, J.P. Diversity has stronger top-down than bottom-up effects on decomposition. Ecology 2009, 90, 1073–1083. [Google Scholar] [CrossRef] [PubMed]
- Wagg, C.; Bender, S.F.; Widmer, F.; van der Heijden, M.G.A. Soil biodiversity and soil community composition determine ecosystem multifunctionality. Proc. Natl. Acad. Sci. USA 2014, 111, 5266–5270. [Google Scholar] [CrossRef] [PubMed]
- Delgado-Baquerizo, M.; Maestre, F.T.; Reich, P.B.; Jeffries, T.C.; Gaitan, J.J.; Encinar, D.; Berdugo, M.; Campbell, C.D.; Singh, B.K. Microbial diversity drives multifunctionality in terrestrial ecosystems. Nat. Commun. 2016, 7, 10541. [Google Scholar] [CrossRef] [PubMed]
- Wang, X.; Li, F.Y.; Wang, Y.; Liu, X.; Cheng, J.; Zhang, J.; Baoyin, T.; Bardgett, R.D. High ecosystem multifunctionality under moderate grazing is associated with high plant but low bacterial diversity in a semi-arid steppe grassland. Plant Soil 2020, 448, 265–276. [Google Scholar] [CrossRef]
- Barber, N.A.; Chantos-Davidson, K.M.; Peralta, R.A.; Sherwood, J.P.; Swingley, W.D. Soil microbial community composition in tallgrass prairie restorations converge with remnants across a 27-year chronosequence. Environ. Microbiol. 2017, 19, 3118–3131. [Google Scholar] [CrossRef] [PubMed]
- Dantas, G.; Sommer, M.O.A. How to Fight Back Against Antibiotic Resistance. Am. Sci. 2014, 102, 42–51. [Google Scholar] [CrossRef]
- Davidson, E.A.; Janssens, I.A. Temperature sensitivity of soil carbon decomposition and feedbacks to climate change. Nature 2006, 440, 165–173. [Google Scholar] [CrossRef] [PubMed]
- Jiao, S.; Chen, W.; Wang, J.; Du, N.; Li, Q.; Wei, G. Soil microbiomes with distinct assemblies through vertical soil profiles drive the cycling of multiple nutrients in reforested ecosystems. Microbiome 2018, 6, 146. [Google Scholar] [CrossRef] [PubMed]
- Zhang, Y.; Peng, S.; Chen, X.; Chen, H.Y.H. Plant diversity increases the abundance and diversity of soil fauna: A meta-analysis. Geoderma 2022, 411, 115694. [Google Scholar] [CrossRef]
- Morales-Marquez, J.; Meloni, F. Soil fauna and its potential use in the ecological restoration of dryland ecosystems. Restor. Ecol. 2022, 30, e13686. [Google Scholar] [CrossRef]
- Wall, D.H. Soil Ecology and Ecosystem Services; Oxford University Press: Oxford, UK, 2012. [Google Scholar]
- Phillips, H.R.P.; Guerra, C.A.; Bartz, M.L.C.; Briones, M.J.I.; Brown, G.; Crowther, T.W.; Ferlian, O.; Gongalsky, K.B.; van den Hoogen, J.; Krebs, J.; et al. Global distribution of earthworm diversity. Science 2019, 366, 480–485. [Google Scholar] [CrossRef]
- Grandy, A.S.; Wieder, W.R.; Wickings, K.; Kyker-Snowman, E. Beyond microbes: Are fauna the next frontier in soil biogeochemical models? Soil Biol. Biochem. 2016, 102, 40–44. [Google Scholar] [CrossRef]
- Frelich, L.E.; Blossey, B.; Cameron, E.K.; Dávalos, A.; Eisenhauer, N.; Fahey, T.; Ferlian, O.; Groffman, P.M.; Larson, E.; Loss, S.R. Side-swiped: Ecological cascades emanating from earthworm invasions. Front. Ecol. Environ. 2019, 17, 502–510. [Google Scholar] [CrossRef]
- van Groenigen, J.W.; Lubbers, I.M.; Vos, H.M.J.; Brown, G.G.; De Deyn, G.B.; van Groenigen, K.J. Earthworms increase plant production: A meta-analysis. Sci. Rep. 2014, 4, 6365. [Google Scholar] [CrossRef]
- Forey, E.; Coulibaly, S.F.M.; Chauvat, M. Flowering phenology of a herbaceous species (Poa annua) is regulated by soil Collembola. Soil Biol. Biochem. 2015, 90, 30–33. [Google Scholar] [CrossRef]
- Shen, H.; Shiratori, Y.; Ohta, S.; Masuda, Y.; Isobe, K.; Senoo, K. Mitigating N2O emissions from agricultural soils with fungivorous mites. ISME J. 2021, 15, 2427–2439. [Google Scholar] [CrossRef]
- Soong, J.L.; Nielsen, U.N. The role of microarthropods in emerging models of soil organic matter. Soil Biol. Biochem. 2016, 102, 37–39. [Google Scholar] [CrossRef]
- Jiang, Y.; Wang, J.; Muhammad, S.; Zhou, A.q.; Hao, R.; Wu, Y. How do earthworms affect decomposition of residues with different quality apart from fragmentation and incorporation? Geoderma 2018, 326, 68–75. [Google Scholar] [CrossRef]
- Liu, M.; Hu, Z.; Yao, J.; Chen, X.; Griffiths, B.; Hu, F. After-life legacy effects of enchytraeids increase the functional capability of arable soil following stress. Biol. Fertil. Soils 2022, 58, 721–732. [Google Scholar] [CrossRef]
- Matus-Acuna, V.; Caballero-Flores, G.; Reyes-Hernandez, B.J.; Martinez-Romero, E. Bacterial preys and commensals condition the effects of bacteriovorus nematodes on Zea mays and Arabidopsis thaliana. Appl. Soil Ecol. 2018, 132, 99–106. [Google Scholar] [CrossRef]
- Neher, D.A.; Barbercheck, M.E. Soil Microarthropods and Soil Health: Intersection of Decomposition and Pest Suppression in Agroecosystems. Insects 2019, 10, 414. [Google Scholar] [CrossRef]
- Fu, S.; Liu, M.; Zhang, W.; Shao, Y. Research progress on the geographical distribution and ecological functions of soil fauna diversity. Biodiversity 2022, 30, 150–167. [Google Scholar]
- Hillebrand, H.; Matthiessen, B. Biodiversity in a complex world: Consolidation and progress in functional biodiversity research. Ecol. Lett. 2009, 12, 1405–1419. [Google Scholar] [CrossRef]
- Chillo, V.; Ojeda, R.A.; Capmourteres, V.; Anand, M. Functional diversity loss with increasing livestock grazing intensity in drylands: The mechanisms and their consequences depend on the taxa. J. Appl. Ecol. 2017, 54, 986–996. [Google Scholar] [CrossRef]
- Hu, P.; Liu, S.; Ye, Y.; Zhang, W.; He, X.; Su, Y.; Wang, K. Soil carbon and nitrogen accumulation following agricultural abandonment in a subtropical karst region. Appl. Soil Ecol. 2018, 132, 169–178. [Google Scholar] [CrossRef]
- Fan, Z.; Lu, S.; Liu, S.; Li, Z.; Hong, J.; Zhou, J.; Peng, X. The effects of vegetation restoration strategies and seasons on soil enzyme activities in the Karst landscapes of Yunnan, southwest China. J. For. Res. 2020, 31, 1949–1957. [Google Scholar] [CrossRef]
- Wen, D.; Yang, L.; Ni, K.; Xu, X.; Yu, L.; Elrys, A.S.; Meng, L.; Zhou, J.; Zhu, T.; Mueller, C. Topography-driven differences in soil N transformation constrain N availability in karst ecosystems. Sci. Total Environ. 2024, 908, 168363. [Google Scholar] [CrossRef]
- Condit, R. Tropical Forest Census Plots: Methods and Results from Barro Colorado Island, Panama and a Comparison with Other Plots; Environmental Intelligence Unit; Springer: Berlin, Heidelberg, 1998. [Google Scholar]
- HJ 1167-2021; Technical Specification for Investigation and Assessment of National Ecological Status-Field Observation of Forest Ecosystem. Standardization Administration of China: Beijing, China, 2021.
- Yu, L.; Zhu, S.; Wei, L.; Chen, Z.; Xiong, Z. Study on the Natural Recovery Process of Degraded Karst Communities-Natural Recovery Succession Series. J. Mt. Agric. Biol. 1998, 17, 71–77. [Google Scholar] [CrossRef]
- Chen, S.; Zhou, Y.; Chen, Y.; Gu, J. fastp: An ultra-fast all-in-one FASTQ preprocessor. Bioinformatics 2018, 34, 884–890. [Google Scholar] [CrossRef]
- Li, D.; Liu, C.-M.; Luo, R.; Sadakane, K.; Lam, T.-W. MEGAHIT: An ultra-fast single-node solution for large and complex metagenomics assembly via succinct de Bruijn graph. Bioinformatics 2015, 31, 1674–1676. [Google Scholar] [CrossRef] [PubMed]
- Noguchi, H.; Park, J.; Takagi, T. MetaGene: Prokaryotic gene finding from environmental genome shotgun sequences. Nucleic Acids Res. 2006, 34, 5623–5630. [Google Scholar] [CrossRef] [PubMed]
- Fu, L.; Niu, B.; Zhu, Z.; Wu, S.; Li, W. CD-HIT: Accelerated for clustering the next-generation sequencing data. Bioinformatics 2012, 28, 3150–3152. [Google Scholar] [CrossRef]
- Buchfink, B.; Xie, C.; Huson, D.H. Fast and sensitive protein alignment using DIAMOND. Nat. Methods 2015, 12, 59–60. [Google Scholar] [CrossRef]
- Lin, S.J. The Main Features of Tectonic Movement of Late Cenozoic Era in Guizhou. Geol. Guizhou 1993, 10, 10–17. [Google Scholar]
- Li, Z.; Wang, Y. Development and Evoaluation Charateristics of Crust in Guizhou Province. Guizhou Sci. 2011, 29, 52–56. [Google Scholar]
- Shannon, C.E.; Weaver, W. The Mathematical Theory of Communication; University of Illinois Press: Urbana, IL, USA, 1949; pp. 1–117. [Google Scholar]
- Margalef, R. Diversidad de Especies en las Comunidades Naturales. Publicaciones del Instituto de Biología Aplicada 1951, 9, 5–27. [Google Scholar]
- Whittaker, R.H. Evolution and measurement of species diversity. Taxon 1972, 21, 213–251. [Google Scholar] [CrossRef]
- Pielou, E.C. Ecolgical Diversity; John Wiley & Sons Inc.: Hoboken, NJ, USA, 1975. [Google Scholar]
- Magurran, A.E. Ecological Diversity and Its Measurement; Springer Science & Business Media: Berlin/Heidelberg, Germany, 2013. [Google Scholar]
- Ramette, A. Multivariate analyses in microbial ecology. FEMS Microbiol. Ecol. 2007, 62, 142–160. [Google Scholar] [CrossRef] [PubMed]
- R Core Team. R: A Language and Environment for Statistical Computing; R Foundation for Statistical Computing: Vienna, Austria, 2023. [Google Scholar]
- Rey Benayas, J.M.; Newton, A.C.; Diaz, A.; Bullock, J.M. Enhancement of Biodiversity and Ecosystem Services by Ecological Restoration: A Meta-Analysis. Science 2009, 325, 1121–1124. [Google Scholar] [CrossRef]
- Paula Barral, M.; Rey Benayas, J.M.; Meli, P.; Oscar Maceira, N. Quantifying the impacts of ecological restoration on biodiversity and ecosystem services in agroecosystems: A global meta-analysis. Agric. Ecosyst. Environ. 2015, 202, 223–231. [Google Scholar] [CrossRef]
- Deak, B.; Valko, O.; Kelemen, A.; Toeroek, P.; Miglecz, T.; Oelvedi, T.; Lengyel, S.; Tothmeresz, B. Litter and graminoid biomass accumulation suppresses weedy forbs in grassland restoration. Plant Biosyst. 2011, 145, 730–737. [Google Scholar] [CrossRef]
- Guo, Y.; Hou, L.; Zhang, Z.; Zhang, J.; Cheng, J.; Wei, G.; Lin, Y. Soil microbial diversity during 30 years of grassland restoration on the Loess Plateau, China: Tight linkages with plant diversity. Land Degrad. Dev. 2019, 30, 1172–1182. [Google Scholar] [CrossRef]
- Liu, Q.; Zhang, Q.; Jarvie, S.; Yan, Y.; Han, P.; Liu, T.; Guo, K.; Ren, L.; Yue, K.; Wu, H.; et al. Ecosystem restoration through aerial seeding: Interacting plant-soil microbiome effects on soil multifunctionality. Land Degrad. Dev. 2021, 32, 5334–5347. [Google Scholar] [CrossRef]
- Wang, G.; Liu, Y.; Cui, M.; Zhou, Z.; Zhang, Q.; Li, Y.; Ha, W.; Pang, D.; Luo, J.; Zhou, J. Effects of secondary succession on soil fungal and bacterial compositions and diversities in a karst area. Plant Soil 2022, 475, 91–102. [Google Scholar] [CrossRef]
- He, J.; Zhang, J.; Wang, J.; Dong, Z.; Meng, Z.; Xu, R.; Ji, Y.; Li, Y.; Chen, J.; Qi, X.; et al. Natural restoration enhances soil multitrophic network complexity and ecosystem functions in the Loess Plateau. Catena 2023, 226, 107059. [Google Scholar] [CrossRef]
- Zhao, J.; Li, S.; He, X.; Liu, L.; Wang, K. The Soil Biota Composition along a Progressive Succession of Secondary Vegetation in a Karst Area. PLoS ONE 2014, 9, e112436. [Google Scholar] [CrossRef]
- Zhang, A.; Zhang, Y.; Potapov, A.M.; Bhusal, D.R.; Qiang, W.; Wang, M.; Pang, X. Changes in diversity and functional groups of soil mite communities are associated with properties of food resources along a subalpine secondary succession. Geoderma 2023, 432, 116395. [Google Scholar] [CrossRef]
- Guo, Y.; Xu, T.; Cheng, J.; Wei, G.; Lin, Y. Above- and belowground biodiversity drives soil multifunctionality along a long-term grassland restoration chronosequence. Sci. Total Environ. 2021, 772, 145010. [Google Scholar] [CrossRef]
- Vanbergen, A.J.; Watt, A.D.; Mitchell, R.; Truscott, A.-M.; Palmer, S.C.F.; Ivits, E.; Eggleton, P.; Jones, T.H.; Sousa, J.P. Scale-specific correlations between habitat heterogeneity and soil fauna diversity along a landscape structure gradient. Oecologia 2007, 153, 713–725. [Google Scholar] [CrossRef] [PubMed]
- Huang, C.; Zhou, Z.; Peng, C.; Teng, M.; Wang, P. How is biodiversity changing in response to ecological restoration in terrestrial ecosystems? A meta-analysis in China. Sci. Total Environ. 2019, 650, 1–9. [Google Scholar] [CrossRef]
- Eisenlord, S.D.; Zak, D.R.; Upchurch, R.A. Dispersal limitation and the assembly of soil Actinobacteria communities in a long-term chronosequence. Ecol. Evol. 2012, 2, 538–549. [Google Scholar] [CrossRef] [PubMed]
- Morrien, E.; Hannula, S.E.; Snoek, L.B.; Helmsing, N.R.; Zweers, H.; de Hollander, M.; Soto, R.L.; Bouffaud, M.-L.; Buee, M.; Dimmers, W.; et al. Soil networks become more connected and take up more carbon as nature restoration progresses. Nat. Commun. 2017, 8, 14349. [Google Scholar] [CrossRef] [PubMed]
- Holtkamp, R.; Kardol, P.; van der Wal, A.; Dekker, S.C.; van der Putten, W.H.; de Ruiter, P.C. Soil food web structure during ecosystem development after land abandonment. Appl. Soil Ecol. 2008, 39, 23–34. [Google Scholar] [CrossRef]
- Thakur, M.P.; Geisen, S. Trophic Regulations of the Soil Microbiome. Trends Microbiol. 2019, 27, 771–780. [Google Scholar] [CrossRef] [PubMed]
- Potapov, A.M. Multifunctionality of belowground food webs: Resource, size and spatial energy channels. Biol. Rev. 2022, 97, 1691–1711. [Google Scholar] [CrossRef] [PubMed]
- Korboulewsky, N.; Perez, G.; Chauvat, M. How tree diversity affects soil fauna diversity: A review. Soil Biol. Biochem. 2016, 94, 94–106. [Google Scholar] [CrossRef]
- Yang, X.; Shao, M.a.; Li, T.; Gan, M.; Chen, M. Community characteristics and distribution patterns of soil fauna after vegetation restoration in the northern Loess Plateau. Ecol. Indic. 2021, 122, 107236. [Google Scholar] [CrossRef]
- Deng, Y.; Bai, Y.; Cao, R.; Jiang, Y.; Wang, Z.; Li, F.; Gong, H.; Yang, W. Key drivers of soil arthropod community shift across a subalpine forest series vary greatly with litter and topsoil layers. Eur. J. Soil Biol. 2022, 111, 103421. [Google Scholar] [CrossRef]
- Kivlin, S.N.; Winston, G.C.; Goulden, M.L.; Treseder, K.K. Environmental filtering affects soil fungal community composition more than dispersal limitation at regional scales. Fungal Ecol. 2014, 12, 14–25. [Google Scholar] [CrossRef]
- Fierer, N. Embracing the unknown: Disentangling the complexities of the soil microbiome. Nat. Rev. Microbiol. 2017, 15, 579–590. [Google Scholar] [CrossRef] [PubMed]
- Zeng, Q.; Liu, Y.; An, S. Impact of litter quantity on the soil bacteria community during the decomposition of Quercus wutaishanica litter. PeerJ 2017, 5, e3777. [Google Scholar] [CrossRef]
- Wang, C.; Guo, L.; Shen, R.F. Rare microbial communities drive ecosystem multifunctionality in acidic soils of southern China. Appl. Soil Ecol. 2023, 189, 104895. [Google Scholar] [CrossRef]
- Esteban Lucas-Borja, M.; Delgado-Baquerizo, M. Plant diversity and soil stoichiometry regulates the changes in multifunctionality during pine temperate forest secondary succession. Sci. Total Environ. 2019, 697, 134204. [Google Scholar] [CrossRef]
- Orwin, K.H.; Buckland, S.M.; Johnson, D.; Turner, B.L.; Smart, S.; Oakley, S.; Bardgett, R.D. Linkages of plant traits to soil properties and the functioning of temperate grassland. J. Ecol. 2010, 98, 1074–1083. [Google Scholar] [CrossRef]
- Cadotte, M.W. Functional traits explain ecosystem function through opposing mechanisms. Ecol. Lett. 2017, 20, 989–996. [Google Scholar] [CrossRef] [PubMed]
- Tresch, S.; Frey, D.; Le Bayon, R.-C.; Mader, P.; Stehle, B.; Fliessbach, A.; Moretti, M. Direct and indirect effects of urban gardening on aboveground and belowground diversity influencing soil multifunctionality. Sci. Rep. 2019, 9, 9769. [Google Scholar] [CrossRef] [PubMed]
- Schittko, C.; Onandia, G.; Bernard-Verdier, M.; Heger, T.; Jeschke, J.M.; Kowarik, I.; Maass, S.; Joshi, J. Biodiversity maintains soil multifunctionality and soil organic carbon in novel urban ecosystems. J. Ecol. 2022, 110, 916–934. [Google Scholar] [CrossRef]
- Gusewell, S. N: P ratios in terrestrial plants: Variation and functional significance. New Phytol. 2004, 164, 243–266. [Google Scholar] [CrossRef]
- Lubbers, I.M.; van Groenigen, K.J.; Fonte, S.J.; Six, J.; Brussaard, L.; van Groenigen, J.W. Greenhouse-gas emissions from soils increased by earthworms. Nat. Clim. Change 2013, 3, 187–194. [Google Scholar] [CrossRef]
- Ma, L.; Zhang, C.; Xu, X.; Wang, C.; Liu, G.; Liang, C.; Zuo, X.; Wang, C.; Lv, Y.; Wang, R. Different facets of bacterial and fungal communities drive soil multifunctionality in grasslands spanning a 3500 km transect. Funct. Ecol. 2022, 36, 3120–3133. [Google Scholar] [CrossRef]
- van der Putten, W.H.; Bardgett, R.D.; Bever, J.D.; Bezemer, T.M.; Casper, B.B.; Fukami, T.; Kardol, P.; Klironomos, J.N.; Kulmatiski, A.; Schweitzer, J.A.; et al. Plant-soil feedbacks: The past, the present and future challenges. J. Ecol. 2013, 101, 265–276. [Google Scholar] [CrossRef]
- Bardgett, R.D.; van der Putten, W.H. Belowground biodiversity and ecosystem functioning. Nature 2014, 515, 505–511. [Google Scholar] [CrossRef]
- Gundale, M.J.; Kardol, P. Multi-dimensionality as a path forward in plant-soil feedback research. J. Ecol. 2021, 109, 3446–3465. [Google Scholar] [CrossRef]
- Snajdr, J.; Valaskova, V.; Merhautova, V.; Herinkova, J.; Cajthaml, T.; Baldrian, P. Spatial variability of enzyme activities and microbial biomass in the upper layers of Quercus petraea forest soil. Soil Biol. Biochem. 2008, 40, 2068–2075. [Google Scholar] [CrossRef]
- Clemmensen, K.E.; Bahr, A.; Ovaskainen, O.; Dahlberg, A.; Ekblad, A.; Wallander, H.; Stenlid, J.; Finlay, R.D.; Wardle, D.A.; Lindahl, B.D. Roots and Associated Fungi Drive Long-Term Carbon Sequestration in Boreal Forest. Science 2013, 339, 1615–1618. [Google Scholar] [CrossRef]
- Delgado-Baquerizo, M.; Eldridge, D.J.; Ochoa, V.; Gozalo, B.; Singh, B.K.; Maestre, F.T. Soil microbial communities drive the resistance of ecosystem multifunctionality to global change in drylands across the globe. Ecol. Lett. 2017, 20, 1295–1305. [Google Scholar] [CrossRef]
- Illig, J.; Schatz, H.; Scheu, S.; Maraun, M. Decomposition and colonization by micro-arthropods of two litter types in a tropical montane rain forest in southern Ecuador. J. Trop. Ecol. 2008, 24, 157–167. [Google Scholar] [CrossRef]
- Strickland, M.S.; Osburn, E.; Lauber, C.; Fierer, N.; Bradford, M.A. Litter quality is in the eye of the beholder: Initial decomposition rates as a function of inoculum characteristics. Funct. Ecol. 2009, 23, 627–636. [Google Scholar] [CrossRef]
- Marian, F.; Brown, L.; Sandmann, D.; Maraun, M.; Scheu, S. Roots, mycorrhizal fungi and altitude as determinants of litter decomposition and soil animal communities in tropical montane rainforests. Plant Soil 2019, 438, 1–18. [Google Scholar] [CrossRef]
- Sanchez-Galindo, L.M.; Sandmann, D.; Marian, F.; Lauermann, T.; Maraun, M.; Scheu, S. Differences in leaf and root litter decomposition in tropical montane rainforests are mediated by soil microorganisms not by decomposer microarthropods. PeerJ 2022, 10, e14264. [Google Scholar] [CrossRef] [PubMed]
- Salamon, J.-A.; Alphei, J. The Collembola community of a Central European forest: Influence of tree species composition. Eur. J. Soil Biol. 2009, 45, 199–206. [Google Scholar] [CrossRef]
- Wang, B.; Verheyen, K.; Baeten, L.; De Smedt, P. Herb litter mediates tree litter decomposition and soil fauna composition. Soil Biol. Biochem. 2021, 152, 108063. [Google Scholar] [CrossRef]
- Zhang, H.; Han, G.; Huang, T.; Feng, Y.; Tian, W.; Wu, X. Mixed Forest of Larix principis-rupprechtii and Betula platyphylla Modulating Soil Fauna Diversity and Improving Faunal Effect on Litter Decomposition. Forests 2022, 13, 703. [Google Scholar] [CrossRef]
- Zhou, Y.; Liu, C.; Ai, N.; Qin, J.; Shi, J.; Nan, Z. Soil fauna community characteristics and driving factors of Pinus tabuliformis in the loess region of northern Shaanxi. Catena 2023, 229, 107196. [Google Scholar] [CrossRef]
- Crowther, T.W.; Stanton, D.W.G.; Thomas, S.M.; A’Bear, A.D.; Hiscox, J.; Jones, T.H.; Voriskova, J.; Baldrian, P.; Boddy, L. Top-down control of soil fungal community composition by a globally distributed keystone consumer. Ecology 2013, 94, 2518–2528. [Google Scholar] [CrossRef]
- Sanchez-Galindo, L.M.; Sandmann, D.; Marian, F.; Krashevska, V.; Maraun, M.; Scheu, S. Leaf litter identity rather than diversity shapes microbial functions and microarthropod abundance in tropical montane rainforests. Ecol. Evol. 2021, 11, 2360–2374. [Google Scholar] [CrossRef]
- Jin, Y.; Wei, X.; White, J.F.; Chen, T.; Li, X.; Chen, Z.; Li, C. Soil fungal and bacterial communities are altered by the incorporation of leaf litter containing a fungal endophyte. Eur. J. Soil Sci. 2022, 73, e13240. [Google Scholar] [CrossRef]
- Liu, Y.; Li, D.; Gao, H.; Li, Y.; Chen, W.; Jiao, S.; Wei, G. Regulation of soil micro-foodwebs to root secondary metabolites in cultivated and wild licorice plants. Sci. Total Environ. 2022, 828, 154302. [Google Scholar] [CrossRef]
- Wardle, D.A. The influence of biotic interactions on soil biodiversity. Ecol. Lett. 2006, 9, 870–886. [Google Scholar] [CrossRef]
- Demetrio, W.C.; Dionisio, J.A.; Maceda, A. Negative effects of earthworms on soil nematodes are dependent on earthworm density, ecological category and experimental conditions. Pedobiologia 2019, 76, 150568. [Google Scholar] [CrossRef]
- Monteux, S.; Marien, J.; Krab, E.J. Dispersal of bacteria and stimulation of permafrost decomposition by Collembola. Biogeosciences 2022, 19, 4089–4105. [Google Scholar] [CrossRef]
- Dolinsek, J.; Lagkouvardos, I.; Wanek, W.; Wagner, M.; Daims, H. Interactions of Nitrifying Bacteria and Heterotrophs: Identification of a Micavibrio-like Putative Predator of Nitrospira spp. Antonie Van Leeuwenhoek 2013, 79, 2027–2037. [Google Scholar] [CrossRef] [PubMed]
- Johnke, J.; Boenigk, J.; Harms, H.; Chatzinotas, A. Killing the killer: Predation between protists and predatory bacteria. FEMS Microbiol. Lett. 2017, 364, fnx089. [Google Scholar] [CrossRef] [PubMed]
- Hooper, D.U.; Vitousek, P.M. Effects of plant composition and diversity on nutrient cycling. Ecol. Monogr. 1998, 68, 121–149. [Google Scholar] [CrossRef]
- Gamfeldt, L.; Hillebrand, H.; Jonsson, P.R. Multiple functions increase the importance of biodiversity for overall ecosystem functioning. Ecology 2008, 89, 1223–1231. [Google Scholar] [CrossRef] [PubMed]


| Heading | Ecosystem Function | Ecosystem Multifunctionality |
|---|---|---|
| Plant diversity | 15,895 | 719 |
| Soil microbial diversity | 5420 | 328 |
| Soil fauna diversity | 751 | 26 |
| Plant diversity + Soil microbial diversity | 4149 | 274 |
| Plant diversity + Soil fauna diversity | 593 | 21 |
| Soil microbial diversity + Soil fauna diversity | 294 | 8 |
| Plant diversity + Soil fauna diversity + Soil microbial diversity | 241 | 8 |
Disclaimer/Publisher’s Note: The statements, opinions and data contained in all publications are solely those of the individual author(s) and contributor(s) and not of MDPI and/or the editor(s). MDPI and/or the editor(s) disclaim responsibility for any injury to people or property resulting from any ideas, methods, instructions or products referred to in the content. |
© 2024 by the authors. Licensee MDPI, Basel, Switzerland. This article is an open access article distributed under the terms and conditions of the Creative Commons Attribution (CC BY) license (https://creativecommons.org/licenses/by/4.0/).
Share and Cite
Long, F.; Zhou, G.; Zu, L.; Zang, L.; Chen, D.; Zhang, G.; Sui, M.; He, Y.; Liu, Q. Multi-Trophic Species Diversity Contributes to the Restoration of Soil Multifunctionality in Degraded Karst Forests through Cascading Effects. Forests 2024, 15, 559. https://doi.org/10.3390/f15030559
Long F, Zhou G, Zu L, Zang L, Chen D, Zhang G, Sui M, He Y, Liu Q. Multi-Trophic Species Diversity Contributes to the Restoration of Soil Multifunctionality in Degraded Karst Forests through Cascading Effects. Forests. 2024; 15(3):559. https://doi.org/10.3390/f15030559
Chicago/Turabian StyleLong, Fayu, Guanghui Zhou, Lei Zu, Lipeng Zang, Danmei Chen, Guangqi Zhang, Mingzhen Sui, Yuejun He, and Qingfu Liu. 2024. "Multi-Trophic Species Diversity Contributes to the Restoration of Soil Multifunctionality in Degraded Karst Forests through Cascading Effects" Forests 15, no. 3: 559. https://doi.org/10.3390/f15030559