
Effects of Drought, Phosphorus Fertilization and Provenance on the Growth of Common Beech and Sessile Oak
 , , , ,
Abstract
:1. Introduction
- examine the effects of drought, P fertilization and provenance on the growth of common beech and sessile oak;
- examine how fertilization with P affects the growth and allometric growth relationships between belowground and aboveground organs of common beech and sessile oak, i.e., their adaptation capacity to drought;
- examine the common beech and sessile oak provenance differentiation with regard to different local habitat conditions.
2. Materials and Methods
2.1. Plant Material and Provenance Habitat Conditions
2.2. Experimental Design and Growth Conditions
2.3. Soil Water Content and Chemical Traits
2.4. Leaf Water Potential, Growth and Dry Mass Production
2.5. Leaf Chemical Traits
2.6. Statistical Analysis
3. Results
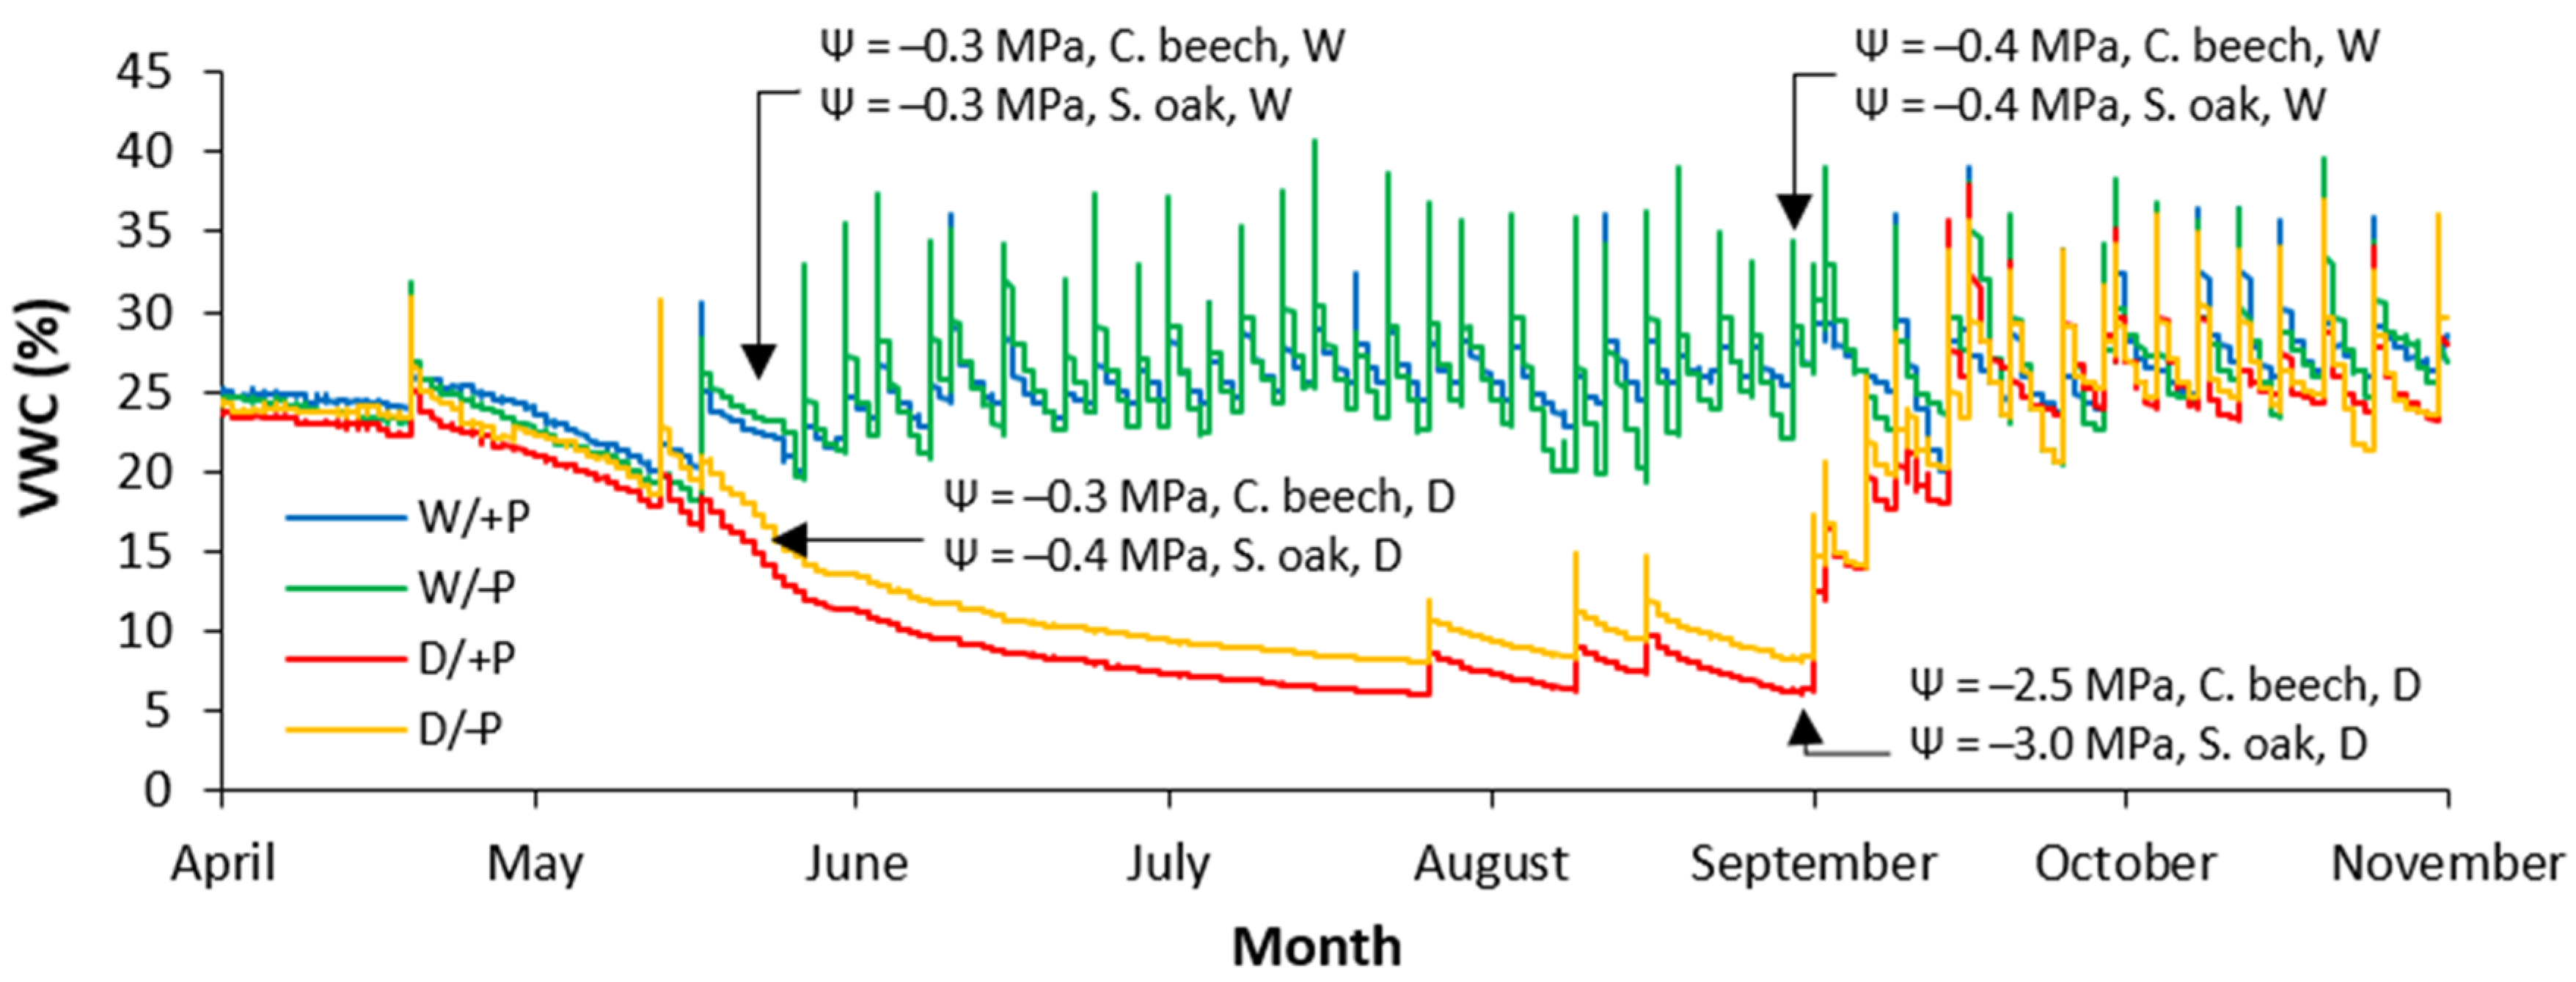
3.1. Soil Water Conditions and Sapling Water Balances
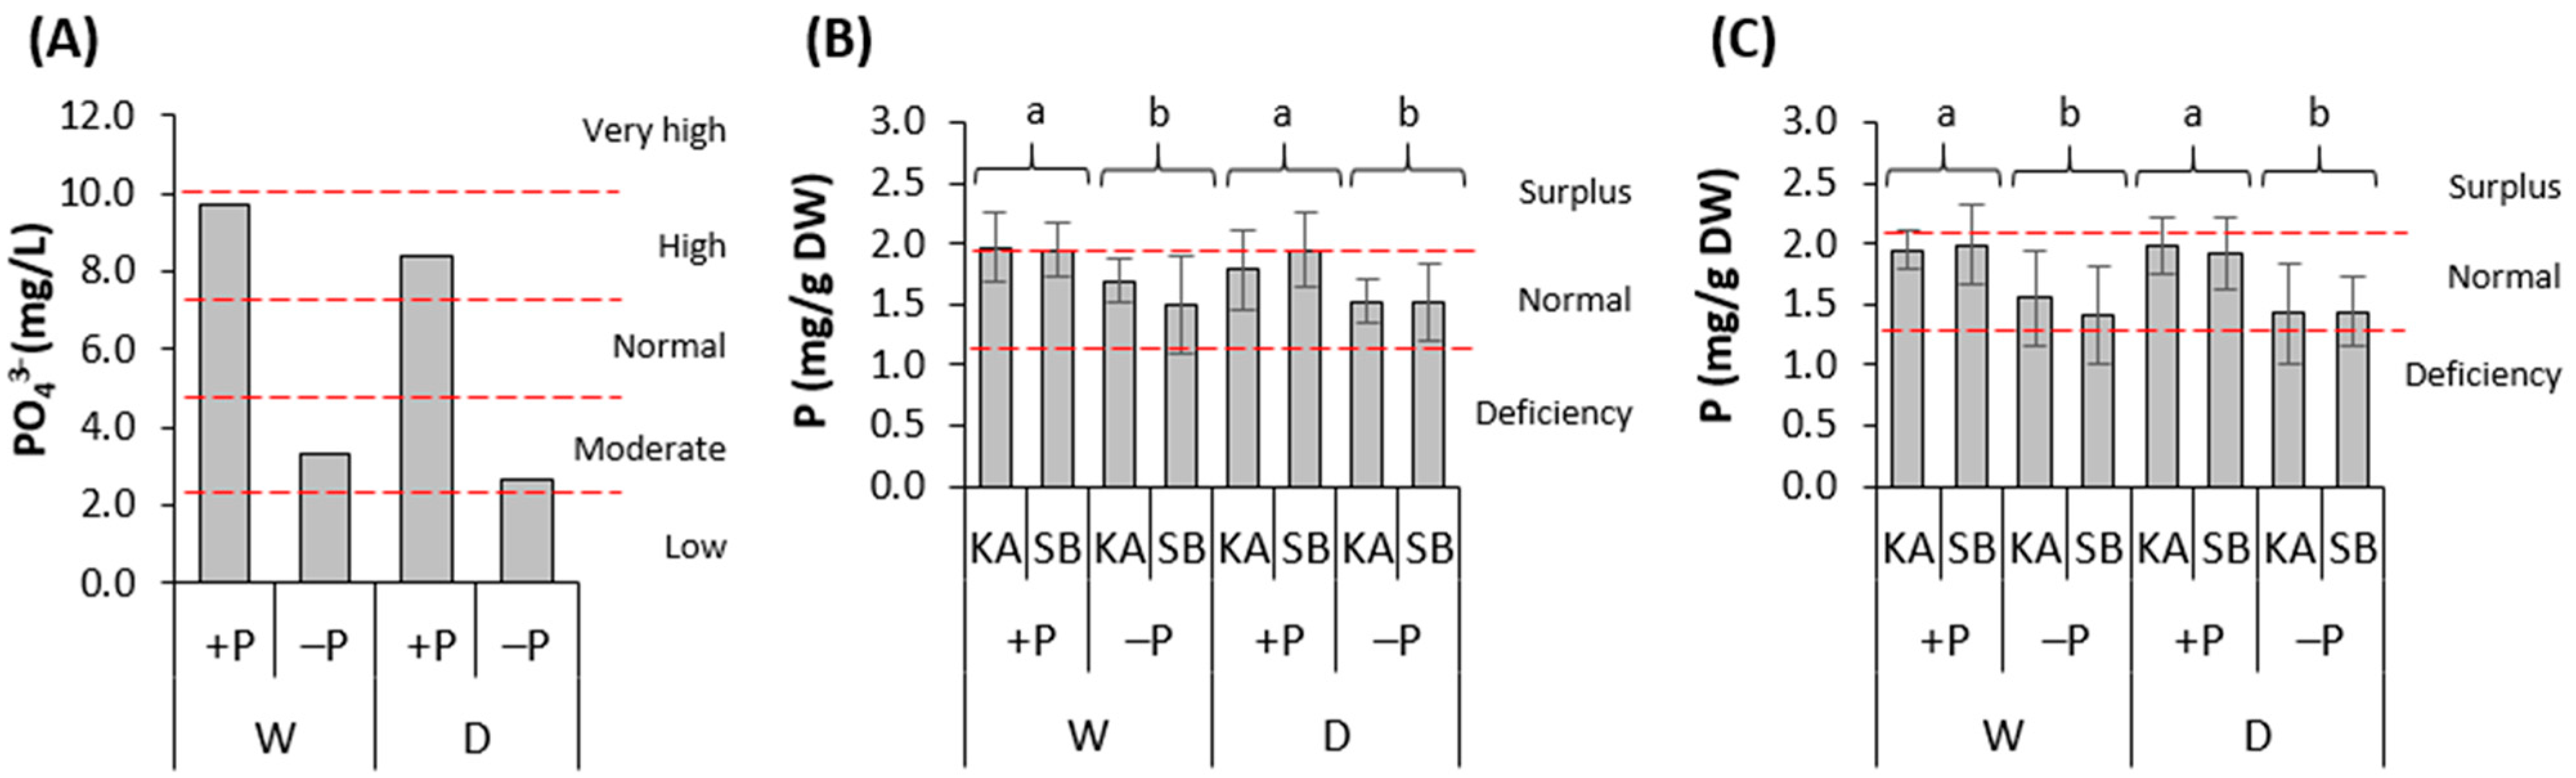
3.2. Substrate P Concentration and Sapling Nutrition with P
3.3. Effect of Drought on Sapling Growth
3.4. Effect of P Fertilization on Sapling Growth
3.5. Effect of Provenance on Sapling Growth
3.6. Effect of Drought, P Fertilization and Provenance Interactions on Sapling Growth
4. Discussion
4.1. Effect of Drought on Sapling Growth
4.2. Effect of P Fertilization and Interaction Drought × P Fertilization on Sapling Growth
4.3. Effect of Provenance and Interaction Drought × Provenance on Sapling Growth
5. Conclusions
Author Contributions
Funding
Data Availability Statement
Acknowledgments
Conflicts of Interest
Appendix A


| Parameter | W/+P | W/−P | D/+P | D/−P | ||||
|---|---|---|---|---|---|---|---|---|
| Values | Description | Values | Description | Values | Description | Values | Description | |
| pH (H2O) | 6.33 | Slightly acidic | 6.88 | Neutral | 6.81 | Neutral | 7.07 | Neutral |
| PO43− (mg/L) | 9.7 | High | 3.31 | Moderate | 8.4 | High | 2.66 | Moderate |
| NH4+ (mg/L) | 12.13 | Optimal | 12.56 | Optimal | 13.24 | Optimal | 13.76 | Optimal |
| NO3− (mg/L.) | 69.8 | Optimal | 50.3 | Optimal | 59.5 | Optimal | 60 | Optimal |
| N total (mg/L) | 47.4 | Medium–normal | 46.57 | Medium–normal | 46.92 | Medium–normal | 49.69 | Medium–normal |
| K+ (mg/L) | 59.9 | Medium–normal | 60.4 | Medium–normal | 63.0 | Medium–normal | 60.9 | Medium–normal |
| Mg2+ (mg/L) | 51.68 | Moderate | 53.52 | Moderate | 61.38 | Moderate | 54.53 | Moderate |
| Ca2+ (mg/L) | 196 | Low | 244 | Low | 204 | Low | 234 | Low |
| Cl− (mg/L) | 57.3 | Medium–normal | 58.4 | Medium–normal | 54.8 | Medium–normal | 52.4 | Low |
| Na+ (mg/L) | 35.49 | Moderate | 36.5 | Moderate | 34.79 | Moderate | 36.6 | Moderate |
| E.C. (mS/cm) | 1.198 | Medium–normal | 1.171 | Medium–normal | 1.185 | Medium–normal | 1.156 | Medium–normal |
| Salt (%) | 0.153 | Medium–normal | 0.149 | Medium–normal | 0.151 | Medium–normal | 0.147 | Medium–normal |
| Species | Nutrients | Water Treatments | Fertilization Treatments | Provenances | Critical Foliar Concentration | |||||
|---|---|---|---|---|---|---|---|---|---|---|
| W | D | +P | −P | KA | SB | Deficiency | Normal Range | Surplus | ||
| Common beech | P (mg g−1) | 1.77 ± 0.34 | 1.70 ± 0.33 | 1.91 ± 0.29 | 1.56 ± 0.29 | 1.74 ± 0.29 | 1.73 ± 0.38 | ˂1.2 | 1.2–1.9 | >1.9 |
| N (mg g−1) | 22.68 ± 4.55 | 21.53 ± 3.85 | 21.25 ± 4.44 | 22.96 ± 3.87 | 22.48 ± 4.13 | 21.73 ± 4.35 | ˂18.7 | 18.7–23.2 | >23.2 | |
| Ca (mg g−1) | 6.27 ± 2.00 | 5.99 ± 1.99 | 6.51 ± 2.32 | 5.75 ± 1.53 | 6.03 ± 2.12 | 6.23 ± 1.88 | ˂6.7 | 6.7–14.0 | >14.0 | |
| Mg (mg g−1) | 2.14 ± 0.42 | 2.16 ± 0.38 | 2.21 ± 0.41 | 2.09 ± 0.37 | 2.12 ± 0.37 | 2.18 ± 0.42 | ˂1.1 | 1.1–2.3 | >2.3 | |
| K (mg g−1) | 7.33 ± 1.58 | 7.31 ± 1.78 | 7.13 ± 1.86 | 7.51 ± 1.46 | 7.49 ± 1.79 | 7.15 ± 1.55 | ˂6.1 | 6.1–9.7 | >9.7 | |
| Fe (mg g−1) | 0.11 ± 0.03 | 0.12 ± 0.05 | 0.11 ± 0.03 | 0.12 ± 0.06 | 0.11 ± 0.05 | 0.12 ± 0.04 | - | - | - | |
| N/P | 13.27 ± 3.62 | 13.35 ± 3.92 | 11.42 ± 3.07 | 15.20 ± 3.43 | 13.24 ± 3.12 | 13.38 ± 4.33 | - | - | - | |
| Sessile oak | P (mg g−1) | 1.72 ± 0.41 | 1.69 ± 0.40 | 1.96 ± 0.26 | 1.46 ± 0.37 | 1.73 ± 0.39 | 1.69 ± 0.42 | ˂1.4 | 1.4–2.1 | >2.1 |
| N (mg g−1) | 20.94 ± 3.04 | 20.21 ± 2.93 | 20.77 ± 3.22 | 20.38 ± 2.77 | 20.47 ± 2.88 | 20.68 ± 3.14 | ˂19.8 | 19.8–26.8 | >26.8 | |
| Ca (mg g−1) | 9.78 ± 3.17 | 10.00 ± 3.46 | 10.27 ± 3.85 | 9.5 ± 2.64 | 9.70 ± 3.25 | 10.08 ± 3.39 | ˂5.3 | 5.3–10.2 | >10.2 | |
| Mg (mg g−1) | 2.47 ± 0.43 | 2.39 ± 0.40 | 2.44 ± 0.47 | 2.42 ± 0.37 | 2.40 ± 0.44 | 2.45 ± 0.40 | ˂1.2 | 1.2–2.4 | - | |
| K (mg g−1) | 9.71 ± 1.98 | 9.43 ± 1.60 | 10.36 ± 1.91 | 8.78 ± 1.25 | 9.63 ± 1.96 | 9.51 ± 1.63 | ˂7.2 | 7.2–11.4 | >11.4 | |
| Fe (mg g−1) | 0.11 ± 0.05 | 0.12 ± 0.05 | 0.12 ± 0.06 | 0.11 ± 0.04 | 0.11 ± 0.04 | 0.12 ± 0.05 | - | - | - | |
| N/P | 13.13 ± 4.90 | 12.69 ± 3.84 | 10.82 ± 2.41 | 15.00 ± 4.91 | 12.68 ± 4.46 | 13.13 ± 4.34 | - | - | - | |
| Parameter | Drought (D) | Fertilization (P) | Provenance (Pr) | D × P | D × Pr | P × Pr | D × P × Pr | ||||||||
|---|---|---|---|---|---|---|---|---|---|---|---|---|---|---|---|
| F | p | F | p | F | p | F | p | F | p | F | p | F | p | ||
| Growth | DMarch (mm) | 0.029 | 0.866 | 0.502 | 0.480 | 1.019 | 0.315 | 1.370 | 0.245 | 0.248 | 0.620 | 0.323 | 0.571 | 0.384 | 0.537 |
| Dincrement (mm) | 0.602 | 0.440 | 2.463 | 0.120 | 4.957 | 0.029 | 0.003 | 0.955 | 0.095 | 0.759 | 0.470 | 0.495 | 1.610 | 0.208 | |
| DSeptember (mm) | 0.223 | 0.638 | 1.540 | 0.218 | 3.112 | 0.081 | 0.784 | 0.378 | 0.274 | 0.602 | 0.553 | 0.459 | 0.006 | 0.940 | |
| HMarch (cm) | 0.000 | 0.983 | 0.107 | 0.744 | 1.050 | 0.308 | 0.065 | 0.799 | 0.170 | 0.681 | 0.090 | 0.765 | 1.117 | 0.293 | |
| Hincrement (cm) | 10.433 | 0.002 | 0.033 | 0.857 | 1.125 | 0.292 | 1.284 | 0.260 | 0.001 | 0.973 | 0.032 | 0.859 | 0.692 | 0.408 | |
| HSeptember (cm) | 1.956 | 0.166 | 0.053 | 0.818 | 0.256 | 0.614 | 0.066 | 0.799 | 0.165 | 0.686 | 0.131 | 0.718 | 0.405 | 0.526 | |
| Larea (m2) | 0.757 | 0.387 | 1.566 | 0.214 | 0.321 | 0.573 | 2.766 | 0.100 | 0.189 | 0.665 | 0.182 | 0.671 | 0.103 | 0.749 | |
| TRlength (cm) | 1.259 | 0.265 | 5.585 | 0.020 | 0.004 | 0.951 | 0.603 | 0.439 | 0.449 | 0.505 | 0.336 | 0.564 | 0.047 | 0.828 | |
| Lmass (g) | 0.781 | 0.379 | 0.642 | 0.425 | 0.377 | 0.541 | 1.153 | 0.286 | 0.081 | 0.776 | 0.169 | 0.682 | 0.000 | 0.988 | |
| STmass (g) | 2.118 | 0.149 | 0.059 | 0.809 | 0.386 | 0.536 | 0.549 | 0.461 | 0.005 | 0.945 | 0.004 | 0.952 | 0.163 | 0.687 | |
| AGmass (g) | 1.783 | 0.185 | 0.158 | 0.692 | 0.402 | 0.528 | 0.718 | 0.399 | 0.001 | 0.981 | 0.024 | 0.877 | 0.091 | 0.764 | |
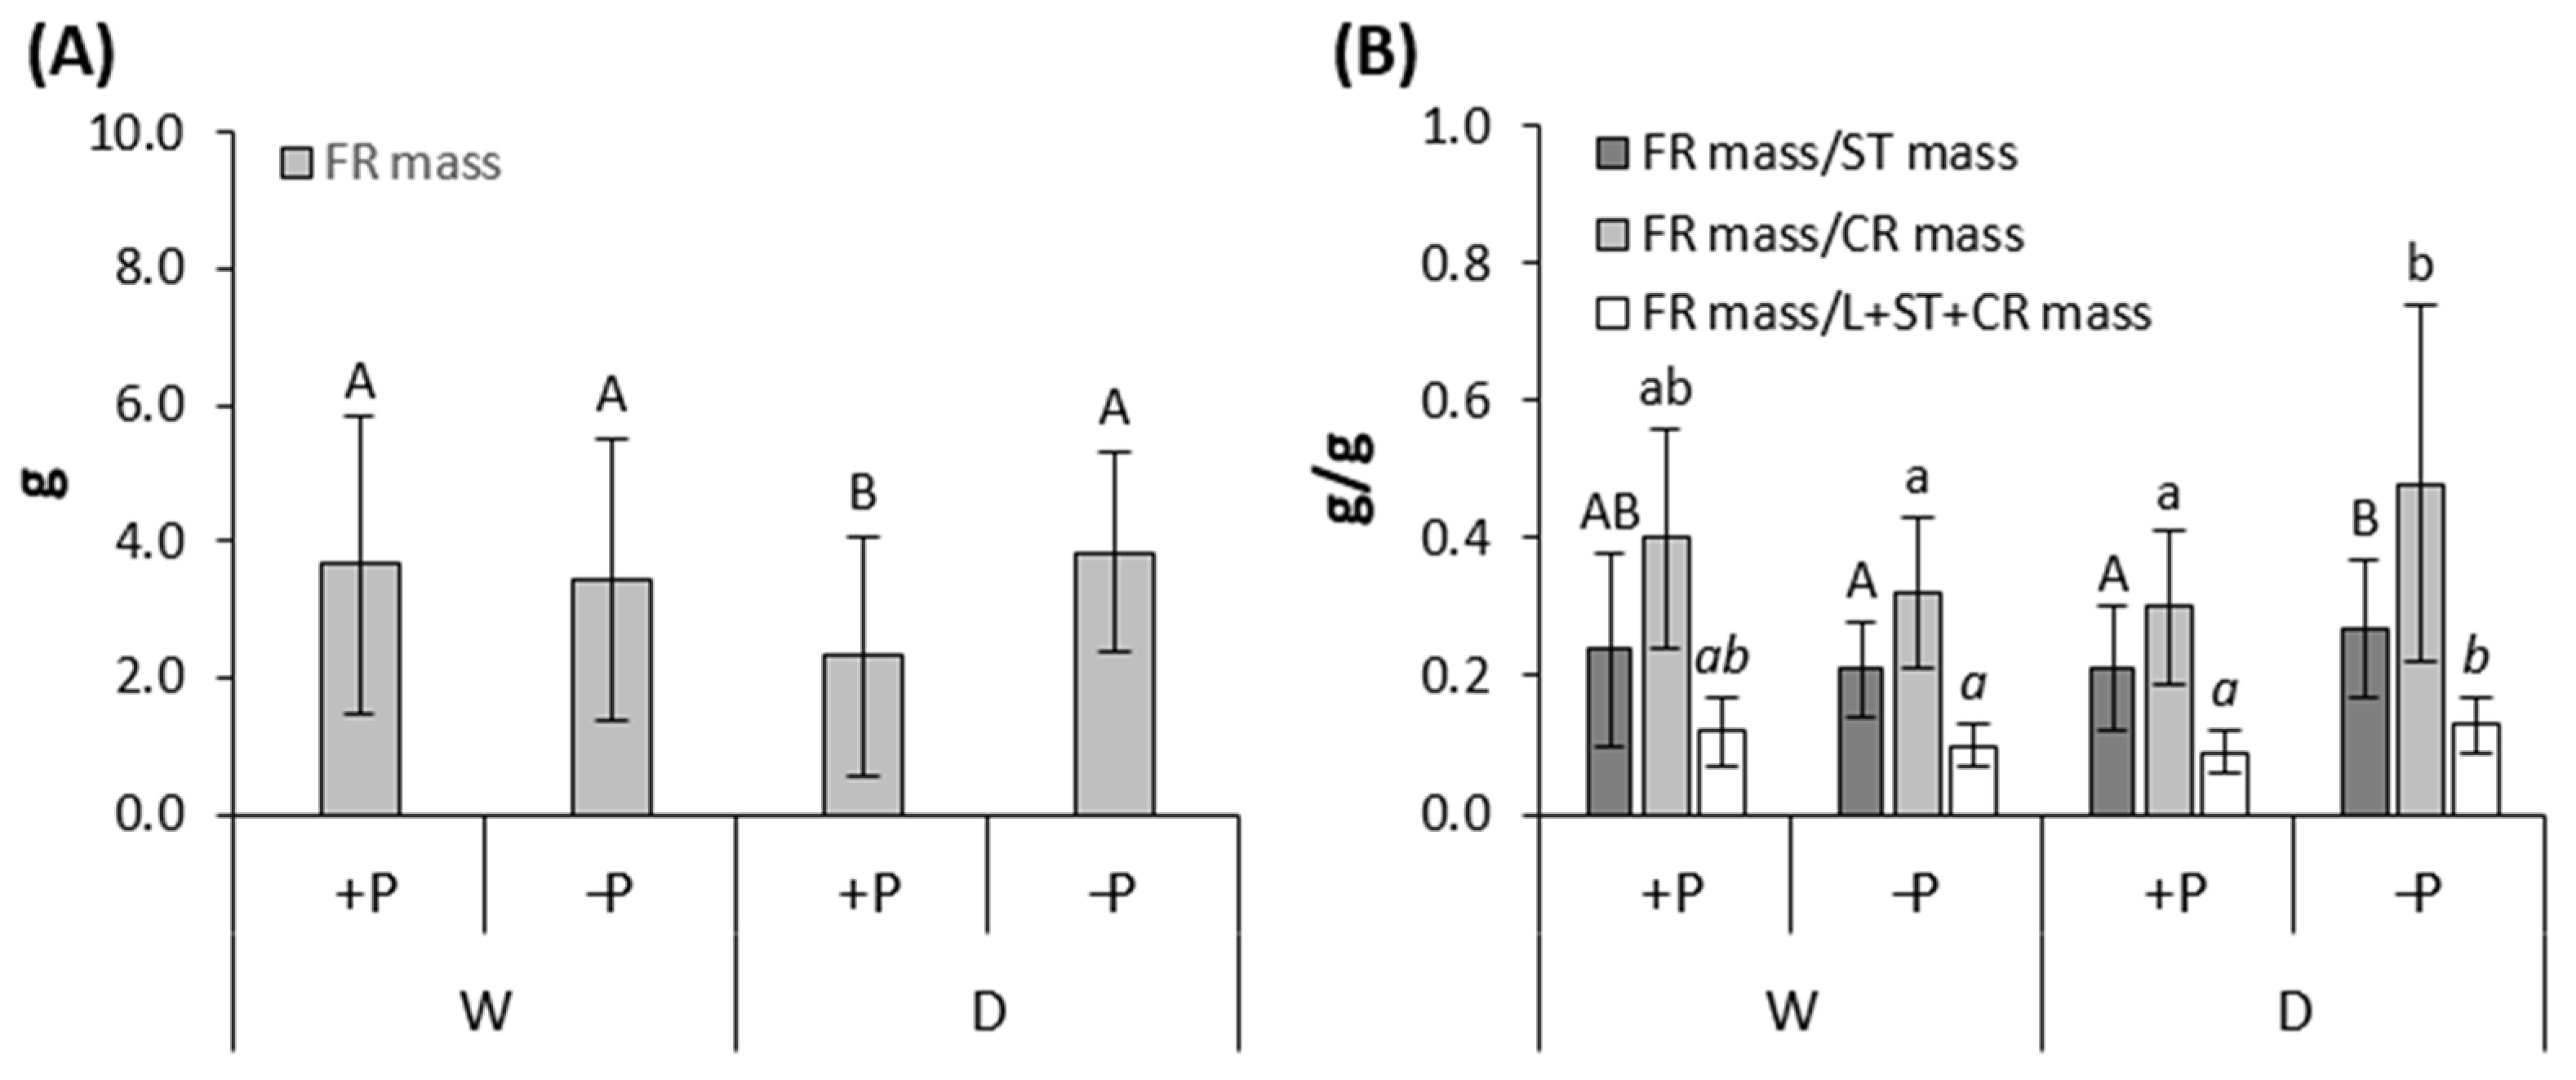
| FRmass (g) | 1.470 | 0.229 | 2.778 | 0.099 | 1.652 | 0.202 | 5.042 | 0.027 | 0.004 | 0.948 | 0.052 | 0.821 | 0.132 | 0.718 | |
| CRmass (g) | 3.261 | 0.074 | 0.459 | 0.500 | 1.341 | 0.250 | 0.089 | 0.766 | 0.232 | 0.631 | 0.367 | 0.546 | 0.016 | 0.901 | |
| BGmass (g) | 2.959 | 0.089 | 0.906 | 0.344 | 1.516 | 0.222 | 0.642 | 0.425 | 0.130 | 0.719 | 0.174 | 0.678 | 0.000 | 0.995 | |
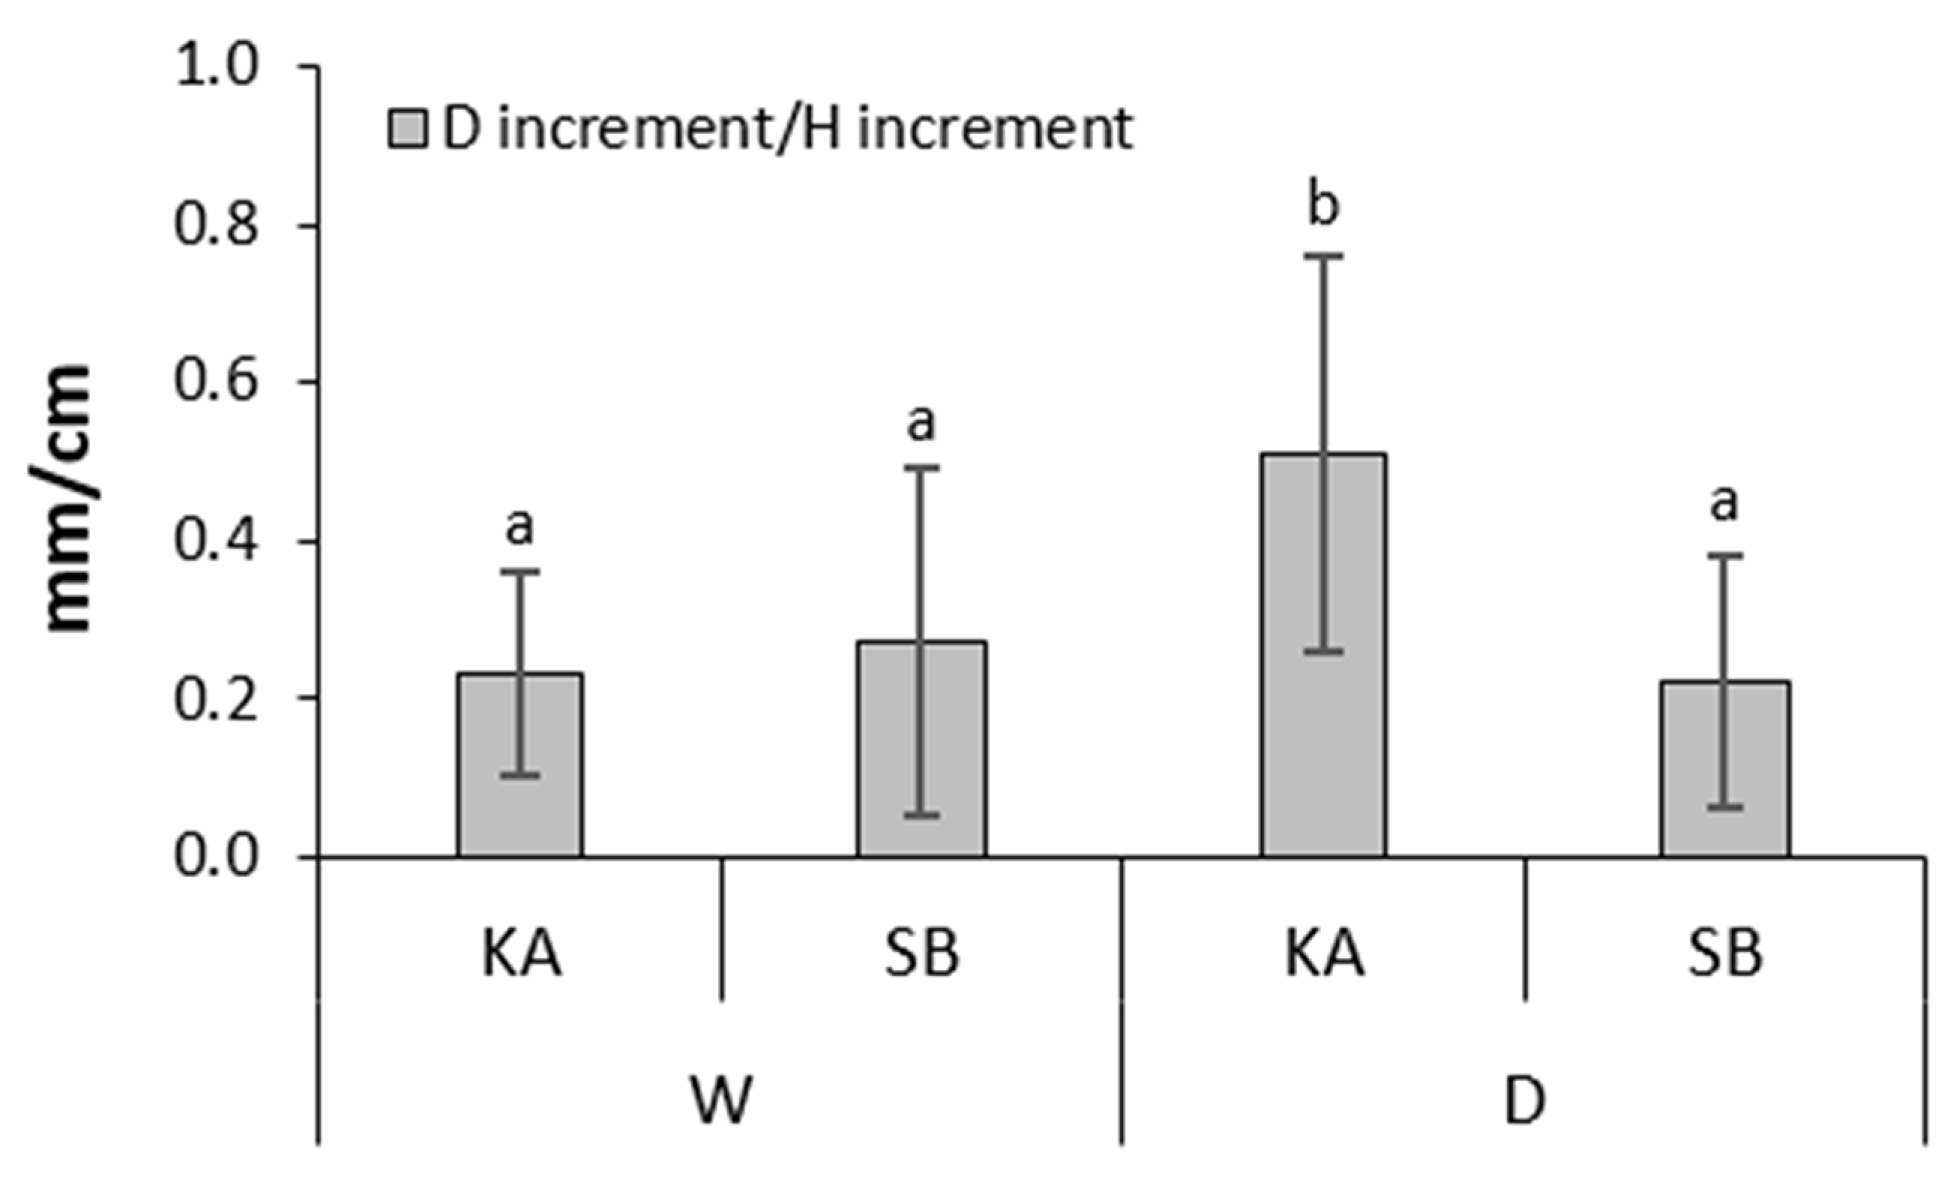
| Allometric growth relationship | D/HMarch | 0.119 | 0.731 | 0.996 | 0.321 | 11.745 | 0.001 | 0.619 | 0.434 | 0.094 | 0.760 | 1.153 | 0.286 | 0.009 | 0.923 |
| Dincrement/Hincrement | 1.633 | 0.205 | 2.053 | 0.155 | 1.762 | 0.188 | 1.060 | 0.306 | 0.173 | 0.678 | 2.322 | 0.131 | 0.029 | 0.865 | |
| D/HSeptember | 1.946 | 0.167 | 2.553 | 0.114 | 9.133 | 0.003 | 2.352 | 0.129 | 0.011 | 0.915 | 1.010 | 0.318 | 0.167 | 0.683 | |
| TRlenght/HSeptember | 0.015 | 0.903 | 8.513 | 0.004 | 0.316 | 0.575 | 1.837 | 0.179 | 0.101 | 0.752 | 0.438 | 0.510 | 0.449 | 0.505 | |
| CRmass/STmass | 0.376 | 0.541 | 0.064 | 0.801 | 0.075 | 0.785 | 3.816 | 0.054 | 0.510 | 0.477 | 0.347 | 0.558 | 0.184 | 0.669 | |
| FRmass/Lmass | 0.011 | 0.917 | 0.154 | 0.696 | 0.164 | 0.687 | 3.231 | 0.076 | 0.047 | 0.829 | 0.048 | 0.827 | 0.251 | 0.617 | |
| FRmass/STmass | 0.139 | 0.710 | 0.533 | 0.467 | 0.018 | 0.894 | 4.278 | 0.042 | 0.215 | 0.644 | 0.123 | 0.727 | 0.518 | 0.474 | |
| FRmass/CRmass | 0.694 | 0.407 | 1.936 | 0.168 | 0.030 | 0.862 | 13.164 | 0.000 | 0.000 | 1.000 | 0.790 | 0.377 | 0.836 | 0.363 | |
| FRmass/L + ST + CRmass | 0.163 | 0.687 | 0.869 | 0.354 | 0.002 | 0.962 | 8.957 | 0.004 | 0.094 | 0.760 | 0.094 | 0.760 | 0.876 | 0.352 | |
| BG/AG | 0.017 | 0.896 | 0.025 | 0.876 | 0.056 | 0.814 | 0.861 | 0.356 | 0.175 | 0.677 | 0.048 | 0.827 | 0.025 | 0.874 | |
| Parameter | Drought (D) | Fertilization (P) | Provenance (Pr) | D × P | D × Pr | P × Pr | D × P × Pr | ||||||||
|---|---|---|---|---|---|---|---|---|---|---|---|---|---|---|---|
| F | p | F | p | F | p | F | p | F | p | F | p | F | p | ||
| Growth | DMarch (mm) | 0.707 | 0.403 | 2.874 | 0.094 | 0.282 | 0.597 | 0.673 | 0.414 | 0.946 | 0.333 | 0.039 | 0.844 | 0.013 | 0.910 |
| Dincrement (mm) | 6.663 | 0.011 | 0.295 | 0.589 | 0.211 | 0.647 | 0.518 | 0.474 | 0.221 | 0.639 | 0.560 | 0.456 | 0.000 | 0.990 | |
| DSeptember (mm) | 6.096 | 0.015 | 2.336 | 0.130 | 0.000 | 0.990 | 1.162 | 0.284 | 0.989 | 0.323 | 0.179 | 0.674 | 0.004 | 0.948 | |
| HMarch (cm) | 1.974 | 0.164 | 0.111 | 0.740 | 0.000 | 0.997 | 0.003 | 0.957 | 1.373 | 0.245 | 0.082 | 0.775 | 0.110 | 0.741 | |
| Hincrement (cm) | 10.623 | 0.002 | 0.094 | 0.759 | 2.407 | 0.124 | 0.109 | 0.742 | 0.000 | 0.982 | 0.003 | 0.959 | 0.198 | 0.657 | |
| HSeptember (cm) | 7.416 | 0.008 | 0.192 | 0.662 | 0.471 | 0.494 | 0.009 | 0.923 | 1.148 | 0.287 | 0.080 | 0.778 | 0.010 | 0.919 | |
| Larea (m2) | 4.404 | 0.039 | 3.847 | 0.053 | 0.565 | 0.454 | 0.193 | 0.661 | 0.603 | 0.439 | 0.010 | 0.919 | 0.771 | 0.382 | |
| TRlength (cm) | 0.209 | 0.649 | 0.468 | 0.496 | 1.591 | 0.210 | 0.133 | 0.716 | 0.147 | 0.702 | 1.950 | 0.166 | 0.096 | 0.757 | |
| Lmass (g) | 2.124 | 0.149 | 3.539 | 0.063 | 0.121 | 0.729 | 0.113 | 0.737 | 1.355 | 0.248 | 0.131 | 0.719 | 0.138 | 0.711 | |
| STmass (g) | 5.686 | 0.019 | 2.405 | 0.125 | 0.416 | 0.521 | 0.060 | 0.807 | 1.480 | 0.227 | 0.098 | 0.755 | 0.189 | 0.665 | |
| AGmass (g) | 4.442 | 0.038 | 2.930 | 0.090 | 0.306 | 0.582 | 0.081 | 0.776 | 1.510 | 0.222 | 0.115 | 0.735 | 0.179 | 0.673 | |
| FRmass (g) | 0.329 | 0.567 | 5.006 | 0.028 | 6.733 | 0.011 | 0.026 | 0.872 | 0.373 | 0.543 | 0.008 | 0.928 | 0.000 | 0.994 | |
| CRmass (g) | 3.618 | 0.060 | 1.949 | 0.166 | 0.002 | 0.965 | 0.010 | 0.919 | 0.023 | 0.879 | 0.798 | 0.374 | 0.038 | 0.846 | |
| BGmass (g) | 3.422 | 0.068 | 2.190 | 0.143 | 0.047 | 0.830 | 0.008 | 0.931 | 0.035 | 0.852 | 0.734 | 0.394 | 0.034 | 0.854 | |
| Allometric growth relationship | D/HMarch | 0.610 | 0.437 | 0.007 | 0.934 | 0.058 | 0.811 | 0.209 | 0.648 | 1.334 | 0.251 | 0.020 | 0.888 | 0.016 | 0.901 |
| Dincrement/Hincrement | 1.998 | 0.161 | 1.187 | 0.279 | 2.425 | 0.123 | 0.159 | 0.691 | 4.069 | 0.047 | 0.074 | 0.787 | 1.175 | 0.281 | |
| D/HSeptember | 0.498 | 0.482 | 0.275 | 0.602 | 0.375 | 0.542 | 0.000 | 0.994 | 0.184 | 0.669 | 0.338 | 0.562 | 0.002 | 0.969 | |
| TRlenght/HSeptember | 11.186 | 0.001 | 1.252 | 0.266 | 0.344 | 0.559 | 0.006 | 0.939 | 0.147 | 0.702 | 2.032 | 0.158 | 0.556 | 0.458 | |
| CRmass/STmass | 4.108 | 0.046 | 0.187 | 0.666 | 1.098 | 0.298 | 0.011 | 0.915 | 0.611 | 0.436 | 0.008 | 0.929 | 1.168 | 0.283 | |
| FRmass/Lmass | 0.026 | 0.873 | 0.269 | 0.605 | 7.636 | 0.007 | 0.704 | 0.404 | 0.025 | 0.875 | 0.506 | 0.479 | 0.068 | 0.795 | |
| FRmass/STmass | 2.046 | 0.156 | 0.110 | 0.741 | 13.779 | 0.000 | 0.108 | 0.743 | 0.138 | 0.711 | 1.560 | 0.215 | 0.704 | 0.404 | |
| FRmass/CRmass | 0.001 | 0.970 | 0.021 | 0.885 | 9.347 | 0.003 | 0.319 | 0.573 | 0.000 | 0.993 | 0.761 | 0.385 | 0.091 | 0.764 | |
| FRmass/L + ST + CRmass | 0.163 | 0.688 | 0.051 | 0.821 | 11.147 | 0.001 | 0.348 | 0.557 | 0.014 | 0.906 | 1.175 | 0.281 | 0.134 | 0.715 | |
| BG/AG | 0.980 | 0.325 | 0.494 | 0.484 | 1.231 | 0.270 | 0.336 | 0.564 | 0.791 | 0.376 | 0.005 | 0.943 | 0.487 | 0.487 | |
References
- Pretzsch, H.; Bielak, K.; Block, J.; Bruchwald, A.; Dieler, J.; Ehrhart, H.-P.; Kohnle, U.; Nagel, J.; Spellmann, H.; Zasada, M.; et al. Productivity of Mixed versus Pure Stands of Oak (Quercus petraea (Matt.) Liebl. and Quercus robur L.) and European Beech (Fagus sylvatica L.) along an Ecological Gradient. Eur. J. For. Res. 2013, 132, 263–280. [Google Scholar] [CrossRef]
- Hajek, P.; Link, R.M.; Nock, C.A.; Bauhus, J.; Gebauer, T.; Gessler, A.; Kovach, K.; Messier, C.; Paquette, A.; Saurer, M.; et al. Mutually Inclusive Mechanisms of Drought-Induced Tree Mortality. Glob. Chang. Biol. 2022, 28, 3365–3378. [Google Scholar] [CrossRef] [PubMed]
- Kasper, J.; Leuschner, C.; Walentowski, H.; Petritan, A.M.; Weigel, R. Winners and Losers of Climate Warming: Declining Growth in Fagus and Tilia vs. Stable Growth in Three Quercus Species in the Natural Beech–Oak Forest Ecotone (Western Romania). For. Ecol. Manag. 2022, 506, 119892. [Google Scholar] [CrossRef]
- Hanel, M.; Rakovec, O.; Markonis, Y.; Máca, P.; Samaniego, L.; Kyselý, J.; Kumar, R. Revisiting the Recent European Droughts from a Long-Term Perspective. Sci. Rep. 2018, 8, 9499. [Google Scholar] [CrossRef] [PubMed]
- Schuldt, B.; Buras, A.; Arend, M.; Vitasse, Y.; Beierkuhnlein, C.; Damm, A.; Gharun, M.; Grams, T.E.E.; Hauck, M.; Hajek, P.; et al. A First Assessment of the Impact of the Extreme 2018 Summer Drought on Central European Forests. Basic Appl. Ecol. 2020, 45, 86–103. [Google Scholar] [CrossRef]
- Meyer, P.; Spînu, A.P.; Mölder, A.; Bauhus, J. Management Alters Drought-induced Mortality Patterns in European Beech (Fagus sylvatica L.) Forests. Plant Biol. J. 2022, 24, 1157–1170. [Google Scholar] [CrossRef] [PubMed]
- Rohner, B.; Kumar, S.; Liechti, K.; Gessler, A.; Ferretti, M. Tree Vitality Indicators Revealed a Rapid Response of Beech Forests to the 2018 Drought. Ecol. Indic. 2021, 120, 106903. [Google Scholar] [CrossRef]
- Wiley, E. Do Carbon Reserves Increase Tree Survival during Stress and Following Disturbance? Curr. For. Rep. 2020, 6, 14–25. [Google Scholar] [CrossRef]
- Schönbeck, L.; Li, M.-H.; Lehmann, M.M.; Rigling, A.; Schaub, M.; Hoch, G.; Kahmen, A.; Gessler, A. Soil Nutrient Availability Alters Tree Carbon Allocation Dynamics during Drought. Tree Physiol. 2021, 41, 697–707. [Google Scholar] [CrossRef]
- Galle, A.; Esper, J.; Feller, U.; Ribas-Carbo, M.; Fonti, P. Responses of Wood Anatomy and Carbon Isotope Composition of Quercus pubescens Saplings Subjected to Two Consecutive Years of Summer Drought. Ann. For. Sci. 2010, 67, 809. [Google Scholar] [CrossRef]
- Wilkinson, S.; Ogee, J.; Domec, J.-C.; Rayment, M.; Wingate, L. Biophysical Modelling of Intra-Ring Variations in Tracheid Features and Wood Density of Pinus pinaster Trees Exposed to Seasonal Droughts. Tree Physiol. 2015, 35, 305–318. [Google Scholar] [CrossRef] [PubMed]
- Redmond, M.D.; Weisberg, P.J.; Cobb, N.S.; Clifford, M.J. Woodland Resilience to Regional Drought: Dominant Controls on Tree Regeneration Following Overstorey Mortality. J. Ecol. 2018, 106, 625–639. [Google Scholar] [CrossRef]
- Petrík, P.; Grote, R.; Gömöry, D.; Kurjak, D.; Petek-Petrik, A.; Lamarque, L.J.; Sliacka Konôpková, A.; Mukarram, M.; Debta, H.; Fleischer, P. The Role of Provenance for the Projected Growth of Juvenile European Beech under Climate Change. Forests 2022, 14, 26. [Google Scholar] [CrossRef]
- Thiel, D.; Kreyling, J.; Backhaus, S.; Beierkuhnlein, C.; Buhk, C.; Egen, K.; Huber, G.; Konnert, M.; Nagy, L.; Jentsch, A. Different Reactions of Central and Marginal Provenances of Fagus sylvatica to Experimental Drought. Eur. J. For. Res. 2014, 133, 247–260. [Google Scholar] [CrossRef]
- Wang, F.; Israel, D.; Ramírez-Valiente, J.-A.; Sánchez-Gómez, D.; Aranda, I.; Aphalo, P.J.; Robson, T.M. Seedlings from Marginal and Core Populations of European Beech (Fagus sylvatica L.) Respond Differently to Imposed Drought and Shade. Trees 2021, 35, 53–67. [Google Scholar] [CrossRef]
- Sever, K.; Vukmirović, A.; Hodak, L.; Bogdan, S.; Katičić Bogdan, I.; Krstonošić, D.; Karažija, T.; Franjić, J.; Škvorc, Ž. Funkcionalna Prilagodba Prirodnog Pomlatka Hrasta Kitnjaka i Obične Bukve na Različite Stanišne Prilike. Šumar. List Online 2022, 146, 293–307. [Google Scholar] [CrossRef]
- Arend, M.; Kuster, T.; Gunthardt-Goerg, M.S.; Dobbertin, M. Provenance-Specific Growth Responses to Drought and Air Warming in Three European Oak Species (Quercus Robur, Q. Petraea and Q. Pubescens). Tree Physiol. 2011, 31, 287–297. [Google Scholar] [CrossRef] [PubMed]
- Günthardt-Goerg, M.S.; Kuster, T.M.; Arend, M.; Vollenweider, P. Foliage Response of Young Central European Oaks to Air Warming, Drought and Soil Type. Plant Biol. 2013, 15, 185–197. [Google Scholar] [CrossRef]
- Kuster, T.M.; Arend, M.; Günthardt-Goerg, M.S.; Schulin, R. Root Growth of Different Oak Provenances in Two Soils under Drought Stress and Air Warming Conditions. Plant Soil. 2013, 369, 61–71. [Google Scholar] [CrossRef]
- Stojnić, S.; Orlović, S.; Miljković, D.; Galić, Z.; Kebert, M.; Von Wuehlisch, G. Provenance Plasticity of European Beech Leaf Traits under Differing Environmental Conditions at Two Serbian Common Garden Sites. Eur. J. For. Res. 2015, 134, 1109–1125. [Google Scholar] [CrossRef]
- Stojnic, S.; Orlovic, S.; Miljkovic, D.; Von, W. Intra- and Interprovenance Variations in Leaf Morphometric Traits in European Beech (Fagus sylvatica L.). Arch. Biol. Sci. 2016, 68, 781–788. [Google Scholar] [CrossRef]
- Stojnić, S.; Suchocka, M.; Benito-Garzón, M.; Torres-Ruiz, J.M.; Cochard, H.; Bolte, A.; Cocozza, C.; Cvjetković, B.; De Luis, M.; Martinez-Vilalta, J.; et al. Variation in Xylem Vulnerability to Embolism in European Beech from Geographically Marginal Populations. Tree Physiol. 2018, 38, 173–185. [Google Scholar] [CrossRef] [PubMed]
- Vollenweider, P.; Menard, T.; Arend, M.; Kuster, T.M.; Günthardt-Goerg, M.S. Structural Changes Associated with Drought Stress Symptoms in Foliage of Central European Oaks. Trees 2016, 30, 883–900. [Google Scholar] [CrossRef]
- Rabarijaona, A.; Ponton, S.; Bert, D.; Ducousso, A.; Richard, B.; Levillain, J.; Brendel, O. Provenance Differences in Water-Use Efficiency Among Sessile Oak Populations Grown in a Mesic Common Garden. Front. For. Glob. Chang. 2022, 5, 914199. [Google Scholar] [CrossRef]
- Montwé, D.; Isaac-Renton, M.; Hamann, A.; Spiecker, H. Drought Tolerance and Growth in Populations of a Wide-ranging Tree Species Indicate Climate Change Risks for the Boreal North. Glob. Chang. Biol. 2016, 22, 806–815. [Google Scholar] [CrossRef] [PubMed]
- Csilléry, K.; Buchmann, N.; Fady, B. Adaptation to Drought Is Coupled with Slow Growth, but Independent from Phenology in Marginal Silver Fir (Abies alba Mill.) Populations. Evol. Appl. 2020, 13, 2357–2376. [Google Scholar] [CrossRef]
- Eilmann, B.; de Vries, S.M.G.; den Ouden, J.; Mohren, G.M.J.; Sauren, P.; Sass-Klaassen, U. Origin Matters! Difference in Drought Tolerance and Productivity of Coastal Douglas-Fir (Pseudotsuga menziesii (Mirb.)) Provenances. For. Ecol. Manag. 2013, 302, 133–143. [Google Scholar] [CrossRef]
- Montwé, D.; Spiecker, H.; Hamann, A. Five Decades of Growth in a Genetic Field Trial of Douglas-Fir Reveal Trade-Offs between Productivity and Drought Tolerance. Tree Genet. Genomes 2015, 11, 29. [Google Scholar] [CrossRef]
- Haase, D.L.; Rose, R.; Trobaugh, J. Field Performance of Three Stock Sizes of Douglas-Fir Container Seedlings Grown with Slow-Release Fertilizer in the Nursery Growing Medium. New For. 2006, 31, 1–24. [Google Scholar] [CrossRef]
- Seletković, I.; Potočić, N.; Jazbec, A.; Ćosić, T.; Jakovljević, T. Utjecaj različitih sjetvenih supstrata i vrsta sporo topivih gnojiva na rast i fiziološke parametre sadnica obične bukve (Fagus sylvatica L.) u rasadniku i nakon presadnje. Šumar. List. 2009, 9–10, 469–481. [Google Scholar]
- Schmal, J.L.; Jacobs, D.F.; O’Reilly, C. Nitrogen Budgeting and Quality of Exponentially Fertilized Quercus robur Seedlings in Ireland. Eur. J. For. Res. 2011, 130, 557–567. [Google Scholar] [CrossRef]
- Uscola, M.; Salifu, K.F.; Oliet, J.A.; Jacobs, D.F. An Exponential Fertilization Dose–Response Model to Promote Restoration of the Mediterranean Oak Quercus ilex. New For. 2015, 46, 795–812. [Google Scholar] [CrossRef]
- Villar-Salvador, P.; Puértolas, J.; Peñuelas, J.L.; Planelles, R. Effect of Nitrogen Fertilization in the Nursery on the Drought and Frost Resistance of Mediterranean Forest Species. Invest. Agrar. Sist. Recur. For. 2005, 14, 408. [Google Scholar] [CrossRef]
- Villar-Salvador, P.; Peñuelas, J.L.; Nicolás-Peragón, J.L.; Benito, L.F.; Domínguez-Lerena, S. Is Nitrogen Fertilization in the Nursery a Suitable Tool for Enhancing the Performance of Mediterranean Oak Plantations? New For. 2013, 44, 733–751. [Google Scholar] [CrossRef]
- Fini, A.; Ferrini, F.; Di Ferdinando, M.; Brunetti, C.; Giordano, C.; Gerini, F.; Tattini, M. Acclimation to Partial Shading or Full Sunlight Determines the Performance of Container-Grown Fraxinus ornus to Subsequent Drought Stress. Urban For. Urban Green. 2014, 13, 63–70. [Google Scholar] [CrossRef]
- Salto, C.S.; Sagadin, M.B.; Luna, C.M.; Oberschelp, G.P.J.; Harrand, L.; Cabello, M.N. Interactions between Mineral Fertilization and Arbuscular Mycorrhizal Fungi Improve Nursery Growth and Drought Tolerance of Prosopis alba Seedlings. Agrofor. Syst. 2020, 94, 103–111. [Google Scholar] [CrossRef]
- Haase, D.L. Morphological and Physiological Evaluations of Seedling Quality. USDA Forest Service Proceedings RMRS P-50; US Department of Agriculture, Forest Service, Rocky Mountain Research Station: Fort Collins, CO, USA, 2007; Volume 50, pp. 3–8.
- Drvodelić, D.; Oršanić, M. Izbor Kvalitetne Šumske Sadnice Poljskog Jasena (Fraxinus angustifolia Vahl) Za Umjetnu Obnovu i Pošumljavanje. Šumar. List Online 2019, 143, 577–585. [Google Scholar] [CrossRef]
- Oliet, J.A.; Salazar, J.M.; Villar, R.; Robredo, E.; Valladares, F. Fall Fertilization of Holm Oak Affects N and P Dynamics, Root Growth Potential, and Post-Planting Phenology and Growth. Ann. For. Sci. 2011, 68, 647–656. [Google Scholar] [CrossRef]
- Zadworny, M.; Mucha, J.; Jagodziński, A.M.; Kościelniak, P.; Łakomy, P.; Modrzejewski, M.; Ufnalski, K.; Żytkowiak, R.; Comas, L.H.; Rodríguez-Calcerrada, J. Seedling Regeneration Techniques Affect Root Systems and the Response of Quercus robur Seedlings to Water Shortages. For. Ecol. Manag. 2021, 479, 118552. [Google Scholar] [CrossRef]
- Catovsky, S.; Kobe, R.K.; Bazzaz, F.A. Nitrogen-Induced Changes in Seedling Regeneration and Dynamics of Mixed Conifer-Broad-Leaved Forests. Ecol. Appl. 2002, 12, 1611–1625. [Google Scholar] [CrossRef]
- Wright, S.J.; Yavitt, J.B.; Wurzburger, N.; Turner, B.L.; Tanner, E.V.J.; Sayer, E.J.; Santiago, L.S.; Kaspari, M.; Hedin, L.O.; Harms, K.E.; et al. Potassium, Phosphorus, or Nitrogen Limit Root Allocation, Tree Growth, or Litter Production in a Lowland Tropical Forest. Ecology 2011, 92, 1616–1625. [Google Scholar] [CrossRef]
- Sun, J.; Yao, F.; Wu, J.; Zhang, P.; Xu, W. Effect of Nitrogen Levels on Photosynthetic Parameters, Morphological and Chemical Characters of Saplings and Trees in a Temperate Forest. J. For. Res. 2018, 29, 1481–1488. [Google Scholar] [CrossRef]
- Brown, K.R.; Van Den Driessche, R. Effects of Nitrogen and Phosphorus Fertilization on the Growth and Nutrition of Hybrid Poplars on Vancouver Island. New For. 2005, 29, 89–104. [Google Scholar] [CrossRef]
- Tariq, A.; Pan, K.; Olatunji, O.A.; Graciano, C.; Li, Z.; Sun, F.; Sun, X.; Song, D.; Chen, W.; Zhang, A.; et al. Phosphorous Application Improves Drought Tolerance of Phoebe zhennan. Front. Plant Sci. 2017, 8, 1561. [Google Scholar] [CrossRef]
- Tariq, A.; Pan, K.; Olatunji, O.A.; Graciano, C.; Li, Z.; Sun, F.; Zhang, L.; Wu, X.; Chen, W.; Song, D.; et al. Phosphorous Fertilization Alleviates Drought Effects on Alnus cremastogyne by Regulating Its Antioxidant and Osmotic Potential. Sci. Rep. 2018, 8, 5644. [Google Scholar] [CrossRef]
- Zavišić, A.; Yang, N.; Marhan, S.; Kandeler, E.; Polle, A. Forest Soil Phosphorus Resources and Fertilization Affect Ectomycorrhizal Community Composition, Beech P Uptake Efficiency, and Photosynthesis. Front. Plant Sci. 2018, 9, 463. [Google Scholar] [CrossRef]
- Ahanger, M.A.; Morad-Talab, N.; Abd-Allah, E.F.; Ahmad, P.; Hajiboland, R. Plant Growth under Drought Stress: Significance of Mineral Nutrients. In Water Stress and Crop Plants; Ahmad, P., Ed.; Wiley: New York, NY, USA, 2016; pp. 649–668. ISBN 978-1-119-05436-8. [Google Scholar]
- Kayoumu, M.; Iqbal, A.; Muhammad, N.; Li, X.; Li, L.; Wang, X.; Gui, H.; Qi, Q.; Ruan, S.; Guo, R.; et al. Phosphorus Availability Affects the Photosynthesis and Antioxidant System of Contrasting Low-P-Tolerant Cotton Genotypes. Antioxidants 2023, 12, 466. [Google Scholar] [CrossRef]
- Sawwan, J.; Shibli, R.A.; Swaidat, I.; Tahat, M. Phosphorus Regulates Osmotic Potential and Growth of African Violet under in Vitro-induced Water Deficit. J. Plant Nutr. 2000, 23, 759–771. [Google Scholar] [CrossRef]
- Singh, V.; Pallaghy, C.K.; Singh, D. Phosphorus Nutrition and Tolerance of Cotton to Water Stress. Field Crops Res. 2006, 96, 191–198. [Google Scholar] [CrossRef]
- Silveira, J.A.G.; Matos, J.C.S.; Cecatto, V.M.; Viegas, R.A.; Oliveira, J.T.A. Nitrate Reductase Activity, Distribution, and Response to Nitrate in Two Contrasting Phaseolus Species Inoculated with Rhizobium Spp. Environ. Exp. Bot. 2001, 46, 37–46. [Google Scholar] [CrossRef]
- Naeem, M.; Khan, M.M.A. Phosphorus Ameliorates Crop Productivity, Photosynthesis, Nitrate Reductase Activity and Nutrient Accumulation in Coffee Senna (Senna occidentalis L.) under Phosphorus-Deficient Soil. J. Plant Interact. 2009, 4, 145–153. [Google Scholar] [CrossRef]
- Oliveira, M.T.; Medeiros, C.D.; Frosi, G.; Santos, M.G. Different Mechanisms Drive the Performance of Native and Invasive Woody Species in Response to Leaf Phosphorus Supply during Periods of Drought Stress and Recovery. Plant Physiol. Biochem. 2014, 82, 66–75. [Google Scholar] [CrossRef] [PubMed]
- Faustino, L.I.; Bulfe, N.M.L.; Pinazo, M.A.; Monteoliva, S.E.; Graciano, C. Dry Weight Partitioning and Hydraulic Traits in Young Pinus taeda Trees Fertilized with Nitrogen and Phosphorus in a Subtropical Area. Tree Physiol. 2013, 33, 241–251. [Google Scholar] [CrossRef] [PubMed]
- Singh, S.K.; Badgujar, G.B.; Reddy, V.R.; Fleisher, D.H.; Timlin, D.J. Effect of Phosphorus Nutrition on Growth and Physiology of Cotton Under Ambient and Elevated Carbon Dioxide. J. Agron. Crop Sci. 2013, 199, 436–448. [Google Scholar] [CrossRef]
- Singh, D.K.; Sale, P.W.G. Phosphorus Supply and the Growth of Frequently Defoliated White Clover (Trifolium repens L.) in Dry Soil. Plant Soil 1998, 205, 155–162. [Google Scholar] [CrossRef]
- Kang, L.; Yue, S.; Li, S. Effects of Phosphorus Application in Different Soil Layers on Root Growth, Yield, and Water-Use Efficiency of Winter Wheat Grown Under Semi-Arid Conditions. J. Integr. Agric. 2014, 13, 2028–2039. [Google Scholar] [CrossRef]
- Shukla, D.; Rinehart, C.A.; Sahi, S.V. Comprehensive Study of Excess Phosphate Response Reveals Ethylene Mediated Signaling That Negatively Regulates Plant Growth and Development. Sci. Rep. 2017, 7, 3074. [Google Scholar] [CrossRef]
- Takagi, D.; Miyagi, A.; Tazoe, Y.; Suganami, M.; Kawai-Yamada, M.; Ueda, A.; Suzuki, Y.; Noguchi, K.; Hirotsu, N.; Makino, A. Phosphorus Toxicity Disrupts Rubisco Activation and Reactive Oxygen Species Defence Systems by Phytic Acid Accumulation in Leaves. Plant Cell Environ. 2020, 43, 2033–2053. [Google Scholar] [CrossRef]
- Lambers, H. Phosphorus Acquisition and Utilization in Plants. Annu. Rev. Plant Biol. 2022, 73, 17–42. [Google Scholar] [CrossRef]
- Yang, N.; Zavišić, A.; Pena, R.; Polle, A. Phenology, Photosynthesis, and Phosphorus in European Beech (Fagus sylvatica L.) in Two Forest Soils with Contrasting P Contents. J. Plant Nutr. Soil. Sci. 2016, 179, 151–158. [Google Scholar] [CrossRef]
- Ognjenović, M. Nutritional Status and Defoliation of Common Beech (Fagus sylvatica L.) in Changed Climate Conditions. Ph.D. Thesis, Faculty of Forestry and Wood Technology, University of Zagreb, Zagreb, Croatia, 7 September 2017. [Google Scholar]
- Prietzel, J.; Krüger, J.; Kaiser, K.; Amelung, W.; Bauke, S.L.; Dippold, M.A.; Kandeler, E.; Klysubun, W.; Lewandowski, H.; Löppmann, S.; et al. Soil Phosphorus Status and P Nutrition Strategies of European Beech Forests on Carbonate Compared to Silicate Parent Material. Biogeochemistry 2022, 158, 39–72. [Google Scholar] [CrossRef] [PubMed]
- Spohn, M.; Stendahl, J. Spatial Patterns of Nitrogen Isotope Ratios in Forest Soils Are Related to Latitude and Soil Phosphorus Concentration. Biogeochemistry 2023, 165, 43–56. [Google Scholar] [CrossRef]
- Zang, U.; Goisser, M.; Meyer, N.; Häberle, K.-H.; Borken, W. Chemical and Morphological Response of Beech Saplings (Fagus sylvatica L.) to an Experimental Soil Drought Gradient. For. Ecol. Manag. 2021, 498, 119569. [Google Scholar] [CrossRef]
- Newnham, R.M.; Carlisle, A. The Nitrogen and Phosphorus Nutrition of Seedlings of Quercus robur L. and Q. petraea (Mattuschka) Liebl. J. Ecol. 1969, 57, 271. [Google Scholar] [CrossRef]
- Peuke, A.D.; Rennenberg, H. Carbon, Nitrogen, Phosphorus, and Sulphur Concentration and Partitioning in Beech Ecotypes (Fagus sylvatica L.): Phosphorus Most Affected by Drought. Trees 2004, 18, 639–648. [Google Scholar] [CrossRef]
- Netzer, F.; Herschbach, C.; Oikawa, A.; Okazaki, Y.; Dubbert, D.; Saito, K.; Rennenberg, H. Seasonal Alterations in Organic Phosphorus Metabolism Drive the Phosphorus Economy of Annual Growth in F. sylvatica Trees on P-Impoverished Soil. Front. Plant Sci. 2018, 9, 723. [Google Scholar] [CrossRef]
- Zavišić, A.; Polle, A. Dynamics of Phosphorus Nutrition, Allocation and Growth of Young Beech (Fagus sylvatica L.) Trees in P-Rich and P-Poor Forest Soil. Tree Physiol. 2018, 38, 37–51. [Google Scholar] [CrossRef]
- Meller, S.; Frossard, E.; Luster, J. Phosphorus Allocation to Leaves of Beech Saplings Reacts to Soil Phosphorus Availability. Front. Plant Sci. 2019, 10, 744. [Google Scholar] [CrossRef]
- Yang, F.; Magh, R.-K.; Ivanković, M.; Lanšćak, M.; Haberstroh, S.; Du, B.; Dannenmann, M.; Rennenberg, H.; Herschbach, C. Foliar P Nutrition of European Beech (Fagus sylvatica L.) Depends on the Season but Remains Unaffected by Co-Cultivation with Silver Fir (Abies alba Mill.). Eur. J. For. Res. 2020, 139, 853–868. [Google Scholar] [CrossRef]
- Bačurin, M.; Bogdan, S.; Katičić Bogdan, I.; Sever, K. Leaf Phenological Responses of Juvenile Beech and Oak Provenances to Elevated Phosphorus. Forests 2023, 14, 834. [Google Scholar] [CrossRef]
- Page, A.L.; Miller, R.H.; Keeney, D.R. Methods of Soil Analysis. Part 2. Chemical and Microbiological Properties. In Soil Science Society of America; American Society of Agronomy: Madison, WI, USA, 1982; Volume 1159. [Google Scholar]
- AOAC. Official Methods of Analysis, 17th ed.; Association of Official Analytical Chemists: Washington, DC, USA, 2000. [Google Scholar]
- Mellert, K.H.; Göttlein, A. Comparison of New Foliar Nutrient Thresholds Derived from van Den Burg’s Literature Compilation with Established Central European References. Eur. J. For. Res. 2012, 131, 1461–1472. [Google Scholar] [CrossRef]
- Epron, D.; Dreyer, E. Long-term Effects of Drought on Photosynthesis of Adult Oak Trees [Quercus petraea (Matt.) Liebl. and Quercus robur L.] in a Natural Stand. New Phytol. 1993, 125, 381–389. [Google Scholar] [CrossRef] [PubMed]
- Arend, M.; Brem, A.; Kuster, T.M.; Günthardt-Goerg, M.S. Seasonal Photosynthetic Responses of European Oaks to Drought and Elevated Daytime Temperature. Plant Biol. 2013, 15, 169–176. [Google Scholar] [CrossRef] [PubMed]
- Arend, M.; Sever, K.; Pflug, E.; Gessler, A.; Schaub, M. Seasonal Photosynthetic Response of European Beech to Severe Summer Drought: Limitation, Recovery and Post-Drought Stimulation. Agric. For. Meteorol. 2016, 220, 83–89. [Google Scholar] [CrossRef]
- Cocozza, C.; De Miguel, M.; Pšidová, E.; Ditmarová, L.; Marino, S.; Maiuro, L.; Alvino, A.; Czajkowski, T.; Bolte, A.; Tognetti, R. Variation in Ecophysiological Traits and Drought Tolerance of Beech (Fagus sylvatica L.) Seedlings from Different Populations. Front. Plant Sci. 2016, 7, 886. [Google Scholar] [CrossRef] [PubMed]
- Pflug, E.E.; Buchmann, N.; Siegwolf, R.T.W.; Schaub, M.; Rigling, A.; Arend, M. Resilient Leaf Physiological Response of European Beech (Fagus sylvatica L.) to Summer Drought and Drought Release. Front. Plant Sci. 2018, 9, 187. [Google Scholar] [CrossRef] [PubMed]
- Walthert, L.; Ganthaler, A.; Mayr, S.; Saurer, M.; Waldner, P.; Walser, M.; Zweifel, R.; Von Arx, G. From the Comfort Zone to Crown Dieback: Sequence of Physiological Stress Thresholds in Mature European Beech Trees across Progressive Drought. Sci. Total Environ. 2021, 753, 141792. [Google Scholar] [CrossRef] [PubMed]
- Van Hees, A. Growth and Morphology of Pedunculate Oak (Quercus robur L.) and Beech (Fagus sylvatica L.) Seedlings in Relation to Shading and Drought. Ann. For. Sci. 1997, 54, 9–18. [Google Scholar] [CrossRef]
- Thomas, F.M.; Gausling, T. Morphological and Physiological Responses of Oak Seedlings (Quercus petraea and Q. robur) to Moderate Drought. Ann. For. Sci. 2000, 57, 325–333. [Google Scholar] [CrossRef]
- Nielsen, C.N.; Jørgensen, F.V. Phenology and Diameter Increment in Seedlings of European Beech (Fagus sylvatica L.) as Affected by Different Soil Water Contents: Variation between and within Provenances. For. Ecol. Manag. 2003, 174, 233–249. [Google Scholar] [CrossRef]
- Rose, L.; Leuschner, C.; Köckemann, B.; Buschmann, H. Are Marginal Beech (Fagus sylvatica L.) Provenances a Source for Drought Tolerant Ecotypes? Eur. J. For. Res. 2009, 128, 335–343. [Google Scholar] [CrossRef]
- Jensen, J.S.; Hansen, J.K. Genetic Variation in Responses to Different Soil Water Treatments in Quercus robur L. Scand. J. For. Res. 2010, 25, 400–411. [Google Scholar] [CrossRef]
- Bruschi, P. Geographical Variation in Morphology of Quercus petraea (Matt.) Liebl. as Related to Drought Stress. Plant Biosyst. Int. J. Deal. All Asp. Plant Biol. 2010, 144, 298–307. [Google Scholar] [CrossRef]
- Brunner, I.; Herzog, C.; Dawes, M.A.; Arend, M.; Sperisen, C. How Tree Roots Respond to Drought. Front. Plant Sci. 2015, 6, 547. [Google Scholar] [CrossRef] [PubMed]
- Le Hir, R.; Leduc, N.; Jeannette, E.; Viemont, J.-D.; Pelleschi-Travier, S. Variations in Sucrose and ABA Concentrations Are Concomitant with Heteroblastic Leaf Shape Changes in a Rhythmically Growing Species (Quercus robur). Tree Physiol. 2006, 26, 229–238. [Google Scholar] [CrossRef]
- Kuster, T.M.; Dobbertin, M.; Günthardt-Goerg, M.S.; Schaub, M.; Arend, M. A Phenological Timetable of Oak Growth under Experimental Drought and Air Warming. PLoS ONE 2014, 9, e89724. [Google Scholar] [CrossRef]
- Sever, K.; Bogdan, S.; Škvorc, Ž.; Sever, M.Z.O.; Franjić, J. Estimation of Leaf Nitrogen Concentrations in Quercus robur L. Using the CCM-200 Portable Chlorophyll Meter for Different Patterns of Vegetative Growth and Acorn Production. New For. 2016, 47, 513–527. [Google Scholar] [CrossRef]
- Lavarenne-Allary, S. Recherches Sur La Croissance Des Bourgeons de Chêne et de Quelques Autres Espèces Ligneuses. Ann. Sci. For. 1965, 22, 7–203. [Google Scholar] [CrossRef]
- Harmer, R.; Baker, C. An Evaluation of Decapitation as a Method for Selecting Clonal Quercus petraea (Matt) Liebl with Different Branching Intensities. Ann. For. Sci. 1995, 52, 89–102. [Google Scholar] [CrossRef]
- Collet, C.; Colin, F.; Bernier, F. Height Growth, Shoot Elongation and Branch Development of Young Quercus petraea Grown under Different Levels of Resource Availability. Ann. For. Sci. 1997, 54, 65–81. [Google Scholar] [CrossRef]
- Mansour, A.; de Faÿ, E. Rhythmic Growth Rings of Wood and Their Relationship with the Foliage in Oak Seedlings Grown in a Favourable Environment. Ann. Bot. 1998, 82, 89–96. [Google Scholar] [CrossRef]
- Mikhalevskaya, O.B. Growth Rhythms at Different Stages of Shoot Morphogenesis in Woody Plants. Russ. J. Dev. Biol. 2008, 39, 65–72. [Google Scholar] [CrossRef]
- Spieß, N.; Oufir, M.; Matušíková, I.; Stierschneider, M.; Kopecky, D.; Homolka, A.; Burg, K.; Fluch, S.; Hausman, J.-F.; Wilhelm, E. Ecophysiological and Transcriptomic Responses of Oak (Quercus robur) to Long-Term Drought Exposure and Rewatering. Environ. Exp. Bot. 2012, 77, 117–126. [Google Scholar] [CrossRef]
- Turcsán, A.; Steppe, K.; Sárközi, E.; Erdélyi, É.; Missoorten, M.; Mees, G.; Mijnsbrugge, K.V. Early Summer Drought Stress During the First Growing Year Stimulates Extra Shoot Growth in Oak Seedlings (Quercus petraea). Front. Plant Sci. 2016, 7, 193. [Google Scholar] [CrossRef]
- Gaytán, Á.; Moreira, X.; Castagneyrol, B.; Van Halder, I.; De Frenne, P.; Meeussen, C.; Timmermans, B.G.H.; Ten Hoopen, J.P.J.G.; Rasmussen, P.U.; Bos, N.; et al. The Co-existence of Multiple Oak Leaf Flushes Contributes to the Large Within-tree Variation in Chemistry, Insect Attack and Pathogen Infection. New Phytol. 2022, 235, 1615–1628. [Google Scholar] [CrossRef]
- Lloret, F.; Casanovas, C.; Peñuelas, J. Seedling Survival of Mediterranean Shrubland Species in Relation to Root:Shoot Ratio, Seed Size and Water and Nitrogen Use. Funct. Ecol. 1999, 13, 210–216. [Google Scholar] [CrossRef]
- Thomas, F.M. Growth and Water Relations of Four Deciduous Tree Species (Fagus sylvatica L., Quercus petraea [Matt.] Liebl., Q. pubescens Willd., Sorbus aria [L.] Cr.) Occurring at Central-European Tree-Line Sites on Shallow Calcareous Soils: Physiological Reactions of Seedlings to Severe Drought. Flora 2000, 195, 104–115. [Google Scholar] [CrossRef]
- Goswami, S.; Fisk, M.C.; Vadeboncoeur, M.A.; Garrison-Johnston, M.; Yanai, R.D.; Fahey, T.J. Phosphorus Limitation of Aboveground Production in Northern Hardwood Forests. Ecology 2018, 99, 438–449. [Google Scholar] [CrossRef]
- Groves, R.; Keraitis, K. Survival and Growth of Seedlings of Three Sclerophyll Species at High Levels of Phosphorus and Nitrogen. Aust. J. Bot. 1976, 24, 681. [Google Scholar] [CrossRef]
- Nichols, D.G.; Beardsell, D.V. The Response of Phosphorus-Sensitive Plants to Slow-Release Fertilizers in Soil-Less Potting Mixtures. Sci. Hortic. 1981, 15, 301–309. [Google Scholar] [CrossRef]
- Hawkins, H.-J.; Hettasch, H.; Mesjasz-Przybylowicz, J.; Przybylowicz, W.; Cramer, M.D. Phosphorus Toxicity in the Proteaceae: A Problem in Post-Agricultural Lands. Sci. Hortic. 2008, 117, 357–365. [Google Scholar] [CrossRef]
- Lambers, H.; Raven, J.; Shaver, G.; Smith, S. Plant Nutrient-Acquisition Strategies Change with Soil Age. Trends Ecol. Evol. 2008, 23, 95–103. [Google Scholar] [CrossRef] [PubMed]
- Wang, Y.; Luo, D.; Xiong, Z.; Wang, Z.; Gao, M. Changes in Rhizosphere Phosphorus Fractions and Phosphate-Mineralizing Microbial Populations in Acid Soil as Influenced by Organic Acid Exudation. Soil Tillage Res. 2023, 225, 105543. [Google Scholar] [CrossRef]
- André, F.; Jonard, M.; Ponette, Q. Biomass and Nutrient Content of Sessile Oak (Quercus petraea (Matt.) Liebl.) and Beech (Fagus sylvatica L.) Stem and Branches in a Mixed Stand in Southern Belgium. Sci. Total Environ. 2010, 408, 2285–2294. [Google Scholar] [CrossRef] [PubMed]
- Hofmann, K.; Heuck, C.; Spohn, M. Phosphorus Resorption by Young Beech Trees and Soil Phosphatase Activity as Dependent on Phosphorus Availability. Oecologia 2016, 181, 369–379. [Google Scholar] [CrossRef] [PubMed]
- Güsewell, S. N:P Ratios in Terrestrial Plants: Variation and Functional Significance. New Phytol. 2004, 164, 243–266. [Google Scholar] [CrossRef]
- Leuschner, C.; Backes, K.; Hertel, D.; Schipka, F.; Schmitt, U.; Terborg, O.; Runge, M. Drought Responses at Leaf, Stem and Fine Root Levels of Competitive Fagus sylvatica L. and Quercus petraea (Matt.) Liebl. Trees in Dry and Wet Years. For. Ecol. Manag. 2001, 149, 33–46. [Google Scholar] [CrossRef]
- Mainiero, R.; Kazda, M. Depth-Related Fine Root Dynamics of Fagus sylvatica during Exceptional Drought. For. Ecol. Manag. 2006, 237, 135–142. [Google Scholar] [CrossRef]
- Meier, I.C.; Leuschner, C. Leaf Size and Leaf Area Index in Fagus sylvatica Forests: Competing Effects of Precipitation, Temperature, and Nitrogen Availability. Ecosystems 2008, 11, 655–669. [Google Scholar] [CrossRef]
- Meier, I.C.; Leuschner, C. Belowground Drought Response of European Beech: Fine Root Biomass and Carbon Partitioning in 14 Mature Stands across a Precipitation Gradient: Belowground Drought Response of Beech. Glob. Chang. Biol. 2008, 14, 2081–2095. [Google Scholar] [CrossRef]
- Zang, U.; Goisser, M.; Häberle, K.; Matyssek, R.; Matzner, E.; Borken, W. Effects of Drought Stress on Photosynthesis, Rhizosphere Respiration, and Fine-root Characteristics of Beech Saplings: A Rhizotron Field Study. Z. Pflanzenernähr. Bodenk. 2014, 177, 168–177. [Google Scholar] [CrossRef]
- Zwetsloot, M.J.; Bauerle, T.L. Repetitive Seasonal Drought Causes Substantial Species-specific Shifts in Fine-root Longevity and Spatio-temporal Production Patterns in Mature Temperate Forest Trees. New Phytol. 2021, 231, 974–986. [Google Scholar] [CrossRef] [PubMed]
- Calvaruso, C.; Kirchen, G.; Saint-André, L.; Redon, P.-O.; Turpault, M.-P. Relationship between Soil Nutritive Resources and the Growth and Mineral Nutrition of a Beech (Fagus sylvatica) Stand along a Soil Sequence. CATENA 2017, 155, 156–169. [Google Scholar] [CrossRef]
- Weemstra, M.; Sterck, F.J.; Visser, E.J.W.; Kuyper, T.W.; Goudzwaard, L.; Mommer, L. Fine-Root Trait Plasticity of Beech (Fagus sylvatica) and Spruce (Picea abies) Forests on Two Contrasting Soils. Plant Soil 2017, 415, 175–188. [Google Scholar] [CrossRef]
- Likulunga, L.E.; Clausing, S.; Krüger, J.; Lang, F.; Polle, A. Fine Root Biomass of European Beech Trees in Different Soil Layers Show Different Responses to Season, Climate, and Soil Nutrients. Front. For. Glob. Chang. 2022, 5, 955327. [Google Scholar] [CrossRef]
- Moore, J.R.; Tombleson, J.D.; Turner, J.A.; Van Der Colff, M. Wind Effects on Juvenile Trees: A Review with Special Reference to Toppling of Radiata Pine Growing in New Zealand. Forestry 2008, 81, 377–387. [Google Scholar] [CrossRef]
- Bécel, C.; Vercambre, G.; Pagès, L. Soil Penetration Resistance, a Suitable Soil Property to Account for Variations in Root Elongation and Branching. Plant Soil 2012, 353, 169–180. [Google Scholar] [CrossRef]
- Miryeganeh, M. Plants’ Epigenetic Mechanisms and Abiotic Stress. Genes 2021, 12, 1106. [Google Scholar] [CrossRef]


| Species | Parameter | Drought (D) | Fertilization (P) | Provenance (Pr) | D × P | D × Pr | P × Pr | D × P × Pr |
|---|---|---|---|---|---|---|---|---|
| Common beech | ΨMay | * | n.s. | n.s. | n.s. | n.s. | n.s. | n.s. |
| ΨAugust | *** | n.s. | n.s. | n.s. | n.s. | n.s. | n.s. | |
| PLeaves | n.s. | *** | n.s. | n.s. | n.s. | n.s. | n.s. | |
| Sessile oak | ΨMay | * | n.s. | n.s. | n.s. | n.s. | n.s. | n.s. |
| ΨAugust | *** | n.s. | n.s. | n.s. | n.s. | n.s. | n.s. | |
| PLeaves | n.s. | *** | n.s. | n.s. | n.s. | n.s. | n.s. |
| Parameters | Common Beech | Sessile Oak | |||||
|---|---|---|---|---|---|---|---|
| D Effect | W | D | D Effect | W | D | ||
| Growth | DMarch (mm) | n.s. | 7.78 ± 2.26 | 7.70 ± 1.91 (−1%) | n.s. | 7.73 ± 2.37 | 7.34 ± 2.04 (−5%) |
| Dincrement (mm) | n.s. | 1.97 ± 1.31 | 1.78 ± 1.13 (−10%) | * | 5.03 ± 2.35 | 3.72 ± 2.49 (−26%) | |
| DSeptember (mm) | n.s. | 9.74 ± 2.92 | 9.48 ± 2.51 (−3%) | * | 12.75 ± 3.52 | 11.06 ± 3.12 (−13%) | |
| HMarch (cm) | n.s. | 46.04 ± 14.88 | 46.20 ± 15.54 (0%) | n.s. | 48.83 ± 22.77 | 42.84 ± 17.71 (−12%) | |
| Hincrement (cm) | ** | 14.47 ± 8.24 | 9.74 ± 5.66 (−33%) | ** | 24.24 ± 10.42 | 17.42 ± 9.73 (−28%) | |
| HSeptember (cm) | n.s. | 60.60 ± 16.67 | 55.94 ± 15.12 (−8%) | ** | 73.07 ± 25.00 | 60.26 ± 19.78 (−18%) | |
| Larea (m2) | n.s. | 0.25 ± 0.19 | 0.21 ± 0.18 (−16%) | * | 0.35 ± 0.23 | 0.26 ± 0.16 (−26%) | |
| TRlength (cm) | n.s. | 41.14 ± 12.63 | 38.29 ± 12.34 (−7%) | n.s. | 63.15 ± 17.52 | 61.59 ± 15.38 (−2%) | |
| Lmass (g) | n.s. | 7.44 ± 5.55 | 6.49 ± 4.80 (−13%) | n.s. | 14.91 ± 10.15 | 12.30 ± 7.12 (−18%) | |
| STmass (g) | n.s. | 19.33 ± 17.64 | 14.92 ± 10.36 (−23%) | * | 24.90 ± 19.24 | 17.16 ± 11.31 (−31%) | |
| AGmass (g) | n.s. | 26.77 ± 22.74 | 21.41 ± 14.83 (−20%) | * | 39.82 ± 28.70 | 29.46 ± 18.01 (−26%) | |
| FRmass (g) | n.s. | 3.55 ± 2.11 | 3.08 ± 1.77 (−13%) | n.s. | 3.04 ± 1.91 | 2.82 ± 1.85 (−7%) | |
| CRmass (g) | n.s. | 10.60 ± 6.86 | 8.42 ± 4.49 (−21%) | n.s. | 40.28 ± 29.92 | 30.26 ± 19.77 (−25%) | |
| BGmass (g) | n.s. | 14.15 ± 8.74 | 11.50 ± 5.87 (−19%) | n.s. | 43.32 ± 31.30 | 33.09 ± 21.02 (−24%) | |
| Allometric growth relationship | D/HMarch | n.s. | 0.17 ± 0.04 | 0.18 ± 0.04 (+6%) | n.s. | 0.18 ± 0.07 | 0.19 ± 0.07 (+6%) |
| Dincrement/Hincrement | n.s. | 0.20 ± 0.29 | 0.28 ± 0.33 (+40%) | n.s. | 0.25 ± 0.19 | 0.37 ± 0.53 (+48%) | |
| D/HSeptember | n.s. | 0.16 ± 0.04 | 0.17 ± 0.04 (+6%) | n.s. | 0.19 ± 0.06 | 0.20 ± 0.08 (+5%) | |
| TRlenght/HSeptember | n.s. | 0.70 ± 0.20 | 0.70 ± 0.22 (0%) | ** | 0.90 ± 0.21 | 1.10 ± 0.34 (+22%) | |
| CRmass/STmass | n.s. | 0.65 ± 0.23 | 0.69 ± 0.36 (+6%) | * | 1.64 ± 0.52 | 1.88 ± 0.60 (+15%) | |
| FRmass/Lmass | n.s. | 0.55 ± 0.25 | 0.54 ± 0.22 (−2%) | n.s. | 0.26 ± 0.18 | 0.26 ± 0.19 (0%) | |
| FRmass/STmass | n.s. | 0.23 ± 0.11 | 0.24 ± 0.10 (+4%) | n.s. | 0.16 ± 0.11 | 0.19 ± 0.12 (+19%) | |
| FRmass/CRmass | n.s. | 0.36 ± 0.14 | 0.39 ± 0.21 (+8%) | n.s. | 0.11 ± 0.08 | 0.11 ± 0.06 (0%) | |
| FRmass/L + ST + CRmass | n.s. | 0.11 ± 0.04 | 0.11 ± 0.04 (0%) | n.s. | 0.05 ± 0.03 | 0.05 ± 0.03 (0%) | |
| BG/AG | n.s. | 0.61 ± 0.20 | 0.62 ± 0.20 (+2%) | n.s. | 1.09 ± 0.34 | 1.17 ± 0.37 (+7%) | |
| Parameters | Common Beech | Sessile Oak | |||||
|---|---|---|---|---|---|---|---|
| P Effect | +P | −P | P Effect | +P | −P | ||
| Growth | DMarch (mm) | n.s. | 7.59 ± 2.18 (−4%) | 7.89 ± 1.99 | n.s. | 7.15 ± 2.16 (−10%) | 7.92 ± 2.21 |
| Dincrement (mm) | n.s. | 1.68 ± 1.20 (−18%) | 2.06 ± 1.22 | n.s. | 4.23 ± 2.67 (−6%) | 4.51 ± 2.33 | |
| DSeptember (mm) | n.s. | 9.27 ± 2.87 (−7%) | 9.96 ± 2.53 | n.s. | 11.38 ± 3.18 (−8%) | 12.43 ± 3.59 | |
| HMarch (cm) | n.s. | 45.65 ± 13.85 (−2%) | 46.69 ± 16.45 | n.s. | 45.13 ± 21.28 (−3%) | 46.54 ± 19.92 | |
| Hincrement (cm) | n.s. | 12.23 ± 6.65 (+2%) | 11.97 ± 8.19 | n.s. | 20.51 ± 9.93 (−3%) | 21.15 ± 11.32 | |
| HSeptember (cm) | n.s. | 57.89 ± 15.55 (−1%) | 58.66 ± 16.60 | n.s. | 65.64 ± 23.08 (−3%) | 67.70 ± 23.78 | |
| Larea (m2) | n.s. | 0.21 ± 0.19 (−16%) | 0.25 ± 0.18 | n.s. | 0.27 ± 0.19 (−23%) | 0.35 ± 0.21 | |
| TRlength (cm) | * | 36.72 ± 14.16 (−14%) | 42.71 ± 9.85 | n.s. | 63.53 ± 16.43 (+4%) | 61.21 ± 16.49 | |
| Lmass (g) | n.s. | 6.53 ± 5.96 (−12%) | 7.40 ± 4.30 | n.s. | 11.92 ± 7.05 (−22%) | 15.29 ± 10.08 | |
| STmass (g) | n.s. | 16.75 ± 16.14 (−4%) | 17.49 ± 12.95 | n.s. | 18.52 ± 12.88 (−21%) | 23.55 ± 18.71 | |
| AGmass (g) | n.s. | 23.29 ± 21.63 (−6%) | 24.89 ± 16.81 | n.s. | 30.43 ± 19.52 (−22%) | 38.84 ± 28.02 | |
| FRmass (g) | n.s. | 2.99 ± 2.08 (−18%) | 3.64 ± 1.77 | * | 2.51 ± 1.47 (−25%) | 3.35 ± 2.14 | |
| CRmass (g) | n.s. | 9.10 ± 6.80 (−8%) | 9.92 ± 4.80 | n.s. | 31.60 ± 21.51 (−19%) | 38.95 ± 29.10 | |
| BGmass (g) | n.s. | 12.09 ± 8.62 (−11%) | 13.56 ± 6.24 | n.s. | 34.11 ± 22.28 (−19%) | 42.29 ± 30.73 | |
| Allometric growth relationship | D/HMarch | n.s. | 0.17 ± 0.03 (−6%) | 0.18 ± 0.05 | n.s. | 0.19 ± 0.08 (0%) | 0.19 ± 0.05 |
| Dincrement/Hincrement | n.s. | 0.20 ± 0.22 (−31%) | 0.29 ± 0.38 | n.s. | 0.27 ± 0.28 (−23%) | 0.35 ± 0.50 | |
| D/HSeptember | n.s. | 0.16 ± 0.04 (−6%) | 0.17 ± 0.04 | n.s. | 0.19 ± 0.08 (−5%) | 0.20 ± 0.07 | |
| TRlenght/HSeptember | ** | 0.64 ± 0.20 (−16%) | 0.76 ± 0.20 | n.s. | 1.03 ± 0.32 (+6%) | 0.97 ± 0.28 | |
| CRmass/STmass | n.s. | 0.68 ± 0.35 (+3%) | 0.66 ± 0.25 | n.s. | 1.79 ± 0.57 (+3%) | 1.74 ± 0.57 | |
| FRmass/Lmass | n.s. | 0.56 ± 0.27 (+4%) | 0.54 ± 0.19 | n.s. | 0.27 ± 0.22 (+8%) | 0.25 ± 0.15 | |
| FRmass/STmass | n.s. | 0.23 ± 0.12 (−4%) | 0.24 ± 0.09 | n.s. | 0.18 ± 0.13 (0%) | 0.18 ± 0.09 | |
| FRmass/CRmass | n.s. | 0.35 ± 0.14 (−13%) | 0.40 ± 0.21 | n.s. | 0.11 ± 0.08 (0%) | 0.11 ± 0.06 | |
| FRmass/L + ST + CRmass | n.s. | 0.11 ± 0.04 (0%) | 0.11 ± 0.04 | n.s. | 0.05 ± 0.04 (0%) | 0.05 ± 0.03 | |
| BG/AG | n.s. | 0.61 ± 0.20 (−2%) | 0.62 ± 0.20 | n.s. | 1.16 ± 0.36 (+5%) | 1.10 ± 0.35 | |
| Parameters | Common Beech | Sessile Oak | |||||
|---|---|---|---|---|---|---|---|
| Pr Effect | KA | SB | Pr Effect | KA | SB | ||
| Growth | DMarch (mm) | n.s. | 7.96 ± 2.11 | 7.52 ± 2.05 (−6%) | n.s. | 7.65 ± 2.39 | 7.41 ± 2.03 (−3%) |
| Dincrement (mm) | * | 2.14 ± 1.21 | 1.60 ± 1.17 (−25%) | n.s. | 4.26 ± 2.35 | 4.49 ± 2.66 (+5%) | |
| DSeptember (mm) | n.s. | 10.10 ± 2.57 | 9.12 ± 2.79 (−10%) | n.s. | 11.91 ± 3.19 | 11.90 ± 3.66 (0%) | |
| HMarch (cm) | n.s. | 44.55 ± 16.70 | 47.79 ± 13.37 (+7%) | n.s. | 45.84 ± 19.40 | 45.83 ± 21.78 (0%) | |
| Hincrement (cm) | n.s. | 12.88 ± 7.71 | 11.33 ± 7.12 (−12%) | n.s. | 19.21 ± 10.35 | 22.46 ± 10.70 (+17%) | |
| HSeptember (cm) | n.s. | 57.43 ± 15.49 | 59.11 ± 16.62 (+3%) | n.s. | 65.05 ± 22.41 | 68.28 ± 24.34 (+5%) | |
| Larea (m2) | n.s. | 0.24 ± 0.17 | 0.22 ± 0.20 (−8%) | n.s. | 0.29 ± 0.18 | 0.32 ± 0.22 (+10%) | |
| TRlength (cm) | n.s. | 39.79 ± 12.24 | 39.64 ± 12.89 (0%) | n.s. | 60.23 ± 18.07 | 64.51 ± 14.44 (+7%) | |
| Lmass (g) | n.s. | 7.30 ± 4.72 | 6.64 ± 5.64 (−9%) | n.s. | 13.29 ± 7.57 | 13.92 ± 9.98 (+5%) | |
| STmass (g) | n.s. | 18.06 ± 14.82 | 16.18 ± 14.39 (−10%) | n.s. | 19.99 ± 13.90 | 22.08 ± 18.26 (+10%) | |
| AGmass (g) | n.s. | 25.36 ± 19.12 | 22.81 ± 19.57 (−10%) | n.s. | 33.28 ± 20.92 | 36.00 ± 27.59 (+8%) | |
| FRmass (g) | n.s. | 3.56 ± 1.79 | 3.06 ± 2.08 (−14%) | * | 3.41 ± 2.04 | 2.45 ± 1.56 (−28%) | |
| CRmass (g) | n.s. | 10.21 ± 6.15 | 8.81 ± 5.56 (−14%) | n.s. | 35.39 ± 25.51 | 35.16 ± 26.21 (−1%) | |
| BGmass (g) | n.s. | 13.77 ± 7.73 | 11.88 ± 7.26 (−14%) | n.s. | 38.80 ± 26.98 | 37.60 ± 27.32 (−3%) | |
| Allometric growth relationship | D/HMarch | * | 0.19 ± 0.04 | 0.16 ± 0.04 (−16%) | n.s. | 0.19 ± 0.07 | 0.18 ± 0.07 (−5%) |
| Dincrement/Hincrement | n.s. | 0.29 ± 0.38 | 0.20 ± 0.21 (−31%) | n.s. | 0.37 ± 0.53 | 0.25 ± 0.21 (−32%) | |
| D/HSeptember | * | 0.18 ± 0.04 | 0.16 ± 0.04 (−11%) | n.s. | 0.20 ± 0.07 | 0.19 ± 0.07 (−5%) | |
| TRlenght/HSeptember | n.s. | 0.71 ± 0.22 | 0.69 ± 0.19 (−3%) | n.s. | 0.98 ± 0.33 | 1.01 ± 0.26 (+3%) | |
| CRmass/STmass | n.s. | 0.68 ± 0.34 | 0.66 ± 0.27 (−3%) | n.s. | 1.82 ± 0.61 | 1.70 ± 0.52 (−7%) | |
| FRmass/Lmass | n.s. | 0.54 ± 0.19 | 0.56 ± 0.27 (+4%) | ** | 0.31 ± 0.21 | 0.21 ± 0.13 (−32%) | |
| FRmass/STmass | n.s. | 0.23 ± 0.09 | 0.23 ± 0.11 (0%) | *** | 0.22 ± 0.13 | 0.14 ± 0.08 (−36%) | |
| FRmass/CRmass | n.s. | 0.37 ± 0.14 | 0.38 ± 0.21 (+3%) | ** | 0.13 ± 0.08 | 0.09 ± 0.05 (−31%) | |
| FRmass/L + ST + CRmass | n.s. | 0.11 ± 0.04 | 0.11 ± 0.05 (0%) | ** | 0.06 ± 0.04 | 0.04 ± 0.02 (−33%) | |
| BG/AG | n.s. | 0.61 ± 0.17 | 0.62 ± 0.22 (+2%) | n.s. | 1.17 ± 0.38 | 1.09 ± 0.33 (−7%) | |
Disclaimer/Publisher’s Note: The statements, opinions and data contained in all publications are solely those of the individual author(s) and contributor(s) and not of MDPI and/or the editor(s). MDPI and/or the editor(s) disclaim responsibility for any injury to people or property resulting from any ideas, methods, instructions or products referred to in the content. |
© 2024 by the authors. Licensee MDPI, Basel, Switzerland. This article is an open access article distributed under the terms and conditions of the Creative Commons Attribution (CC BY) license (https://creativecommons.org/licenses/by/4.0/).
Share and Cite
Vukmirović, A.; Škvorc, Ž.; Bogdan, S.; Krstonošić, D.; Katičić Bogdan, I.; Karažija, T.; Bačurin, M.; Brener, M.; Sever, K. Effects of Drought, Phosphorus Fertilization and Provenance on the Growth of Common Beech and Sessile Oak. Forests 2024, 15, 219. https://doi.org/10.3390/f15010219
Vukmirović A, Škvorc Ž, Bogdan S, Krstonošić D, Katičić Bogdan I, Karažija T, Bačurin M, Brener M, Sever K. Effects of Drought, Phosphorus Fertilization and Provenance on the Growth of Common Beech and Sessile Oak. Forests. 2024; 15(1):219. https://doi.org/10.3390/f15010219
Chicago/Turabian StyleVukmirović, Antonia, Željko Škvorc, Saša Bogdan, Daniel Krstonošić, Ida Katičić Bogdan, Tomislav Karažija, Marko Bačurin, Magdalena Brener, and Krunoslav Sever. 2024. "Effects of Drought, Phosphorus Fertilization and Provenance on the Growth of Common Beech and Sessile Oak" Forests 15, no. 1: 219. https://doi.org/10.3390/f15010219