Article

Adaptation Strategies of Populus euphratica to Arid Environments Based on Leaf Trait Network Analysis in the Mainstream of the Tarim River

1
Xinjiang Production & Construction Corps Key Laboratory of Protection and Utilization of Biological Resources in Tarim Basin, College of Life Science and Technology, Tarim University, Alar 843300, China
2
School of Grassland Science, Beijing Forestry University, Beijing 100083, China
*
Author to whom correspondence should be addressed.
Forests 2024, 15(3), 437; https://doi.org/10.3390/f15030437
Submission received: 25 January 2024 / Revised: 16 February 2024 / Accepted: 23 February 2024 / Published: 25 February 2024
(This article belongs to the Special Issue Abiotic Stress in Tree Species)

Abstract

:
Populus euphratica, a key tree species in the ecologically fragile area of the Tarim River Basin, plays a crucial role in maintaining the ecological balance of the desert. In order to explore the response of Populus euphratica leaves to river water resources and drought climate change, the complex topological relationship between the leaf traits of Populus euphratica was comprehensively analyzed by establishing the leaf trait network of the mainstream of the Tarim River, and the central traits that play a key role in regulating the phenotype of Populus euphratica were identified. The adaptation strategies of Populus euphratica to different environments were clarified from the perspective of the overall leaf trait network. The results show that, with a decrease in river water flow, the internal coordination of the leaf traits weakened, forming a looser network structure. In the hyper-arid region, the leaf traits were more independent, the network was simpler, and it was easier for the leaf to coordinate the aggregation of specific traits. Leaf thickness and the related photosynthetic traits are the key to adaptive strategies, particularly the cuticle thickness and midvein vascular bundle area. Leaf anatomical traits are more critical than stoichiometry traits in drought resistance. Leaves tend to give priority to the relationship between structural traits. Populus euphratica leaves adjust their trait modularization through a trait substitution strategy to manage different drought conditions.

1. Introduction

Plant functional traits play a bridging role in connecting plants to their environment, not only by adapting to external environmental changes, but also by having a significant impact on ecosystem function [1]. These traits are defined as key factors that affect plant growth, reproduction, and survival [2], and they represent the adaptability of plants to the environment [3]. In addition, the adaptability of plants to the environment leads to diversity in the coordination of different organs in terms of nutrient utilization and acquisition [4]. Leaves are the main photosynthetic organs of all land plants and play a key role in the functioning of terrestrial ecosystems. There is a close coordination between leaf traits and ecosystem function, and their functional characteristics drive the dynamics of all terrestrial ecosystems [5]. Plants usually adapt to the environment by changing the functional traits of their leaves and by supporting the survival and growth of plants under different stresses and disturbances [6]. Previous research has focused on the coordination between plant traits, but the complex interrelationships between multiple traits have not been fully appreciated [7]. In fact, there is a close connection between plant traits, and the interdependence of the multiple traits reveals the coordination or trade-offs between the traits [8]. Furthermore, the interdependence of these traits reveals the adaptation strategies of plants. For example, the relationship between key leaf functional traits (e.g., leaf mass, area, etc.) can be correlated based on predictable proportional relationships [9]. Leaf functional traits affect the morphological, physiological, and stoichiometric characteristics of plant growth, distribution, reproduction, and survival [10,11,12]. Although early studies explored the interdependence of leaf traits through various methods [13,14], these studies were mostly limited to the relationships between single traits or pairs of traits and failed to systematically quantify the complex relationships between plant traits. Therefore, there are limitations in the evaluation of the interrelationships between multiple leaf traits. Recently, researchers have proposed a plant trait network (PTN) theory and a method for clarifying the complex relationships between multiple traits [15]. This method quantifies the complex relationships between multiple leaf traits by constructing a multidimensional complex network of leaf traits and trait relationships; it thereby explains the connections between different leaf traits and calculates the overall topological structure of the network to identify key traits [16]. In recent years, research has explored the complex relationships between traits, network topology, and hub traits through comprehensive, multidimensional, and visual analyses of trait networks [17,18]; it has evaluated the key traits of plants in different environments and their relationships with the environment and has provided a new approach to revealing the mechanisms of plant adaptation and the response to environmental and resource changes.
Xinjiang has a complex and diverse natural environment with strong ecological sensitivity, higher evapotranspiration than rainfall, water shortages, and severe soil erosion [19], which lead to sparse vegetation and environmental problems such as dust storms. These factors make it a typical ecologically fragile area and a sensitive area for ecosystems responding to global climate change. Desert vegetation is an important component of arid and semi-arid ecosystems, and it plays an irreplaceable role in windbreaking and sand fixation, water and soil conservation, and water conservation. It maintains the balance of ecosystems and protects biodiversity [20]. As an important stress-tolerant germplasm resource along the Tarim River, Populus euphratica is a key species for maintaining the balance of desert riparian forest ecosystems [21]. It plays an active role in regulating climate, preventing sandstorms and desert expansion, protecting oases, and maintaining ecological security and socioeconomic development [22]. It is an irreplaceable natural barrier and plays a protective role in maintaining ecological security and socioeconomic development.
The leaf morphology of Populus euphratica exhibits variability, presenting a dynamic sequence of striped, lanceolate, ovate, and broad-ovate leaves as the plant matures and ages [23]. Heteromorphic leaves are the most prominent biological characteristic of Populus euphratica, and they also reflect its adaptability to the desert environment. It can achieve various physiological functions through the regulation of the relationship between different leaf traits and can complete its growth and development and adapt to the environment. The existing research on the relationship between leaf traits and the environment in Populus euphratica is limited to the relationship between a single trait and the environment or to that between two traits [13,24], and there is a lack of research on the complex relationship network between multiple traits of Populus euphratica leaves and their relationship with the environment.
In order to explore how Populus euphratica adapts to the environment through the integration of multiple leaf traits and the regulation of trait relationships against the background of global climate change, to reveal its adaptation strategies in the arid environment, and to better protect the wild Populus euphratica forest in the Tarim River, this article takes Populus euphratica in the desert area of the mainstream of the Tarim River in Xinjiang, China, as the research object. The leaf traits of Populus euphratica in different regions of the mainstream of the Tarim River are measured, and the network analysis method for leaf traits is used to study the following: (1) the leaf trait network and the characteristics of Populus euphratica that are employed to adapt to the environment under three different water flow environmental conditions in the upstream, midstream, and downstream regions of the mainstream of the Tarim River and under two different drought climate conditions, arid and hyper-arid; (2) the key traits in the leaf trait network of Populus euphratica; and (3) the differences in leaf morphological traits, stoichiometry traits, and anatomical structural traits in the trait networks of different arid regions. Through the changes in leaf traits, an analysis is made of how Populus euphratica leaves affect their adaptation strategies by changing the relationships between these traits.

2. Materials and Methods

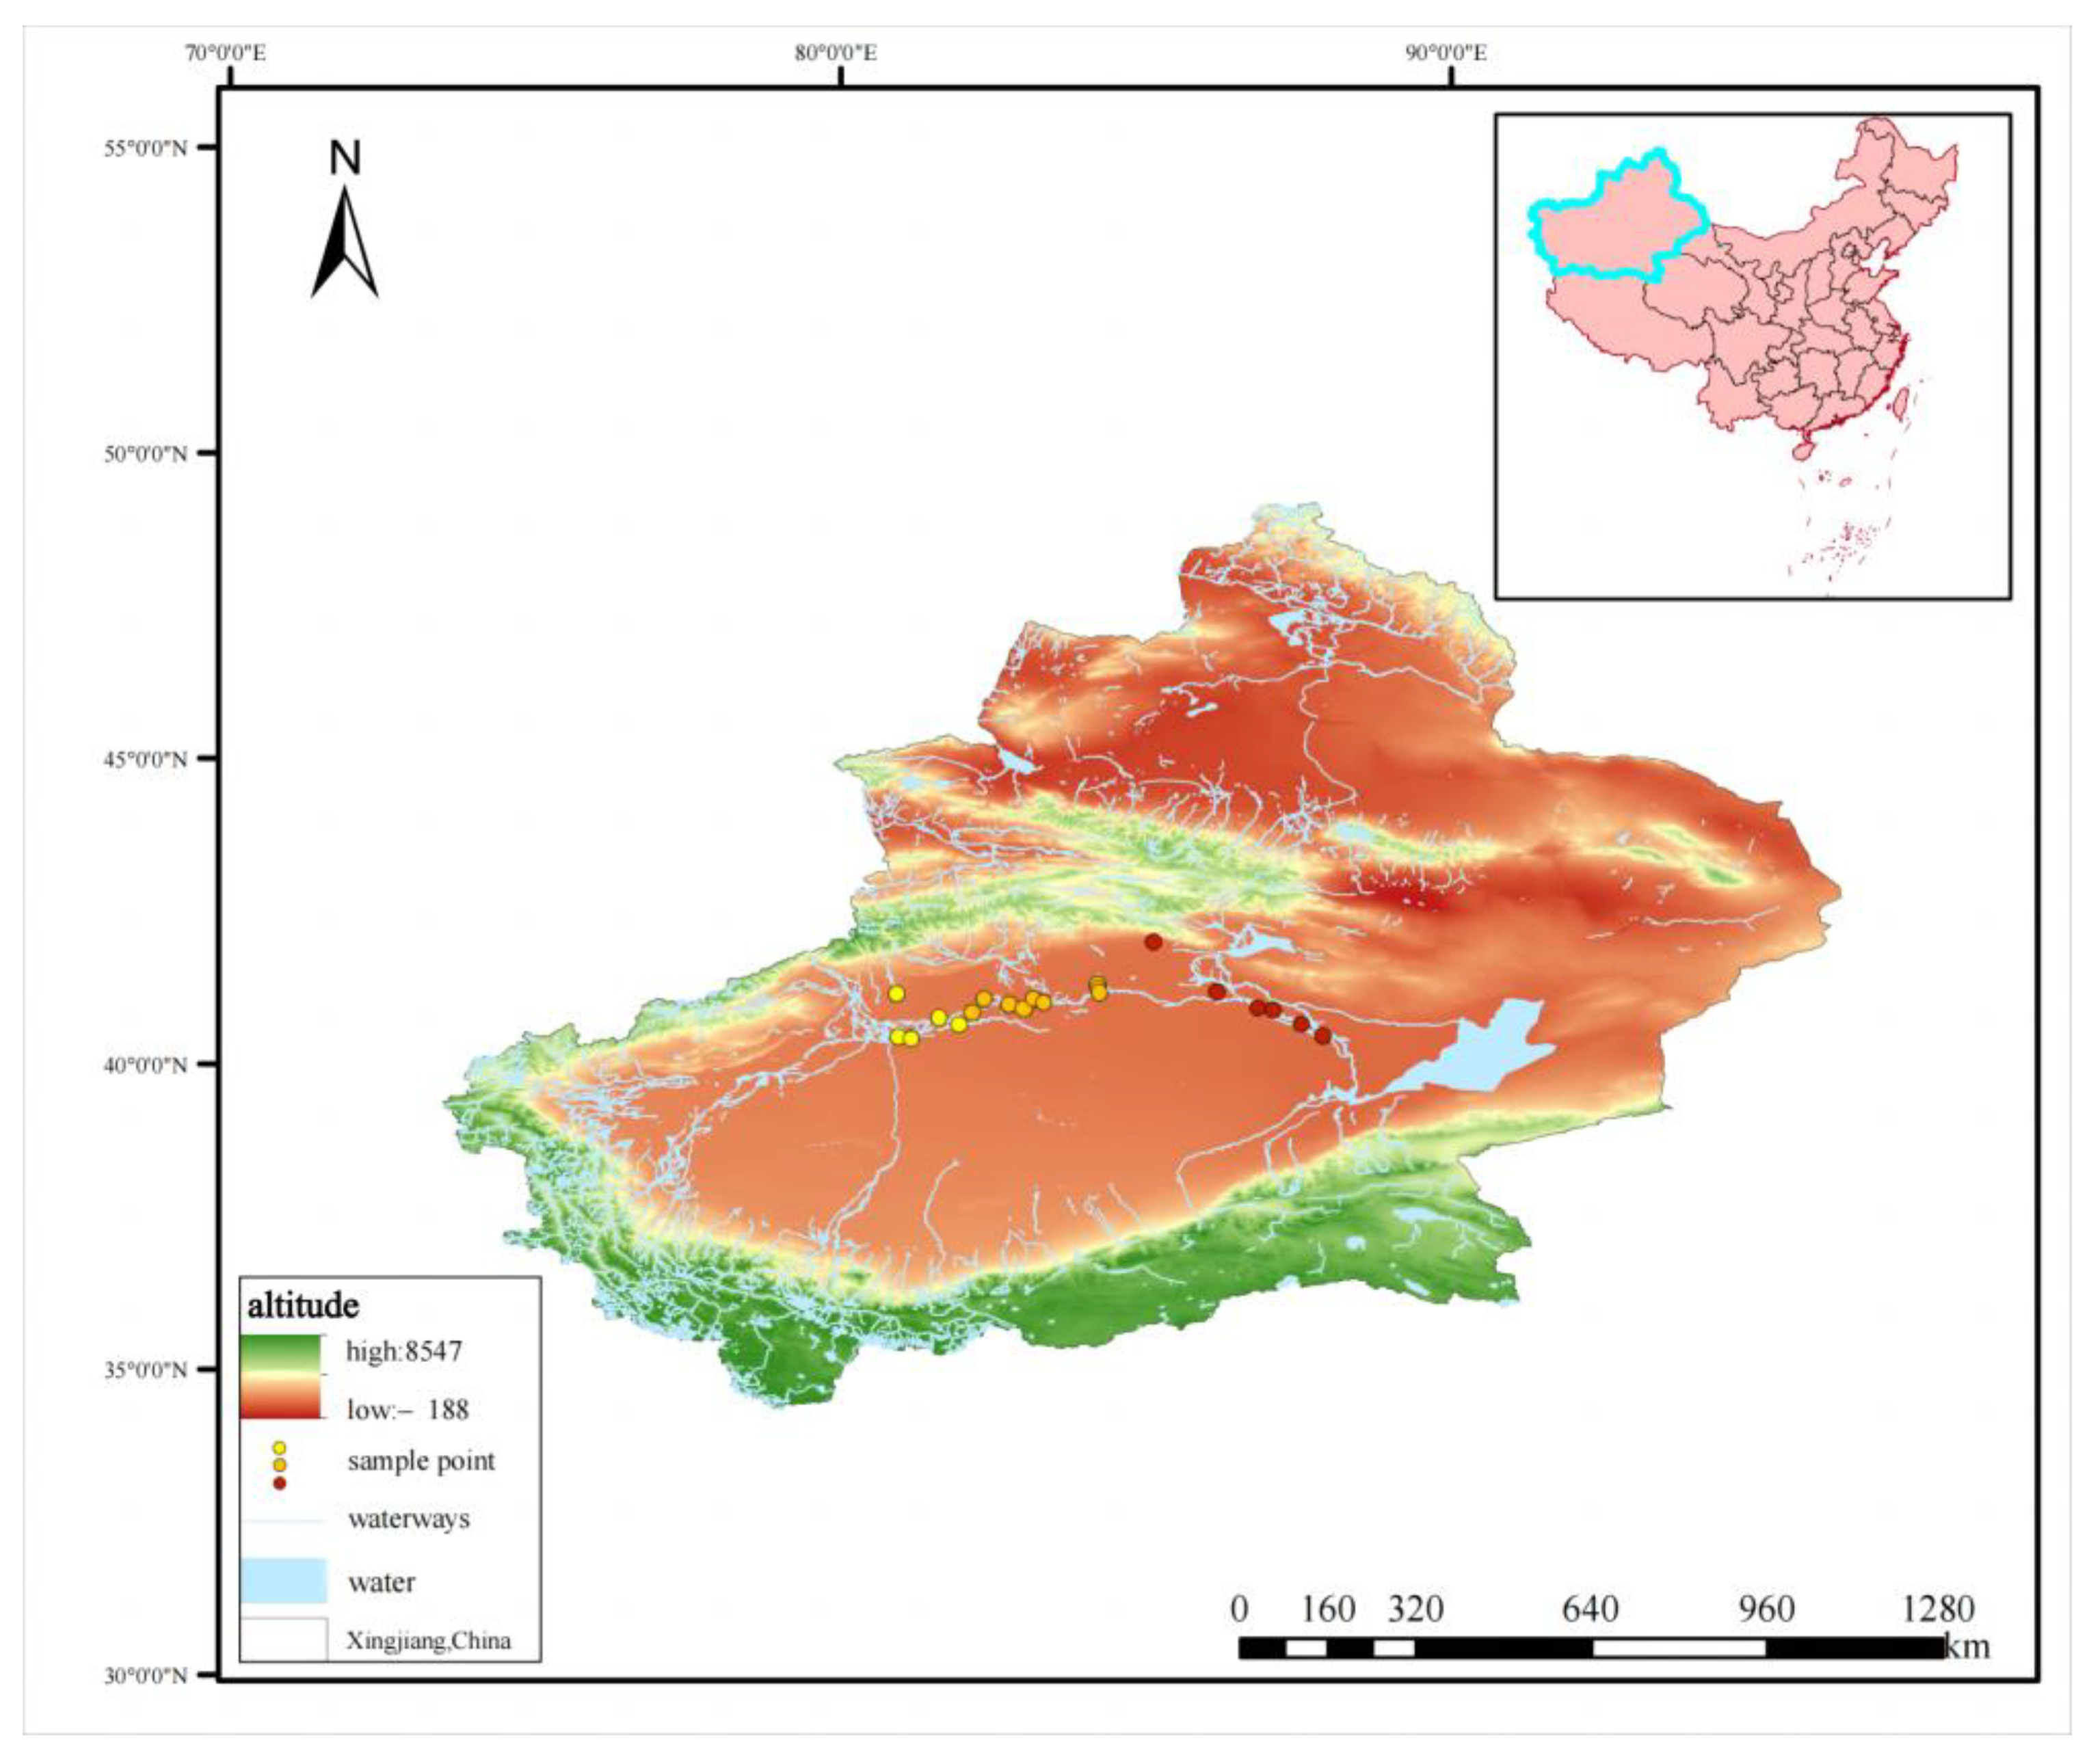
2.1. Study and Sampling Area

The Tarim River is located in the north of the Tarim Basin in Xinjiang Uygur Autonomous Region, China. It is the longest inland river in China and the fifth largest inland river in the world. The mainstream of the Tarim River originates from the Hotan River and the Yarkand River in the Kunlun Mountains and the Aksu River in the Tianshan Mountains which merge at Alaer City to form the source of the mainstream. Of the entire mainstream of the Tarim River, Alaer–Yingbazha is the upstream region, Yingbazha–Chaala is the midstream region, and Chaala–Taitema Lake is the downstream region [25]. This study selected 20 sampling sites in the upstream, midstream, and downstream regions of the Tarim River in 2022 (Figure 1). The sampling sites are distributed in natural Populus euphratica forests far away from human interference. These sampling sites are located in the desert riparian zone, which is a typical ecologically fragile area in arid regions [26]. Each sampling site was sampled while recording the longitude and latitude coordinates, elevation, and other data of each site and while obtaining the aridity index (AI) of the sampling site. The basic information of the 20 sampling sites is shown in Table A1.

2.2. Leaf Sample Collection

We measured each tree in the sample plot; determined the size of the sample tree based on the average breast height diameter range; randomly selected healthy, pest-free Populus euphratica trees with a 20–30 cm breast height diameter as sample trees; and took 15 samples from each sampling point for measurements with a total of 300 trees, recording their specific breast height diameter size and various data. Using high-branch scissors, we cut the healthy leaves from the third section of the lower part of the crown of each Populus euphratica sample tree from the four directions of east, west, north, and south and evenly mixed them. We took 20 leaves, retaining the main vein, cut them, and immediately put them into a reagent bottle containing FAA fixative (70% ethanol:formaldehyde:acetic acid = 9:0.5:0.5). We took another 100 leaves, removed the petiole, weighed their fresh weight, and spread the leaves on a black background plate. We placed a ruler on them, took a picture of the vertical leaf surface, and used the picture for leaf morphology index analysis. Then, we brought these leaves back to the laboratory for the subsequent processing and analysis.

2.3. Leaf Measurement and Data Collection

After the leaves that were brought back were cleaned, they were placed in an oven at 105 °C for half an hour to kill the green, dried at 80 °C to a constant weight, and weighed again. The dried plant samples were crushed, ground, and sieved (0.2 mm) for the determination of the chemical elements in the leaves. A total of 27 traits were measured according to the functional categories, including the leaf morphological traits (leaf length: LL; leaf width: LW; leaf area: LA; leaf dry weight: LDW; leaf water content: LWC; leaf dry matter content: LDMC; specific leaf area: SLA; and leaf thickness: LT), the stoichiometry traits (leaf nitrogen concentration: N; leaf carbon concentration: C; leaf phosphorus concentration: P; leaf potassium concentration: K; the ratio of N to P: N:P; the ratio of C to N: C:N; and the ratio of C to P: C:P), and the anatomical structural traits (sponge tissue: ST; upper epidermis thickness: UE; lower epidermis thickness: LE; mucilage cells: MC; palisade tissue: PT; upper stratum corneum; USC; lower stratum corneum: LSC; midvein vascular bundle: MVB; sclerenchyma: SC; the ratio of palisade tissue to sponge tissue: P/S; cell tension ratio: CTR; and spongy ratio: SR). The carbon content in the sample was determined using the potassium dichromate oil bath heating method; the nitrogen content was determined using the Kjeldahl method; the phosphorus content was determined using the molybdenum–antimony colorimetric method [27]; and the potassium content was determined using the H2SO4-H2O2 digestion flame photometer (INESA, FP4231, Shanghai, China) method [28]. The leaf morphological traits were analyzed using ImageJ (version 1.53t, 2022) to take photos of the leaves. The leaf anatomical structural traits were determined using paraffin sectioning and measured using a digital microscope (Leica, Wetzlar, Germany) with an image processor (Leica Application Suite V4.0.0 DVD, Wetzlar, Germany).

2.4. Establishment of Leaf Trait Networks

A network consists of many nodes and edges. Leaf trait networks (LTNs) are multidimensional networks composed of nodes and edges, where leaf traits are nodes and the relationships between traits are edges [15]. First, the absolute value of the Pearson correlation (|r|, r > 0.2) is used to calculate the strength of the relationship between the traits. Secondly, a threshold value for pairwise correlation is set, and the correlation coefficients with p < 0.05 are retained and set to 1, while those below the threshold value are set to 0, resulting in an adjacency matrix A = [ai,j], where ai,j ϵ [0, 1]. The value of the trait–trait relationship is 1, indicating that the two traits are connected by an edge. If the relationship is 0, then the two trait characteristics are not directly connected by an edge. At the same time, the absolute value of the correlation coefficient is used to weigh the edges between any pair of leaf traits [16]. Finally, the LTNs are visualized.

2.5. Parameters of Leaf Trait Networks

Combined with the characteristics of the leaf traits, the leaf trait network can describe the overall characteristics of the LTNs through diameter, average path length, edge density, modularity, and the average clustering coefficient [15]. Diameter represents the maximum and shortest distance between any two connected nodes in the network, and average path length is the average shortest path between all the node traits in the network. Edge density is the ratio between the sum of the actual edges and the sum of the maximum possible edges, and modularity describes the degree of separation between subnetworks (or modules) [29]. Traits with similar functions tend to be interrelated and organized into a module [30]. The average clustering coefficient is defined as the average of the clustering coefficients of all the traits in the leaf trait network. A higher value means that not all traits in the network have good coordination with specific traits [4].
The node parameters of the leaf trait network are set to quantify the relationship between the different traits, using degree, closeness, and betweenness to identify the topological roles of the different traits in the LTNs. The adaptability of the different traits is identified through changes in the node parameters [31]. Degree is used to describe the number of edges connected to the node, which is the sum of the edges connecting the characteristic node trait to the other nodes. Traits with high values are considered to be hub traits that have regulatory effects and are the “central traits” of the network. Closeness (C) refers to the reciprocal of the shortest average path length from a specific trait node to the other nodes. Traits with high C values are closely related to the other traits. Betweenness refers to the number of shortest paths passing through the node. In LTNs, traits with large betweenness values are “bridges” or “mediators” that connect functional modules.

2.6. Statistical Analyses

The “igraph” package in R was used to calculate the parameters of the node traits and overall LTNs. The “cluster” package in R was used to perform hierarchical clustering on 20 samples. For each network, 999 random trait cycles were performed, with 75% of the actual number of traits being randomly selected as the minimum value. The number of traits per sample was 27, which meant that the actual number of traits extracted was 20 ≤ n ≤ 27. The extracted traits were then analyzed using network analysis to construct trait networks, and the overall parameters of each network were calculated. Random cycles were performed for each actual number of traits extracted to explore whether the overall parameters of the network changed with the number of traits. The “mean” and “standard error” of these parameters were calculated, and independent sample t-tests were used to compare the differences in the LTN parameters between different arid regions. One-way ANOVA was used to compare the differences in the three types of leaf traits between the upper, middle, and lower network parameters and the node parameters in different arid regions. Statistical analysis and visualization were performed using Origin (2021) and R (version 4.3.0, 2023). The significance level was set at p < 0.05.

3. Results

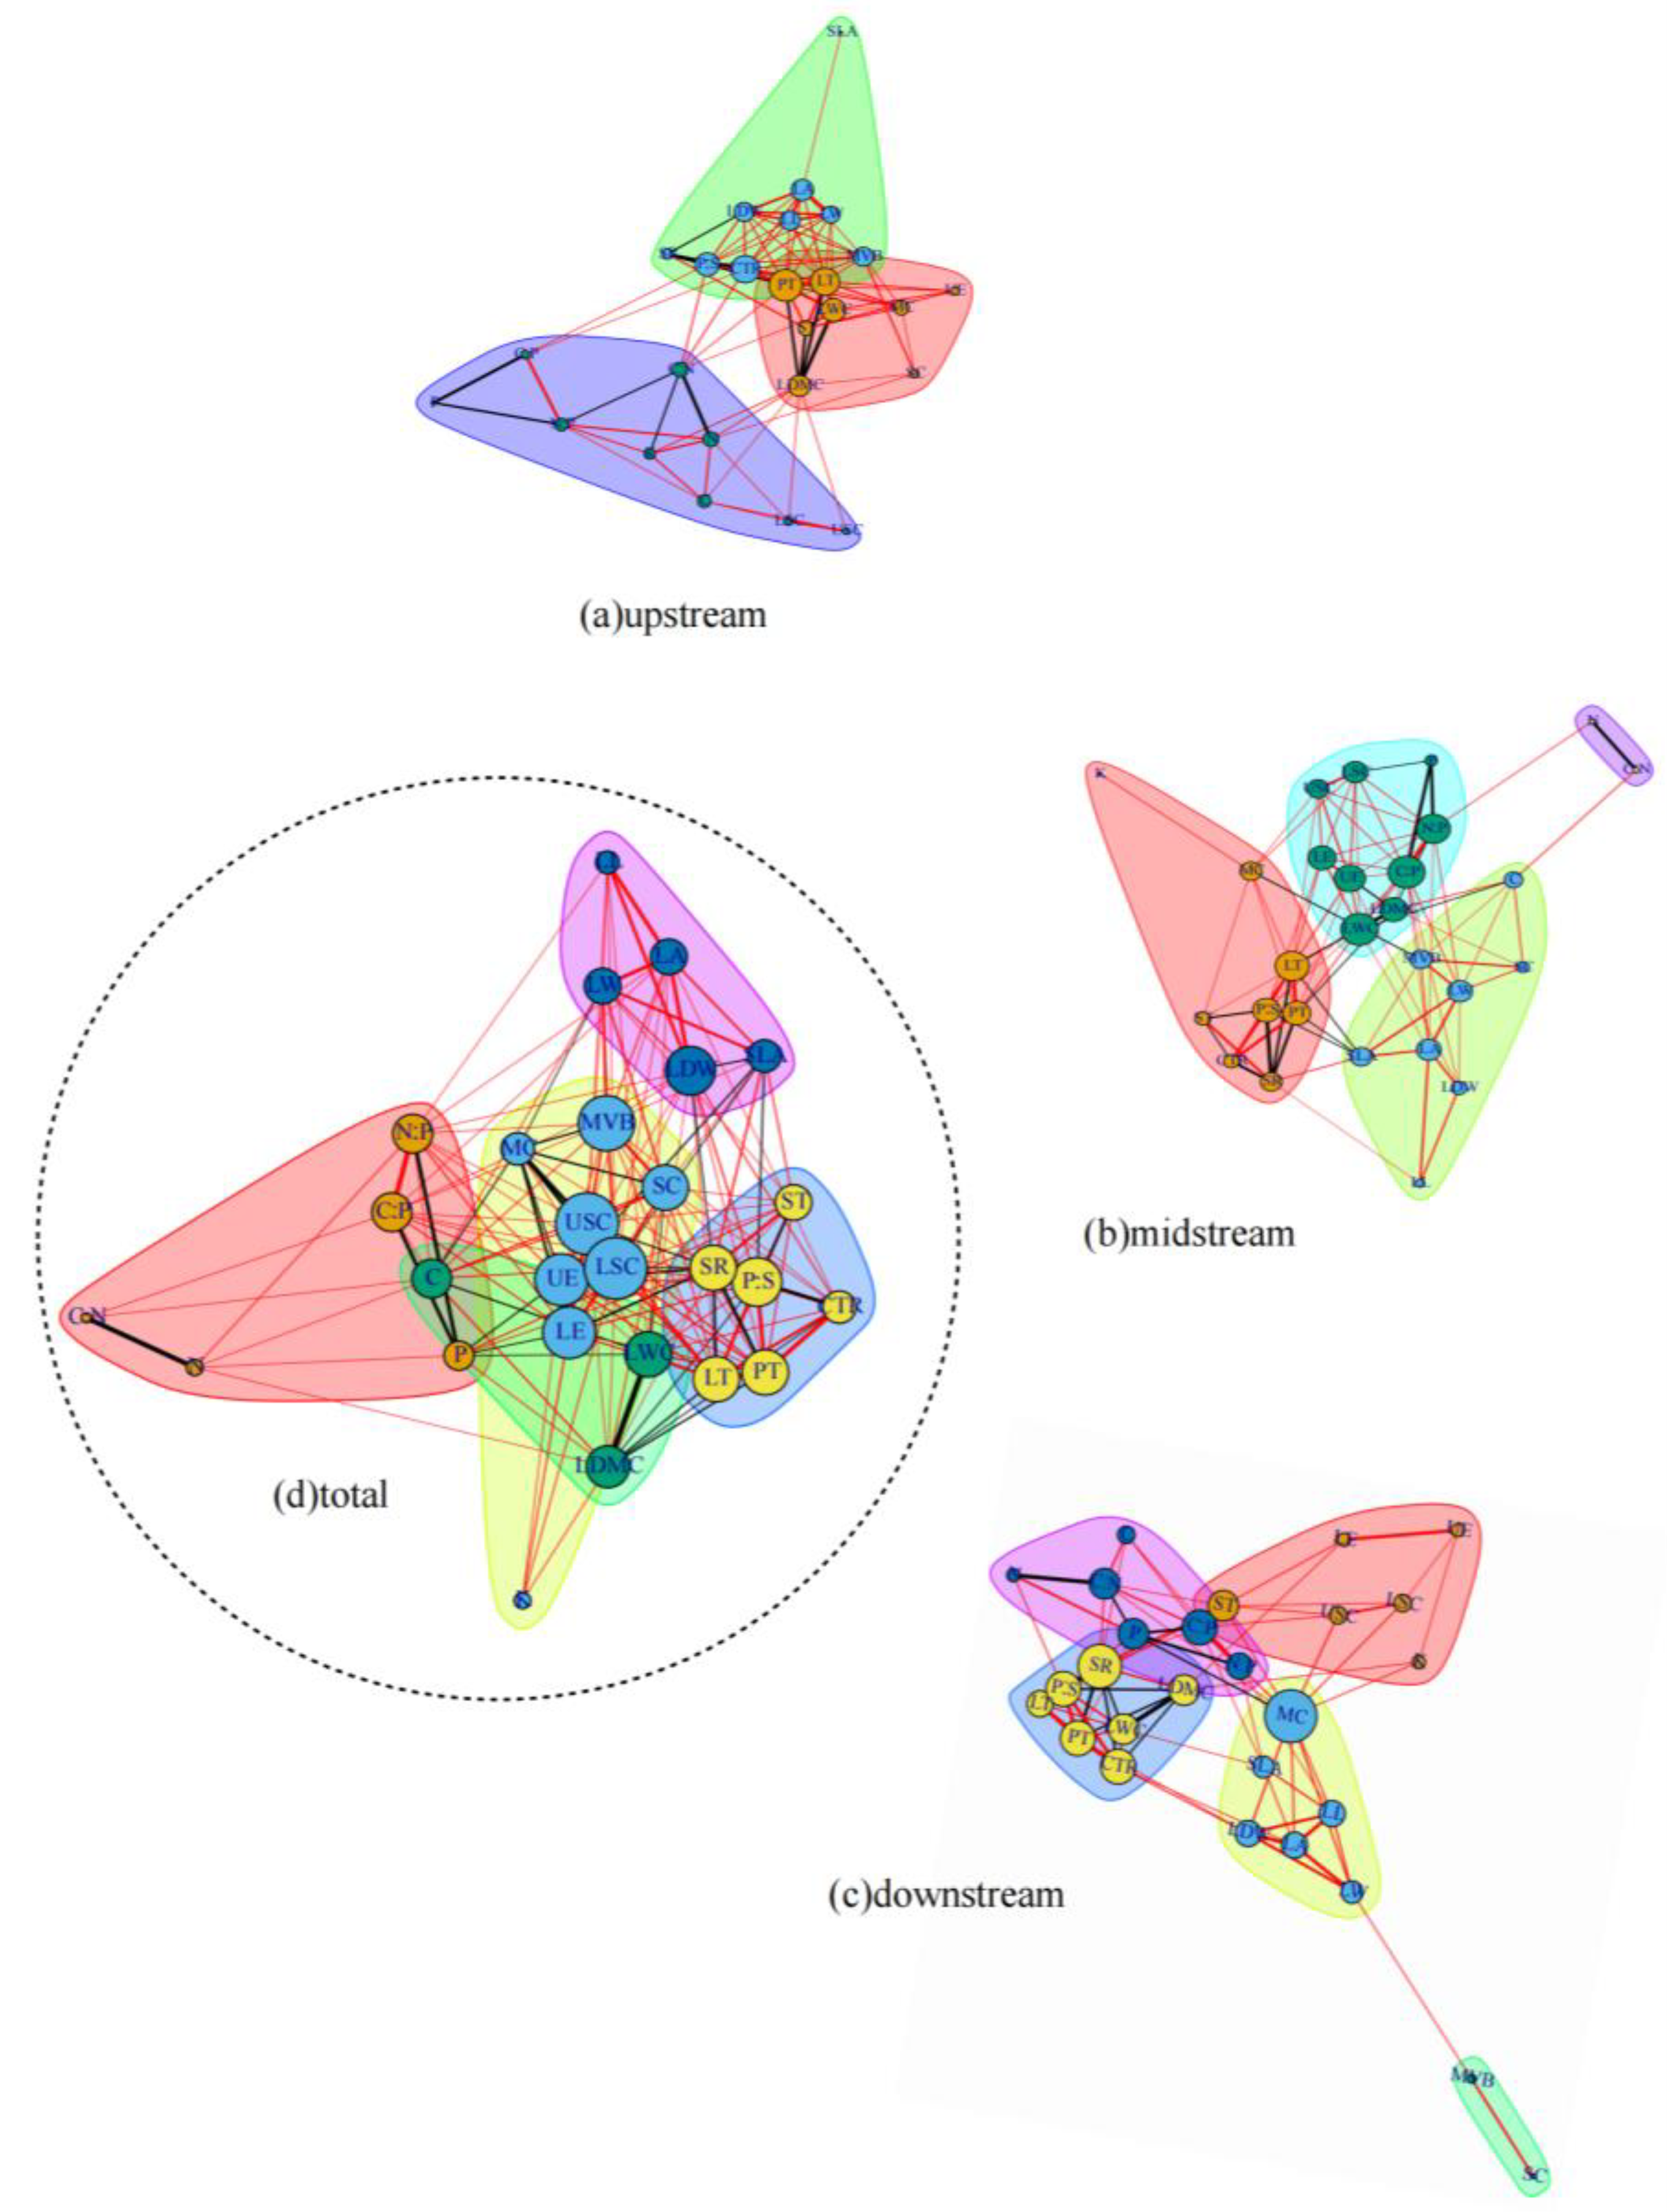
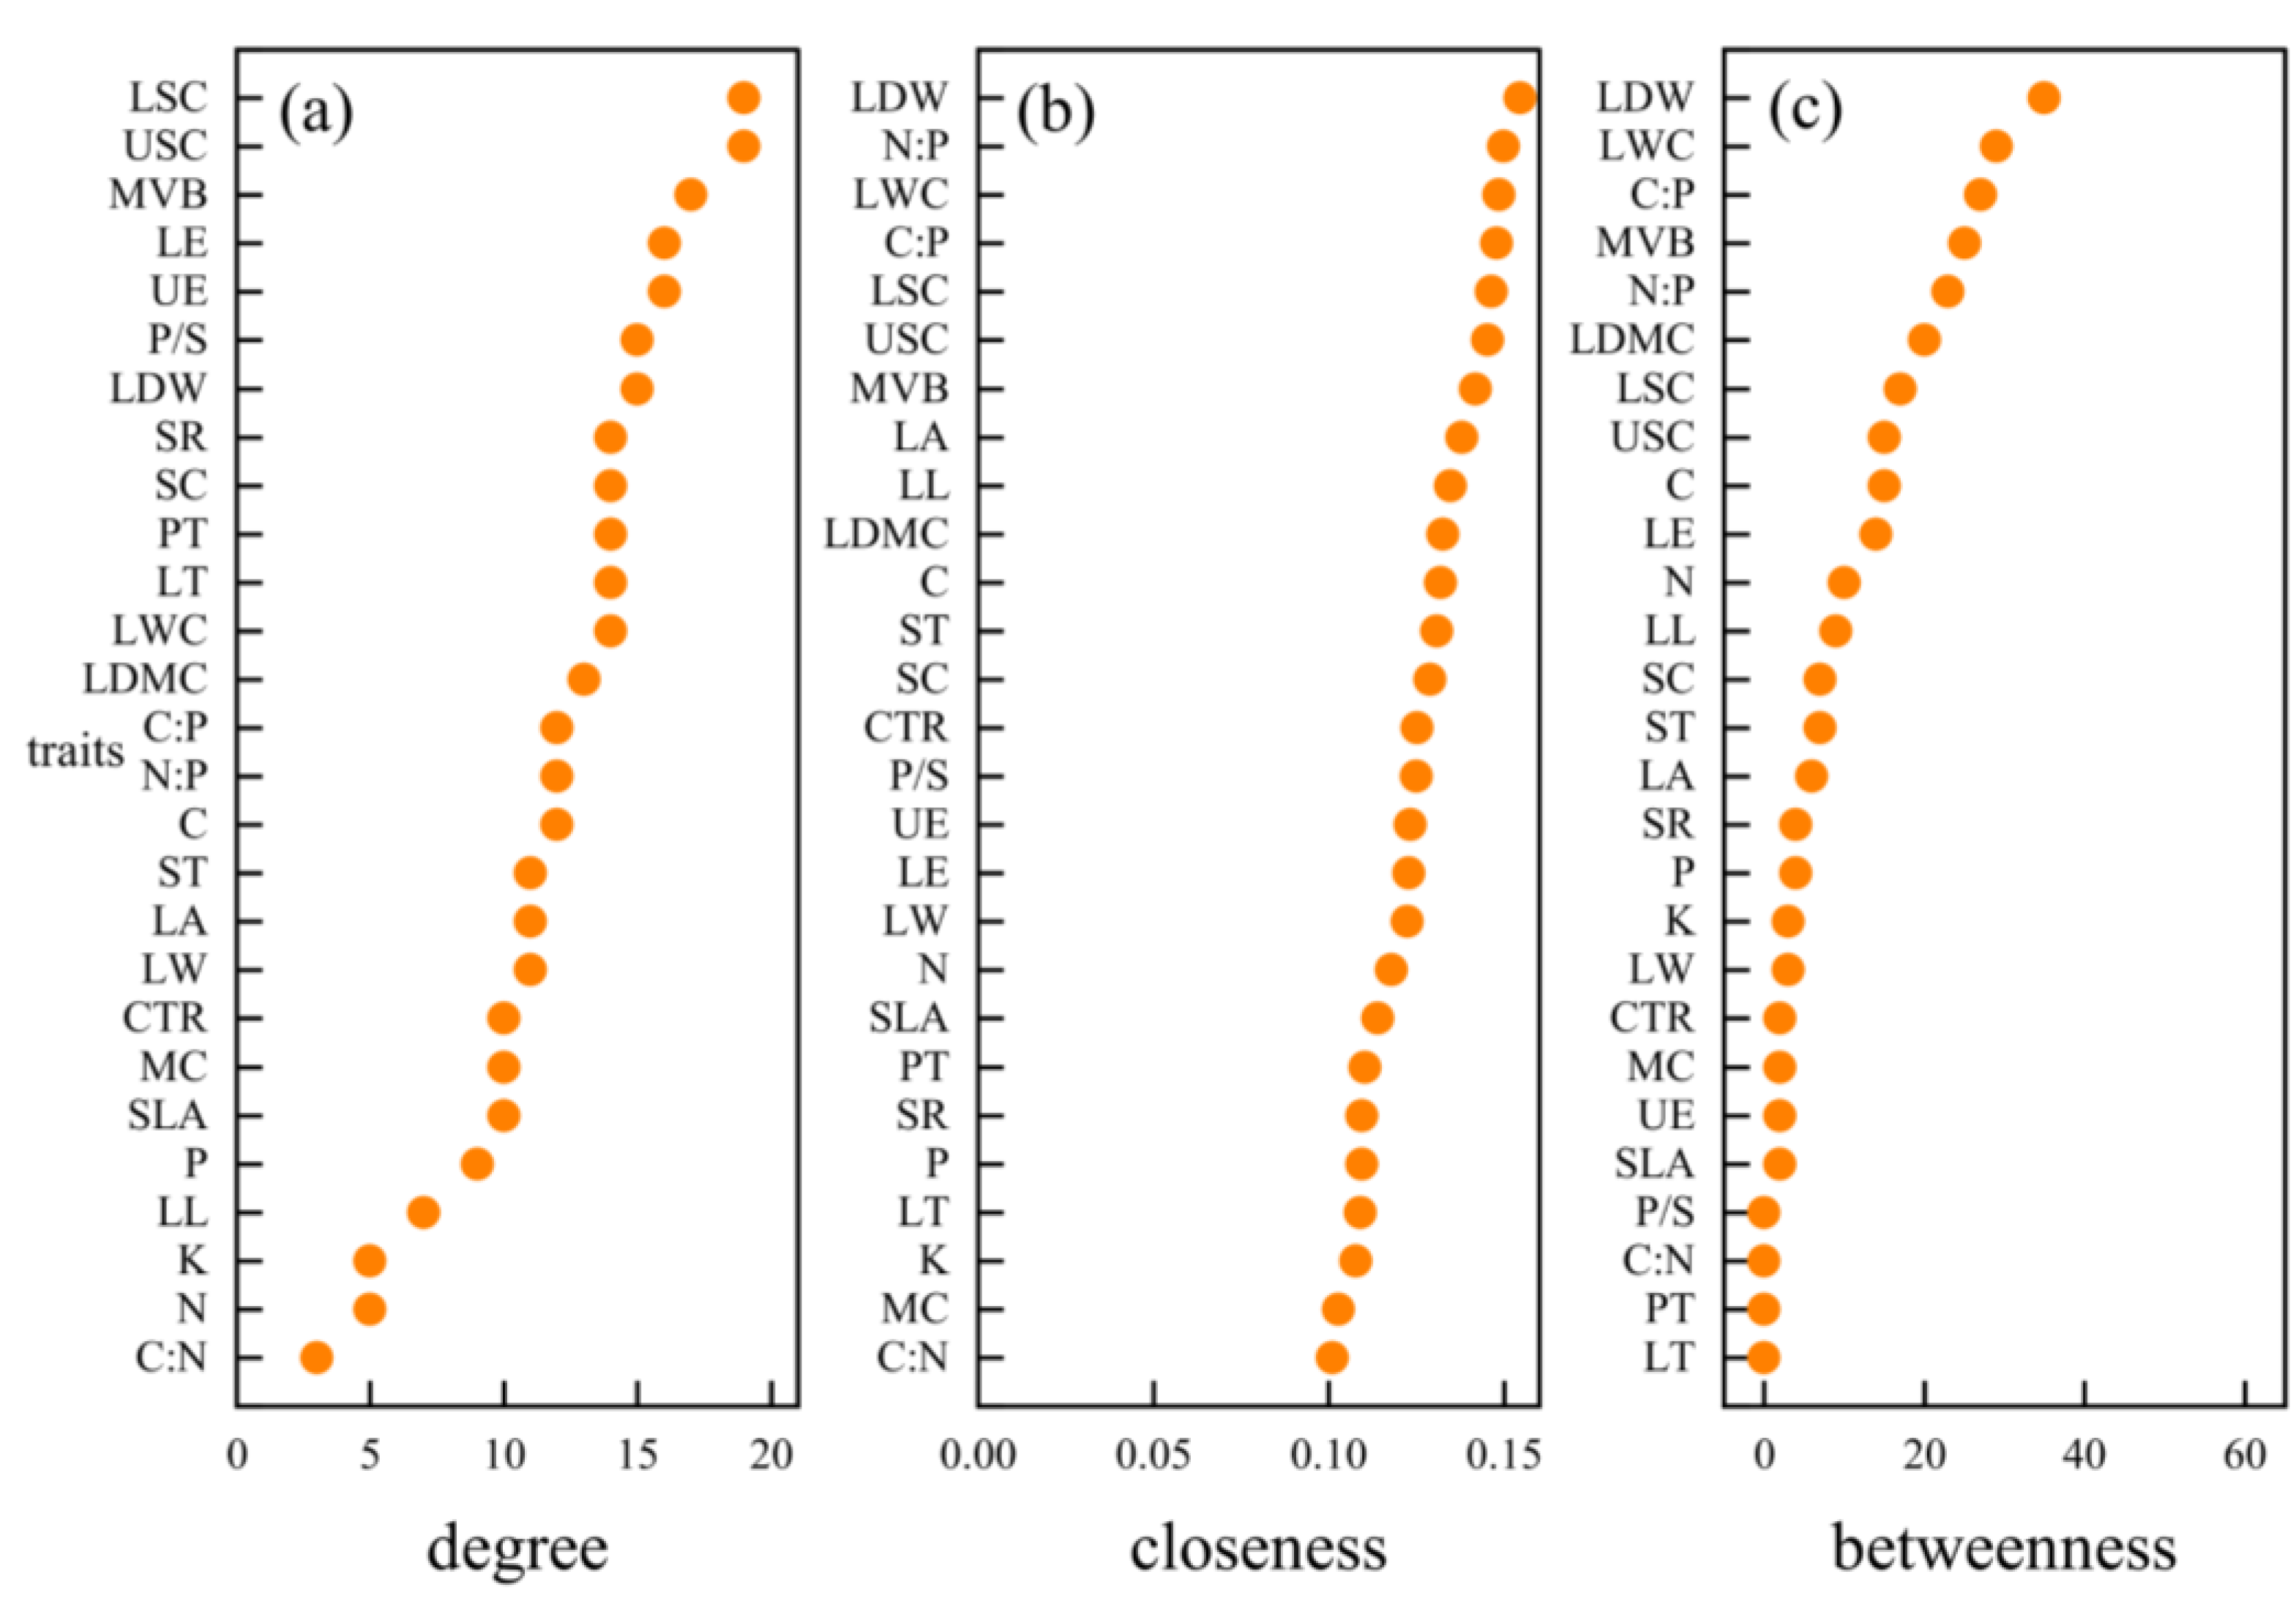
3.1. Leaf Trait Network of Populus euphratica in the Mainstream of Tarim River

Based on the leaf trait dataset of 300 Populus euphratica trees in 20 sampling sites in different reaches (upstream, midstream, and downstream) of the mainstream of the Tarim River, a leaf trait network was constructed for the upstream, midstream, and downstream regions and the whole network (Figure 2), and the parameters were calculated. The analysis of the leaf trait network in the different reaches of the mainstream of the Tarim River revealed significant differences in the overall parameters of the network (Figure 3). As the reach changed, from upstream to downstream, the edge density, average clustering coefficient, and average path length significantly decreased, while the modularity and diameter significantly increased. Comparing the node parameters of the leaf trait network in the different reaches of the mainstream of the Tarim River (Figure 4), we found that the upstream regions have higher degrees and closeness in the palisade tissue, cell tension ratio, leaf thickness, and mucilage cell area and that they have higher betweenness in leaf dry weight, leaf water content, and sclerenchyma area. The midstream regions have higher degrees and closeness in C:P, leaf water content, mucilage cell area, and N:P, and they have higher betweenness in leaf water content and mucilage cell area. In the downstream regions, the mucilage cell area, leaf spongy ratio, leaf cell tension ratio, C:N, and sponge tissue thickness have higher degrees and closeness, while the mucilage cell area, leaf width, and sponge tissue thickness have higher betweenness. Comparing the node parameters of the overall leaf trait network in the Tarim River (Figure 5), some leaf traits (lower stratum corneum: LSC; upper stratum corneum: USC; midvein vascular bundle: MVB; and leaf dry weight: LDW) exhibit higher degrees and closeness, with leaf dry weight exhibiting the highest betweenness. In the overall network, most of the traits are positively correlated. In this study, leaf functional traits were divided into anatomical structural traits, stoichiometry traits, and morphological traits (Figure 6). In the overall LTN, the degrees of leaf anatomical and morphological traits were significantly higher than those of the stoichiometry traits, while there was no significant difference in closeness and betweenness.

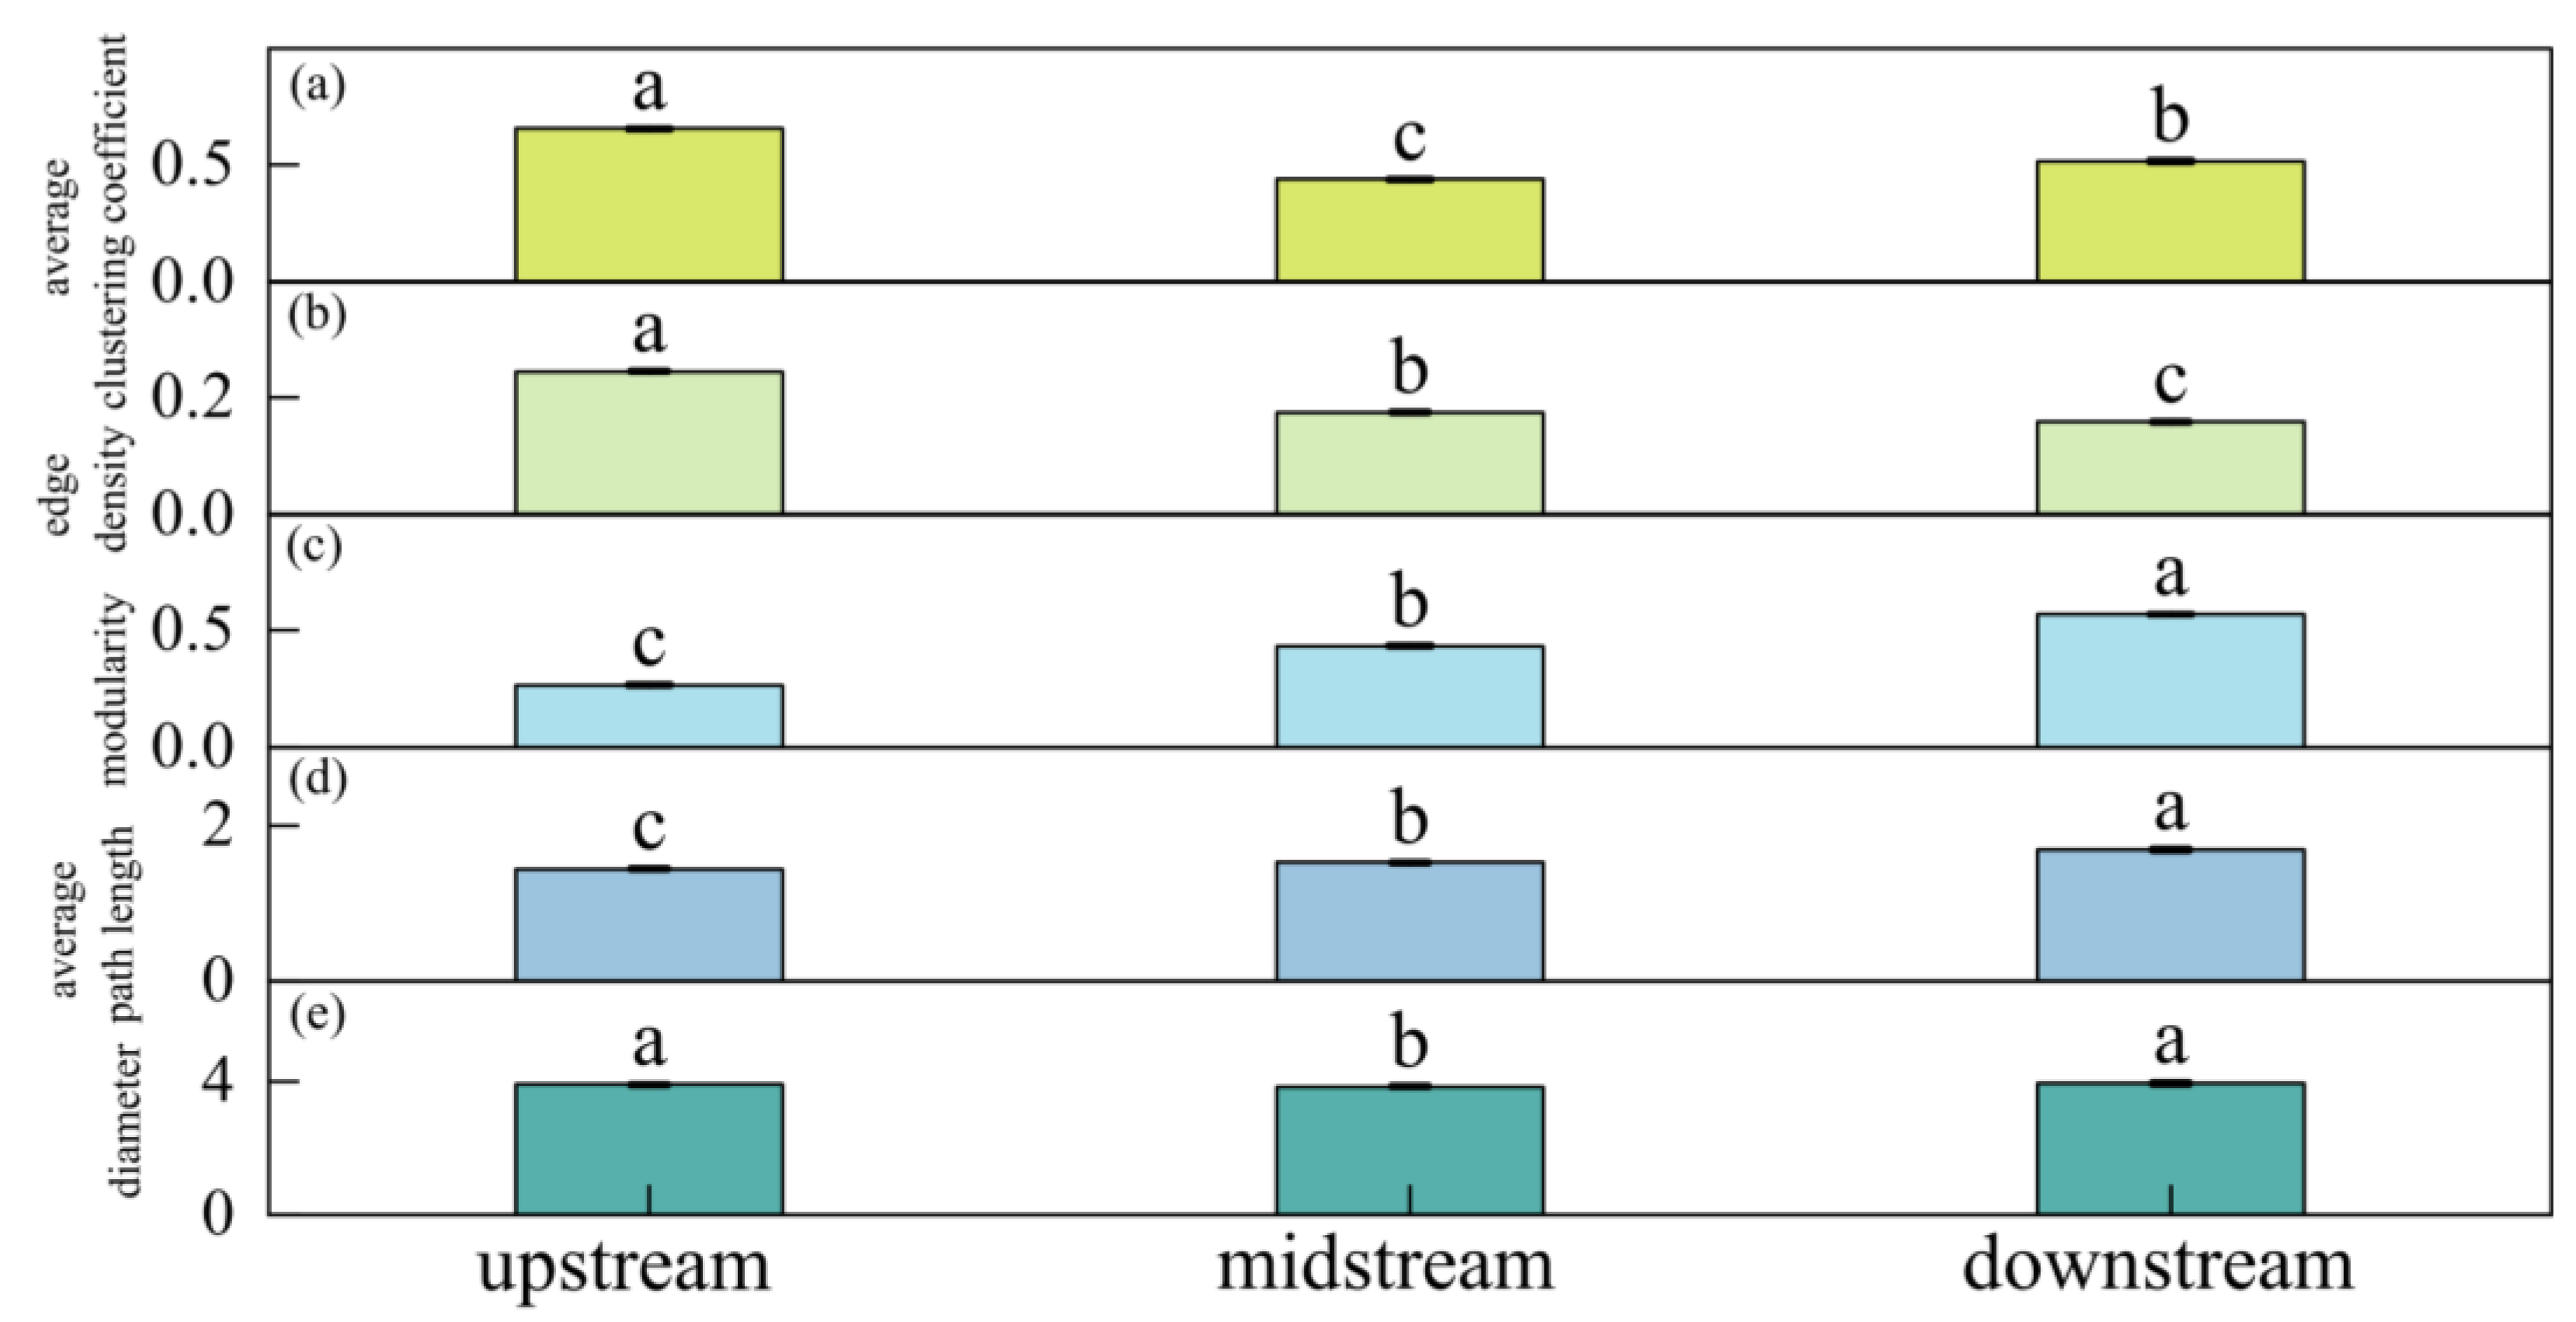
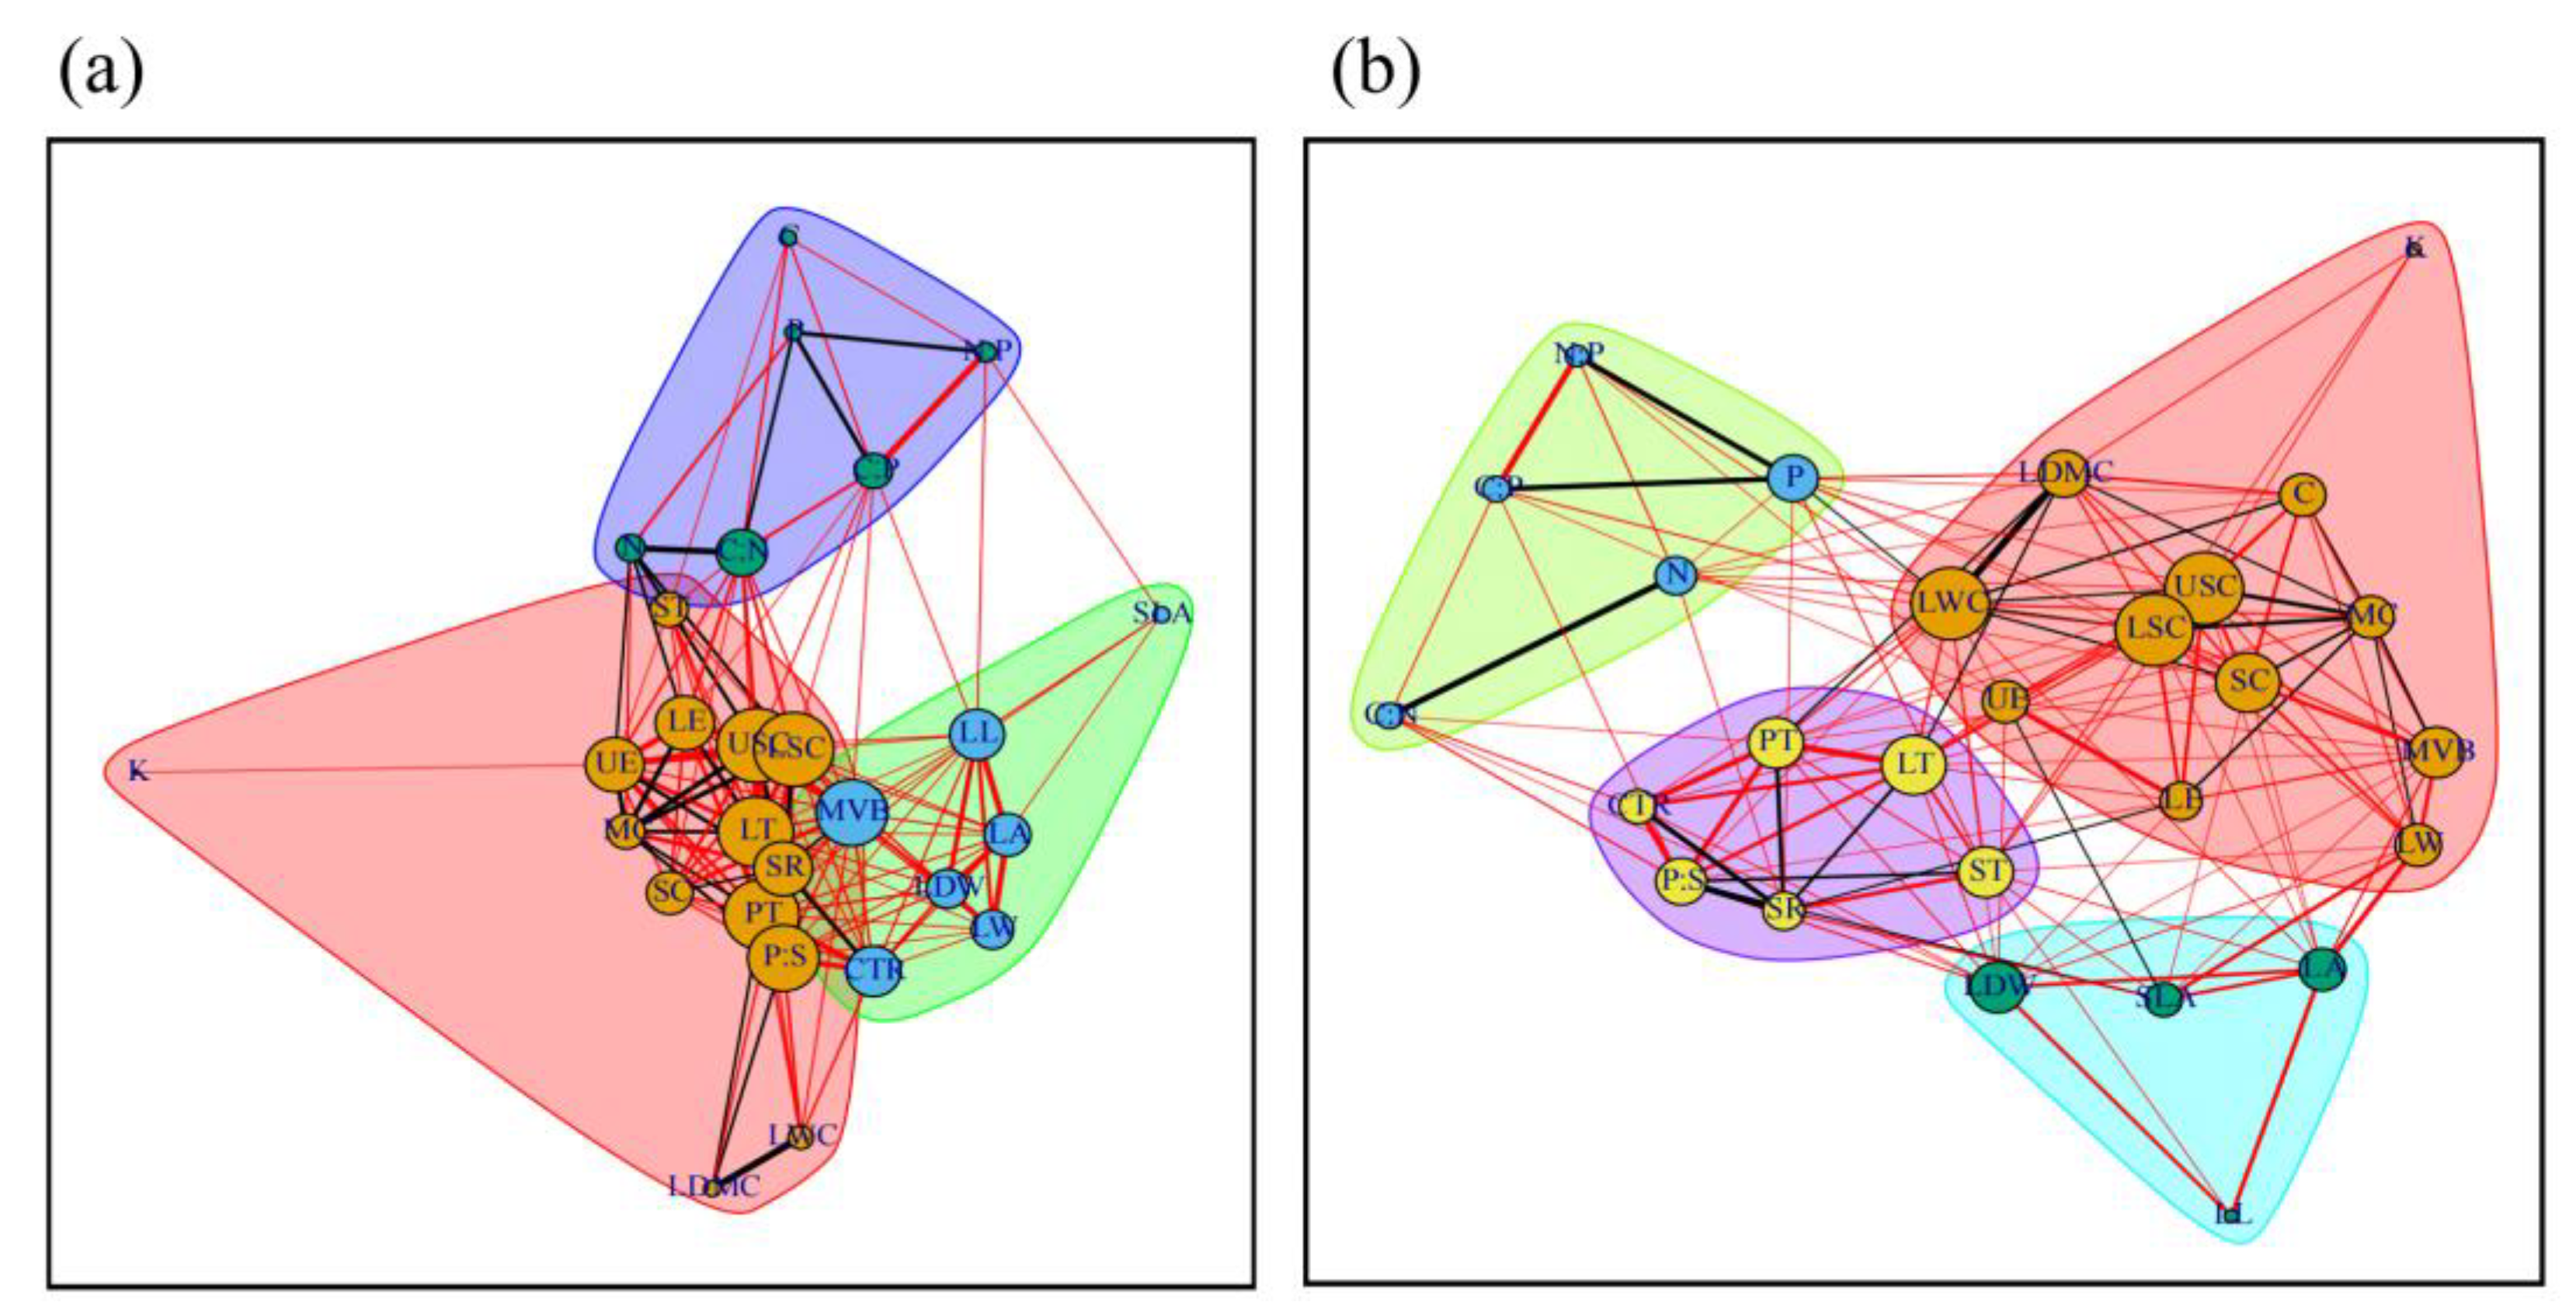
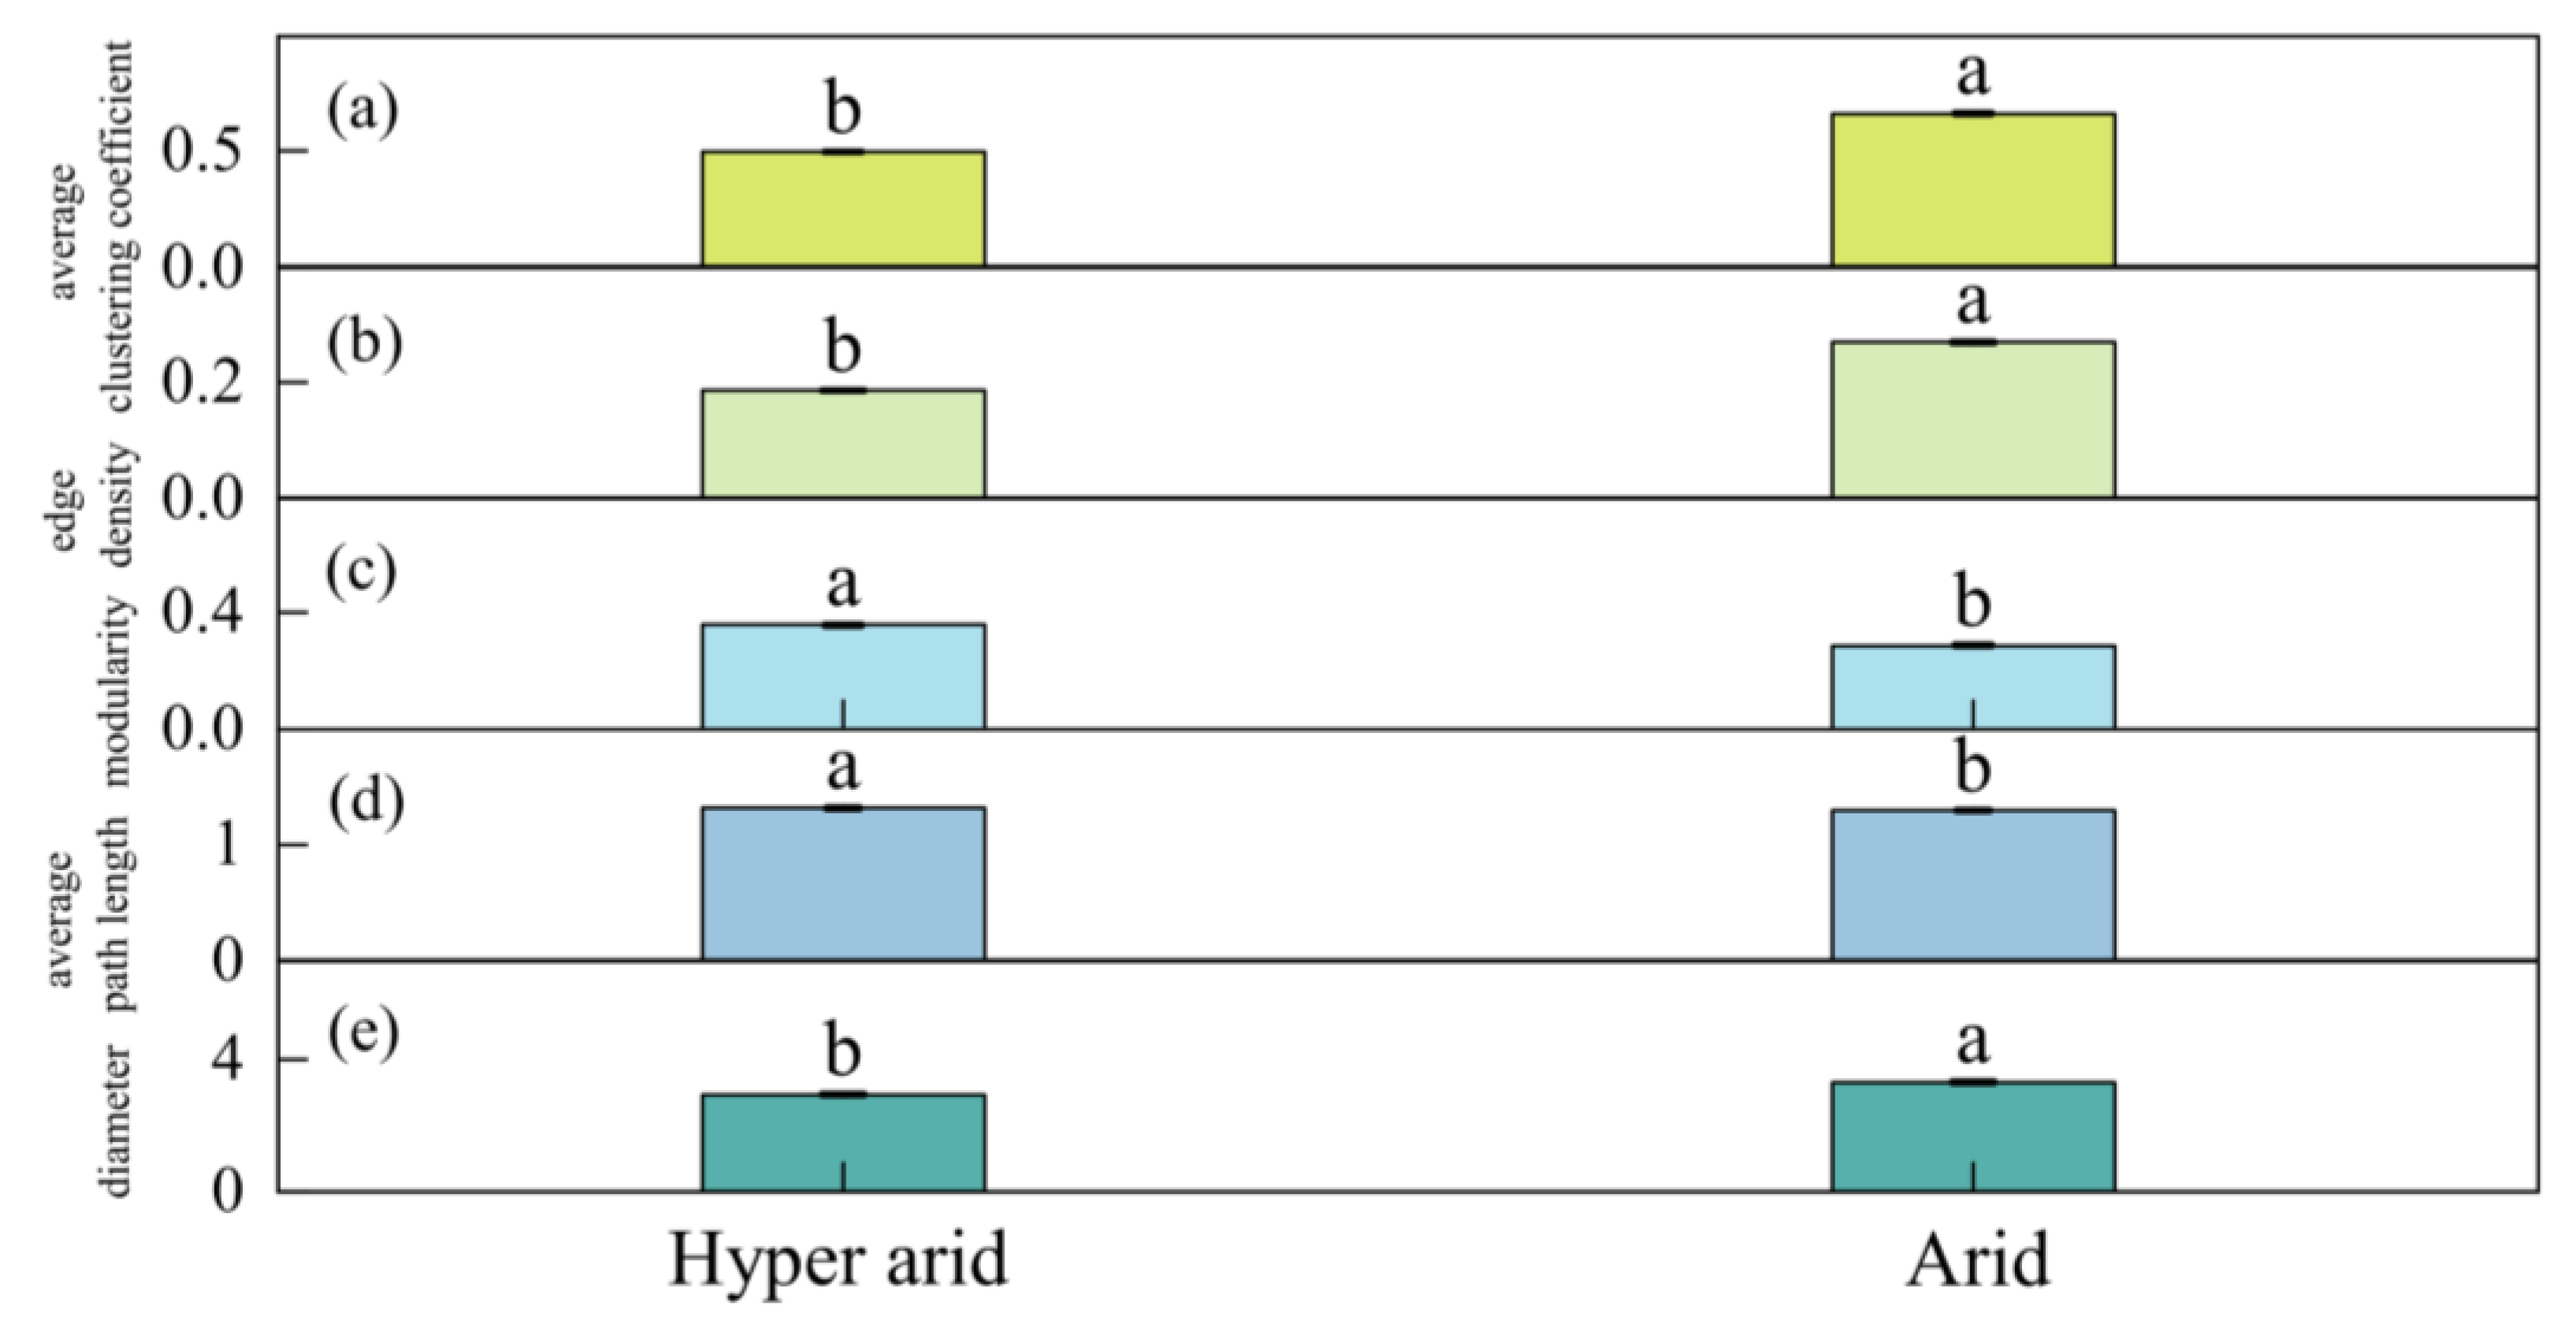
3.2. Differences in Leaf Trait Networks of Populus euphratica in Different Arid Regions along the Mainstream of the Tarim River

Hierarchical clustering was performed on the arid index (AI) [32,33,34] of 20 samples, and the samples were divided into hyper-arid regions and arid regions (Figure 7). In the two networks, most of the traits were positively correlated, and the number and composition of the modules in the leaf trait correlation networks were different. From the overall network perspective, there were significant differences in the LTNs of the different arid regions (Figure 8). The average path length in the hyper-arid area was significantly higher than that in the arid area (1.32 and 1.30), and the average modularity in the hyper-arid area was significantly higher than that in the arid area (0.36 and 0.29). The average clustering coefficient in the hyper-arid area was significantly lower than that in the arid area (0.48 and 0.66), and the average diameter in the hyper-arid area was significantly lower than that in the arid area (2.94 and 3.31). The edge density in the hyper-arid area was significantly lower than that in the arid area (0.19 and 0.27).

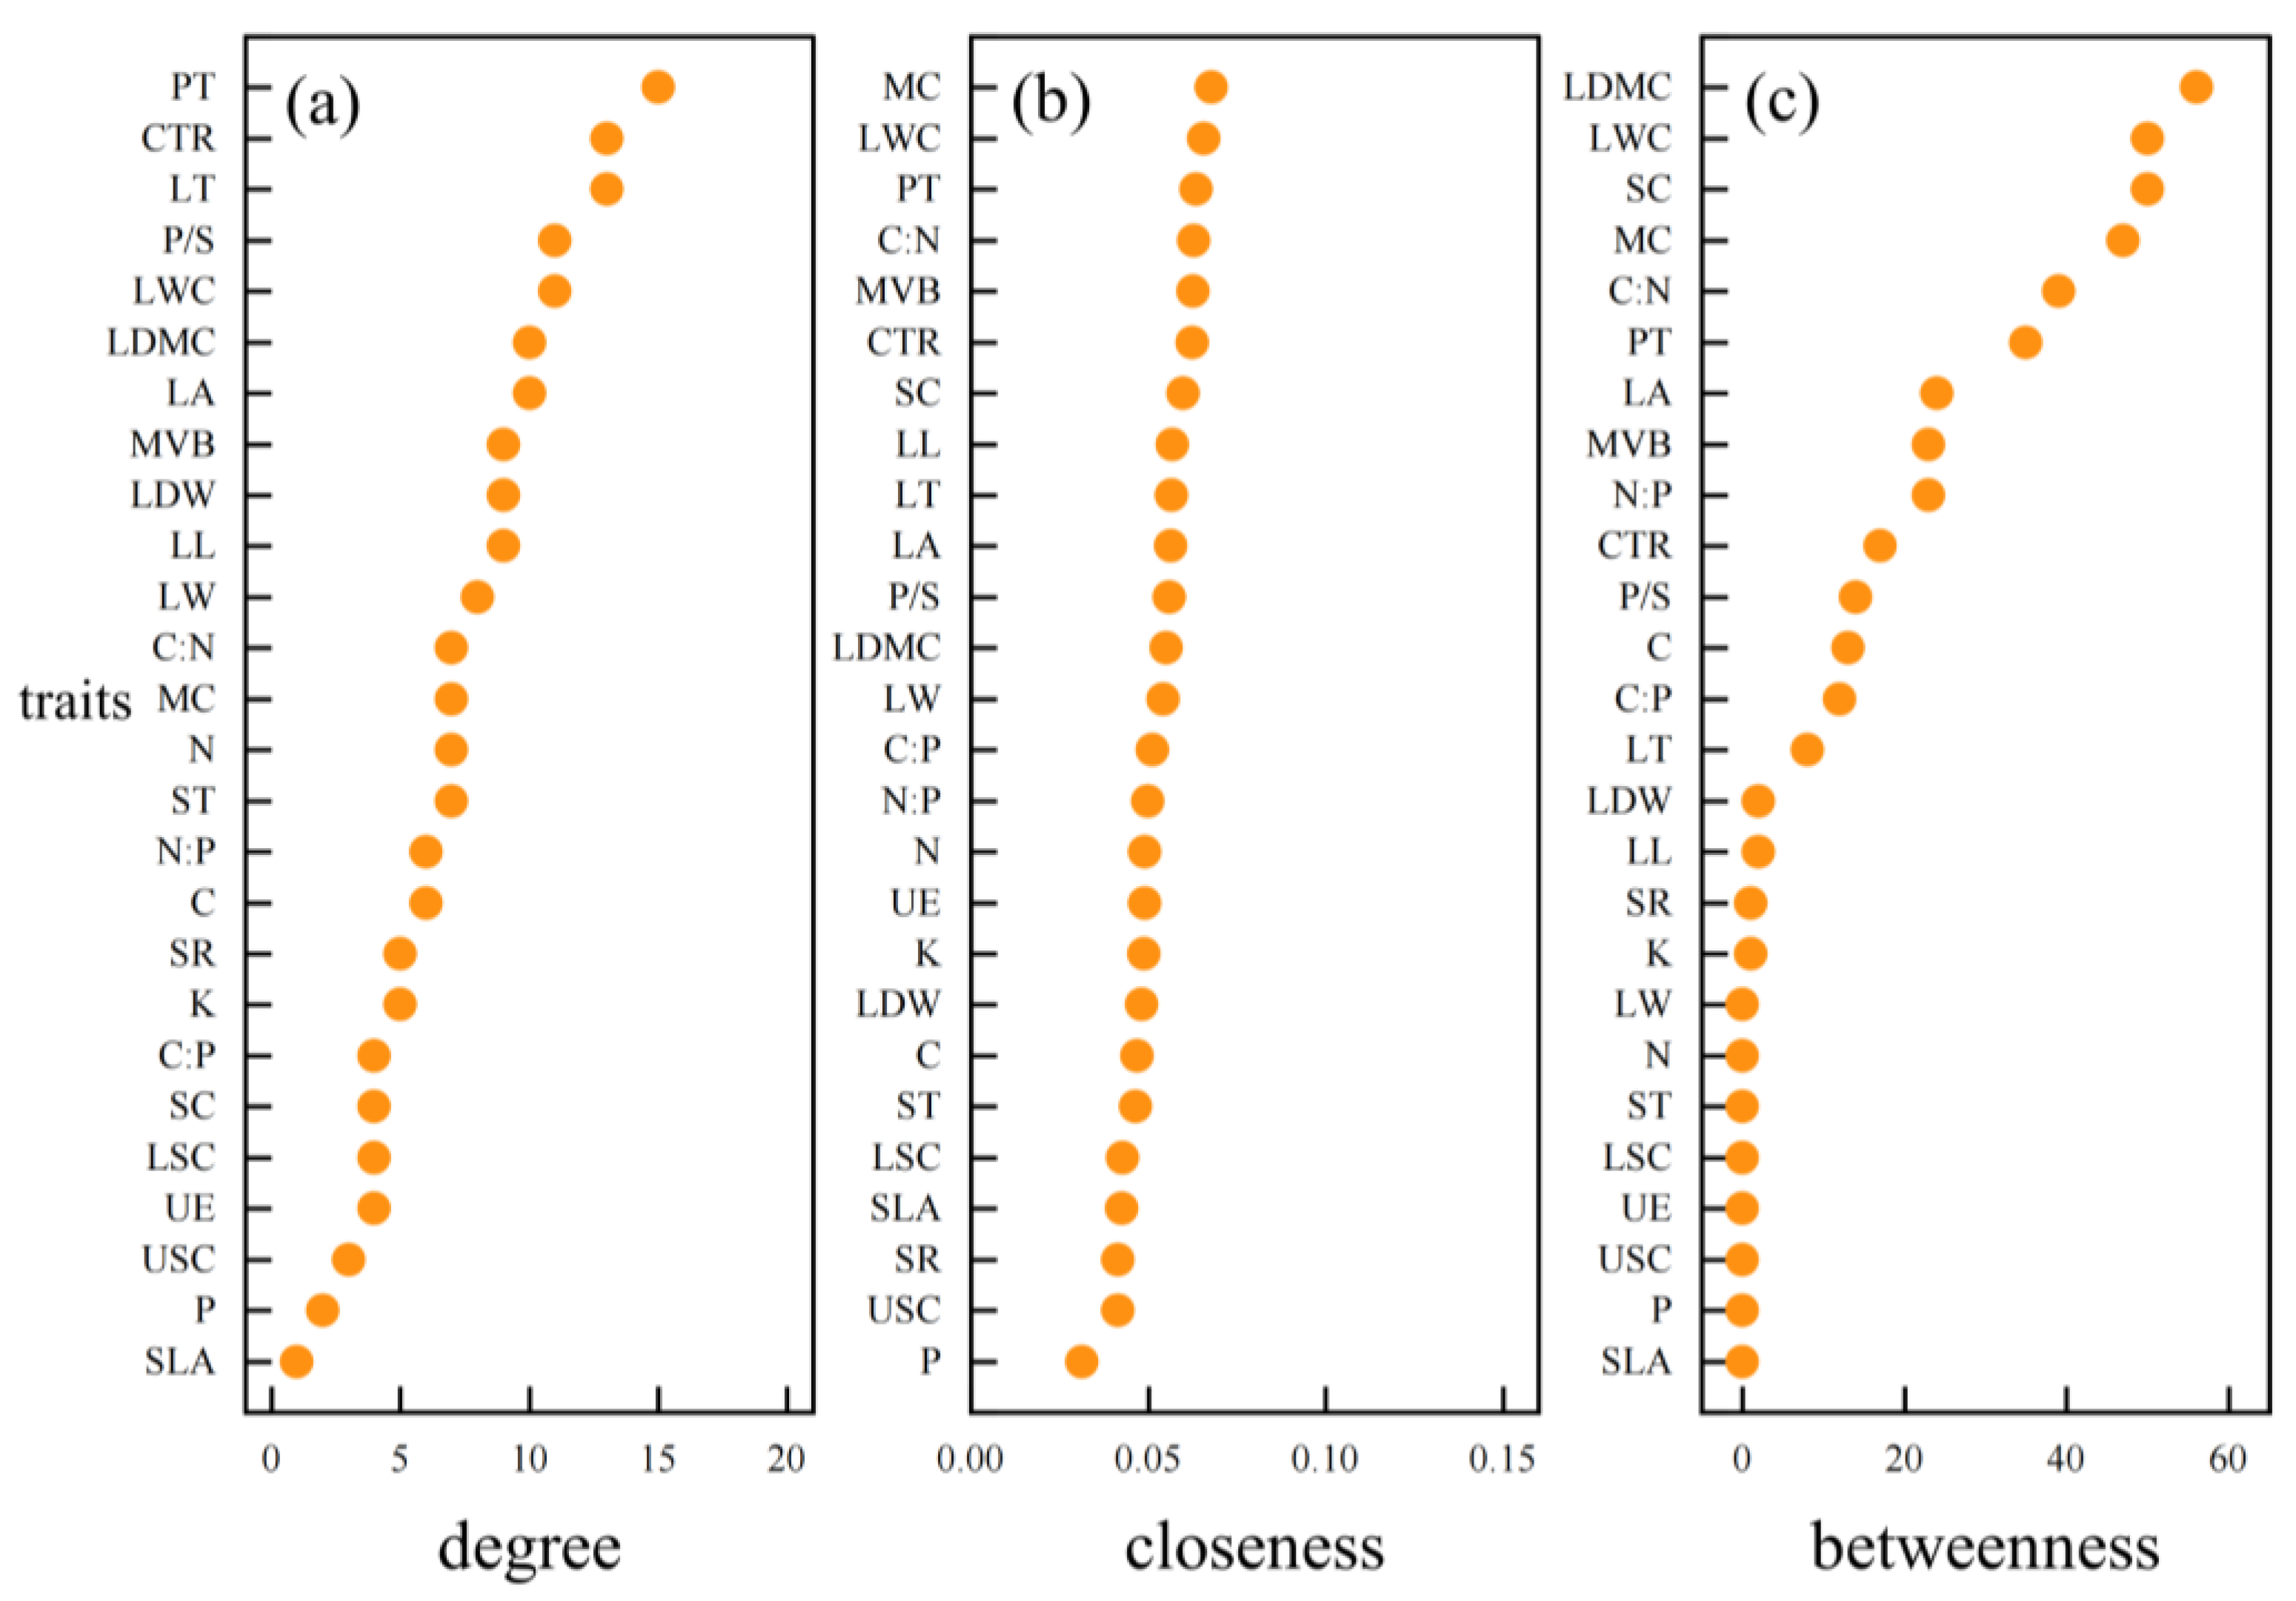
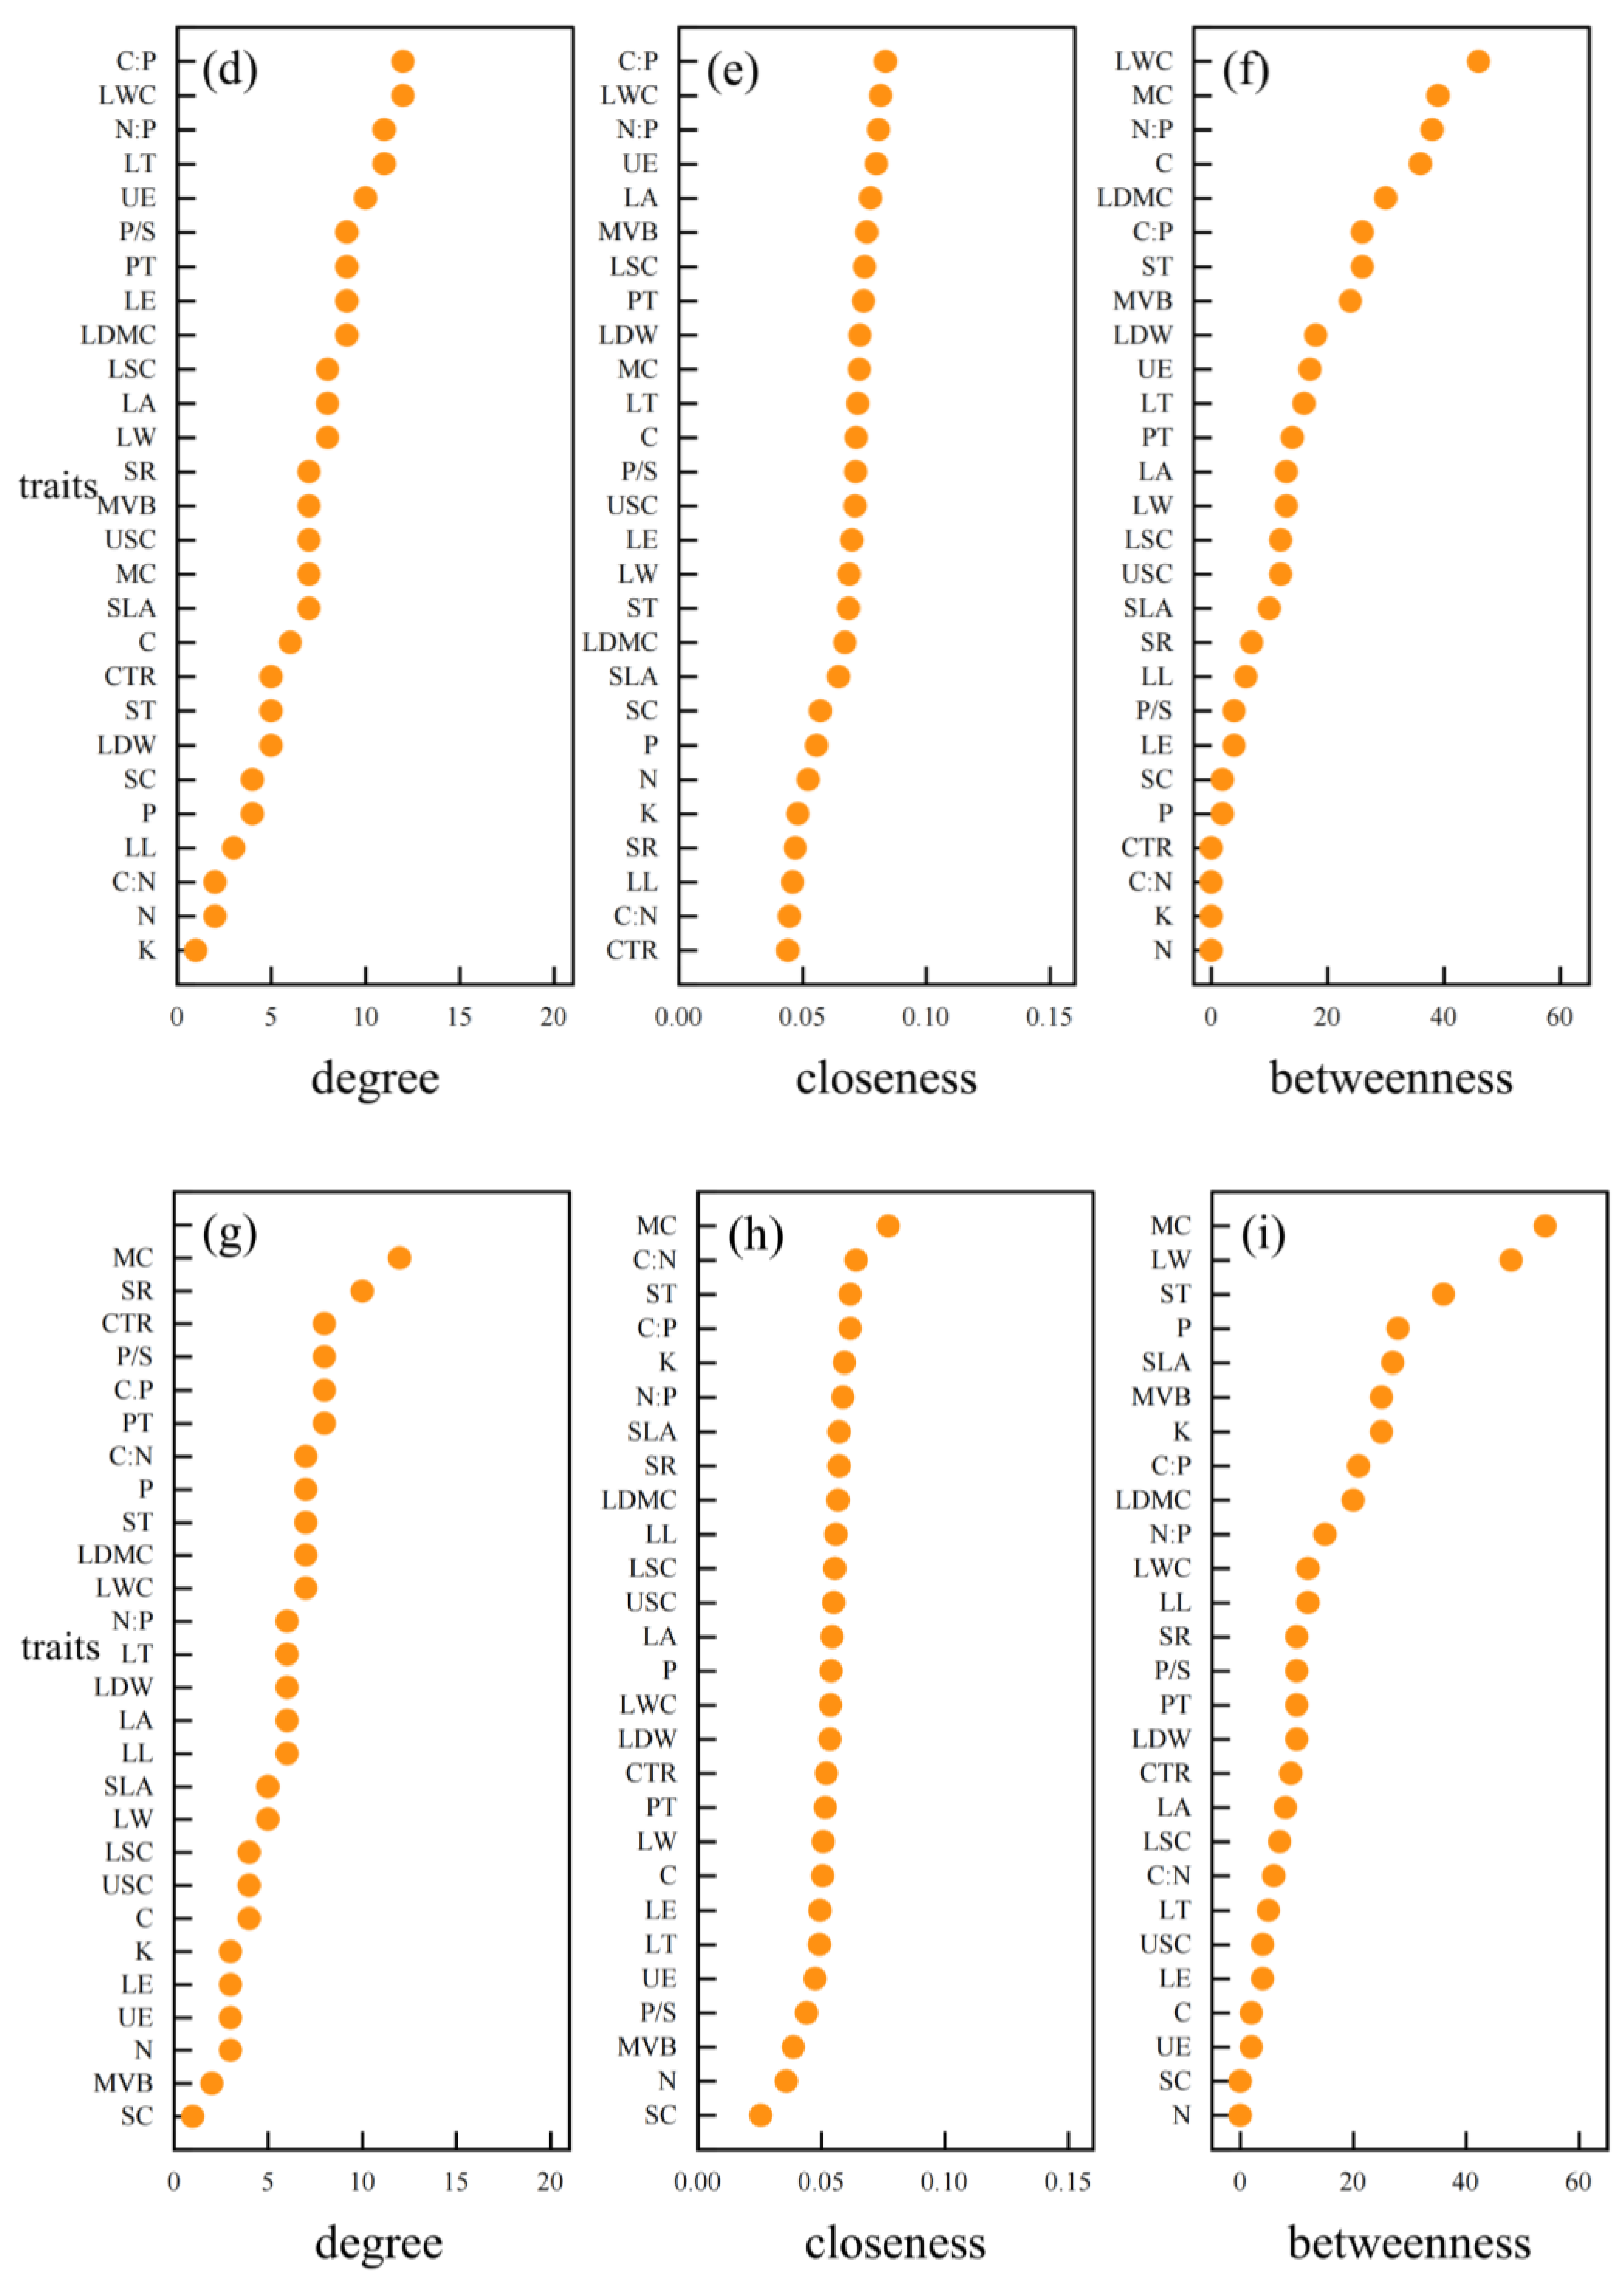
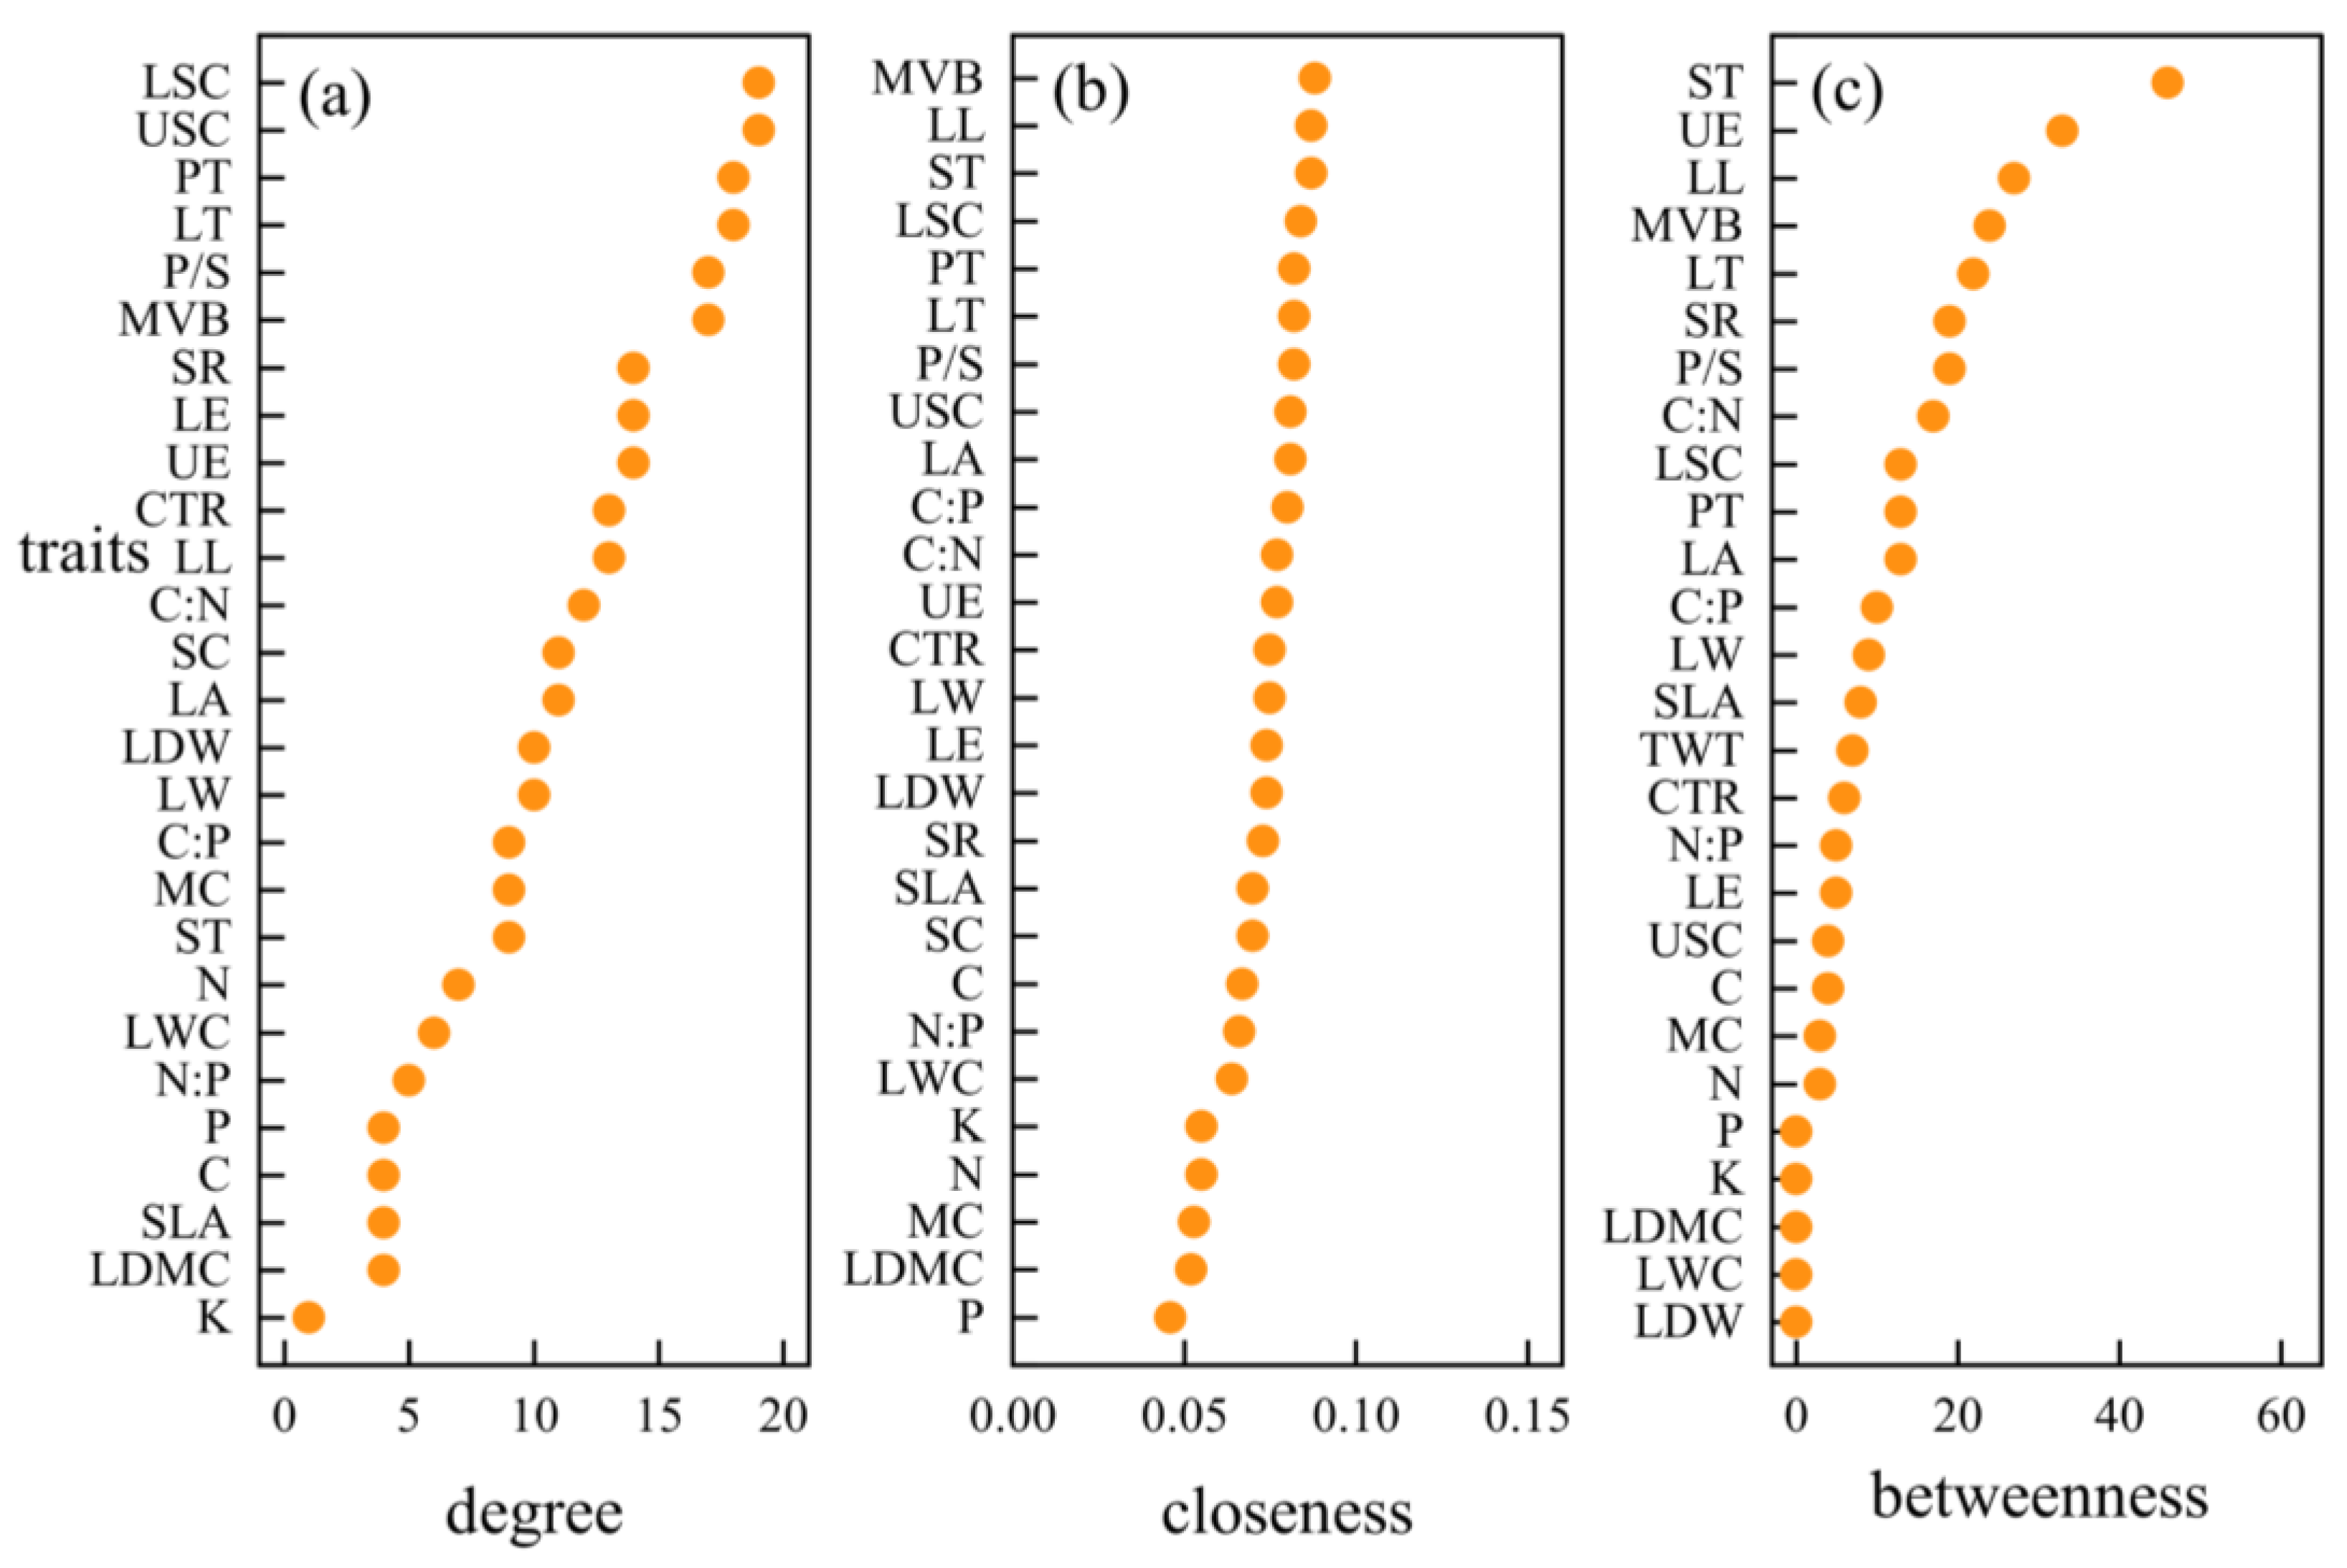
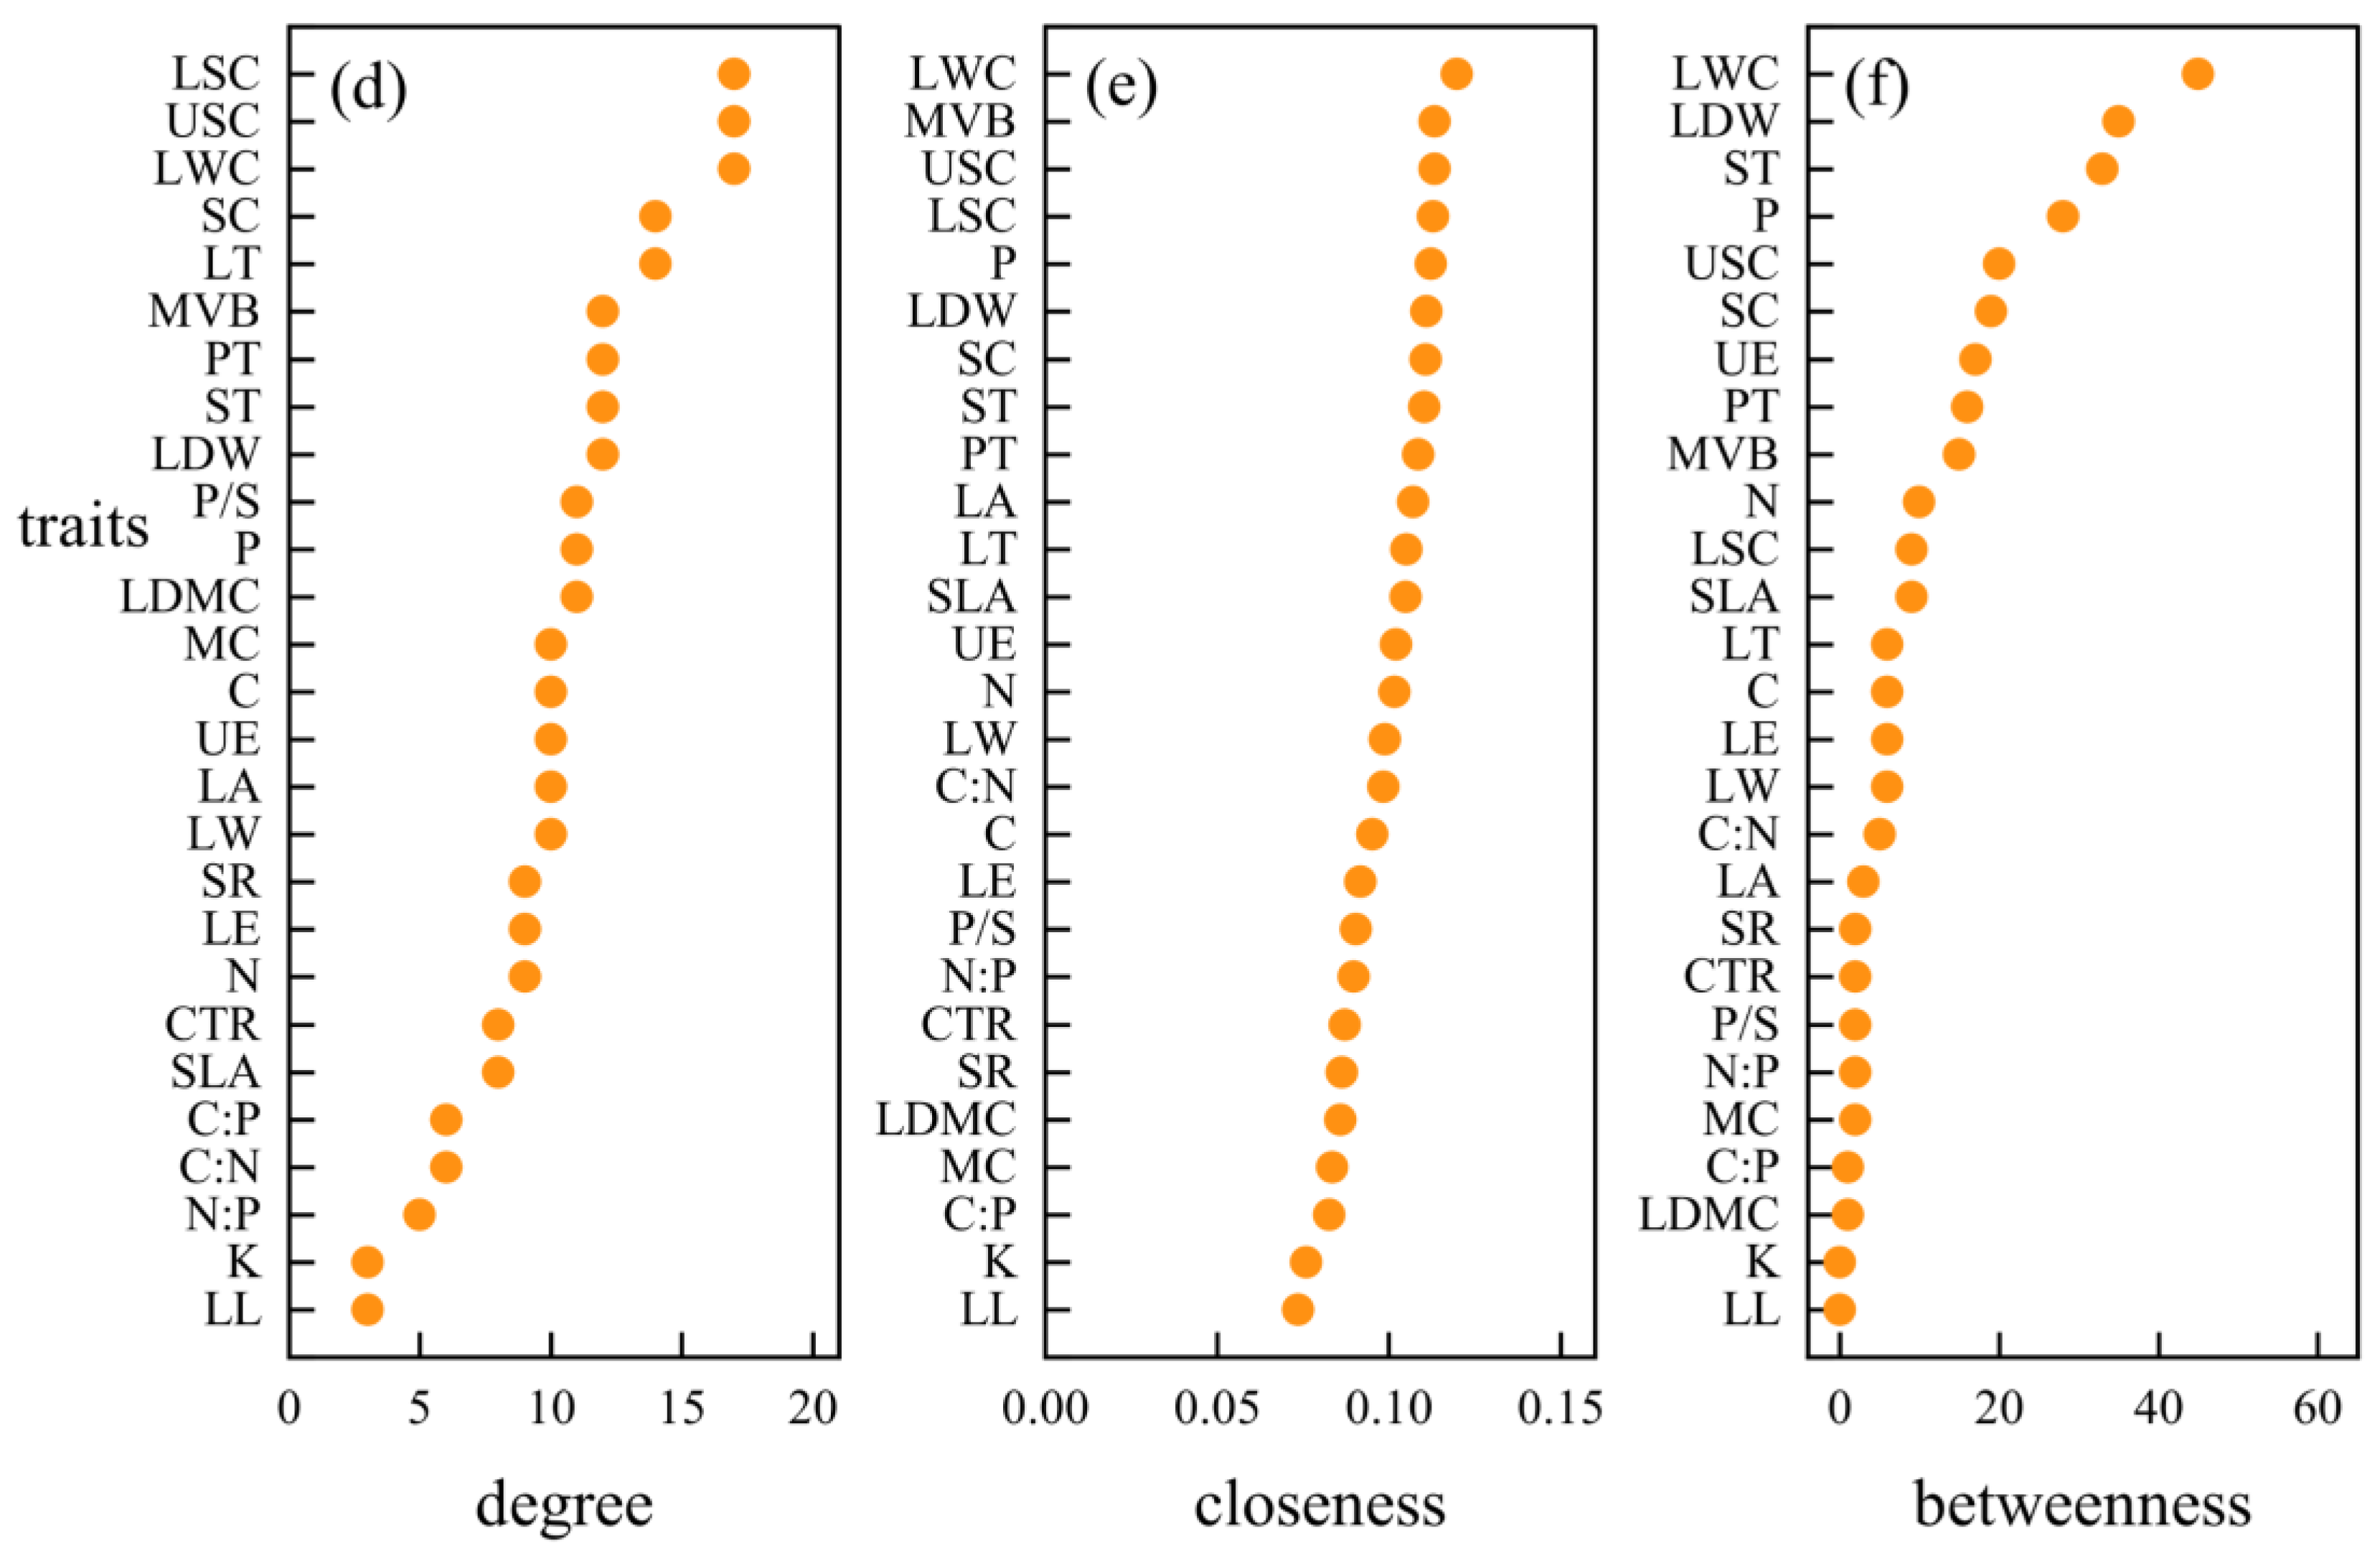
3.3. Hub Traits of Leaf Trait Networks in Different arid Regions

The roles of the different traits in the LTNs are identified through the network parameters [15]; different leaf traits have different degrees of importance in the network. In the hyper-arid region (Figure 9), some leaf traits, such as the upper and lower cuticle thickness, palisade tissue thickness, leaf thickness, palisade/sponge tissue ratio, and midvein vascular bundle area (LSC, USC, PT, LT, P/S, and MVB), exhibit a high degree and closeness in the leaf trait network. Sponge tissue thickness (ST), upper epidermis thickness (UE), and leaf length (LL) exhibit high betweenness in the hyper-arid region network. In the arid region (Figure 8), leaf traits such as lower cuticle thickness, leaf water content, sclerenchyma area, leaf thickness, and midvein vascular bundle area (LSC, USC, LWC, SC, LT, and MVB) exhibit a high degree and closeness in the leaf trait network. Leaf water content (LWC), leaf dry weight (LDW), and sponge tissue (ST) exhibit high betweenness in the arid region network. From the overall perspective of the network, most of the traits between the hyper-arid region and arid region are positively correlated. Among the three types of traits in the hyper-arid region (Figure 10), the leaf anatomical structure traits are the most important part of the network, and the degree of anatomical structure traits is significantly higher than that of the other two types of traits. The closeness of the anatomical structure traits is also significantly higher than that of the other two types of traits in the hyper-arid region. Only the leaf anatomical structure traits are significantly higher than the leaf stoichiometry traits in the arid region (Figure 10). In the analysis of the specific leaf traits contained within each module in the network (Table A2), the traits with the same color represent the same functional module in the leaf trait network. Most of the leaf anatomical structure traits in the hyper-arid and arid regions are in the same module, and the leaf traits interact with each other. Overall, the module in the hyper-arid region is simpler than that in the arid region.

4. Discussion

4.1. Differences and Connections between Leaf Trait Networks of Populus euphratica in the Mainstream of the Tarim River

Network analysis provides an effective method for studying the correlations between leaf traits and for identifying hub traits in the network. The LTNs have a more complex topology from the upstream to the downstream regions of the mainstream of the Tarim River. The LTNs are tight and complex in the downstream region and are a loose combination of a few modules in the upstream region. Along the mainstream of the Tarim River, the edge density, average clustering coefficient, average path length, modularity, and diameter of the network decrease significantly. The LTNs with a higher diameter and average path length have greater overall independence between the traits and weaker synergies between the traits. The increase in modularity indicates that the functional modules are more clearly defined [4], with tight internal connections and loose external connections between the modules. The traits are divided into different modules to perform specific functions [15]. The correlation between the traits within a module is high, while the traits belonging to the other modules are relatively independent. The edge density and the average clustering coefficient of the leaf trait network decrease, indicating weaker synergies between the traits. The efficiency of resource utilization and the production efficiency of the leaves decrease. The decrease in the average clustering coefficient means that the traits tend to work in a decentralized manner rather than forming functional modules to achieve specific functions. The reason for the differences in the network in the different reaches of the mainstream of the Tarim River is likely the different water environments in the upstream, midstream, and downstream regions of the mainstream of the Tarim River. The upstream and midstream regions have abundant water, while the downstream region has river breaches [35]. In the past 50 years, the annual runoff has shown a significant decreasing trend which is more prominent in the downstream region than in the upstream region [36]. Moreover, excessive reclamation and reservoir water storage in the upstream and midstream regions have consumed a large amount of water resources in the Tarim River, resulting in the partial drying up of the downstream Tarim River channel [37]. This has affected the amount of water in the downstream region. The decrease in water has made the already arid and water-scarce downstream environment even worse and has affected the growth of the Populus euphratica. Therefore, the leaf trait network of the Populus euphratica varies along different reaches of the mainstream of the Tarim River. In other words, the coordination between the traits within the leaf trait network of the Populus euphratica along the mainstream of the Tarim River decreases, and the connections between the trait functional modules are relatively weak. The network as a whole is loose, with only local clustering. There is a trend of tight internal connections and loose external connections between the modules along the river.

4.2. Highly Correlated Traits in the Leaf Trait Networks of the Mainstream of the Tarim River

The environmental selection of functional traits with high connectivity in LTNs may affect the entire phenotype [15]. When quantifying the importance of the traits within the LTNs through node parameters, namely, their connectivity and centrality, traits with high degree (k) and closeness (C) can be considered “hub traits” within the networks [16]. The traits with the highest degree connections are those that are most highly correlated with other traits in the network, suggesting that the trait may have a regulatory effect on the entire phenotype [38] and play a central role in the network.
The thickness of the upstream palisade tissue, the cell tension ratio of the leaves, the thickness of the leaves, and the mucilage cell area have high degrees and closeness in the network; thus, they are important central traits in the upstream leaf network. This indicates that these traits have the most connections and that they have closer relationships with the other traits in the network. These traits enhance the water-holding and water-retaining capacity of the leaves; there are many mucilage cells in the palisade tissue and mesophyll to reduce the cell osmotic potential, which is beneficial for plants when absorbing water and maintaining water in the leaves [39]. The midstream regions are mainly centered on C:P, water content, and N:P, which have a greater impact on the leaves. The water conditions affect the stoichiometry of carbon, nitrogen, and phosphorus in the leaves of Populus euphratica [40]. Populus euphratica has adapted to the absorption of nutrients through long-term evolution under conditions of non-severe water limitation and relative nutrient deficiency [41]. The downstream mucilage cell area, spongy ratio, cell tension ratio, C:N, and sponge tissue thickness have high degrees and closeness, and the amount of water downstream is significantly reduced compared to in the upstream and midstream regions [37]. The arid and water-scarce environment has a great impact on the leaf traits of Populus euphratica. In addition to regulating the thickness of the sponge tissue, which regulates gas exchange in photosynthesis [42], the leaves also reduce water evaporation by regulating the cell tension ratio and spongy ratio of the structure, thereby increasing their ability to regulate physiological drought and resist harsh environments. Changes in the river water environment will affect the selection of leaf traits in Populus euphratica, but, overall, the traits related to leaf thickness and photosynthesis (such as palisade sponge tissue, cell tension ratio, leaf thickness, and leaf water content) are regulated and selected based on the different water environments in different river reaches, which may affect the trade-offs between the leaf traits and structures.
Among the overall leaf network traits of the mainstream of the Tarim River, the structural organization related to leaf water transport and water retention, particularly that of the thickness of the upper and lower stratum corneum and the area of the midvein vascular bundles (LSC, USC, and MVB), is the central trait of the leaf network traits of the entire Tarim River’s Populus euphratica. The cuticle is the main protective tissue of plant leaves, and plant water is mainly evaporated through the epidermal cuticle. A well-developed cuticle can prevent excessive water transpiration in plants. Plants growing in arid environments usually regulate water by increasing the thickness of the thick cuticle [43]. The thickness of the cuticle varies depending on the environment in which it is distributed [44]. The midvein vascular bundles are the conducting tissues of leaves and are important intermediate structures connecting the leaves and the main stem and underground roots of plants. They can absorb and transport water to various tissues of the leaves and are the main structures used by Populus euphratica leaves to adapt to environmental changes [45]; this is consistent with previous observations regarding the anatomical structure of Populus euphratica leaves. However, the leaf dry weight (LDW) and leaf water content (LWC) have extremely high centrality, that is, high betweenness, and such traits can act as bridges and intermediaries in the network by connecting other traits belonging to different modules.
In arid and semi-arid ecosystems, water is the most important limiting factor for plants [46,47], and changes in resource utilization efficiency are mediated by regulating the water and nutritional traits [48]. Therefore, changes in leaf dry weight and water content play a mediating role in this process. Arid desert plants rely heavily on their own structure to regulate the water balance to adapt to the environment, which explains why the betweenness of these two factors is high.

4.3. The Connections and Differences between Leaf Trait Networks in Different Arid Regions

LTNs in hyper-arid regions have simpler topological structures, and the LTNs in hyper-arid regions are looser networks with fewer modules compared to those in arid regions. Compared to the LTNs in arid regions, the LTNs in hyper-arid regions have a higher average path length and modularity in this study. Compared to hyper-arid regions, arid regions have a higher edge density and shorter average path length; so, leaf traits in arid regions are more coordinated than those in hyper-arid regions. The overall coordination between leaf network traits in hyper-arid regions and arid regions is weaker, and the independence between the traits is high. The internal connectivity of the network functional modules in the hyper-arid regions is tighter than that in the arid regions, while the external connectivity is loose. Only specific traits in specific functional modules have good coordination. The coordination between traits in arid regions is slightly better than that in hyper-arid regions. Plants will reduce the variation in specific traits, making the traits disconnected; this results in the poor connectivity of the entire network. This is consistent with previous research results [49]. The highly modularized leaf multi-traits in hyper-arid regions can provide greater flexibility to the drought resistance of Populus euphratica leaves, allowing them to adapt to changing environments.

4.4. Important Node Parameters of Leaf Trait Networks in Different arid Regions

In the leaf trait network of hyper-arid regions, the other traits with the highest degree and closeness are the lower cuticle thickness (LSC) and upper cuticle thickness (USC). The hub traits vary slightly in different arid regions. The traits related to leaf water retention and photosynthesis, as well as the transport tissues (lower cuticle thickness, LSC; upper cuticle thickness, USC; palisade tissue thickness, PT; leaf thickness, LT; palisade tissue/spongy tissue ratio, P/S; and midvein vascular bundle area, MVB), have a high degree and closeness. On the one hand, Populus euphratica can prolong the distance from the vascular bundles to the epidermis by increasing leaf thickness [23,50], and, on the other hand, it can control transpiration by increasing the thickness of the cuticle, thereby reducing water loss [51]. At the same time, Populus euphratica greatly increases the photosynthetic area of plants by increasing the development of the palisade tissues in the leaves to meet the plant’s nutrient requirements. Previous studies have found that an increased leaf palisade tissue/spongy tissue ratio and light intensity in more arid habitats can increase the thickness of the palisade tissue, palisade tissue/spongy tissue ratio, and other traits [52]. The well-developed palisade tissue is beneficial for leaf photosynthesis, which provides energy for other functions and better resists stress in arid environments. Therefore, in hyper-arid regions, traits that mitigate water loss and enhance photosynthesis are strongly correlated with other functional traits. Within the leaf trait network of hyper-arid regions, spongy tissue (ST) exhibits the highest betweenness centrality. It plays a crucial role in regulating stomatal opening, influencing plant gas exchange under drought conditions, and maintaining water within the leaf [53]. Although stomatal activity is limited under drought conditions, the structure and function of the spongy tissue help to optimize photosynthesis and ensure that plants can effectively photosynthesize under limited water conditions [54]. In addition, the spongy tissue and palisade tissue are constantly transporting substances between each other, and spongy tissue plays a bridging role in gas exchange, photosynthesis, and material transport. It couples various traits in different functional modules and plays an important role in the leaf network traits in hyper-arid regions; thus, it has the highest betweenness.
In the leaf trait network of arid regions, there is a high degree and closeness between leaf thickness and the water change traits, lower leaf cuticle thickness, leaf water content, sclerenchyma area, and leaf thickness (LSC, USC, LWC, SC, and LT). As in the hyper-arid regions, leaves in the leaf trait network of arid regions also control transpiration and reduce water loss through leaf thickness and cuticle thickness. In addition, leaf water content affects morphogenesis and physiological and biochemical processes. In desert ecosystems, water is the most important environmental limiting factor affecting plant distribution and growth [55]. The leaf water content (LWC) of Populus euphratica is highly correlated with the other traits, reflecting the adaptation of leaves to arid climates and environments in terms of water physiology. The developed vein sclerenchyma can increase mechanical strength and reduce the physical damage and adverse effects caused by water loss and wilting [56]. Sclerenchyma reduces water evaporation by thickening cell walls to help leaves maintain water under drought conditions [57]. In the case of insufficient water, sclerenchyma can also provide additional mechanical support to leaves to help maintain their structural integrity while also reducing the direct physical damage to cells caused by environmental pressures such as drought; thus, it enhances their adaptability [58]. In the leaf trait network of arid regions, leaf water content (LWC) has the highest betweenness, and Populus euphratica leaves can link various traits by regulating water. Under low-water conditions, desert plant leaves perform similar functions to maintain physiological activities and improve their survival and growth possibilities.

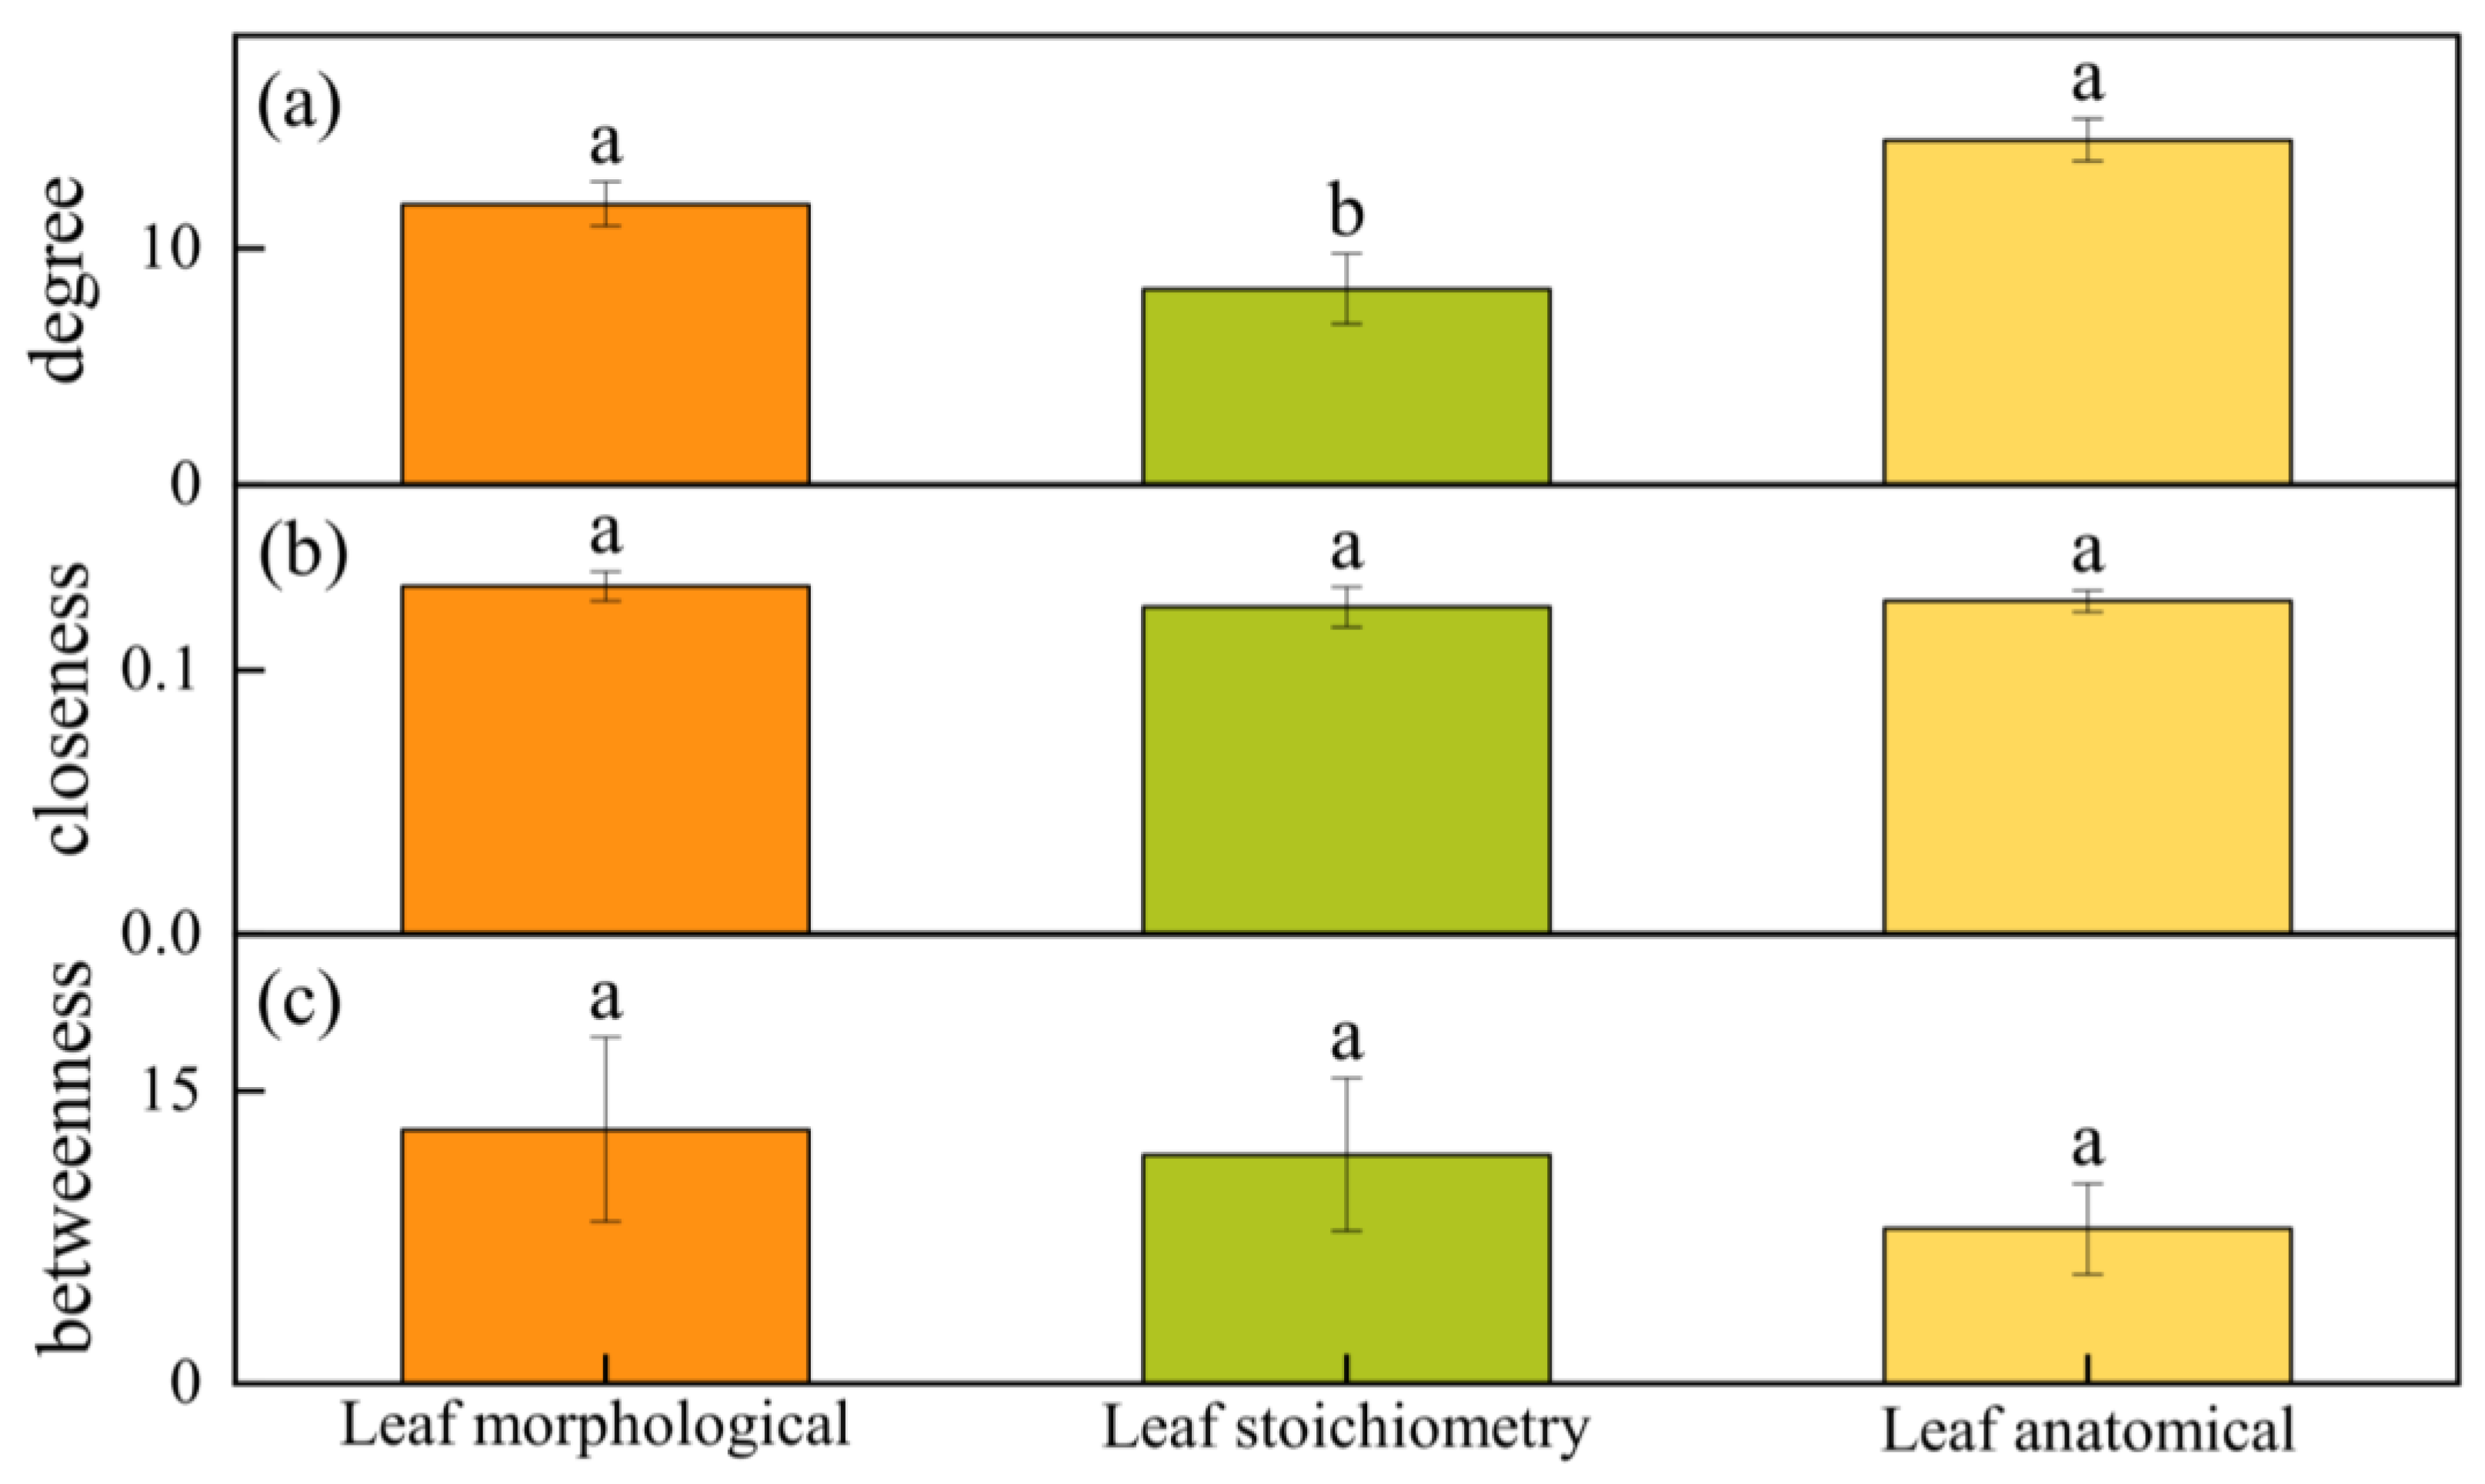
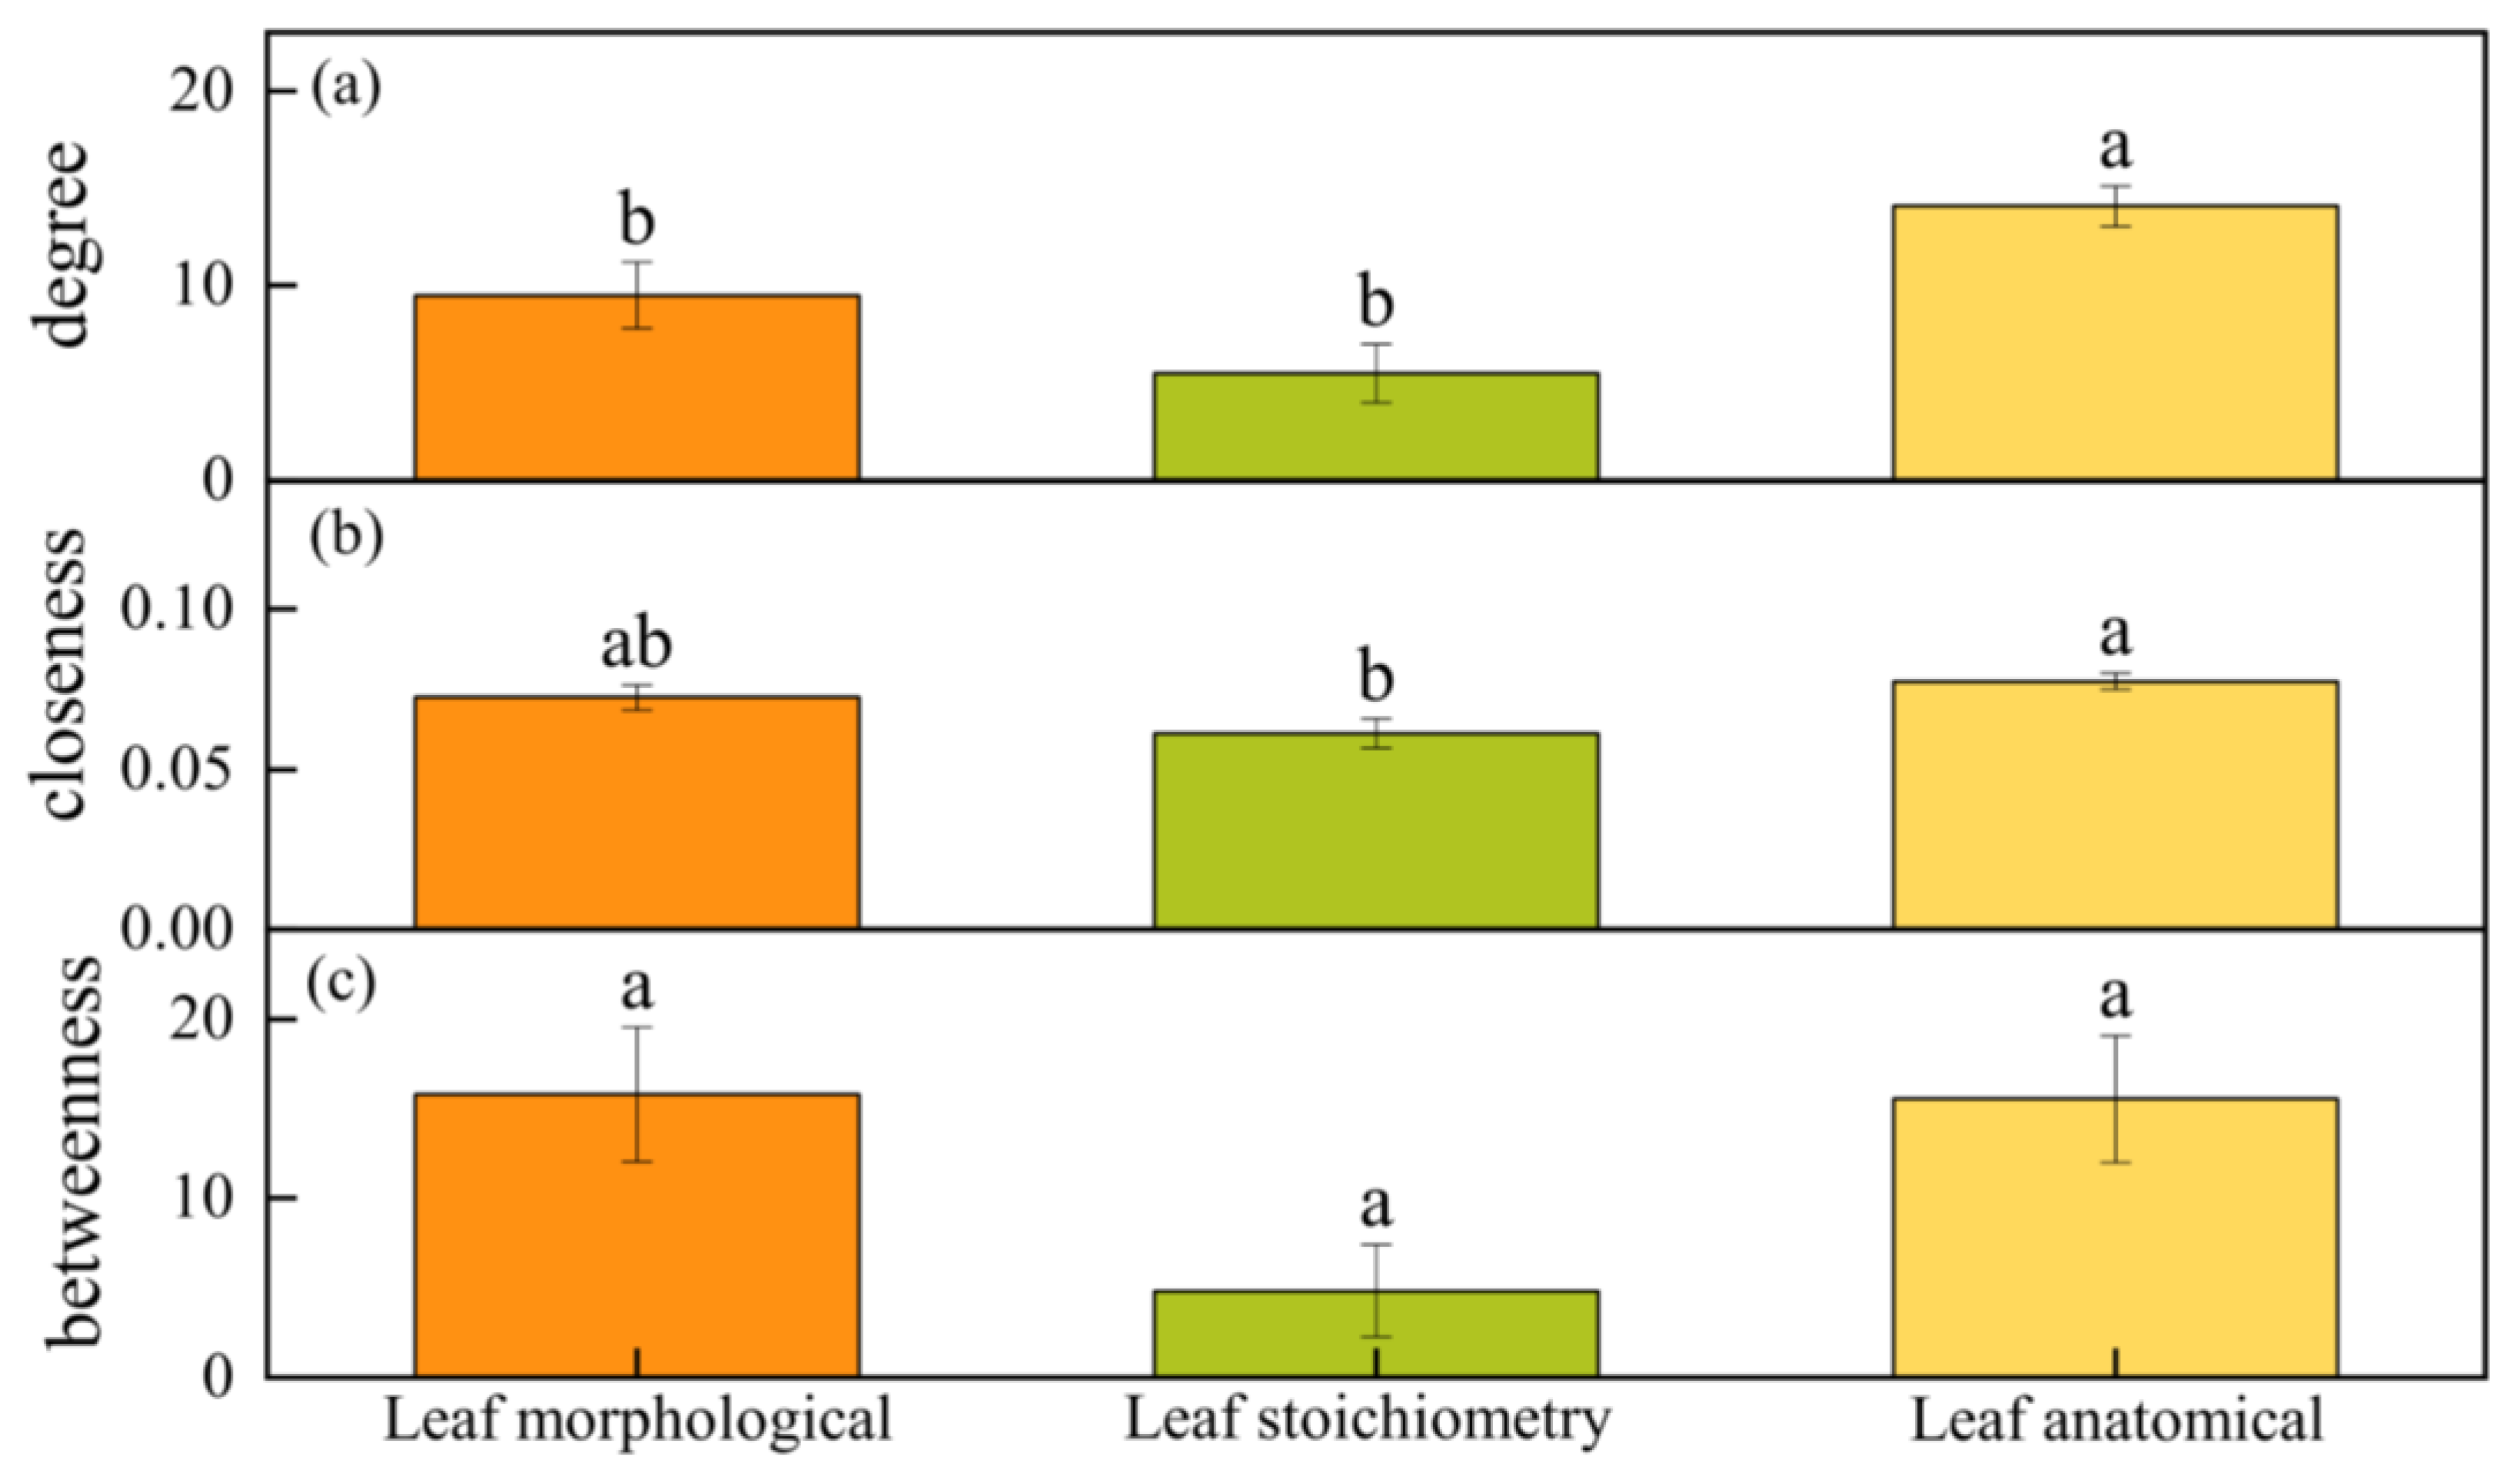
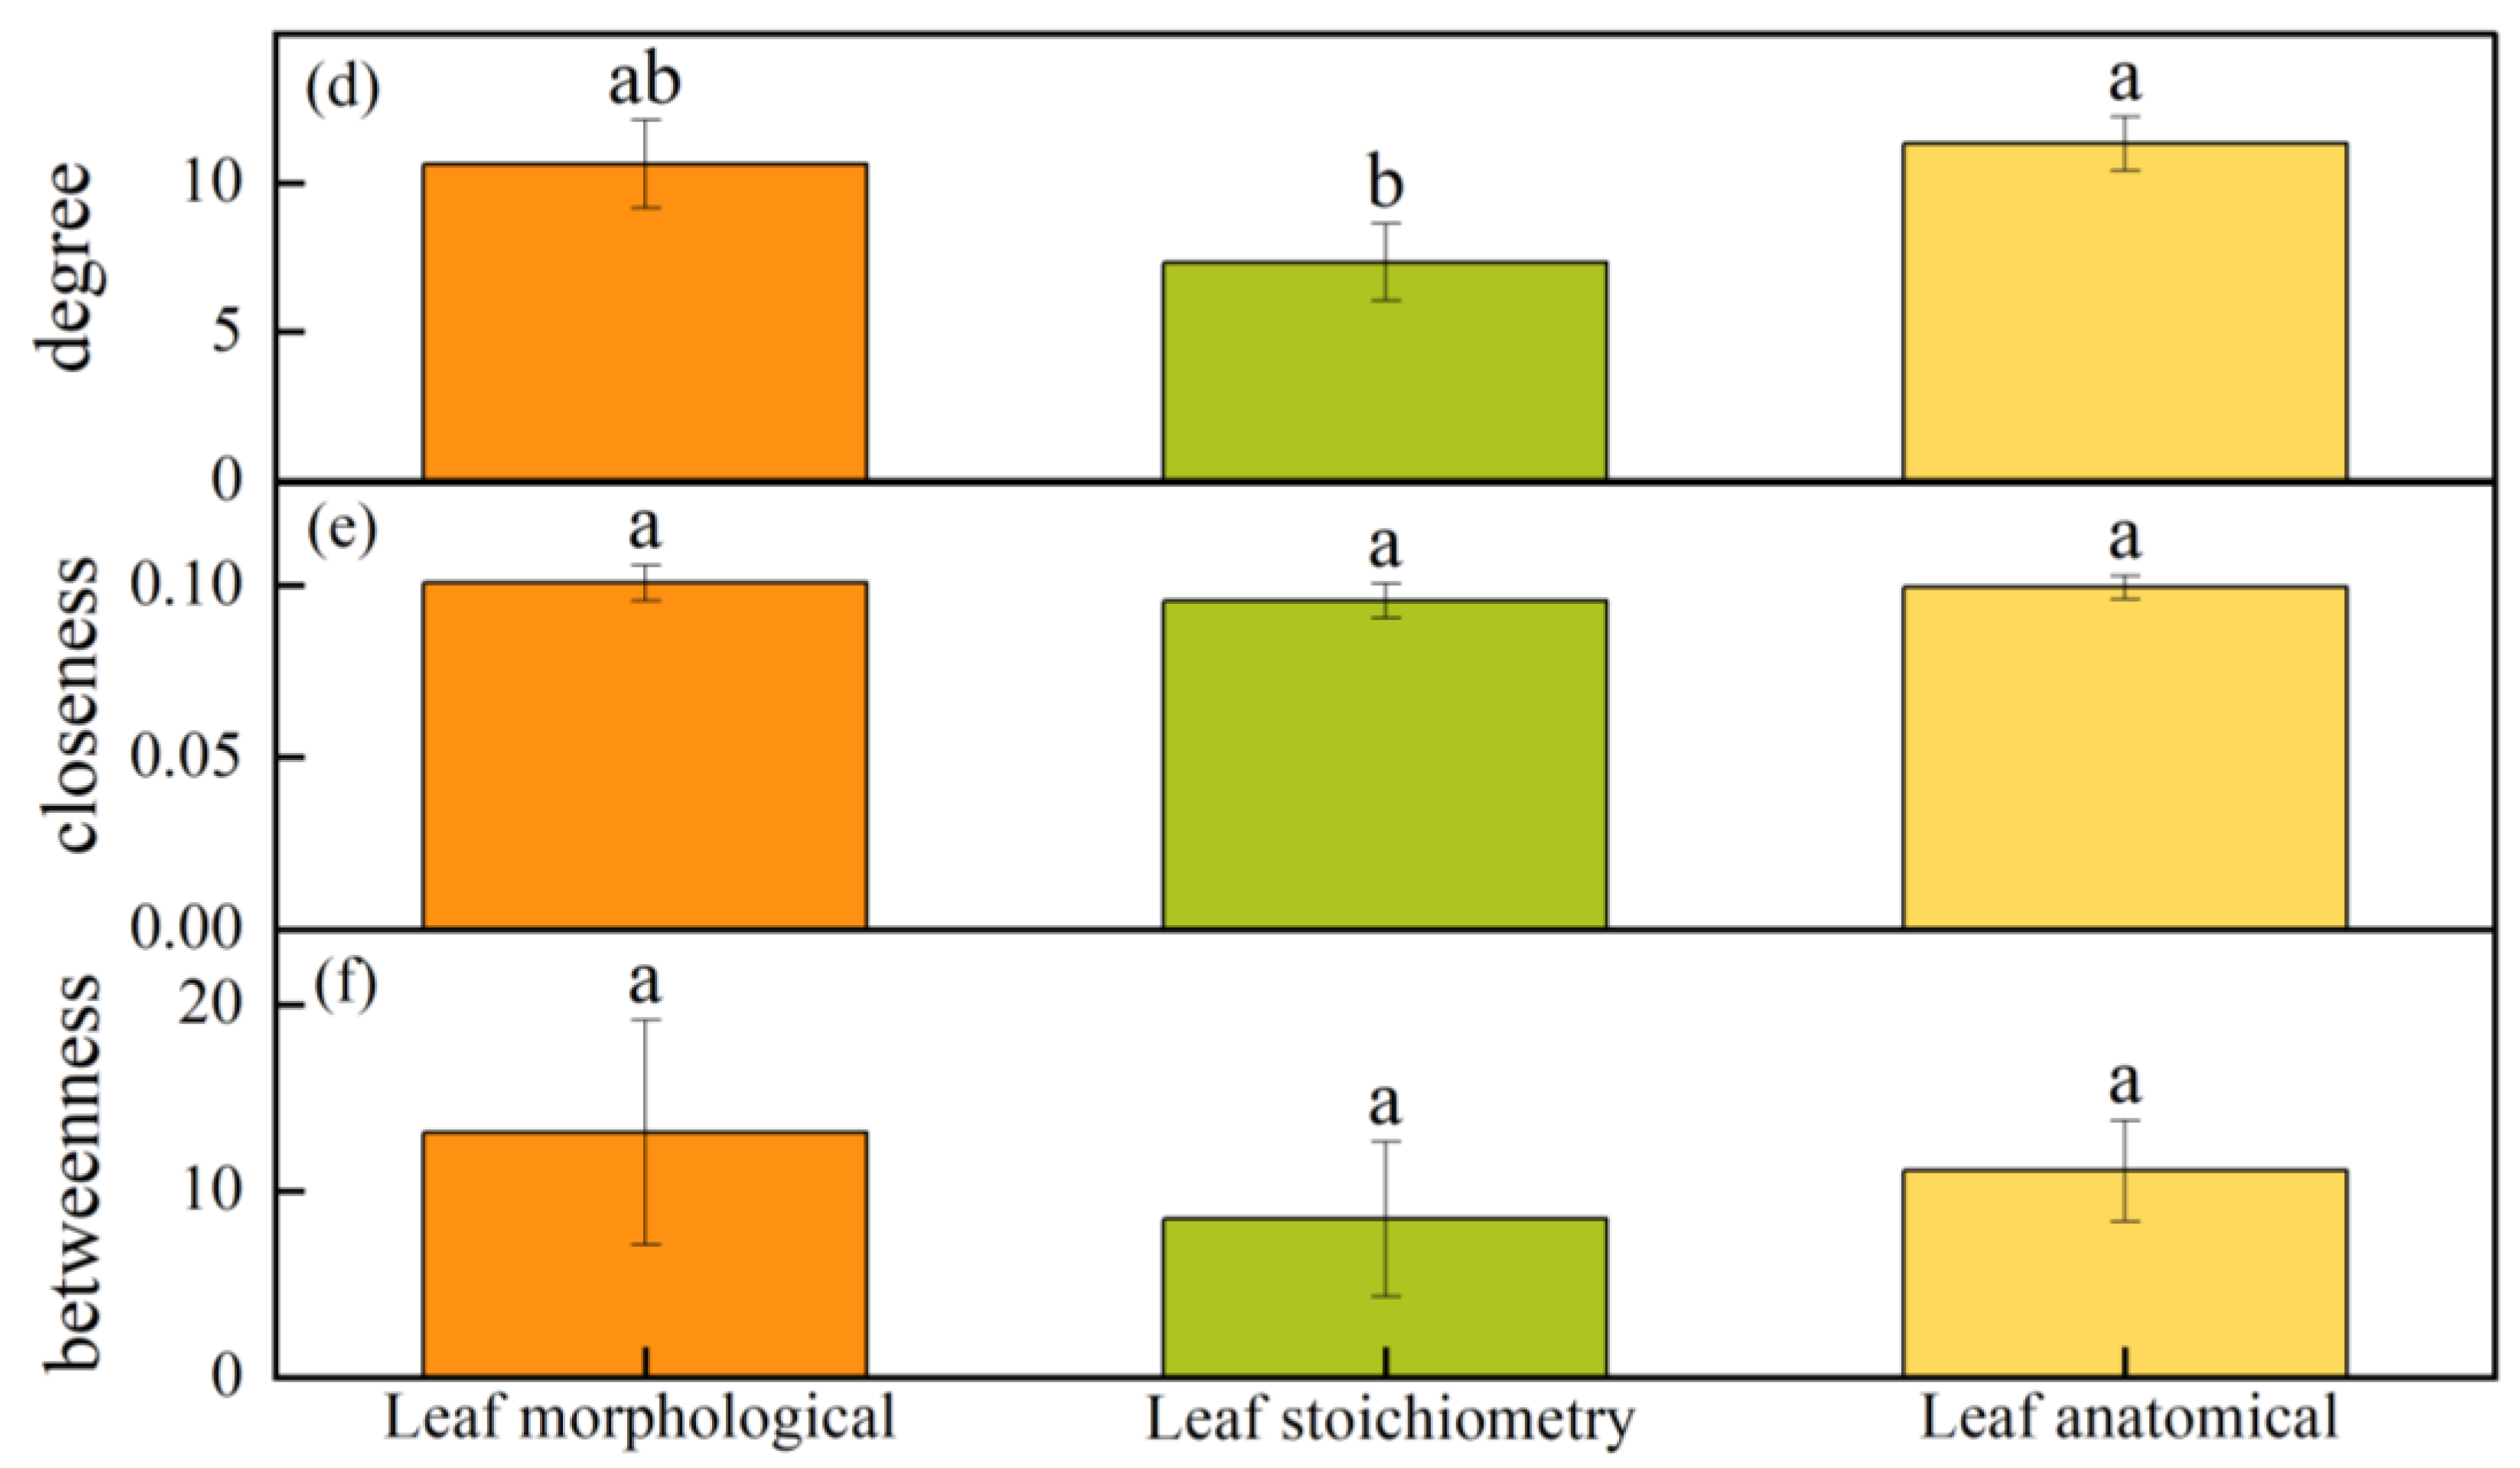
4.5. Comparison of Morphological, Anatomical, and Stoichiometry Traits in the Network Characteristics of Populus euphratica Leaves

In the leaf trait network of the entire Tarim River study area, the degree of the leaf anatomical structure and morphology is significantly higher than that of the stoichiometry trait, and the leaf structure and morphological traits are more important than the stoichiometry traits. The Tarim River desert riparian Populus euphratica forest is located in an arid region with a hot climate and a relatively scarce water supply [25]. Therefore, plants prioritize strengthening the links between the leaf morphological and structural traits and improving the robustness of the leaf structure, which can reduce the physical damage caused by drought; thus, they can adapt to drought stress and maintain their normal survival and growth.
In hyper-arid and arid regions, the degree values of the anatomical traits are significantly higher than those of the morphological and stoichiometry traits, indicating that Populus euphratica invests more resources in leaf structural traits to help the leaves resist the hot and dry environment in arid environments. However, there are differences between the hyper-arid and arid regions in terms of module composition, and the correlation and association between the traits within modules may be influenced by external environmental factors, resulting in an inconsistent clustering of traits. This will lead to the connection of key related characteristics in leaf anatomical structures to optimize resource allocation [10]. For example, the leaf morphological traits (LL: leaf length; LW: leaf width; LA: single leaf area; and LDW: single leaf dry weight) in hyper-arid regions belong to the same module but belong to different modules in arid regions. In addition, some plant trait combinations (such as ST: spongy tissue; PT: palisade tissue; and P:S ratio) are not always in the same module. This suggests that different trait combinations can produce equivalent fitness values to adapt to the environment [59]. Therefore, plants can adapt to the environment through alternative strategies, that is, through modularizing different traits to produce corresponding functions, allowing flexibility between traits in order to adapt to changing environments. It can be predicted that, against the background of global change, the flexible regulation of leaf trait networks in Populus euphratica will help it to respond quickly to climate change and to form new adaptive characteristics.

5. Conclusions

In the study of the leaf trait network of Populus euphratica in the mainstream of the Tarim River, the results show that the coordination between the internal traits gradually weakened from the upstream to the downstream reaches in the leaf trait network; the internal connections of the leaf trait modules were tight from the upstream to the downstream reaches, while the external connections were loose, indicating a trend towards overall looseness with local aggregation. Compared to arid regions, hyper-arid regions exhibit higher overall independence among traits with fewer modules and a simpler topological structure. The network’s internal connections are tighter in hyper-arid regions, suggesting that leaves in these regions are more likely to resist drought stress by coordinating specific traits into functional modules for specific functions. Central traits of the Populus euphratica leaf trait network, identified through node parameters, include leaf thickness and photosynthesis traits as key traits across different reaches of the Tarim River. In hyper-arid regions, the thickness of sponge tissue acts as a bridge, coupling various traits across different functional modules. In arid regions, traits are interconnected through their regulation of leaf water content in Populus euphratica. Overall, the leaf structure of Populus euphratica is more important than leaf nutrition under drought conditions, and the relationship between structural traits is prioritized in both hyper-arid and arid regions. The changes in trait modules suggest that Populus euphratica leaves can employ trait substitution strategies to modularize different traits for corresponding functions to adapt to varying environments.
In summary, this research offers an effective method for exploring the adaptation strategies of Populus euphratica leaves to drought conditions through leaf trait networks.

Author Contributions

This collaborative work was carried out by all the authors. W.H. and S.Y. proposed the original idea; S.Y., J.W., C.P. and S.S. performed the experiments; S.Y. wrote the original draft; W.H., Y.L. and P.J. reviewed the manuscript. All authors have read and agreed to the published version of the manuscript.

Funding

This work was financially supported by the National Natural Science Foundation of China, “leaf traits of major species of Populus euphratica community in Tarim River Basin and their relationship with environmental factors” (31160110); the National Natural Science Foundation of China regional fund project “molecular regulatory network and functional gene mining of Populus euphratica heteromorphic leaf development” (32160355); and “XPCC talents” second cycle talent project, open project of the Key Laboratory for conservation and utilization of biological resources in Tarim Basin (BRFW2101).

Data Availability Statement

The datasets generated for this study are available on request to the corresponding author. Data are available in a publicly accessible repository, and the (AI) data presented in this study are openly available in Version 3 of the Global Aridity Index and Potential Evapotranspiration Database, 2022, Plant Data Center of Chinese Academy of Sciences, https://www.plantplus.cn/doi/doi.org/10.6084, accessed on 21 October 2023, CSTR:34735.11.PLANTDATA.0065.

Acknowledgments

The authors are grateful to Tarim University for technical service and support in the research area and to the Key Laboratory of Protection and Utilization of Biological Resources in Tarim Basin of Xinjiang Production & Construction Corps for providing equipment. The authors acknowledge the data support from the Plant Data Center of Chinese Academy of Sciences (https://www.plantplus.cn).

Conflicts of Interest

The authors declare that this research was conducted in the absence of any commercial or financial relationship that could be construed as a potential conflict of interest.

Appendix A

Table A1. Information of the sample plots.
ReachesRegionsSample PointLongitude/°ELatitude/°NAltitude/m
upstreamaridU180.91641.1371084
hyper aridU280.94440.4371025
hyper aridU381.15540.4251018
aridU481.640.7571001
aridU581.92940.654994
midstreamaridM182.15240.845988
aridM282.34341.053978
aridM382.74340.963970
aridM483.01540.904962
aridM583.16241.052957
aridM683.31641.006955
aridM784.20241.3932
aridM884.21341.245934
aridM984.23841.172933
downstreamaridD185.12741.994974
hyper aridD286.16341.19891
hyper aridD386.84340.924874
hyper aridD487.07640.894868
hyper aridD587.54140.645856
hyper aridD687.90440.454845
Remarks: “U” represents upstream, “M” represents midstream, and “D” represents downstream.
Table A2. Variation in leaf trait network module composition.
CategoryTraitsHyper AridAridTotal
Leaf morphologyLL
LW
LA
LDW
LWC
LDMC
SLA
LT
Leaf stoichiometryN
K
C
P
N:P
C:N
C:P
Leaf anatomyST
UE
LE
MC
PT
USC
LSC
MVB
SC
P/S
CTR
SR
Remarks: the traits with the same color represent the same functional module in the leaf trait network (LL: leaf length, LW: leaf width, LA: leaf area, LDW: leaf dry weight, LWC: leaf water content, LDMC: leaf dry matter content, SLA: specific leaf area, LT: leaf thickness, N: leaf nitrogen concentration, C: leaf carbon concentration, P: leaf phosphorus concentration, K: leaf potassium concentration, N/P: nitrogen–phosphorus ratio, C:N: carbon–nitrogen ratio, C:P: carbon–phosphorus ratio, ST: spongy tissue, UE: upper epidermis thickness, LE: lower epidermis thickness, MC: mucilage cell, PT: palisade tissue, USC: upper stratum corneum, LSC: lower stratum corneum, MVB: midvein vascular bundle, SC: sclerenchyma, P/S: palisade tissue/spongy tissue, CTR: cell tension ratio, SR: spongy ratio).

References

  1. Diaz, S.; Cabido, M. Vive la difference: Plant functional diversity matters to ecosystem processes. Trends Ecol. Evol. 2001, 16, 646–655. [Google Scholar] [CrossRef]
  2. Violle, C.; Navas, M.L.; Vile, D.; Kazakou, E.; Fortunel, C.; Hummel, I.; Garnier, E. Let the concept of trait be functional. Oikos 2007, 116, 882–892. [Google Scholar] [CrossRef]
  3. Wang, H.; Harrison, S.P.; Li, M.; Prentice, I.C.; Qiao, S.; Wang, R.; Xu, H.; Mengoli, G.; Peng, Y.; Yang, Y. The China plant trait database version 2. Sci. Data 2022, 9, 769. [Google Scholar] [CrossRef] [PubMed]
  4. Yang, Y.; Wang, H.; Harrison, S.P.; Prentice, I.C.; Wright, I.J.; Peng, C.; Lin, G. Quantifying leaf-trait covariation and its controls across climates and biomes. New Phytol. 2019, 221, 155–168. [Google Scholar] [CrossRef] [PubMed]
  5. Cui, E.; Weng, E.; Yan, E.; Xia, J. Robust leaf trait relationships across species under global environmental changes. Nat. Commun. 2020, 11, 2999. [Google Scholar] [CrossRef] [PubMed]
  6. Rawat, M.; Arunachalam, K.; Arunachalam, A.; Alatalo, J.M.; Pandey, R. Assessment of leaf morphological, physiological, chemical and stoichiometry functional traits for understanding the functioning of Himalayan temperate forest ecosystem. Sci. Rep. 2021, 11, 23807. [Google Scholar] [CrossRef] [PubMed]
  7. He, N.; Li, Y.; Liu, C.; Xu, L.; Li, M.; Zhang, J.; He, J.; Tang, Z.; Han, X.; Ye, Q.; et al. Plant trait networks: Improved resolution of the dimensionality of adaptation. Trends Ecol. Evol. 2020, 35, 908–918. [Google Scholar] [CrossRef] [PubMed]
  8. Freschet, G.T.; Kichenin, E.; Wardle, D.A. Explaining within-community variation in plant biomass allocation: A balance between organ biomass and morphology above vs below ground? J. Veg. Sci. 2015, 26, 431–440. [Google Scholar] [CrossRef]
  9. Niklas, K.J.; Shi, P.; Gielis, J.; Schrader, J.; Niinemets, Ü. Editorial: Leaf functional traits: Ecological and evolutionary implications. Front. Plant Sci. 2023, 14, 1169558. [Google Scholar] [CrossRef]
  10. Wright, I.J.; Reich, P.B.; Westoby, M.; Ackerly, D.; Baruch, Z.; Bongers, F.; Cavender-Bares, J.; Chapin, T.; Cornelissen, J.H.; Diemer, M.; et al. The worldwide leaf economics spectrum. Nature 2004, 428, 821–827. [Google Scholar] [CrossRef]
  11. Lourens, P.; Frans, B. Leaf traits are good predictors of plant performance across 53 rain forest species. Ecology 2006, 87, 1733–1743. [Google Scholar]
  12. Domínguez, M.T.; Aponte, C.; Pérez-Ramos, I.M.; García, L.V.; Villar, R.; Marañón, T. Relationships between leaf morphological traits, nutrient concentrations and isotopic signatures for Mediterranean woody plant species and communities. Plant Soil 2012, 357, 407–424. [Google Scholar] [CrossRef]
  13. Li, X.; Zhai, J.; Li, Z. Morphological and physiological differences in heteromorphic leaves of male and female Populus euphratica Oliv. J. Arid Land 2022, 14, 1456–1469. [Google Scholar] [CrossRef]
  14. Zhai, J.; Li, Z.; Si, J.; Zhang, S.; Han, X.; Chen, X. Structural and Functional Responses of the Heteromorphic Leaves of Different Tree Heights on Populus euphratica Oliv. to Different Soil Moisture Conditions. Plants 2022, 11, 2376. [Google Scholar] [CrossRef] [PubMed]
  15. Li, Y.; Liu, C.; Xu, L.; Li, M.; Zhang, J.; He, N. Leaf trait networks based on global data: Representing variation and adaptation in plants. Front. Plant Sci. 2021, 12, 710530. [Google Scholar] [CrossRef] [PubMed]
  16. Kleyer, M.; Trinogga, J.; Cebrianpiqueras, M.A.; Trenkamp, A.; Flojgaard, C.; Ejrnæs, R.; Bouma, T.J.; Minden, V.; Maier, M.; Mantilla-Contreras, J.; et al. Trait correlation network analysis identifies biomass allocation traits and stem specific length as hub traits in herbaceous perennial plants. J. Ecol. 2019, 107, 828–842. [Google Scholar] [CrossRef]
  17. Rao, Q.; Su, H.; Ruan, L.; Deng, X.; Wang, L.; Rao, X.; Liu, J.; Xia, W.; Xu, P.; Shen, H.; et al. Stoichiometric and physiological mechanisms that link hub traits of submerged macrophytes with ecosystem structure and functioning. Water Res. 2021, 202, 117392. [Google Scholar] [CrossRef] [PubMed]
  18. Wang, L.; Rao, Q.; Su, H.; Ruan, L.; Deng, X.; Liu, J.; Chen, J.; Xie, P. Linking the network topology of plant traits with community structure, functioning, and adaptive strategies of submerged macrophytes. Sci. Total Environ. 2022, 850, 158092. [Google Scholar] [CrossRef] [PubMed]
  19. Zhu, Y.; Yan, X.X.; Kong, M.; Tong, Q.; Li, Y.; Huang, G.; Li, Y. Industry-environment system management based on an uncertain Gaussian diffusion optimization model for coal-dependent cities in ecologically fragile areas. J. Clean. Prod. 2022, 234, 832–857. [Google Scholar] [CrossRef]
  20. Cui, C.; Guo, Y.; Shen, Y.J. Spatio-temporal variation in and the driving factors of desert vegetation in Xinjiang. Chin. J. Eco-Agric. 2021, 29, 1668–1678. [Google Scholar]
  21. Cao, D.; Li, J.; Huang, Z.; Baskin, C.C.; Baskin, J.M.; Hao, P.; Zhou, W.; Li, J. Reproductive characteristics of a Populus euphratica population and prospects for its restoration in China. PLoS ONE 2012, 7, e39121. [Google Scholar] [CrossRef]
  22. Yang, L.W.; He, B.Y.; Huang, P.Y. Assessment of ecological service values for native Populus euphratica forest in Khotan watershed. Acta Ecol. Sin. 2006, 26, 681–689. [Google Scholar]
  23. Huang, W.J.; Li, Z.J.; Yang, Z.P.; Bai, G.Z. The structural traits of Populus euphratica heteromorphic leaves and their correlations. Acta Ecol. Sin. 2010, 30, 4636–4642. [Google Scholar]
  24. Zhai, J.; Zhang, X.; Li, Z.; Han, X.; Zhang, S. Differences in the Functional Traits of Populus pruinosa Leaves in Different Developmental Stages. Plants 2023, 12, 2262. [Google Scholar] [CrossRef] [PubMed]
  25. Fu, A.; Chen, Y.; Li, W. Assessment on ecosystem health in the Tarim River Basin. Acta Ecol. Sin. 2009, 29, 2418–2426. [Google Scholar]
  26. Chen, Y.N.; Li, W.H.; Chen, Y.P.; Xu, C. Water conveyance in dried-up river way and ecological restoration in the lower reaches of Tarim river, China. Shengtai Xuebao Acta Ecol. Sin. 2007, 27, 0538–0554. [Google Scholar]
  27. Nelson, P.W.; Sommers, C.; Page, A.L. Methods of Soil Analysis: Part 2. Chemical Methods; Soil Science Society of America: Madison, WI, USA, 1996. [Google Scholar]
  28. Sparks, D.L.; Page, A.L.; Helmke, P.A.; Loeppert, R.H.; Soltanpour, P.N.; Tabatabai, M.A.; Johnston, C.; Sumner, M. Methods of Soil Analysis: Part 3—Chemical Methods; Soil Science Society of America: Madison, WI, USA, 1996. [Google Scholar]
  29. Armbruster, W.S.; Pelabon, C.; Bolstad, G.H.; Hansen, T.F. Integrated phenotypes: Understanding trait covariation in plants and animals. Philos. Trans. R. Soc. Lond. B Biol. Sci. 2014, 369, 20130245. [Google Scholar] [CrossRef] [PubMed]
  30. Medeiros, C.D.; Scoffoni, C.; John, G.P.; Bartlett, M.K.; Inman-Narahari, F.; Ostertag, R.; Cordell, S.; Giardina, C.; Sack, L. An extensive suite of functional traits distinguishes Hawaiian wet and dry forests and enables prediction of species vital rates. Funct. Ecol. 2019, 33, 712–734. [Google Scholar] [CrossRef]
  31. Deng, Y.; Jiang, Y.H.; Yang, Y.; He, Z.; Luo, F.; Zhou, J. Molecular ecological network analyses. BMC Bioinform. 2012, 13, 113. [Google Scholar] [CrossRef] [PubMed]
  32. Zomer, R.; Trabucco, A. Source Code for: Global Aridity Index and Potential Evapotranspiration Database v3—(Python). 2022. Available online: https://www.google.com.hk/url?sa=t&rct=j&q=&esrc=s&source=web&cd=&ved=2ahUKEwiemtfhysCEAxU_m1YBHRRcBvsQFnoECA8QAQ&url=https%3A%2F%2Fwww.plantplus.cn%2Fcn%2Fdatasetexport%2Fexportxlxs%2F1512D26417FF6A38&usg=AOvVaw36jK8VFr09i1FdE3j_dEI9&opi=89978449 (accessed on 21 October 2023).
  33. Trabucco, A.; Zomer, R.J. Global Aridity Index and Potential Evapotranspiration (ET0) Climate Database v2 (Global_AI_PET_v2). 2019. Available online: https://figshare.com/articles/dataset/Global_Aridity_Index_and_Potential_Evapotranspiration_ET0_Climate_Database_v2/7504448/3 (accessed on 21 October 2023).
  34. Trabucco, A.; Zomer, R.J. Global Aridity Index and PET Database v1 (Global_AI_PET_v1). 2008. Available online: https://cgiarcsi.community/data/global-aridity-and-pet-database/ (accessed on 21 October 2023).
  35. Ling, H.; Xu, H.; Fu, J. Changes in intra-annual runoff and its response to climate change and human activities in the headstream areas of the Tarim River Basin China. Quat. Int. 2014, 336, 158–170. [Google Scholar] [CrossRef]
  36. Zhao, R.; Chen, Y.; Li, W.; Chen, Z.; Hao, X. Trends in Runoff Variations of the Mainstream of the Tarim River during the Last 50 Years. Resour. Sci. 2010, 32, 1196–1203. [Google Scholar]
  37. Yaning, C.; Weihong, L.; Changchun, X.; Zhaoxia, Y.; Yapeng, C. Desert riparian vegetation and groundwater in the lower reaches of the Tarim River basin. Environ. Earth Sci. 2015, 73, 547–558. [Google Scholar]
  38. Koschützki, D.; Schreiber, F. Centrality analysis methods for biological networks and their application to gene regulatory networks. Gene Regul. Syst. Biol. 2008, 2, 193–201. [Google Scholar]
  39. Yang, S.D.; Zheng, W.J.; Chen, G.C.; Zhang, C.L.; Chen, J.; Wang, X.C. Difference of Ultrastructure and Photosynthetic Characteristics between Lanceolate and Broad-ovate Leaves in Populus euphratica. Acta Bot. Boreali-Occident. Sin 2005, 25, 14–21. [Google Scholar]
  40. Zhang, X.; Zheng, Y. Variation in leaf carbon, nitrogen, and phosphorus stoichiometric characteristics of Populus euphratica along a vertical riverbank gradient and associated environmental explanation in a desert riparian area in China. Chin. J. Appl. Environ. Biol. 2023, 29, 1093–1099. [Google Scholar]
  41. Shi, J.-H.; Wang, X.-Y.; Liu, M.-X.; Ma, X.-X. Stoichiometric Characteristics of Leaves of Populus euphratica with Different Stand Ages and Soil. Arid Zone Res. 2017, 34, 815–822. [Google Scholar]
  42. Ji, R.-X.; Yu, X.; Chang, Y.; Shen, C.; Bai, X.-Q.; Xia, X.-L.; Yin, W.-L.; Liu, C. Geographical provenance variation of leaf anatomical structure of Caryopteris mongholica and its significance in response to environmental changes. Chin. J. Plant Ecol. 2020, 44, 277–286. [Google Scholar] [CrossRef]
  43. Kofidis, G.; Bosabalidis, A.M.; Chartzoulakis, K. Leaf anatomical alterations induced by drought stress in two avocado cultivars. J. Biol. Res. 2004, 1, 115–120. [Google Scholar]
  44. Huang, W.; Jiao, P.; Huang, J.; Zhang, D. Leaf Anatomical Structure of Populus euphratica in Tarim River Basin. Bull. Bot. Res. 2016, 36, 669–675. [Google Scholar]
  45. Dong, F.; Wang, W.; Cui, P.; Wang, J.; Zhang, T.; Li, J. Plasticity Response of Leaf Anatomical Characteristics of Populus euphratica in Different Soil Conditions. Acta Bot. Boreali-Occident. Sin. 2016, 36, 2047–2057. [Google Scholar]
  46. Haase, P.; Pugnaire, F.I.; Clark, S.C.; Incoll, L.D. Environmental control of canopy dynamics and photosynthetic rate in the evergreen tussock grass Stipa tenacissima. Plant Ecol. 1999, 145, 327–339. [Google Scholar] [CrossRef]
  47. Raich, J.W.; Rastetter, E.B.; Melillo, J.M.; Kicklighter, D.W.; Steudler, P.A.; Peterson, B.J.; Grace, A.L.; Moore, B.; Vorosmarty, C.J. Potential net primary productivity in South America: Application of a global model. Ecol. Appl. 1991, 1, 399–429. [Google Scholar] [CrossRef]
  48. Li, S.J.; Su, P.X.; Zhang, H.N.; Zhou, Z.J.; Xie, T.T. Characteristics and Relationships of Foliar Water and Leaf Functional Traits of Desert Plants. Plant Physiol. 2013, 49, 153–160. [Google Scholar]
  49. Li, Y.; Liu, C.; Sack, L.; Xu, L.; Li, M.; Zhang, J.; He, N. Leaf trait network architecture shifts with species-richness and climate across forests at continental scale. Ecol. Lett. 2022, 25, 1442–1457. [Google Scholar] [CrossRef] [PubMed]
  50. Dong, X.J.; Zhang, X.S. Some observations of the adaptations of sandy shrubs to the arid environment in the Mu Us sandland: Leaf water relations and anatomic features. J. Arid Environ. 2001, 48, 41–48. [Google Scholar] [CrossRef]
  51. Zhou, Z.S.; Li, L.; Wang, H.S.; Dong, J.G. Selecting of the plants constructing energy forest on loess plateau—Part I. Observation on the anatomic feature of 19 xero-morphic plants leaves through lens. Acta Conserv. Soli Aquae Sin. 1989, 3, 20–30. [Google Scholar]
  52. Yang, Y.N. Comparative study on anatomical structure of leaf of Magnolia sieboldii under different ecological habitats. J. Jilin Agric. Univ. 2010, 32, 476–482. [Google Scholar]
  53. Lambers, H.; Oliveira, R. Plant Physiological Ecology; Springer: Cham, Switzerland, 2019. [Google Scholar]
  54. Flexas, J.; Bota, J.; Loreto, F.; Cornic, G.; Sharkey, T.D. Diffusive and metabolic limitations to photosynthesis under drought and salinity in C3 plants. Plant Biol. 2004, 6, 269–279. [Google Scholar] [CrossRef] [PubMed]
  55. Noy-Meir, I. Desert ecosystems: Environment and producers. Annu. Rev. Ecol. Syst. 1973, 4, 25–51. [Google Scholar] [CrossRef]
  56. Castro-díez, P.; Puyravaud, J.P.; Cornelissen, J.H.C. Leaf structure and anatomy as related to leaf mass per area variation in seedlings of a wide range of woody plant species and types. Oecologia 2000, 124, 476–486. [Google Scholar] [CrossRef]
  57. Hsiao, T.C. Plant Responses to Water Stress. Annu. Rev. Plant Physiol. 1973, 24, 519–570. [Google Scholar] [CrossRef]
  58. Levitt, J. Responses of Plants to Environmental Stress; Academic Press: New York, NY, USA, 1980. [Google Scholar]
  59. Pistón, N.; Bello, F.; Dias, A.T.C.; Götzenberger, L.; Rosado, B.H.P.; Mattos, E.A.; Salguero-Gómez, R.; Carmona, C.P. Multidimensional ecological analyses demonstrate how interactions between functional traits shape fitness and life history strategies. J. Ecol. 2019, 107, 2317–2328. [Google Scholar] [CrossRef]
Figure 1. Distribution of survey sampling points in the mainstream of the Tarim River (different colors of sample points represent different river reaches).
Forests 15 00437 g001
Figure 2. Leaf trait networks of the upstream (a), midstream (b), downstream (c), and overall (d) regions of the mainstream of the Tarim River. Note: Features with the same background color belong to the same module. The red and black edges show positive and negative correlation, respectively. The strength between characters is indicated by the line width, and the node size is indicated by the degree.
Forests 15 00437 g002
Figure 3. Comparison of network parameters of Populus euphratica leaves in the upstream, midstream, and downstream regions of the mainstream of the Tarim River: (a) average clustering coefficient, (b) edge density, (c) modularity, (d) average path length, (e) diameter. (Different letters indicate significant differences in parameters with p < 0.05; error bars indicate standard errors, SE).
Forests 15 00437 g003
Figure 4. Comparison of network node parameters for leaf traits of Populus euphratica in the upstream, midstream, and downstream regions of the mainstream of the Tarim River: (a) degree for upstream, (b) closeness for upstream, (c) betweenness for upstream, (d) degree for midstream, (e) closeness for midstream, (f) betweenness for midstream, (g) degree for downstream, (h) closeness for downstream, (i) betweenness for downstream. (LL: leaf length, LW: leaf width, LA: leaf area, LDW: leaf dry weight, LWC: leaf water content, LDMC: leaf dry matter content, SLA: specific leaf area, LT: leaf thickness, N: leaf nitrogen concentration, C: leaf carbon concentration, P: leaf phosphorus concentration, K: leaf potassium concentration, N/P: nitrogen–phosphorus ratio, C:N: carbon–nitrogen ratio, C:P: carbon–phosphorus ratio, ST: spongy tissue, UE: upper epidermis thickness, LE: lower epidermis thickness, MC: mucilage cell, PT: palisade tissue, USC: upper stratum corneum, LSC: lower stratum corneum, MVB: midvein vascular bundle, SC: sclerenchyma, P/S: palisade tissue/spongy tissue, CTR: cell tension ratio, SR: spongy ratio).
Forests 15 00437 g004aForests 15 00437 g004b
Figure 5. Comparison of overall network node parameters for leaf traits of Populus euphratica in the mainstream of the Tarim River: (a) degree, (b) closeness, (c) betweenness. (LL: leaf length, LW: leaf width, LA: leaf area, LDW: leaf dry weight, LWC: leaf water content, LDMC: leaf dry matter content, SLA: specific leaf area, LT: leaf thickness, N: leaf nitrogen concentration, C: leaf carbon concentration, P: leaf phosphorus concentration, K: leaf potassium concentration, N/P: nitrogen–phosphorus ratio, C:N: carbon–nitrogen ratio, C:P: carbon–phosphorus ratio, ST: spongy tissue, UE: upper epidermis thickness, LE: lower epidermis thickness, MC: mucilage cell, PT: palisade tissue, USC: upper stratum corneum, LSC: lower stratum corneum, MVB: midvein vascular bundle, SC: sclerenchyma, P/S: palisade tissue/spongy tissue, CTR: cell tension ratio, SR: spongy ratio).
Forests 15 00437 g005
Figure 6. Comparison of leaf morphology, anatomy, and stoichiometry characteristics of Populus euphratica in the mainstream of the Tarim River: (a) degree, (b) closeness, (c) betweenness. (Different letters indicate significant differences in parameters with p < 0.05; error bars indicate standard errors, SE).
Forests 15 00437 g006
Figure 7. Leaf trait networks of Populus euphratica in hyper-arid and arid regions of the Tarim River mainstream: (a) LTNs in hyper-arid regions, (b) LTNs in arid regions. Note: Features with the same background color belong to the same module. The red and black edges show positive and negative correlation, respectively. The strength between characters is indicated by the line width, and the node size is indicated by the degree.
Forests 15 00437 g007
Figure 8. Comparison of network parameters of leaf traits in hyper-arid regions and arid regions: (a) average clustering coefficient, (b) edge density, (c) modularity, (d) average path length, (e) diameter. (Different letters indicate significant differences in parameters with p < 0.05; error bars indicate standard errors, SE).
Forests 15 00437 g008
Figure 9. Comparison of node parameters for LTNs of Populus euphratica in hyper-arid and arid regions: (a) degree for hyper-arid region, (b) closeness for hyper-arid region, (c) betweenness for hyper-arid region, (d) degree for arid region, (e) closeness for arid region, (f) betweenness for arid region. (LL: leaf length, LW: leaf width, LA: leaf area, LDW: leaf dry weight, LWC: leaf water content, LDMC: leaf dry matter content, SLA: specific leaf area, LT: leaf thickness, N: leaf nitrogen concentration, C: leaf carbon concentration, P: leaf phosphorus concentration, K: leaf potassium concentration, N/P: nitrogen–phosphorus ratio, C:N: carbon–nitrogen ratio, C:P: carbon–phosphorus ratio, ST: spongy tissue, UE: upper epidermis thickness, LE: lower epidermis thickness, MC: mucilage cell, PT: palisade tissue, USC: upper stratum corneum, LSC: lower stratum corneum, MVB: midvein vascular bundle, SC: sclerenchyma, P/S: palisade tissue/spongy tissue, CTR: cell tension ratio, SR: spongy ratio).
Forests 15 00437 g009aForests 15 00437 g009b
Figure 10. Comparison of leaf morphology, anatomy, and stoichiometry feature node parameters based on different arid regions of the mainstream of the Tarim River: (a) degree of three types of leaf traits in the hyper-arid area, (b) closeness of three types of leaf traits in the hyper-arid area, (c) betweenness of three types of leaf traits in the hyper-arid area, (d) degree of three types of leaf traits in the arid area, (e) closeness of three types of leaf traits in the arid area, (f) betweenness of three types of leaf traits in the arid area. (Different letters indicate significant differences in parameters with p < 0.05; error bars indicate standard errors, SE).
Forests 15 00437 g010aForests 15 00437 g010b
Disclaimer/Publisher’s Note: The statements, opinions and data contained in all publications are solely those of the individual author(s) and contributor(s) and not of MDPI and/or the editor(s). MDPI and/or the editor(s) disclaim responsibility for any injury to people or property resulting from any ideas, methods, instructions or products referred to in the content.

