Essay

Changes in the Potential Habitat Distribution of Typical Fire-Resistant Forest Species under Climate Change in the Subtropical Regions of China

1
College of Computer Science and Information Technology, Central South University of Forestry and Technology, Changsha 410004, China
2
Institute of Forest Resource Information Techniques, Chinese Academy of Forestry, Beijing 100091, China
*
Author to whom correspondence should be addressed.
Forests 2023, 14(9), 1897; https://doi.org/10.3390/f14091897
Submission received: 11 August 2023 / Revised: 13 September 2023 / Accepted: 13 September 2023 / Published: 18 September 2023
(This article belongs to the Special Issue Soil and Plant Restoration after Wildfire)

Abstract

:
Ecological fire prevention forest belts can effectively alleviate the spread of forest fires and reduce the harm caused by forest fires. Exploring the distribution and changes in suitable growth areas for fire-resistant forest species under the effects of climate change can provide effective references for the introduction of ecological fire prevention and tree species preservation in the region. This study is based on the distribution data of six typical ecological fire prevention forest species in the subtropical regions of China. The maximum entropy model (MaxEnt), optimized by the ENMeval data package, was used to analyze the potential relationship between the ecological environment variables and fire prevention forest species. The potential distribution of certain tree species in the historical period and in future periods is simulated. In addition, the area changes, migration trends, and stable areas of tree species under climate change are also discussed. The research results indicated the following: (1) The AUC values of the optimized model are all higher than 0.9, indicating the optimal prediction results. (2) The climate variables that have the greatest impact on the suitable habitat of Schima superba were the annual mean temperature, precipitation of the driest month, and mean diurnal range. Quercus glauca was mainly influenced by the minimum temperature of the coldest month and the precipitation of the warmest quarter. Castanopsis eyrei was mainly influenced by the precipitation of the driest month and the annual precipitation. The distribution of suitable growth areas for Symplocos sumuntia is mainly influenced by the precipitation of the driest month. The distribution of Camellia oleifera was influenced by the minimum temperature of the coldest month. The potential habitat distribution of Photinia serratifolia was greatly influenced by annual precipitation. (3) Until 2090, the expansion degree of the suitable growth area will be Symplocos sumuntia (51.05%) > Schima superba (19.41%) > Camellia oleifera (10.14%) > Quercus glauca (6.80%) > Castanopsis eyrei (2.34%) > Photinia serratifolia (−6.97%). (4) The centroid of Schima superba will migrate northward. Quercus glauca will migrate northeast. The suitable areas for the migration of Symplocos sumuntia and Castanopsis eyrei will move in a northwest direction, with repeated changes in alum migration, as well as with the largest migration span for Castanopsis eyrei. In addition, Camellia oleifera will move southwest. The centroid of Photinia serratifolia will migrate to the southeast. (5) The six fire-resistant tree species in this study were noted to have excellent stability in Guizhou, Hunan, Jiangxi, Fujian, Guangdong, and Guangxi. This conclusion can provide an effective reference for the introduction of ecological fire prevention tree species and the protection of tree species under climate change in subtropical forest-fire-prone areas in China.

1. Introduction

Ecological fire prevention forest is a fundamental project in the construction of a forest fire prevention system, which can prevent the spread of forest fires and reduce the probability of large-scale forest fires [1,2]. As early as 1936, foreign countries began to utilize plants with low flammability and high water content, such as the gramineous plant Agropyron cristatum (L.) Gaertn., Fagus longipetiolata Seem., Quercus robur L., and Viburnum odoratissimum Ker.-Gawl., to establish fire belts in order to suppress the spread of fires [3,4,5]. The United States once experimented with the use of the foreign tree species Tamarix chinensis Lour. to build fire-resistant forest belts, which initially achieved good results. But this tree species has been squeezed out by local tree species [6]. The principle of selecting suitable land and trees to build fire-resistant forest belts in China has been adopted, and the proportion of tree species with strong fire resistance [7] has increased in the high-frequency forest fire areas of Guangdong, Fujian, and other such places; such an approach has achieved good results. Deng et al. proposed increasing the planting proportion of Schima superba and Michelia macclurei Dandy in fire-prone areas [8], and Lai et al. selected Camellia oleifera as the construction of the fire prevention forest belt in the Sanming Mountain area [9]. Based on the natural environment of the Greater Khingan Mountains forest area, the main tree species from the local fire prevention tree species can be selected to build an ecological fire prevention forest belt [10]. Combining the climatic conditions of different periods and studying the potential distribution of suitable habitats for fire-resistant forest tree species can provide reference opinions on the spatiotemporal changes that are involved in the planting and selection of fire-resistant forests.
Due to its unique geographical location and terrain distribution, China is influenced by different monsoons, resulting in differences in climates, vegetation types, and soil textures among the different regions of China [11]. This has also made China one of the countries with the richest plant resources in the world, where most plant genera are represented in temperate climates with over 80 fire-resistant tree species [12]. This study selected Schima superba, Quercus glauca, Castanopsis eyrei, Symplocos sumundia, Camellia oleifera, and Photinia serratifolia from the subtropical regions of China as the research objects, including six typical ecological fire prevention forest species. Among them, Schima superba has a high water content and is characterized by fire, wind, and cold resistance. Quercus glauca has a beautiful tree shape, as well as dense branches and leaves; furthermore, it has good resistance to toxic gases, wind, dust, and fire. Castanopsis eyrei has excellent fire resistance [13]. Symplocos sumundia is a typical tree species in the subtropical regions of China, and its leaves have excellent fire resistance [14]. It is often mixed with other tree species as a fire-resistant tree species. Camellia oleifera has high water content, strong adaptability, and a certain economic value; in addition, it is widely planted in the mountainous and hilly areas of Hunan, Jiangxi, Fujian, and other regions in China [15]. Photinia serratifolia is a common ornamental evergreen shrub in the subtropical regions of China, and it is commonly planted in gardens and urban roads.
The MaxEnt model is, at present, the most widely used species habitat suitability model [16]. Due to its simple operation and strong applicability, it can achieve good prediction results, even when the distribution sample data and environmental variable data are insufficient, and it is widely used [17]. Zhang et al. used the MaxEnt model to predict the potential distribution of rare tree species Picea smithiana in the Mount Everest Nature Reserve in China [18]. In order to study the response of geographical changes in Castanopsis sclerophylla to climate change, Miao et al. used the MaxEnt model to simulate and predict the potential distribution areas of Castanopsis sclerophylla during the last glacial maximum, currently, and by 2070 and evaluated the impact of climate factor changes on its potential geographical distribution [19]. Some studies have shown that when using the default feature combination (FC) and regularization multiplier (RM) parameter combination of the maxent model to predict the potential distribution of species, the complexity of the model may be increased, thus resulting in problems such as the over sensitivity of the model to samples and overfitting of the model [20]. In order to solve such problems, this study uses the R-project-based ENMeval package to adjust the parameter values of FCs and RM [21].
This study is based on climate data from different periods and the distribution data of six typical ecological fire prevention forest tree species. The MaxEnt model, which is optimized with the ENMeval package and is based on the R project, was used to analyze the important factors that affect the distribution of fire prevention tree species. The potential distribution of fire prevention forest tree species in subtropical regions of China during historical periods was studied, and the distribution and changes in tree species during the 2050 and 2090 periods under climate change were predicted, thus providing theoretical support for promoting the construction of ecological fire prevention forest belts and selecting species of ecological fire prevention belts in China.

2. Materials and Methods

2.1. Materials

2.1.1. Overview of the Research Area

The study area is the subtropical region of China, which is at a 25–35° north latitude and is mainly south of the Huaihe River in the Qinling Mountains, east of the Qinghai Tibet Plateau, and north of the tropical monsoon climate [22,23]. The temperature changes throughout the four seasons are significant, with abundant precipitation throughout the year, exhibiting the characteristics of high temperature and rainfall in summer and mild and less rainfall in winter. However, due to the influence of vegetation, terrain, climate, and population density, forest fires are more frequent [24].

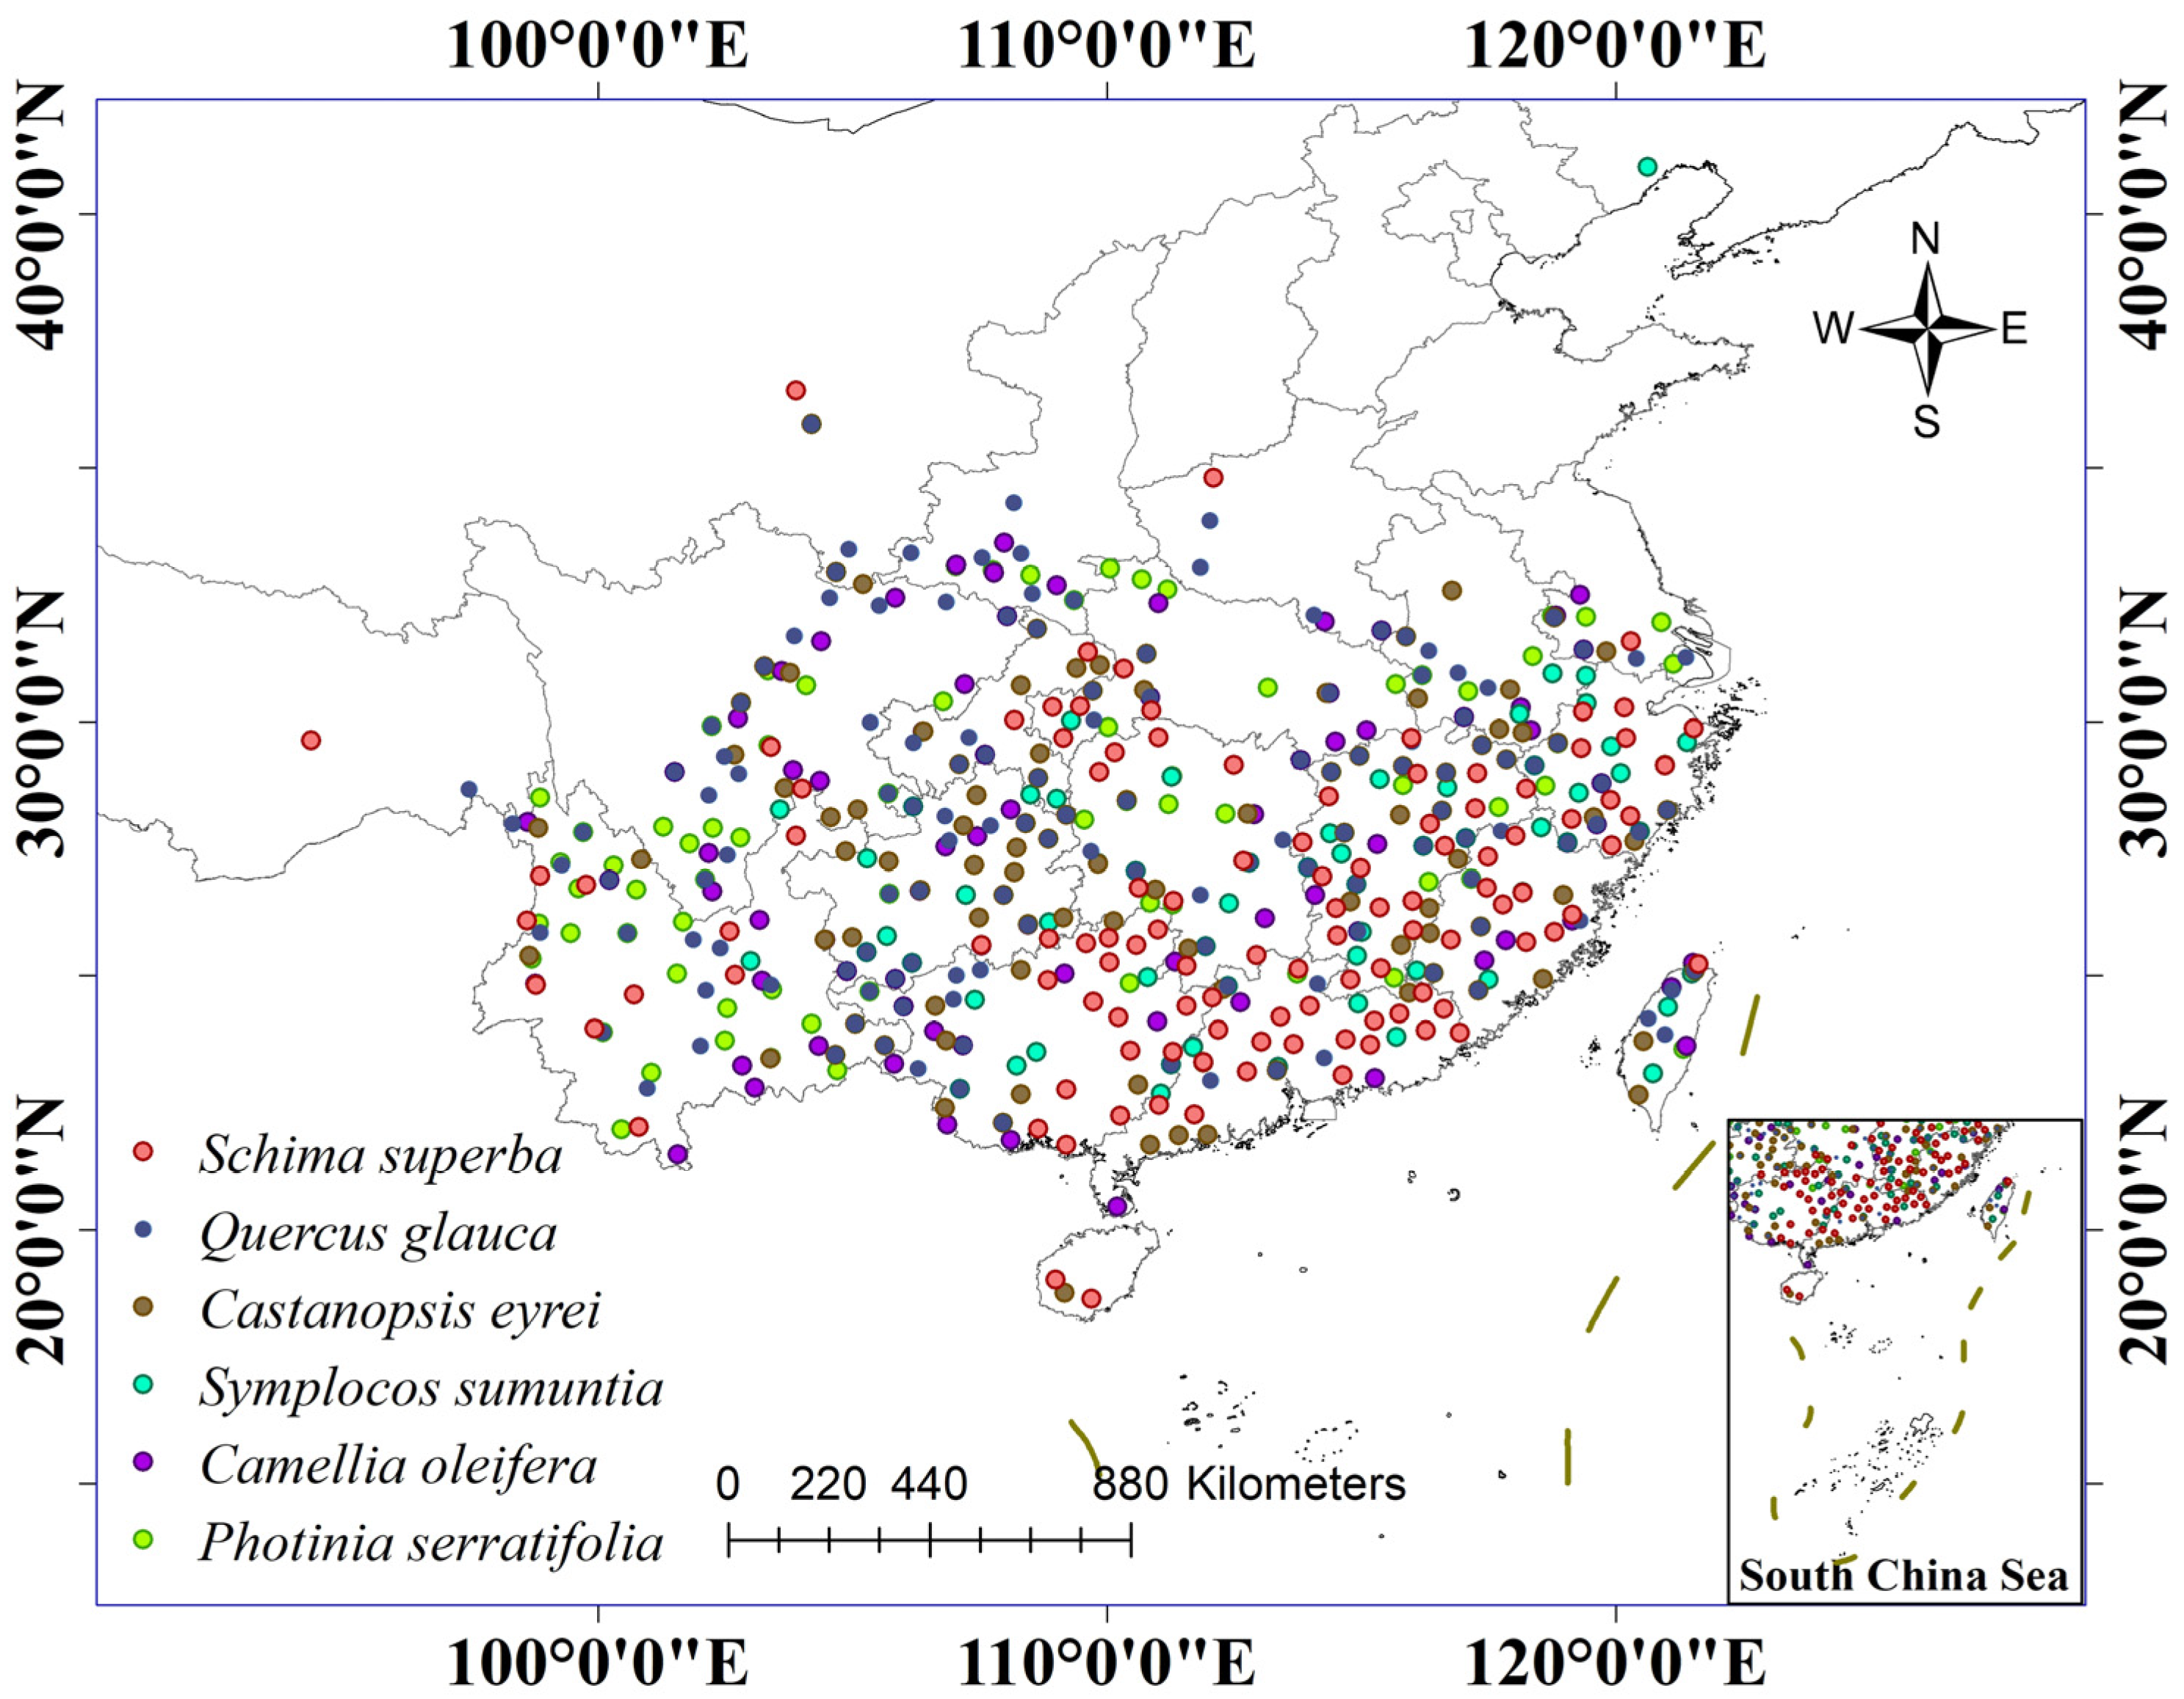
2.1.2. Species Distribution Data

The six typical ecological fire prevention forest tree species selected in this study were distributed using data from the Global Biodiversity Information database (https://www.gbif.org, accessed on 15 April 2023), iNaturalist (www.inaturalist.org, accessed on 15 April 2023), and the Chinese Virtual Herbarium (https://www.cvh.ac.cn, accessed on 15 April 2023).

2.1.3. Ecological Environment Data

Ecological environment variables were sourced from the World Climate Network (https://www.worldclim.org, accessed on 15 April 2023). The spatial resolution is 2.5 arc minutes (approximately 20.25 km2), which includes terrain data and 19 categories of climate data (Table 1) from the following three periods: the historical climate (1970–2000), the future average climate in 2050 (2041–2060), and the future average climate in 2090 (2081–2100). Among these, the future climate data are the bioclimate variable data that are utilized in the medium emissions SSP245 scenario, which is based on the BBC-CSM2-MR climate model [25]. In addition, ArcGIS was used to process the terrain data to obtain the elevation, aspect, and slope.

2.1.4. MaxEnt Model

The MaxEnt model was first proposed by Steven J. Phillips in 2004 [26]. The idea of MaxEnt is to estimate the target probability distribution by finding the probability distribution of the maximum entropy [27,28]. The available information about the target distribution is usually represented as a set of real, valued variables called “features” with the constraint that the expected value of each feature should match its empirical mean (i.e., the average value of a set of sample points is obtained from the target distribution). When MaxEnt is applied to the modeling of species habitat suitability models, the pixels in the study area constitute the space defining the MaxEnt probability distribution, and the longitude and latitude positions of known species occurrence records form sample points, characterized by environmental variables such as climate variables, elevations, soil types, vegetation types, and their functions [29,30].
Currently, there are five features in FCs: Linear (L), Quadratic (Q), Hinge (H), Product (P), and Threshold (T). In the default settings, FCs are LQHPT, and the RM is 1. This study created 6 FCs: L, LQ, H, LQH, LQHP, and LQHPT. The RM was set from 0.5 to 4 with an increase of 0.5 each time, a total of 8 gradients, and 48 parameter combinations, as shown in Table 2.
The 48 parameter combinations mentioned above were optimized and tested using the ENMeval data package. The Akaike Information Criterion corrected value (Delta AICc) and 10% training omission rate (OR10), under different parameter combinations, were used to measure the performance of the model. The smaller the index value, the lower the degree of overfitting of the model, and the better the model prediction results [31,32].

2.2. Methods

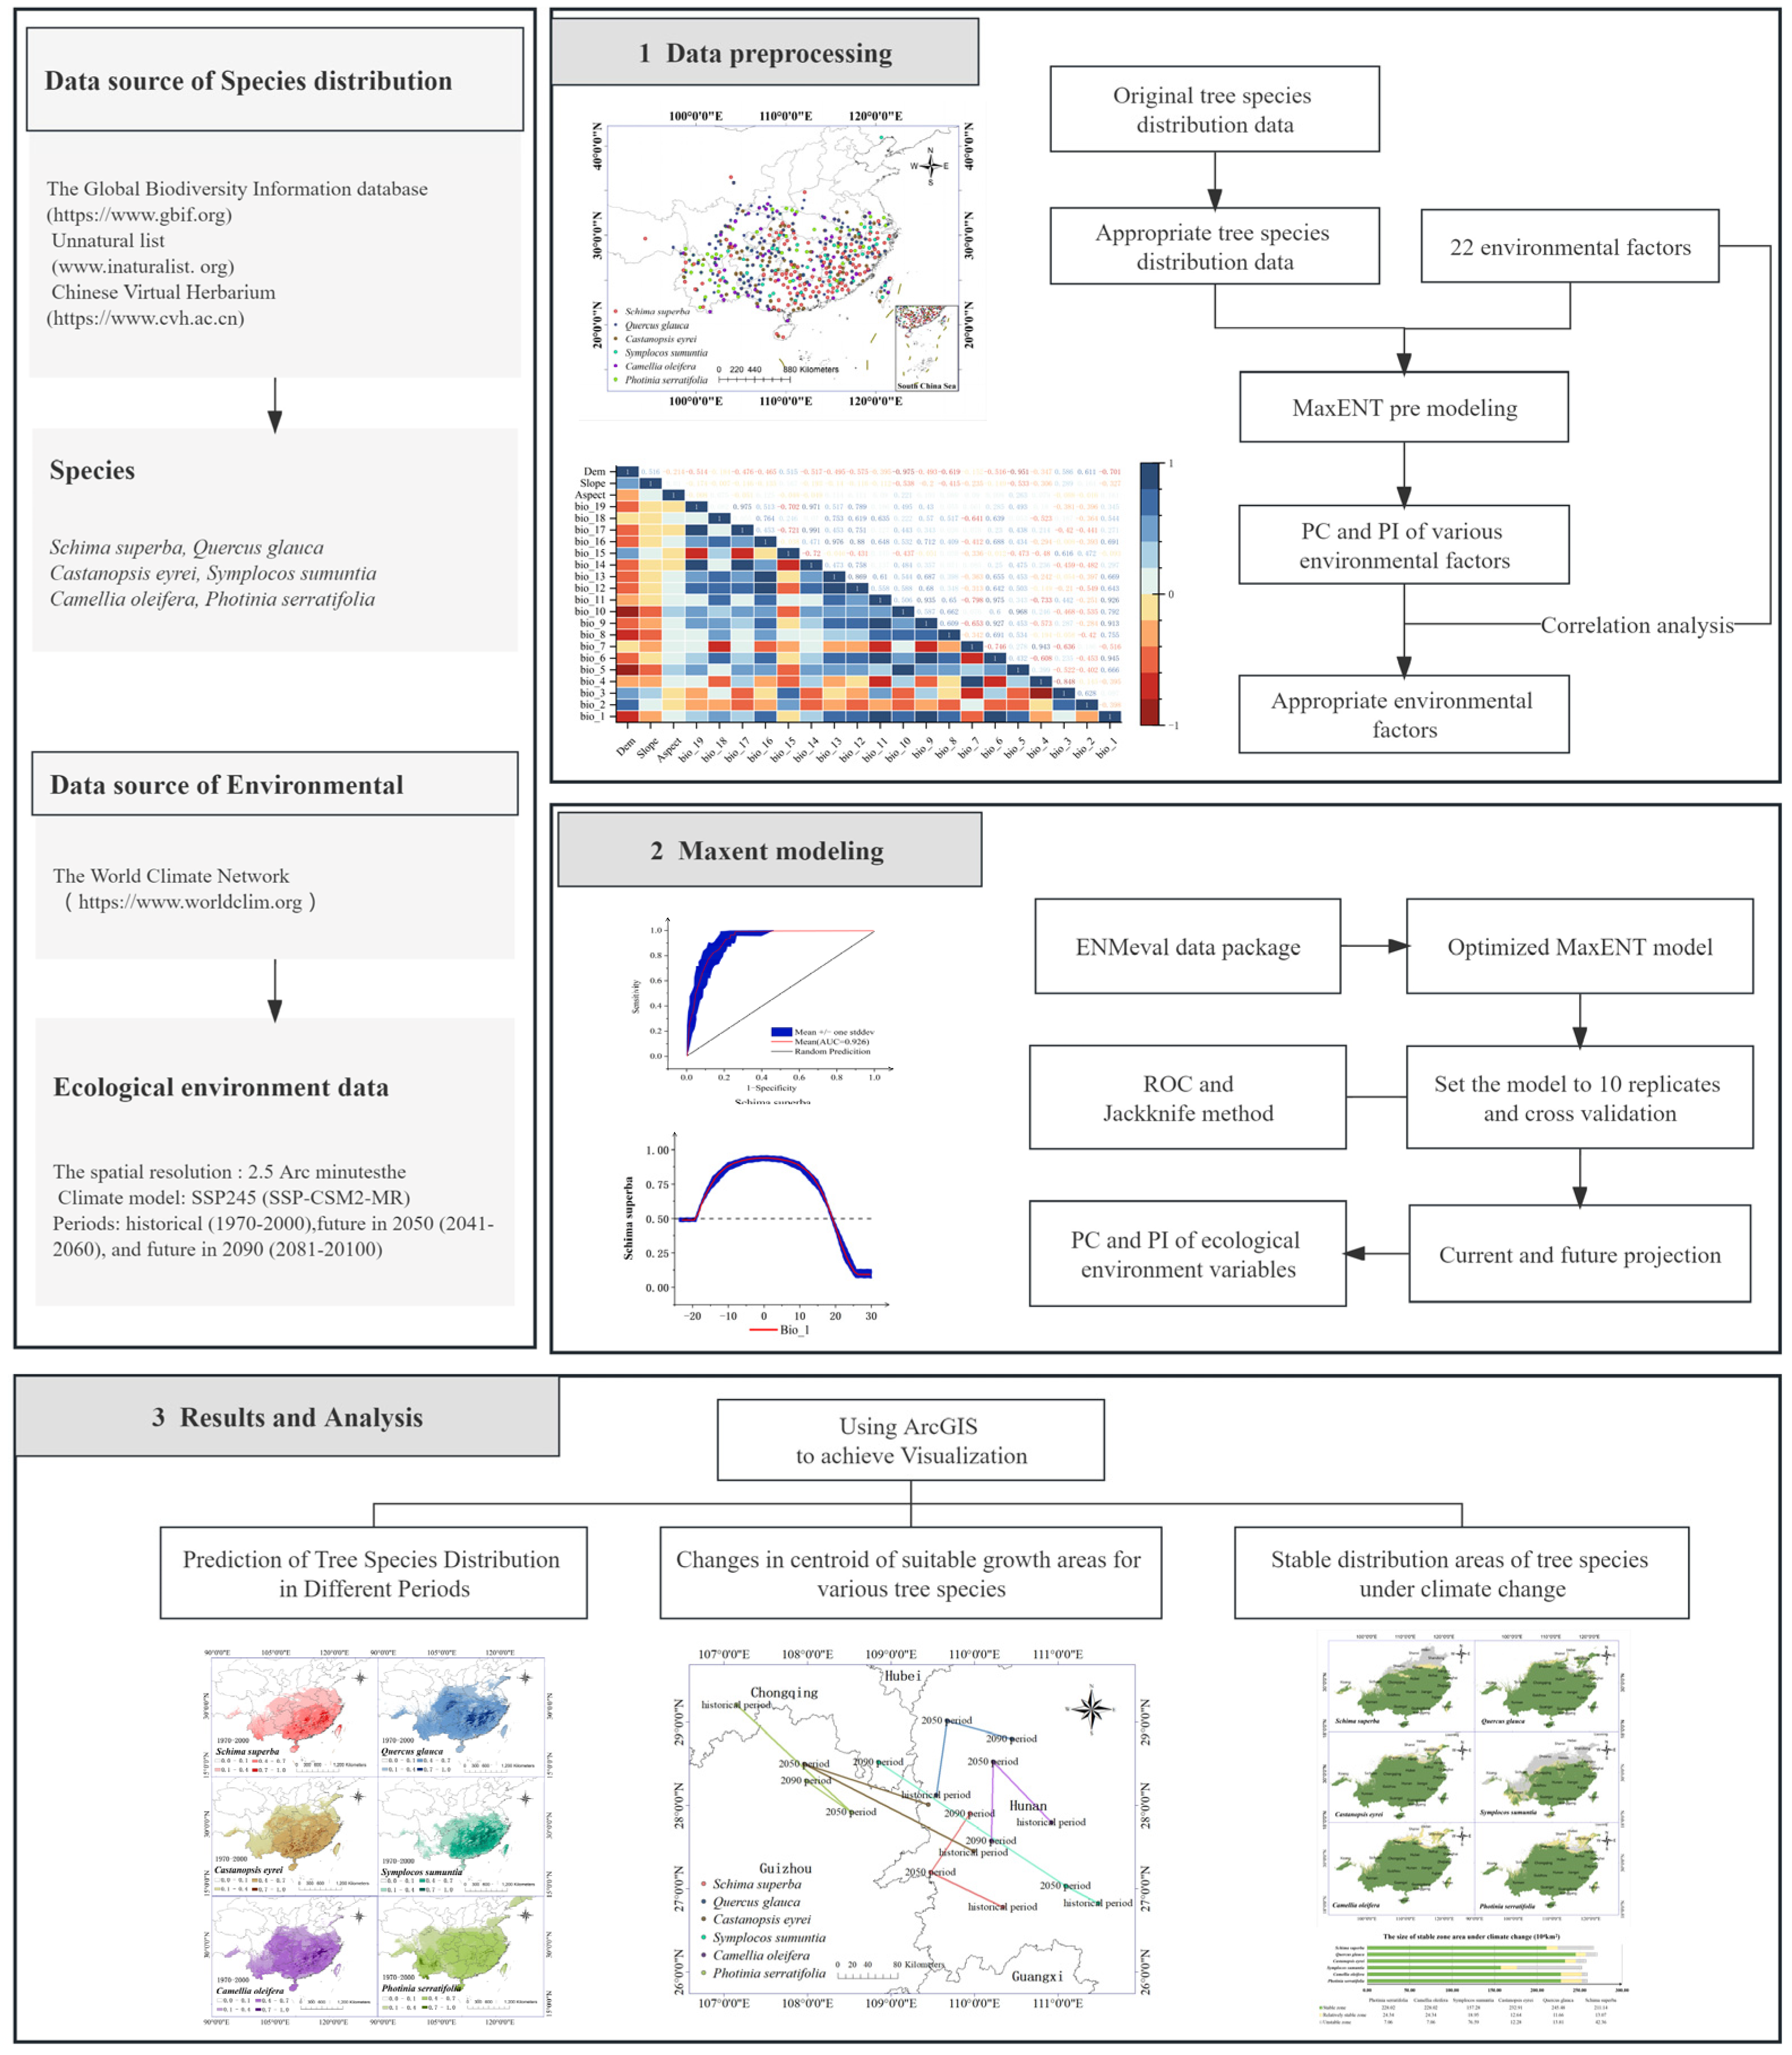
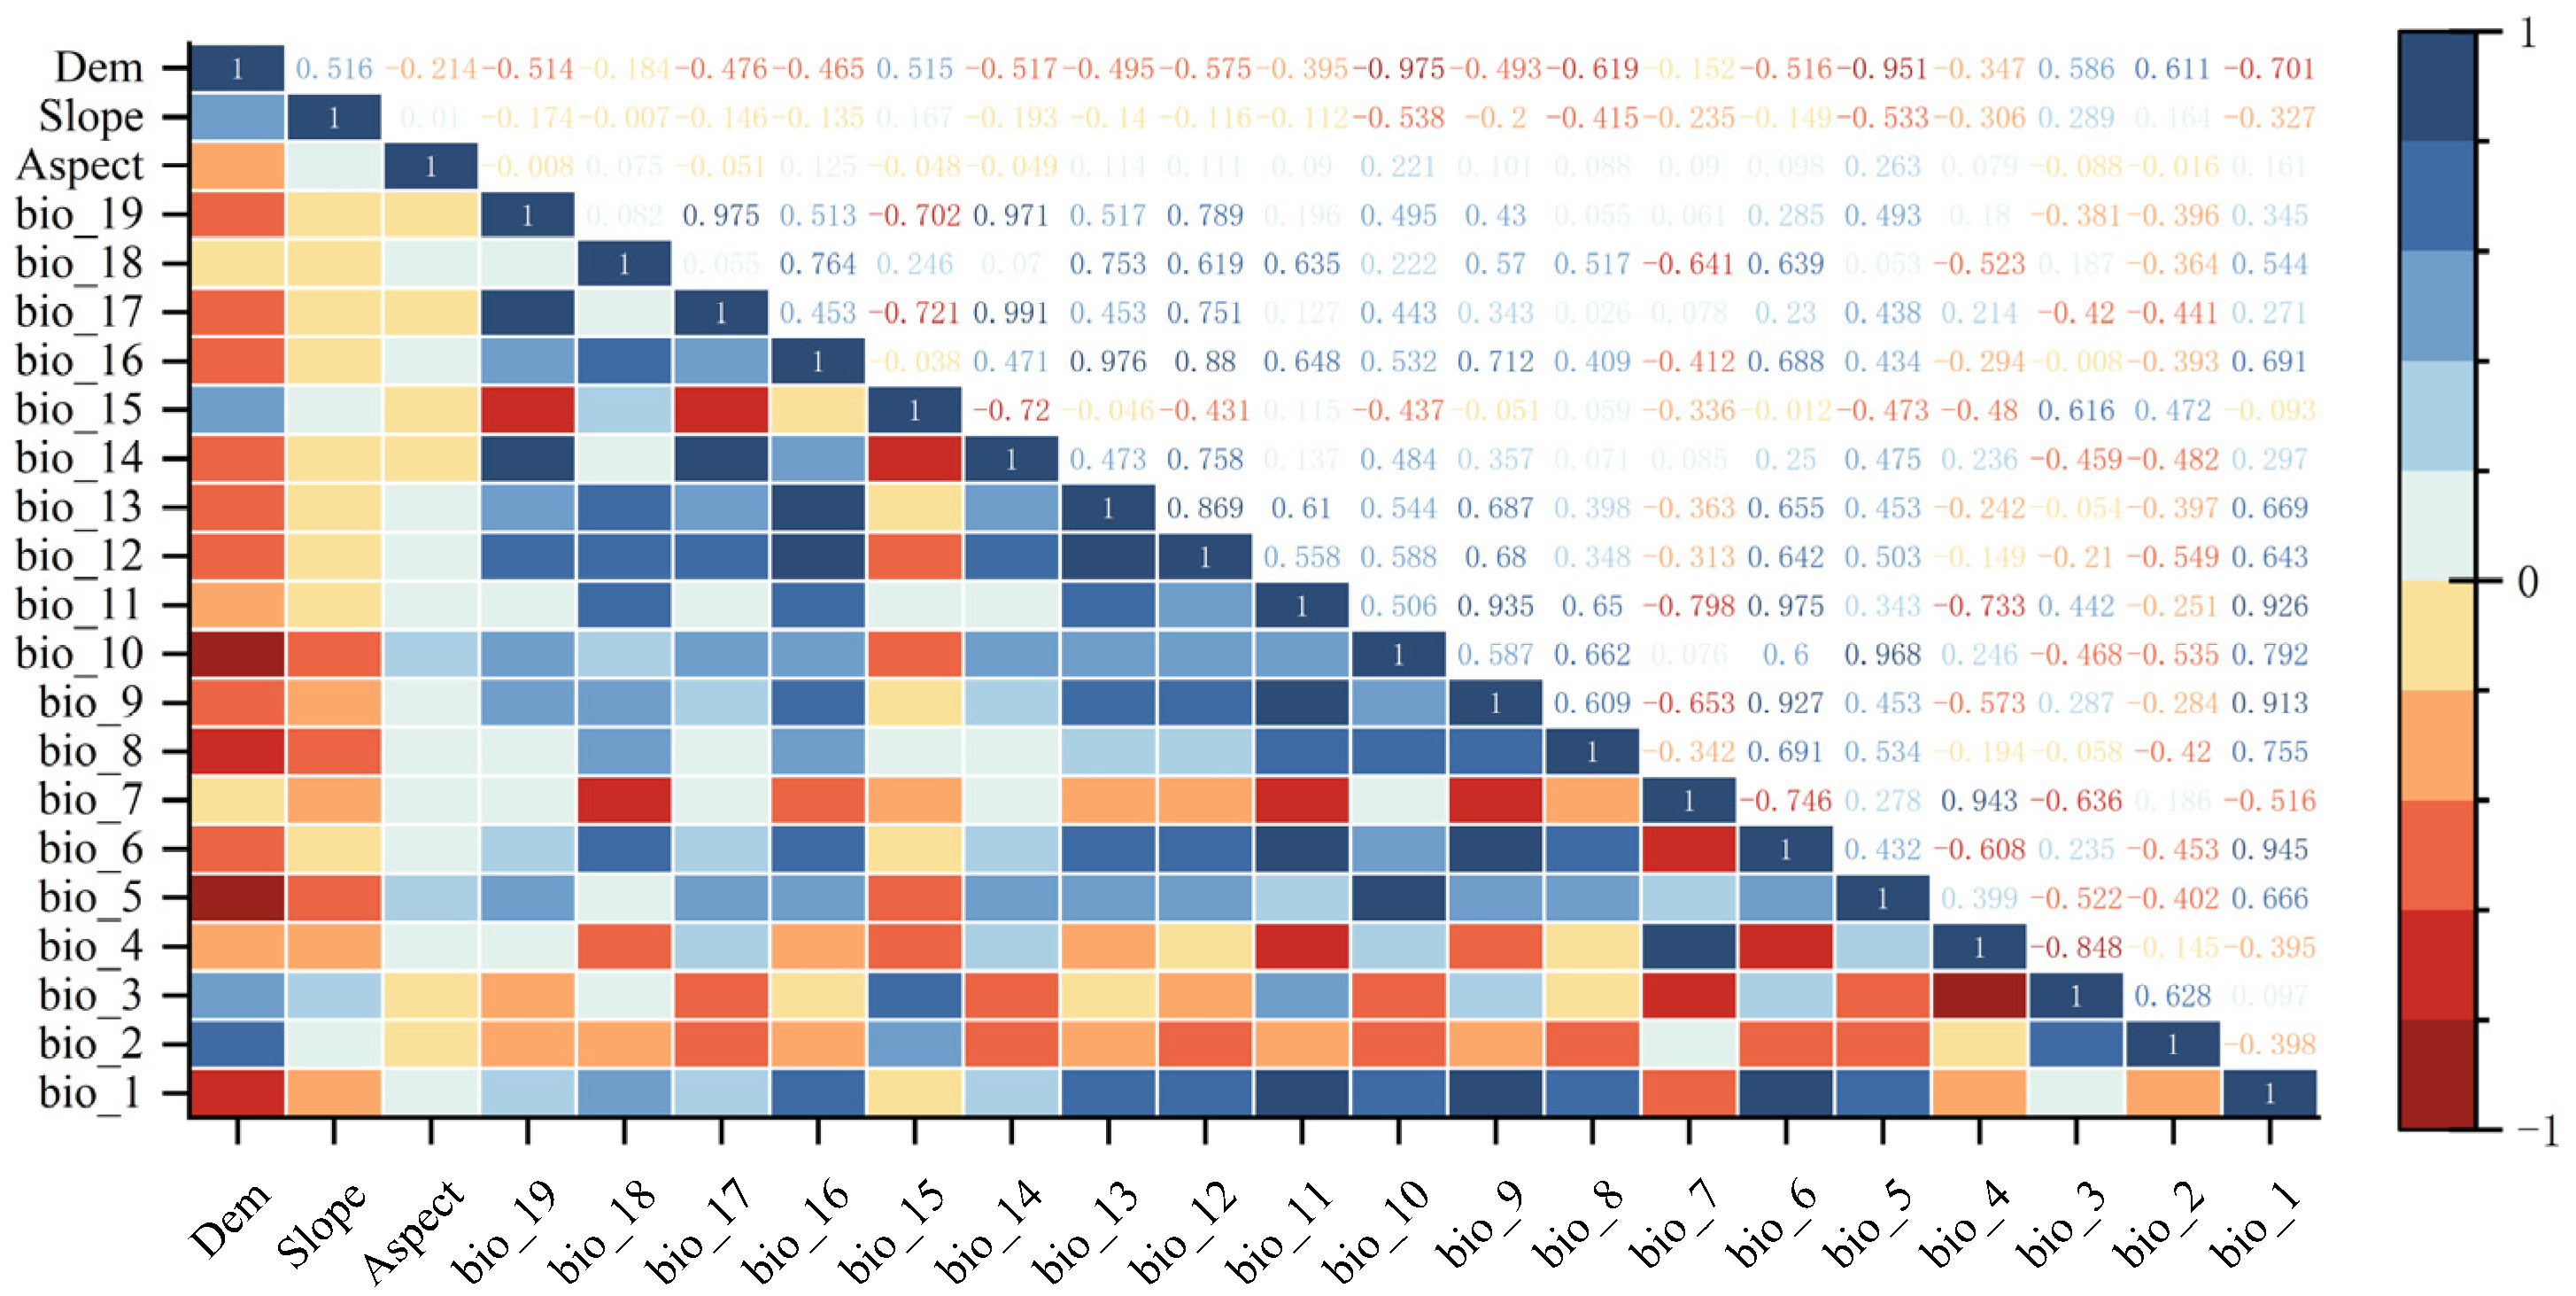
2.2.1. Data Preprocessing

Figure 1 shows the complete workflow of the analysis in this study.
For the obtained historical distribution data of species—after deleting incorrect and duplicate data in order to avoid errors in the experimental results due to the dense distribution of the same tree species—this study set up only one type of distribution data for each tree species within a 50 km range. The final retained data include 121 Schima superba, 186 Quercus glauca, 152 Castanopsis eyrei, 114 Symplocos sumundia, 174 Camellia oleifera, and 127 Photinia serratifolia, as shown in Figure 2.
Considering the strong correlation between ecological environment variables, if all variables were used for MaxEnt model modeling, it may lead to overfitting of the model, and the contribution rate of ecological environment variables to each type of forest fire tree species may be different. Therefore, it is necessary to screen the ecological environment variables of the six forest fire tree species. Firstly, using the 22 ecological environment variables listed in this study, MaxEnt pre-modeling was performed on each type of tree species to obtain the contribution rates of each environmental variable; then, Pearson correlation analysis was performed on ecological environment variables to generate a correlation heat map, as shown in Figure 3. When the correlation between the ecological environment variables was |r| > 0.7, the variable with the lower contribution rate was removed [33]. Finally, the ecological environment variables of each tree species after screening are shown in Table 3.

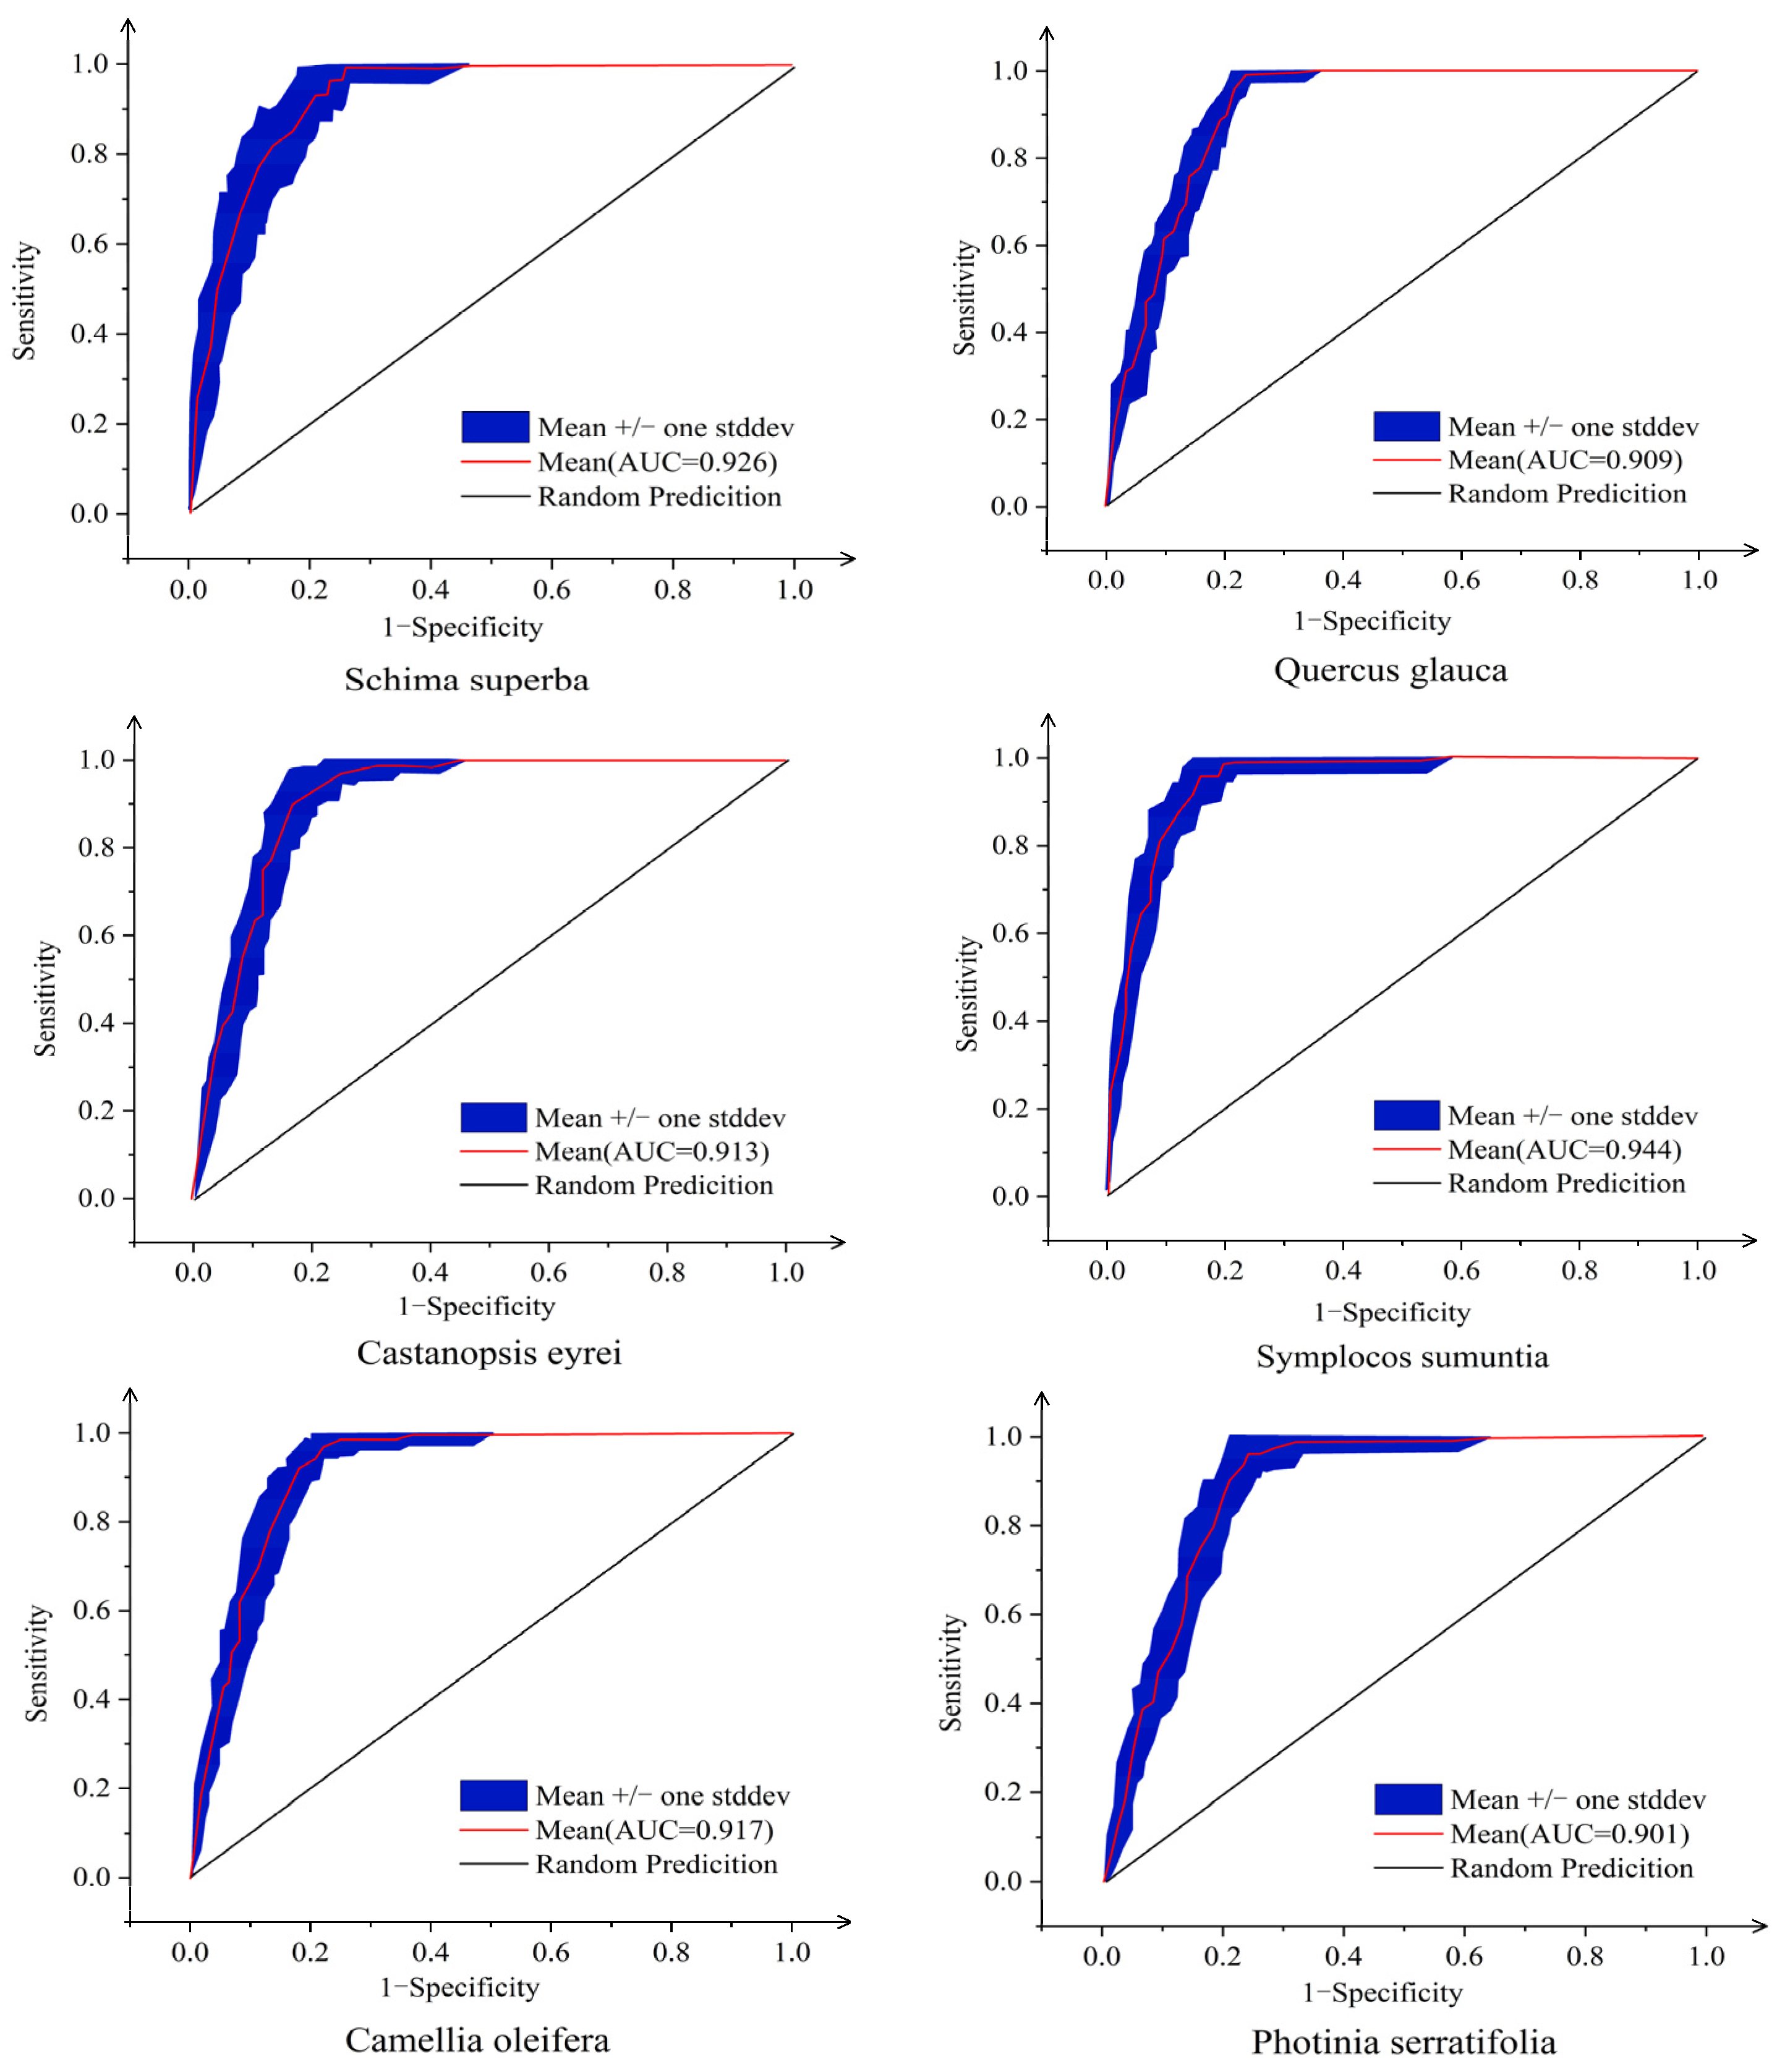
2.2.2. Precision Evaluation

The receiver operating characteristic curve (ROC curve) uses each predicted value as a possible judgment threshold and calculates the corresponding sensitivity and specificity. The curve is plotted with the false positive rate (1-specificity) as the horizontal axis and the true positive rate (sensitivity) as the vertical axis. The size of the area under the curve (AUC) is used as a measure of the accuracy of the model prediction, and its value range is [0, 1] [34]. Furthermore, it is generally believed that the accuracy of a model is relatively low at 0.7, is moderate when between 0.7 and 0.9, and is high when it is greater than 0.9. The knife-cutting method was used to detect the contribution rate of various factors in the changes in the distribution of suitable habitats. The larger the contribution rate, the greater its impact on the distribution of species in suitable habitats. The environmental factor response curve reflects the trend of the probability of species’ existence when the numerical value of environmental factors changes. It is generally believed that when the probability of existence is greater than 0.5, the size of the environmental factor is more suitable for the growth of the species [35].

2.2.3. Model Evaluation

To ensure the accuracy of the model results, 10 replicates of the model were set in the model settings, and cross-validation was used to verify the dataset by default. The output format was selected as Logistic, and the receiver operating characteristic curve (ROC) was used to test the model’s accuracy. In addition, the jackknife method was utilized to test the percentage contribution (PC) and permutation importance (PI) of the ecological environment variables. Lastly, ecological environment variable response curves were created to facilitate observing the trend of environmental factor changes.
The PC value reflects the contribution of each ecological environment variable to the geographical distribution of species during the training process of the model: the larger the value, the greater the impact of the variable on the distribution of species. The PI value reflects the degree to which the AUC value obtained from the model simulation results decreases after randomly replacing the ecological environment variables of the species. The greater the decrease, the greater the dependence of the model on this variable [36]. The response curve of ecological environment variables reflects the trend of changes in the probability of species’ existence when the value of the variable changes. It is generally believed that when the probability of existence is greater than 0.5, the size of the environmental factor is more suitable for the growth of the species [37].

2.2.4. Model Evaluation and Analytical Methods

To evaluate the accuracy of the MaxEnt model, this study used the area under the ROC curve (AUC). The area under the ROC curve (AUC) is the best indicator for evaluating the accuracy of the model [38]. The ROC curve uses each value of the predicted result as the judgment threshold and calculates the corresponding sensitivity and specificity. The model is plotted with the false positive rate (1-specificity) as the horizontal axis and the true positive rate (sensitivity) as the vertical axis. The size of the area under the ROC curve (AUC) is used as a measure of the model’s prediction accuracy, with a value range of [0, 1]. The larger the value, the stronger the model’s judgment [39].
ArcGIS10.8 was used to process the distribution results of tree species obtained in the experiment. Using the method of manual classification in resampling, potentially suitable areas were classified into four categories based on suitability: unsuitable areas (0.0–0.1), low-suitability areas (0.1–0.4), moderate-suitability areas (0.4–0.7), and high-suitability areas (0.7–1.0). Potential distribution maps of tree species in different periods were drawn. In addition, ArcGIS10.8 was used to perform a weighted overlay analysis on the distribution of potentially suitable growth areas in three periods, and the stable distribution of various tree species under climate change was obtained. Then, grid computing was used to calculate the area of each suitable habitat.

3. Results and Analysis

3.1. Model Accuracy

Table 4 shows various indicators of the simulation results of the MaxEnt model under default parameters and after optimization. It can be seen that the Delta AICc value and OR10 index of the MaxEnt model optimized by the ENMeval data package have a certain reduction compared with the default value, indicating that the optimized MaxEnt model has a lower overfitting degree and better model prediction results. From Figure 4, it can also be seen that the AUC values of the optimized MaxEnt model are all >0.9, indicating that the model accuracy has reached an excellent level.

3.2. Main Environmental Factors Affecting the Distribution of Tree Species during Historical Periods

In this study, the focus was on analyzing the three ecological environment variables that have the greatest impact on the distribution of various tree species. According to Table 5, the distribution of tree species was mainly influenced by annual mean temperature (Bio_1), mean diurnal range (Bio_2), isothermality (Bio_3), maximum temperature of the warmest month (Bio_5), minimum temperature of the coldest month (Bio_6), annual precipitation (Bio_12), precipitation of the driest month (Bio_14), and precipitation of the warmest quarter (Bio_18).
It can be seen from the percentage contribution and permutation importance of ecological environment variables that among the three ecological environment variables that have the greatest impact on the distribution of Schima superba’s habitat, the PC value of Bio_1 was higher than the other two variables; this had a greater impact on the distribution of suitable growth areas for Schima superba. Among the three variables that had the greatest impact on the Quercus glauca distribution, the PC value and PI value of Bio_6 were much higher than the other variables, indicating that it has an absolute advantage in influencing the distribution of the Quercus glauca suitable area. For Castanopsis eyrei, Bio_14 plays a major role in the environmental variables that affect its distribution, while the model that was sensitive to the dependency of Bio_6 was greater. Bio_14 was found to be the environmental variable with the greatest impact on the potential distribution of Symplocos sumuntia, while Bio_14 and the sum of PI values for Bio_6 were as high as 87.4%, indicating that the model is sensitive to Bio_14 and Bio_6 is highly dependent. Among the key variables affecting the Camellia oleifera distribution, the PI value and PC value of Bio_6 were much higher than the variable value; thus, they have the greatest impact on the Camellia oleifera distribution results simulated by the model. In the distribution prediction of the tree species Photonia serratifolia—which is also the ecological environment variable with the greatest impact on the distribution of Photonia serratifolia—the PI value and PC value of Bio_12 were both greater than 80%.

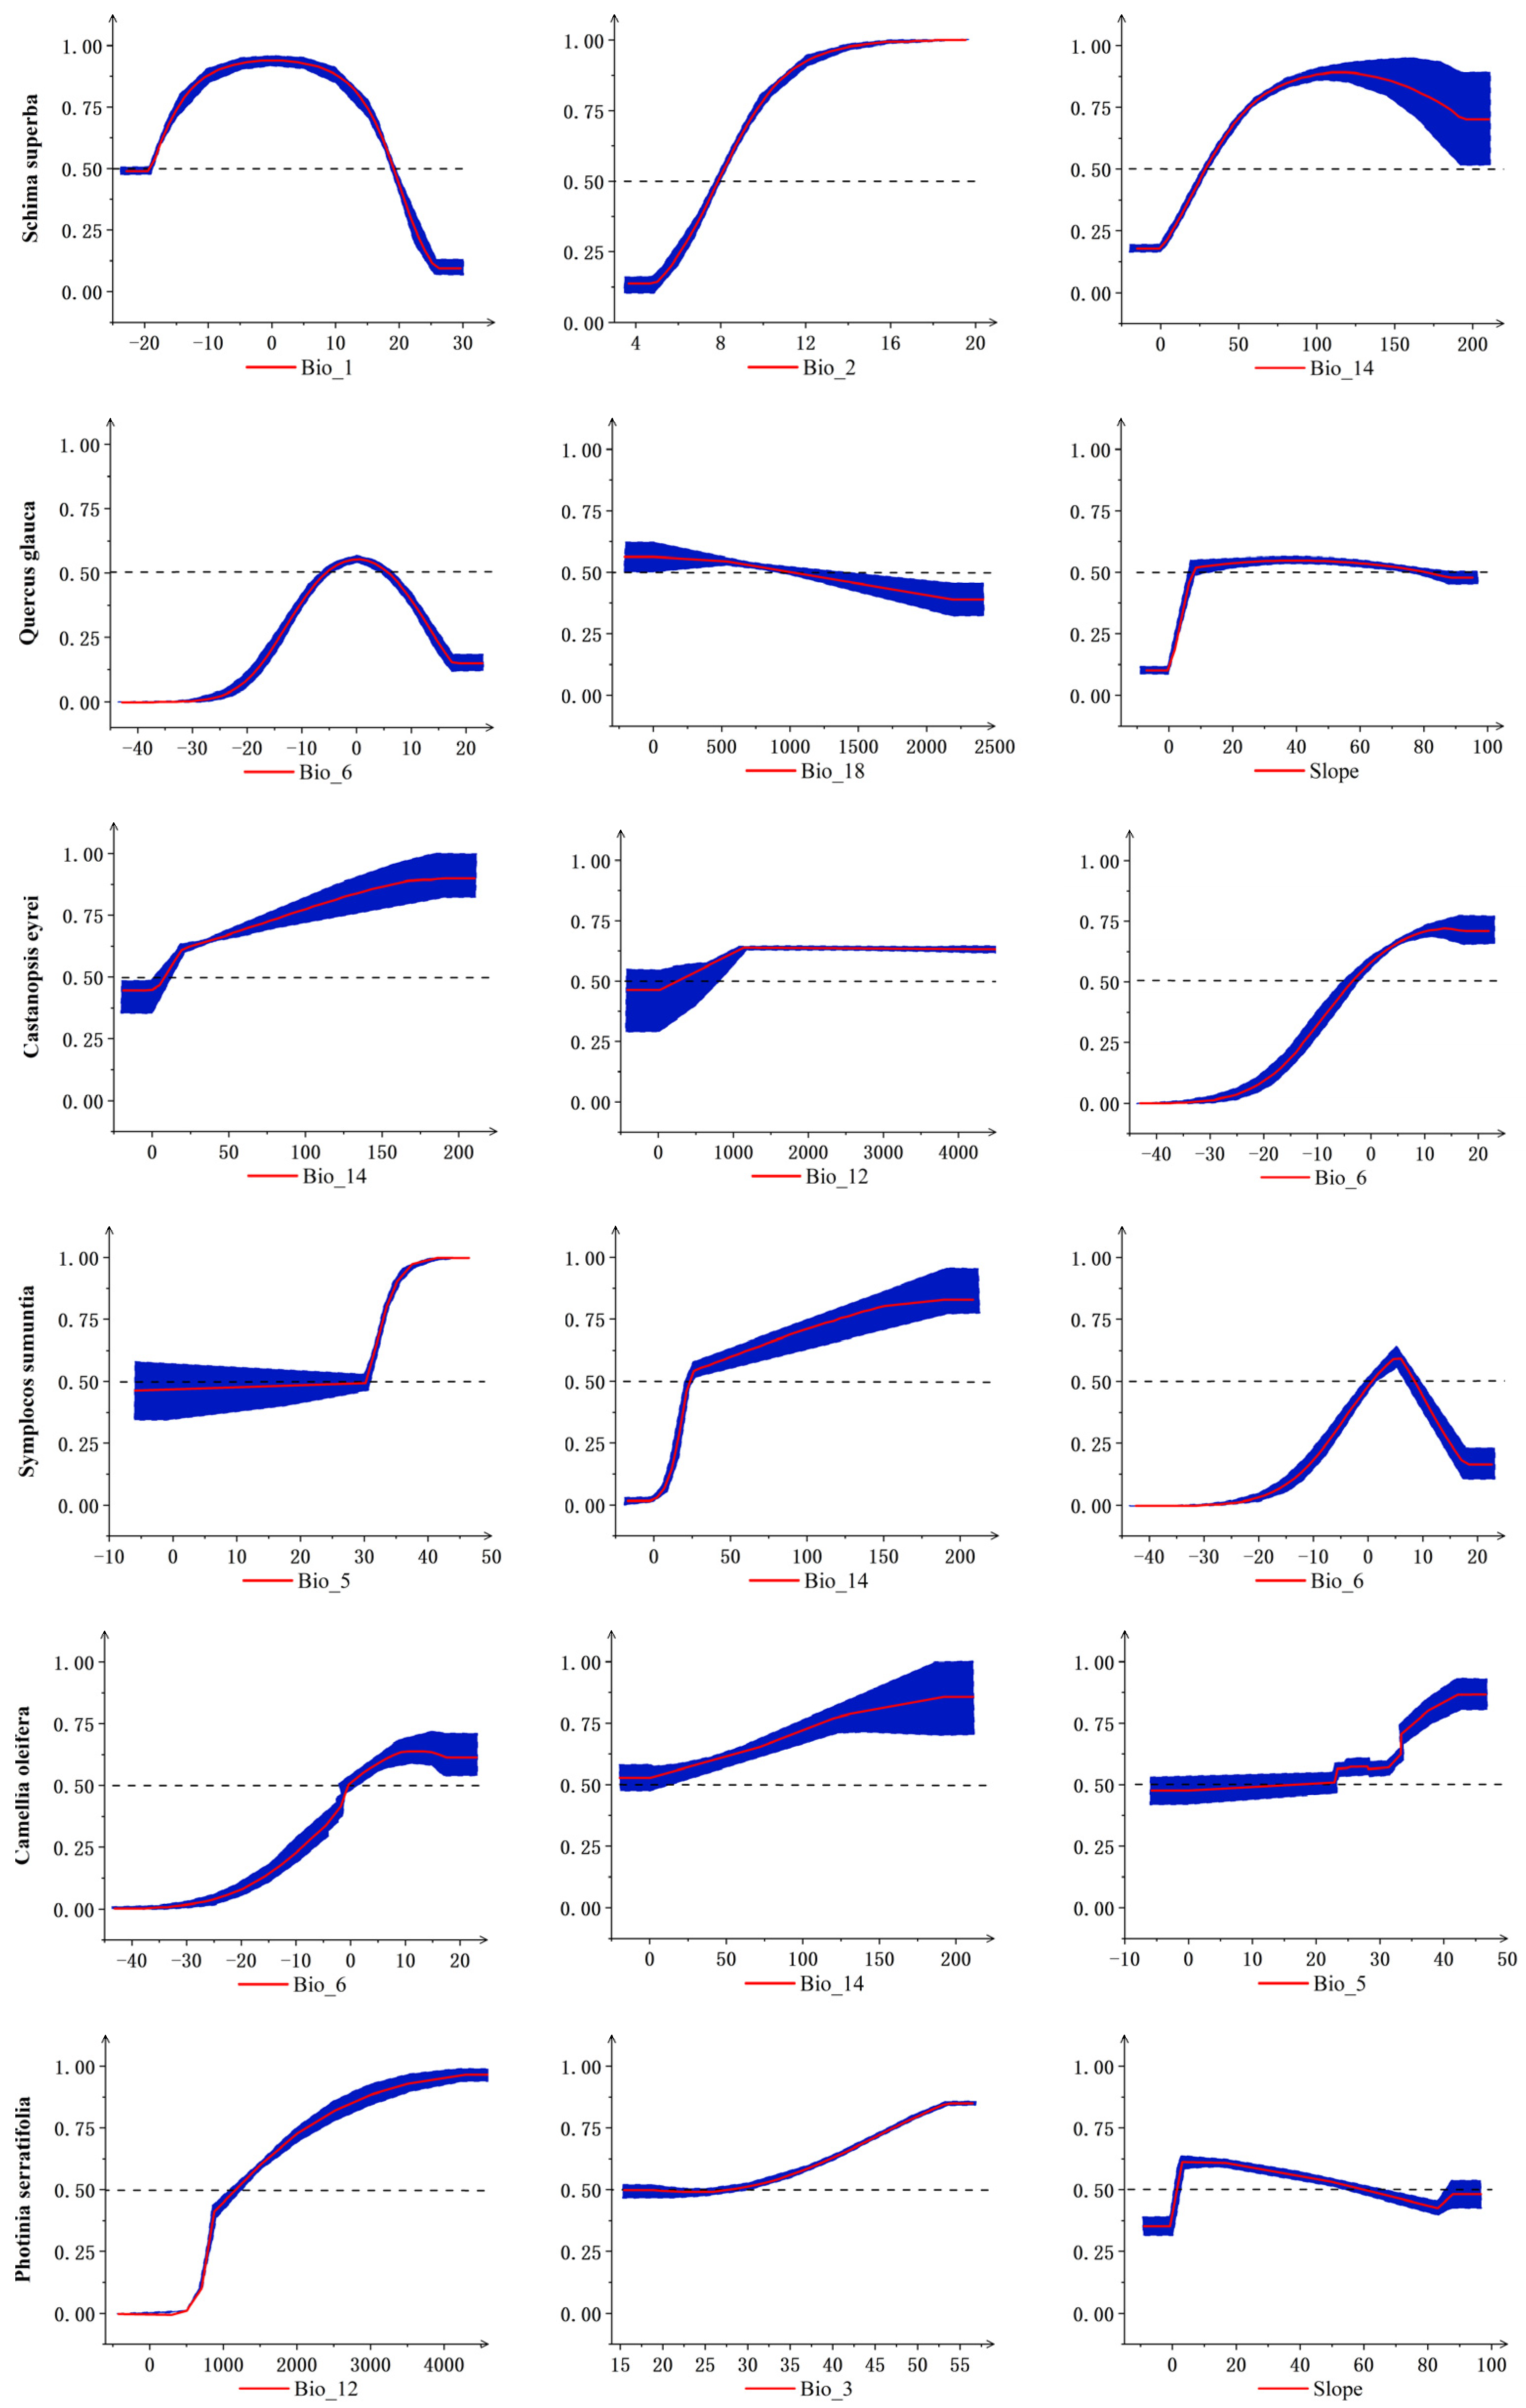
3.3. Response of Tree Species to Major Environmental Factors during Historical Periods

The response curve of ecological environment variables in Figure 5 provided by the analysis model shows that when the average temperature of the living environment of Schima superba is −18 °C, the driest month precipitation is 30–210 mm, the average temperature difference between day and night is between 8–19, and the probability of existence is greater than 0.5, which is more suitable for Schima superba to survive. Quercus glauca is more likely to survive in environments where the lowest temperature in the coldest month is between −6 °C and 6 °C, and the precipitation in the warmest season is less than 1000 mm. Thus, environments where the precipitation in the driest month is >10 mm, the annual precipitation is >250 mm, and the lowest temperature in the coldest month is no less than −3 °C are more conducive to the survival of Castanopsis eyrei. Symplocos sumuntia is more suitable for environments where the precipitation in the driest month is >25 mm, the highest temperature in the warmest month is greater than 30 °C, and the lowest temperature in the coldest month is between 0 and 8 °C. Camellia oleifera is more likely to survive in environments where the lowest temperature in the coldest month is >−2 °C and the highest temperature in the warmest month is no less than 23 °C. When the annual precipitation of the ecological environment variable is >1200 mm, and the isotherm is no less than 30%, the presence rate of Photonia serratifolia is greater than 0.5, which is more suitable for survival.

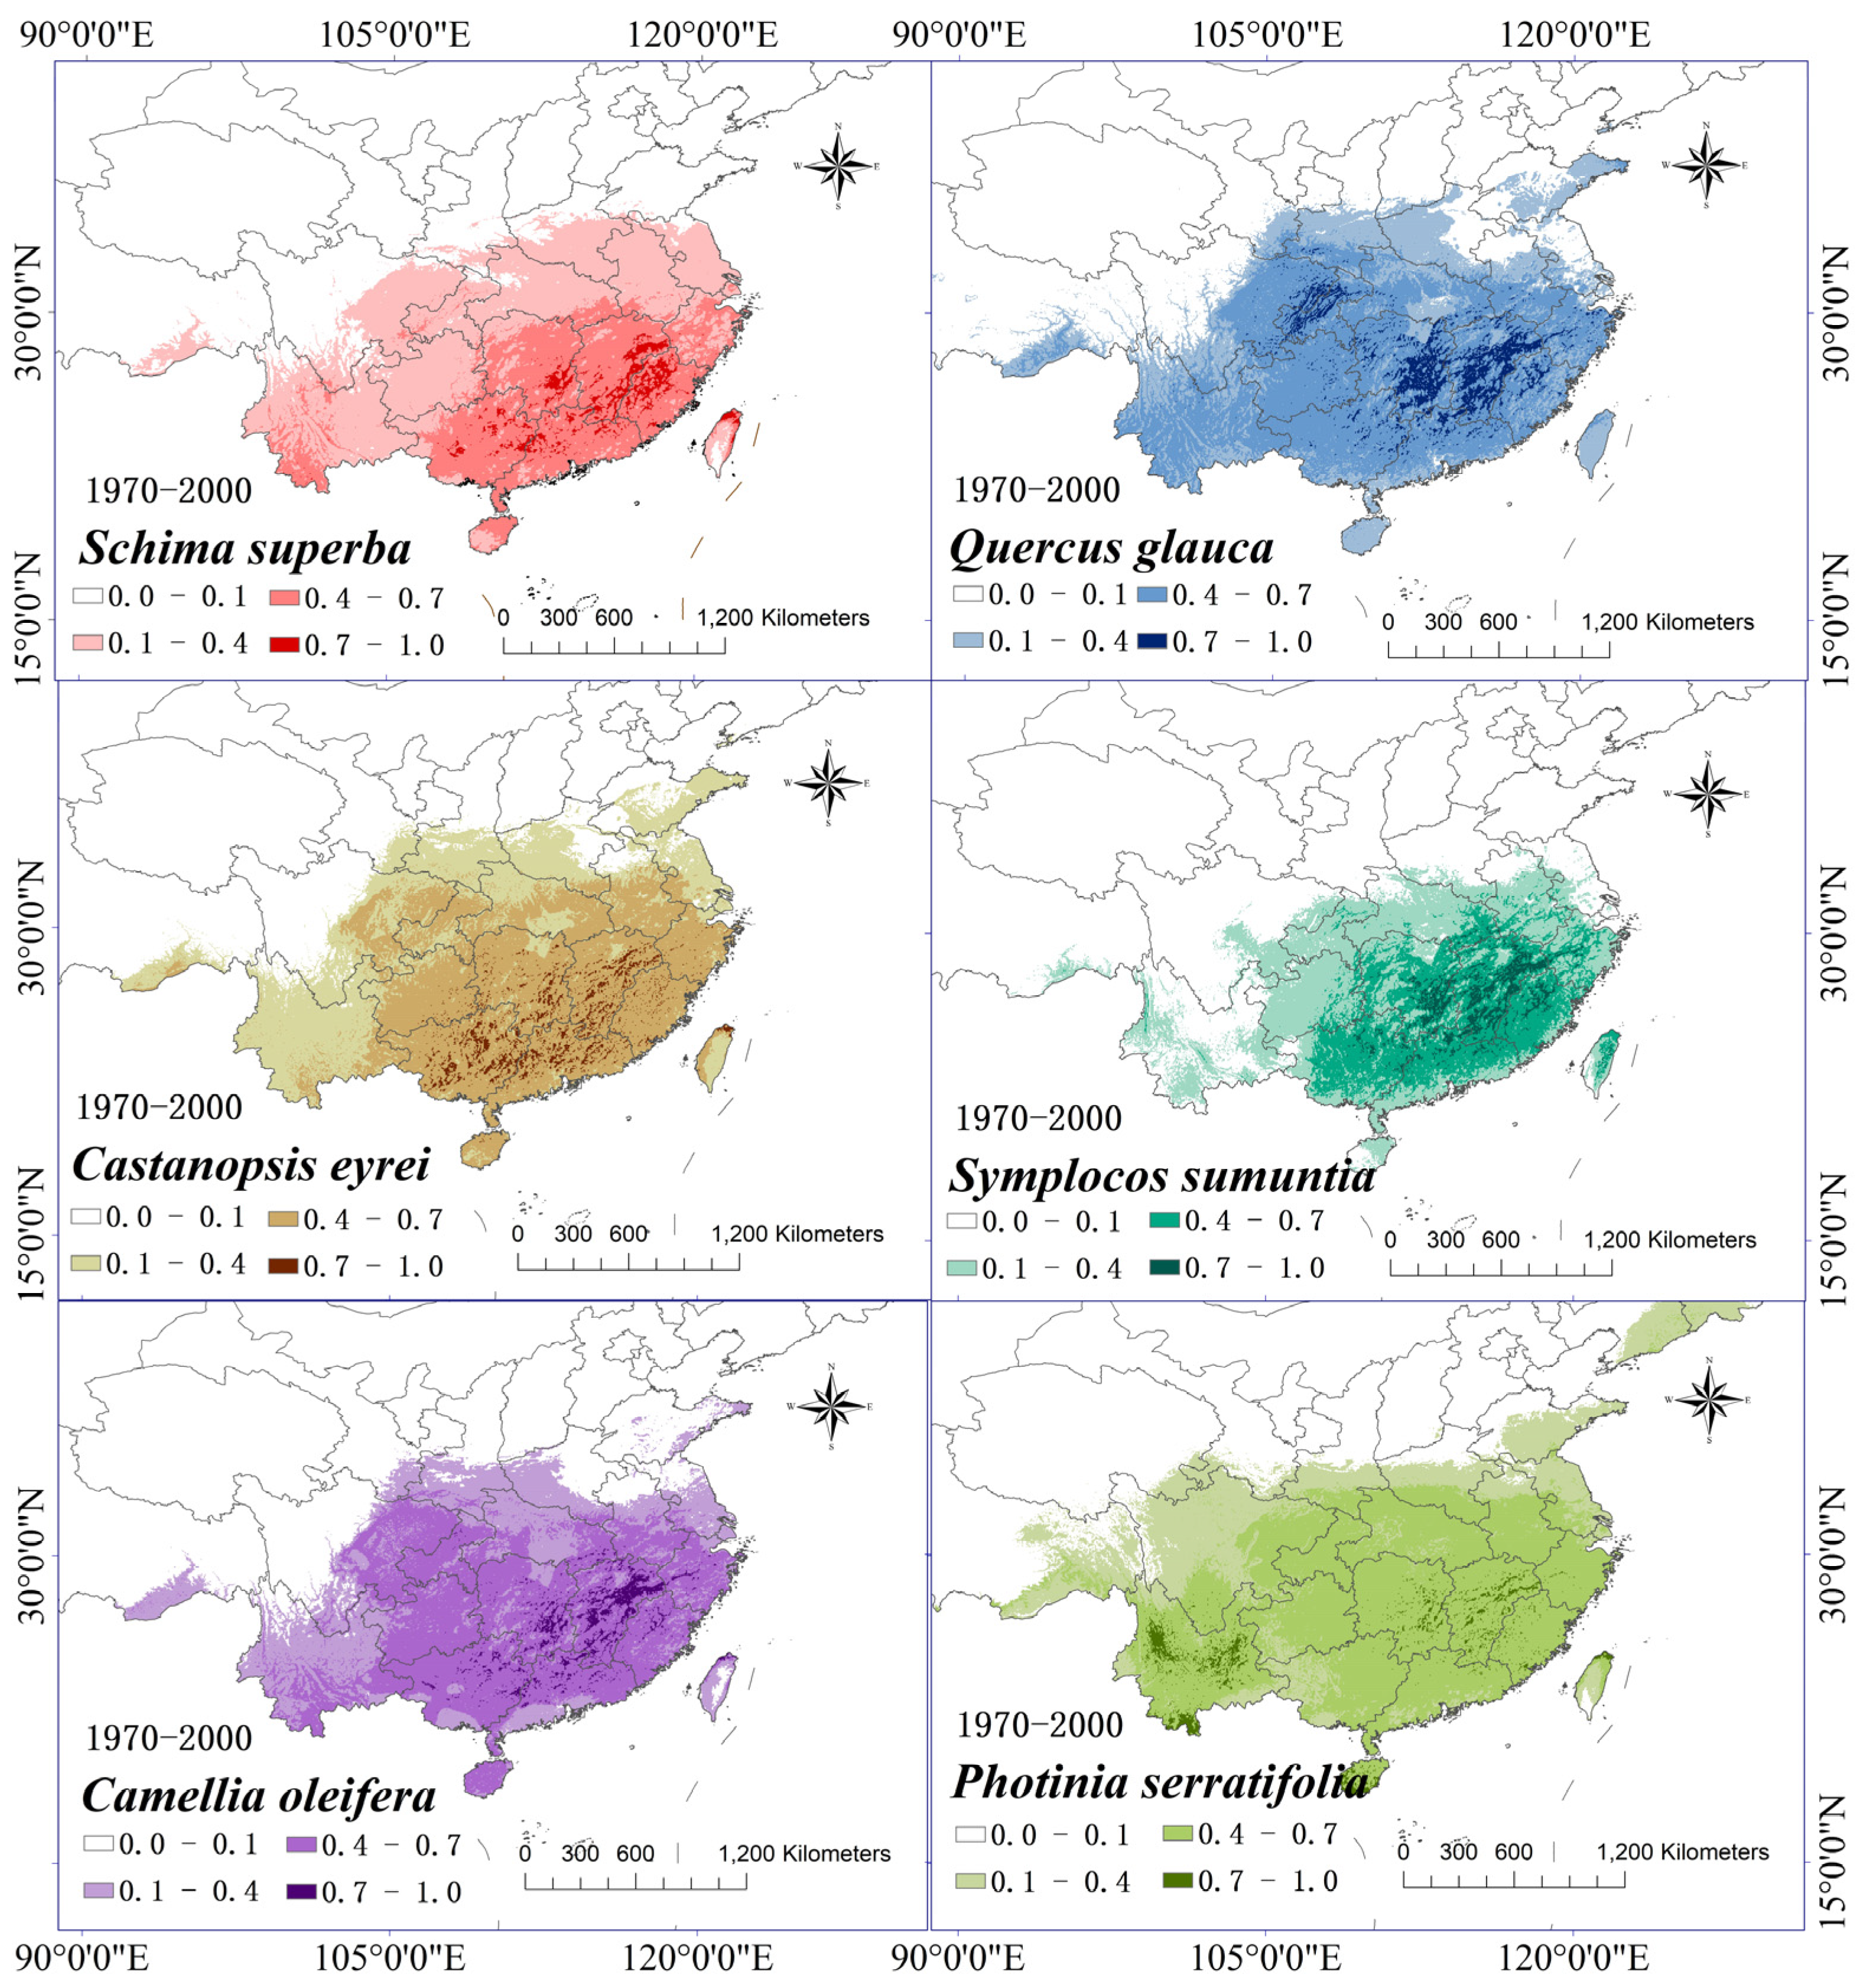
3.4. Distribution Prediction of Tree Species during Historical Periods

According to the distribution changes of tree species shown in Figure 6 and Figure 7, it can be seen that the distribution areas of Schima superba during the historical period were mainly concentrated in the southern provinces of China. In addition, the low-altitude mountainous areas of Tibet were also suitable for the growth of Schima superba. The highly suitable growth area of Schima superba has a total area of 82,500 km2, mainly concentrated in the southeastern, hilly areas of Hunan, Jiangxi, Fujian, Guangdong, and Guangxi, as well as the Taipei area of Taiwan. Quercus glauca is mainly distributed in the Shannan region of Tibet and the hilly areas of Shandong Province, in addition to various southern provinces. The total area of its highly suitable habitat is 79,100 km2, mainly distributed in the Chongqing, Hunan, and Jiangxi regions, as well as being scattered in the southern parts of the Shaanxi, Guizhou, Hubei, Anhui, Zhejiang, Fujian, and Guangdong provinces. The area of the moderately suitable habitat is 1.5189 million km2, accounting for 60.5% of the total suitable habitat area. The highly suitable areas for Castanopsis eyrei are scattered in the Guizhou, Hunan, Jiangxi, Fujian, and Guangdong provinces, while there are also small areas in Taipei with a total area of 97,300 km2. The distribution of suitable habitats for Symplocos sumunta, with a total area of 99,500 km2 of high-suitability habitats, is relatively convergent toward the south when compared to other tree species. It is mainly concentrated in the southeastern, hilly areas of Hunan, Jiangxi, Fujian, Guangdong, and Guangxi and also has a small distribution in the Taiwan Mountains. The total area of the moderate-suitability zone is only 586,100 km2, and it spreads and distributes around the high-suitability zone. The high-suitability habitat of Camellia oleifera, which has a total area of 75,500 km2, is relatively concentrated in the southeast of Jiangxi and Hunan, with scattered distribution in Jiangsu, Fujian, Guangdong, and Guangxi. Among these, the total area of the Du Shi Sheng area is 1.2966 million km2, which is mainly distributed in various southern provinces and also has a small amount of distribution in the coastal areas of Shandong and low-altitude areas of Tibet. Photonia serratifolia’s suitable habitat area accounts for about 31.2% of China’s total area, and its high-suitability habitat area is only 51,300 km2, mainly distributed in Hunan, Jiangxi, the northern coast of Taiwan, the coast of Hainan Province, the Hengduan Mountains in Sichuan, and the Yunnan–Guizhou Plateau. The moderate-suitability area accounts for 62.8% of the total suitable area, mainly distributed in the southern provinces, as well as in the Shannan region of Tibet, Shandong Hills, and Liaodong Hills.

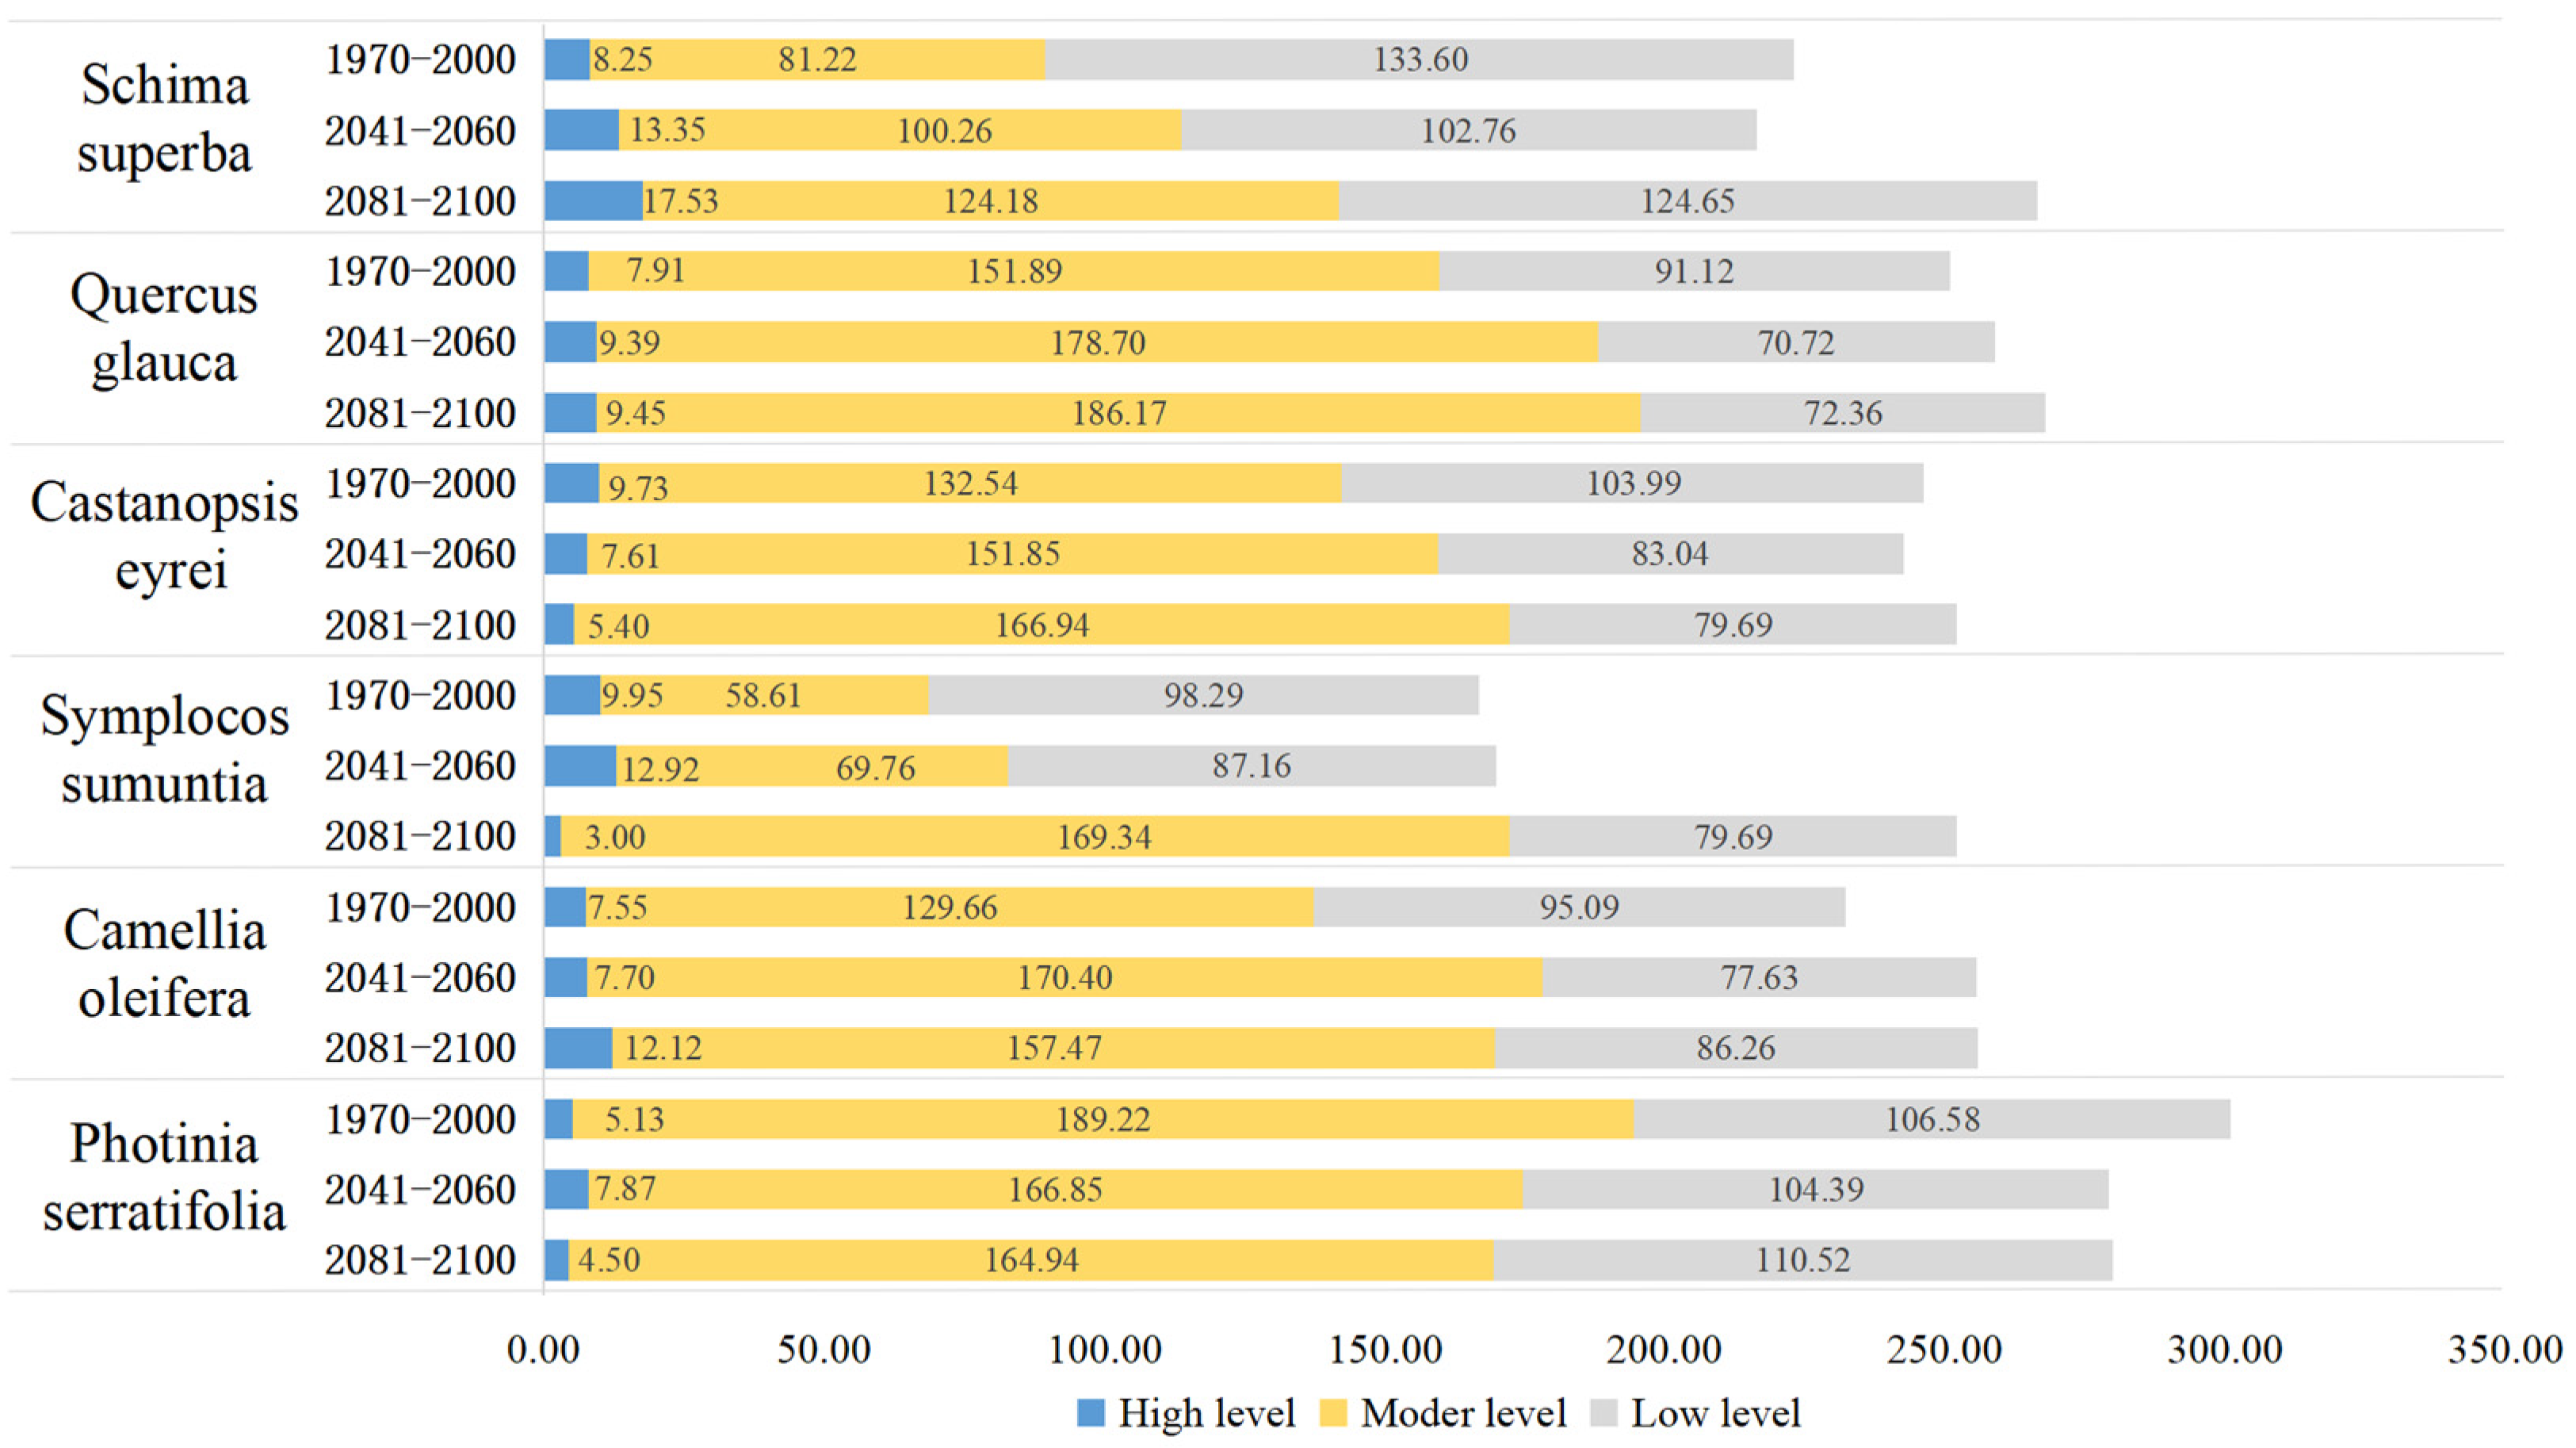
3.5. Changes in the Area of Suitable Growth Areas for Tree Species under Climate Change

The climate data used to predict the future distribution of tree species in this study are based on the bioclimate variable data that were obtained via the BBC-CSM2-MR climate model with medium emissions of SSP245. As shown in Figure 6, it was found that the high-suitability areas of Schima superba, Quercus glauca, and Camellia oleifera tree species, at different stages, gradually increased over time. Among these, Schima superba had the largest increase in its high-suitability area, while the high-suitability areas of Castanopsis eyrei, Symplocos submunitia, and Photonia serratifolia saw a certain degree of decrease by the year 2020. Among these, the area of the high-suitability areas of Symplocos sumuntia has decreased the most. Where there were changes in moderate-suitability zones, except for the area of Photonia serratifolia (which has gradually decreased), the area of the other tree species in moderate-suitability zones had a wide range. Table 6 shows the potential suitable area and changes in the tree species in different periods in the future climate change scenarios. Except for a decrease in the total suitable area of Photonia serratifolia, the other five types of ecologically fire-resistant forest species have shown an increasing trend. Among them, the potential growth area of Symplocos sumunta was found to be the largest as it will increase by 51.05% when compared to the historical period. The potential habitat area of Schima superba will increase by 19.41% when compared to the historical period, and Camellia oleifera will increase by 10.14%. When comparing the changes in the total suitable area of each tree species from the historical period to 2050, as well as from 2050 to 2090, it was found that the changes were more significant between 2050 and 2090 and that the total suitable area of each tree species showed a positive increase during this period.

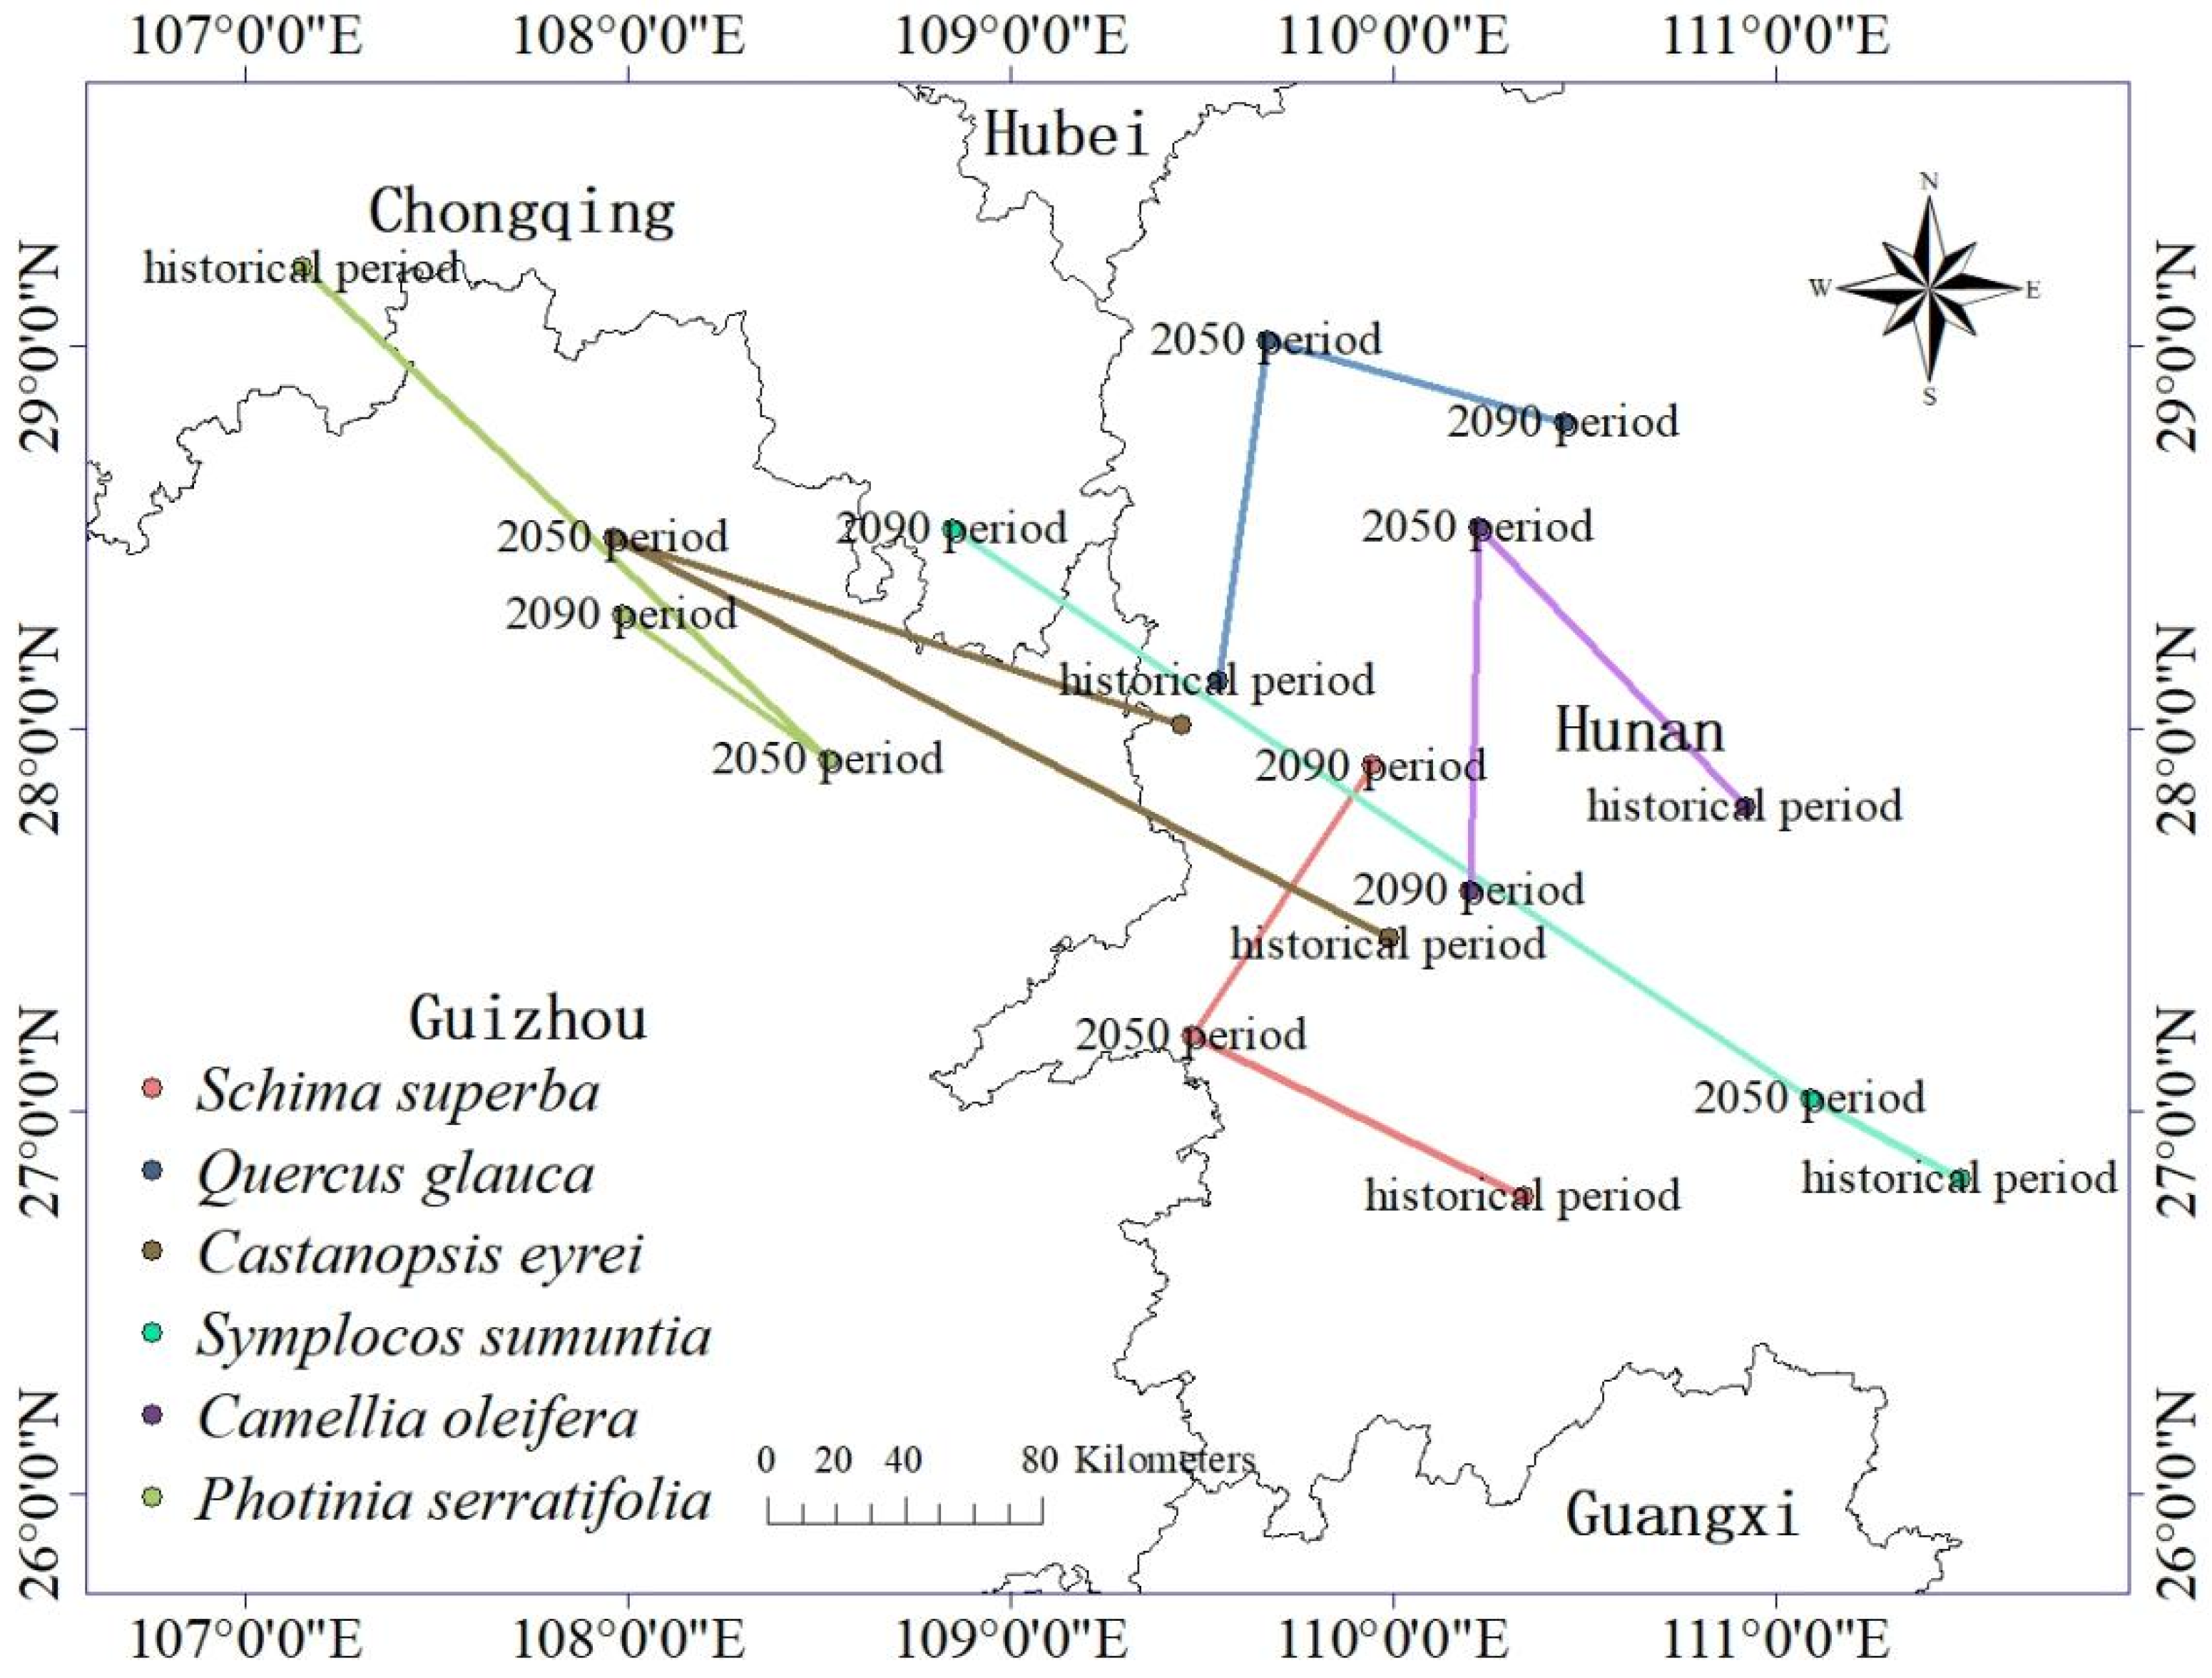
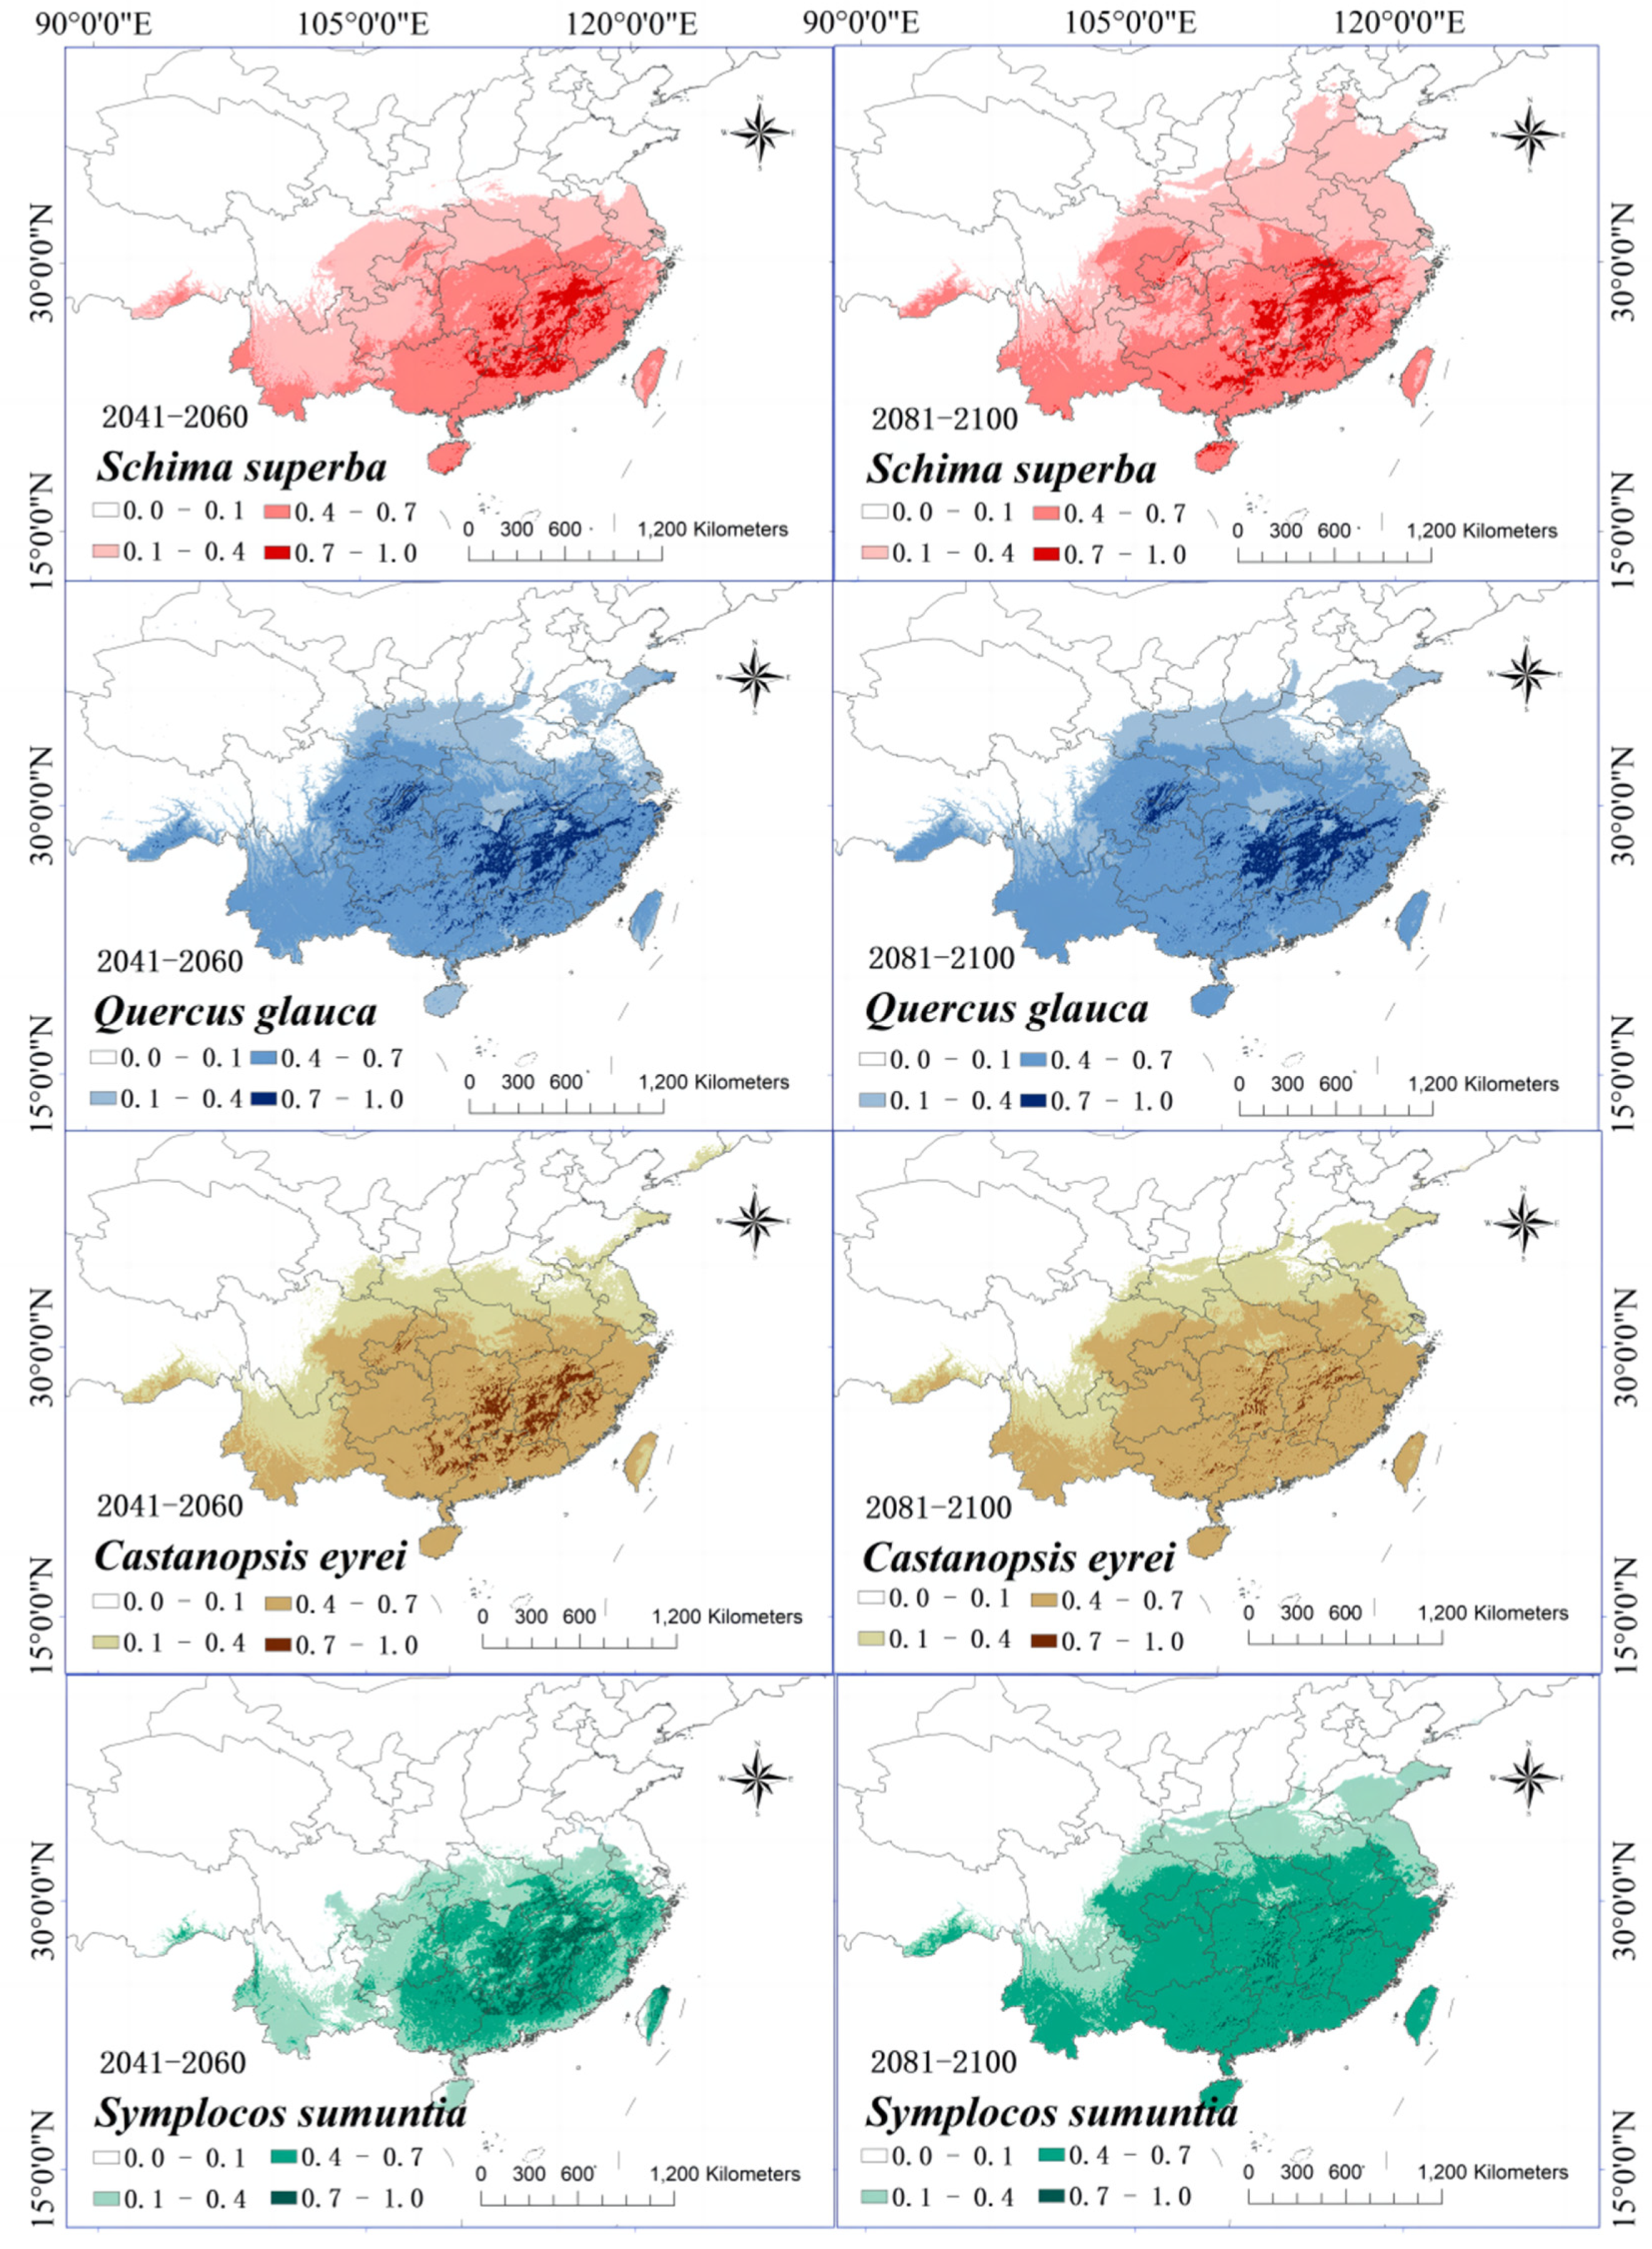
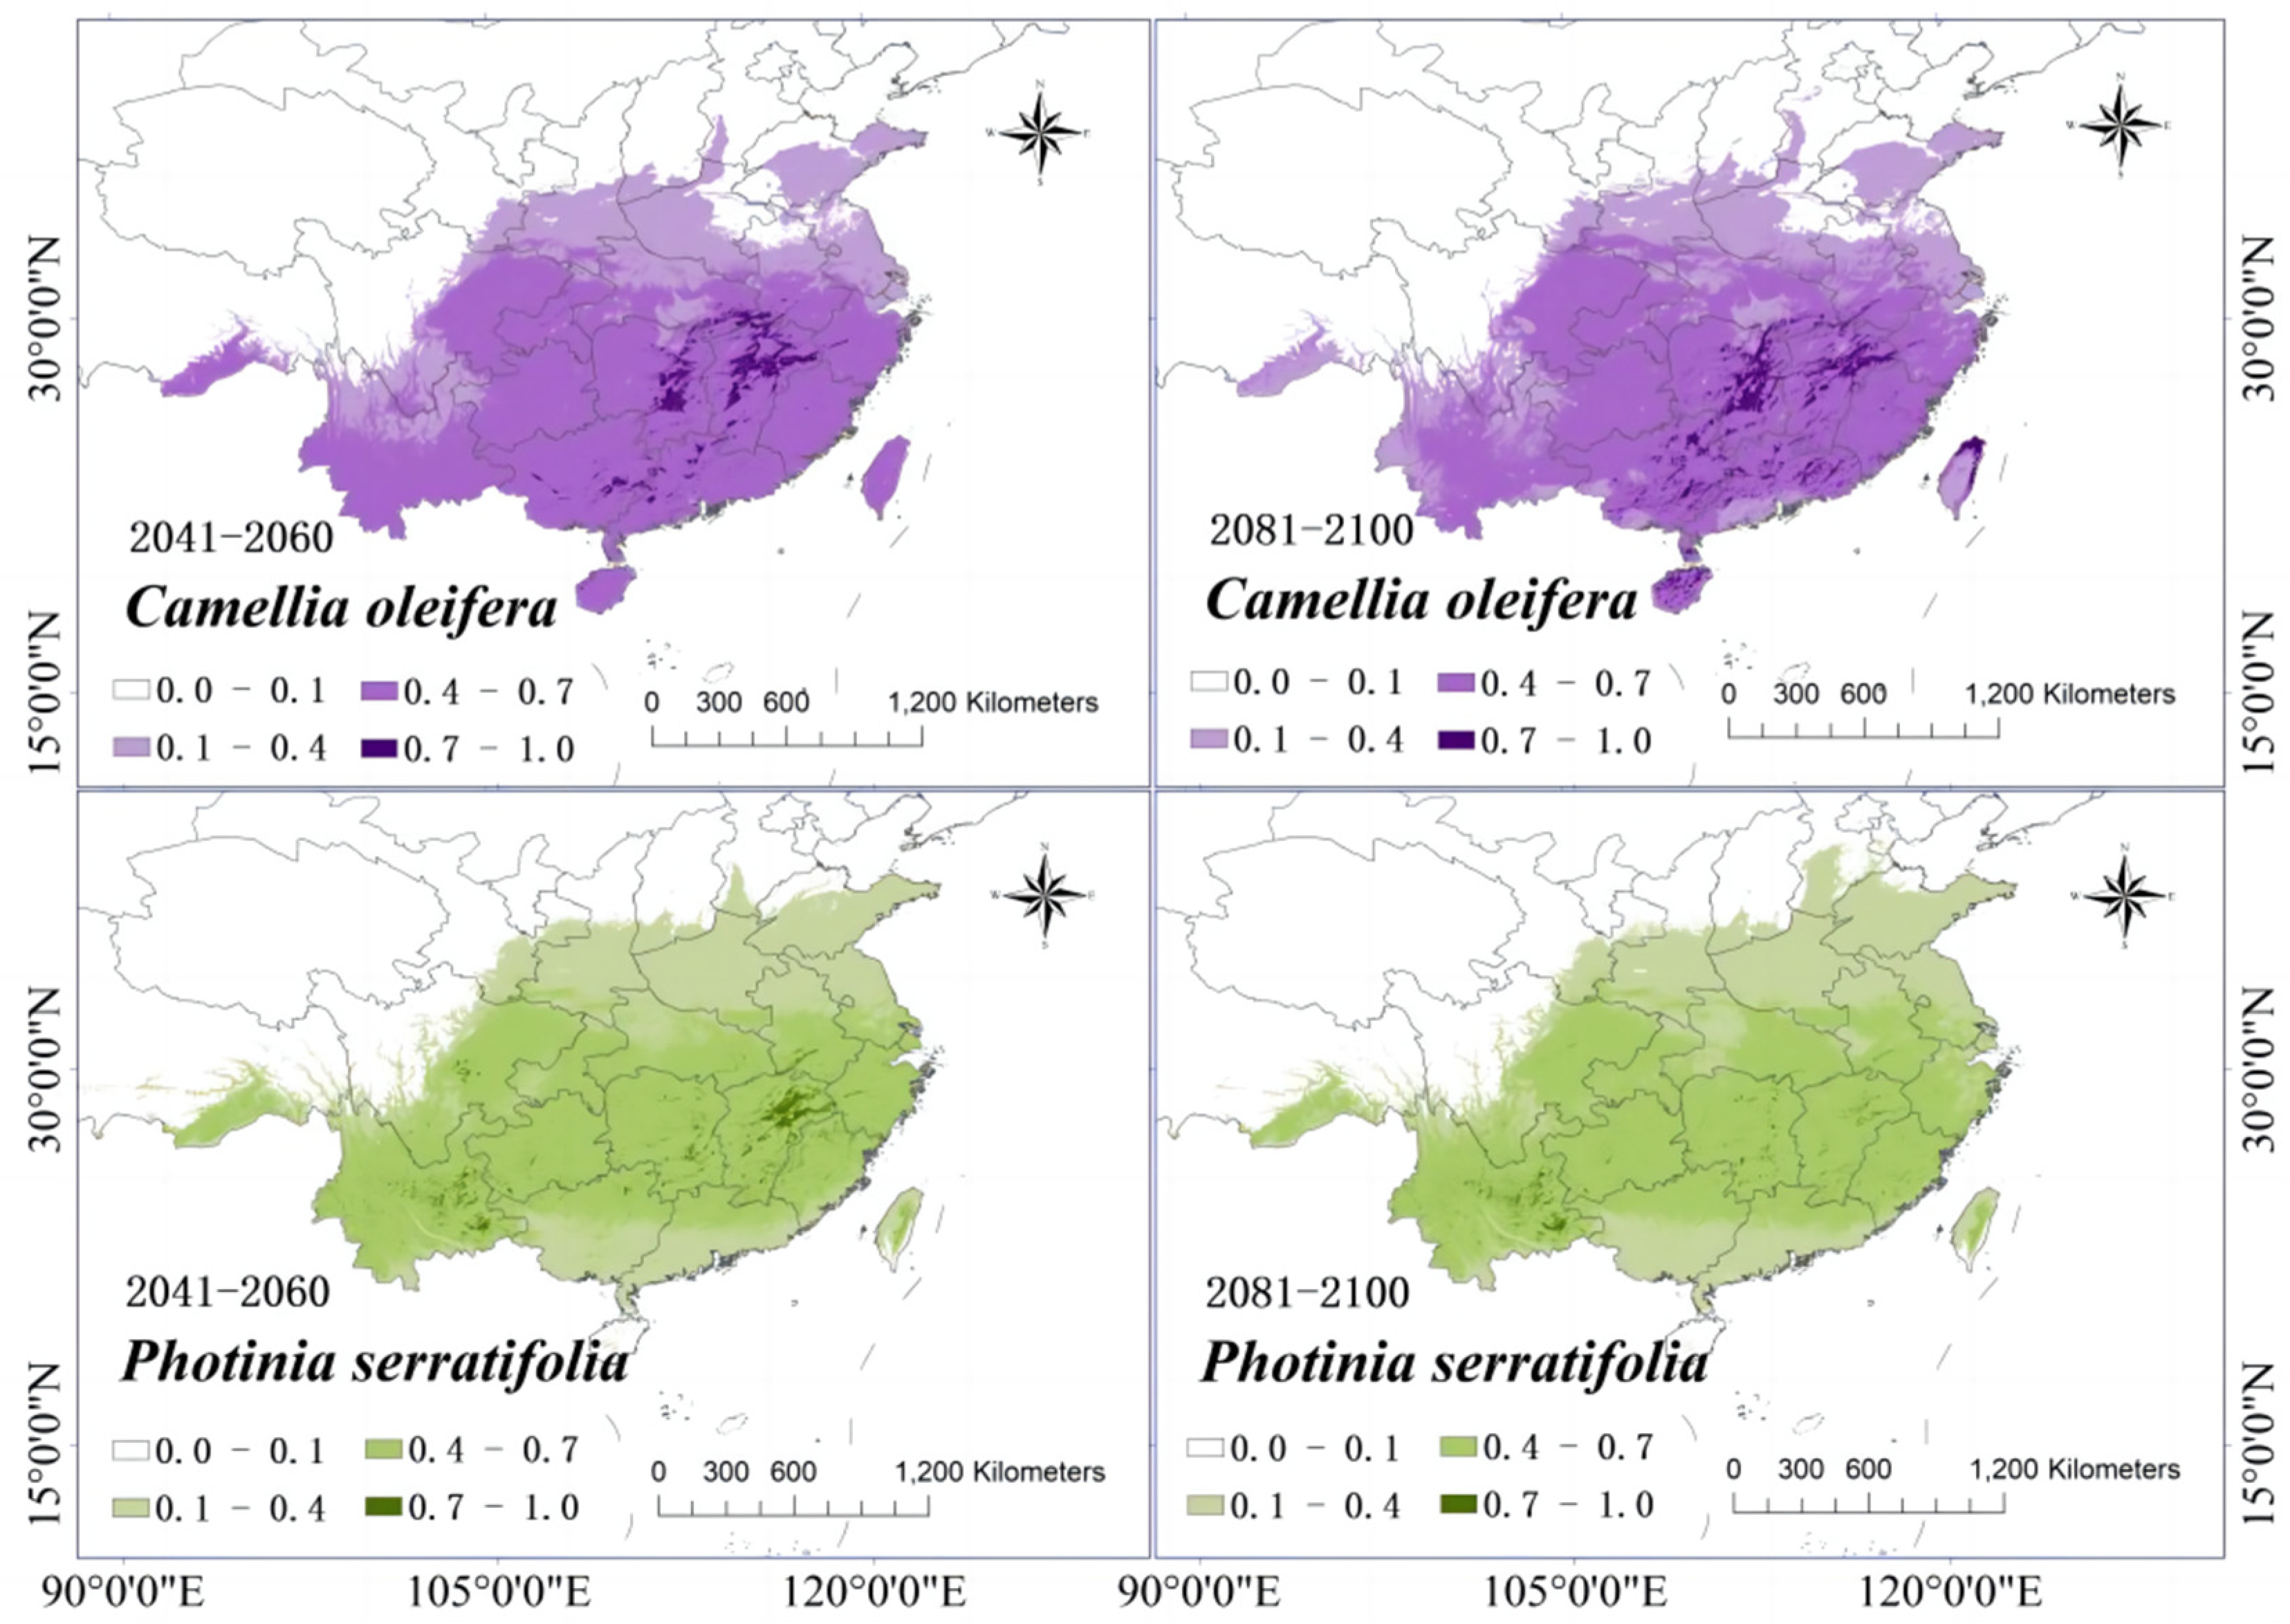
3.6. Changes in the Distribution of Suitable Growth Areas of Tree Species When under Climate Change

From Figure 8, it can be seen, from the centroid changes in the suitable growth areas of various tree species, that Schima superba has a large migration longitude span and develops northward as a whole. Quercus glauca shows a trend of migration toward the northeast, which will occur by the year 2090. The two tree species, Castanopsis eyrei and Symplocos sumuntia, will both migrate in the northwest direction, with Symplocos sumuntia migrating in the same direction from the historical period to 2050 and then to 2090 and beyond, with the largest migration span of the six tree species. In terms of time variation, the suitable growth areas of Camellia oleifera and Photonia serratifolia show a trend of moving southward, whereby Photonia serratifolia will migrate southward with a greater longitude and overall movement toward the southeast. The trend of Camellia oleifera moving southward, however, was noted to be slower, and its overall movement is toward the southwest.
The changes in the distribution areas of tree species were observed by combining the data in Figure 6 with the distribution of suitable areas for each tree species in the historical period and the data in Figure 9 with the distribution of suitable areas for each tree species in the future period. Schima superba is distributed in the high-suitability areas of northern Taiwan and has been removed from moderate-suitability areas. However, certain areas in Hainan Province have gradually evolved into high-suitability areas. The moderate-suitability areas of Schima superba have significantly increased in Sichuan, Chongqing, Yunnan, and Tibet, while the expansion of low-suitability areas has been most significant in the Shandong and Hebei regions. The high-suitability zone of Quercus glauca gradually converges over time toward the southeastern mountain areas within the Sichuan Basin and Hunan and Jiangxi provinces. The moderate-suitability zone has expanded in low-altitude areas of Taiwan, Hainan, Yunnan, and Tibet, while the low-suitability zone has increased in the hilly areas of Shandong. By 2050, the distribution area of highly suitable areas for Castanopsis eyrei will have increased in Hunan, Jiangxi, Guangdong, and Guangxi, but by 2090, the suitability of Castanopsis eyrei in these areas will have decreased and evolved into a moderately suitable area.
The high-suitability zone of Symplocos sumuntia gradually degenerates into a moderate-suitability zone over time, and the moderate-suitability and low-suitability zones are gradually expanding toward the southwest region. From the historical period to the future period, the changes in the Camellia oleifera suitable areas are more obvious. The high-suitability areas located in the Hunan region have been gradually increasing. The moderate-suitability areas in the Hainan region have been developing into high-suitability areas, and the low-altitude areas in Sichuan and Tibet have gradually become moderate-suitability areas. Compared to the regional changes in the suitable areas of other tree species, the distribution area of suitable areas for Photonia serratifolia has significantly decreased. By 2090, the high-suitability areas of Photonia serratifolia will only be scattered in Sichuan, Guizhou, Hunan, Jiangxi, and Fujian. The moderate- and low-suitability areas will gradually move northward, but the suitable areas located in Liaoning and Jilin provinces will disappear.

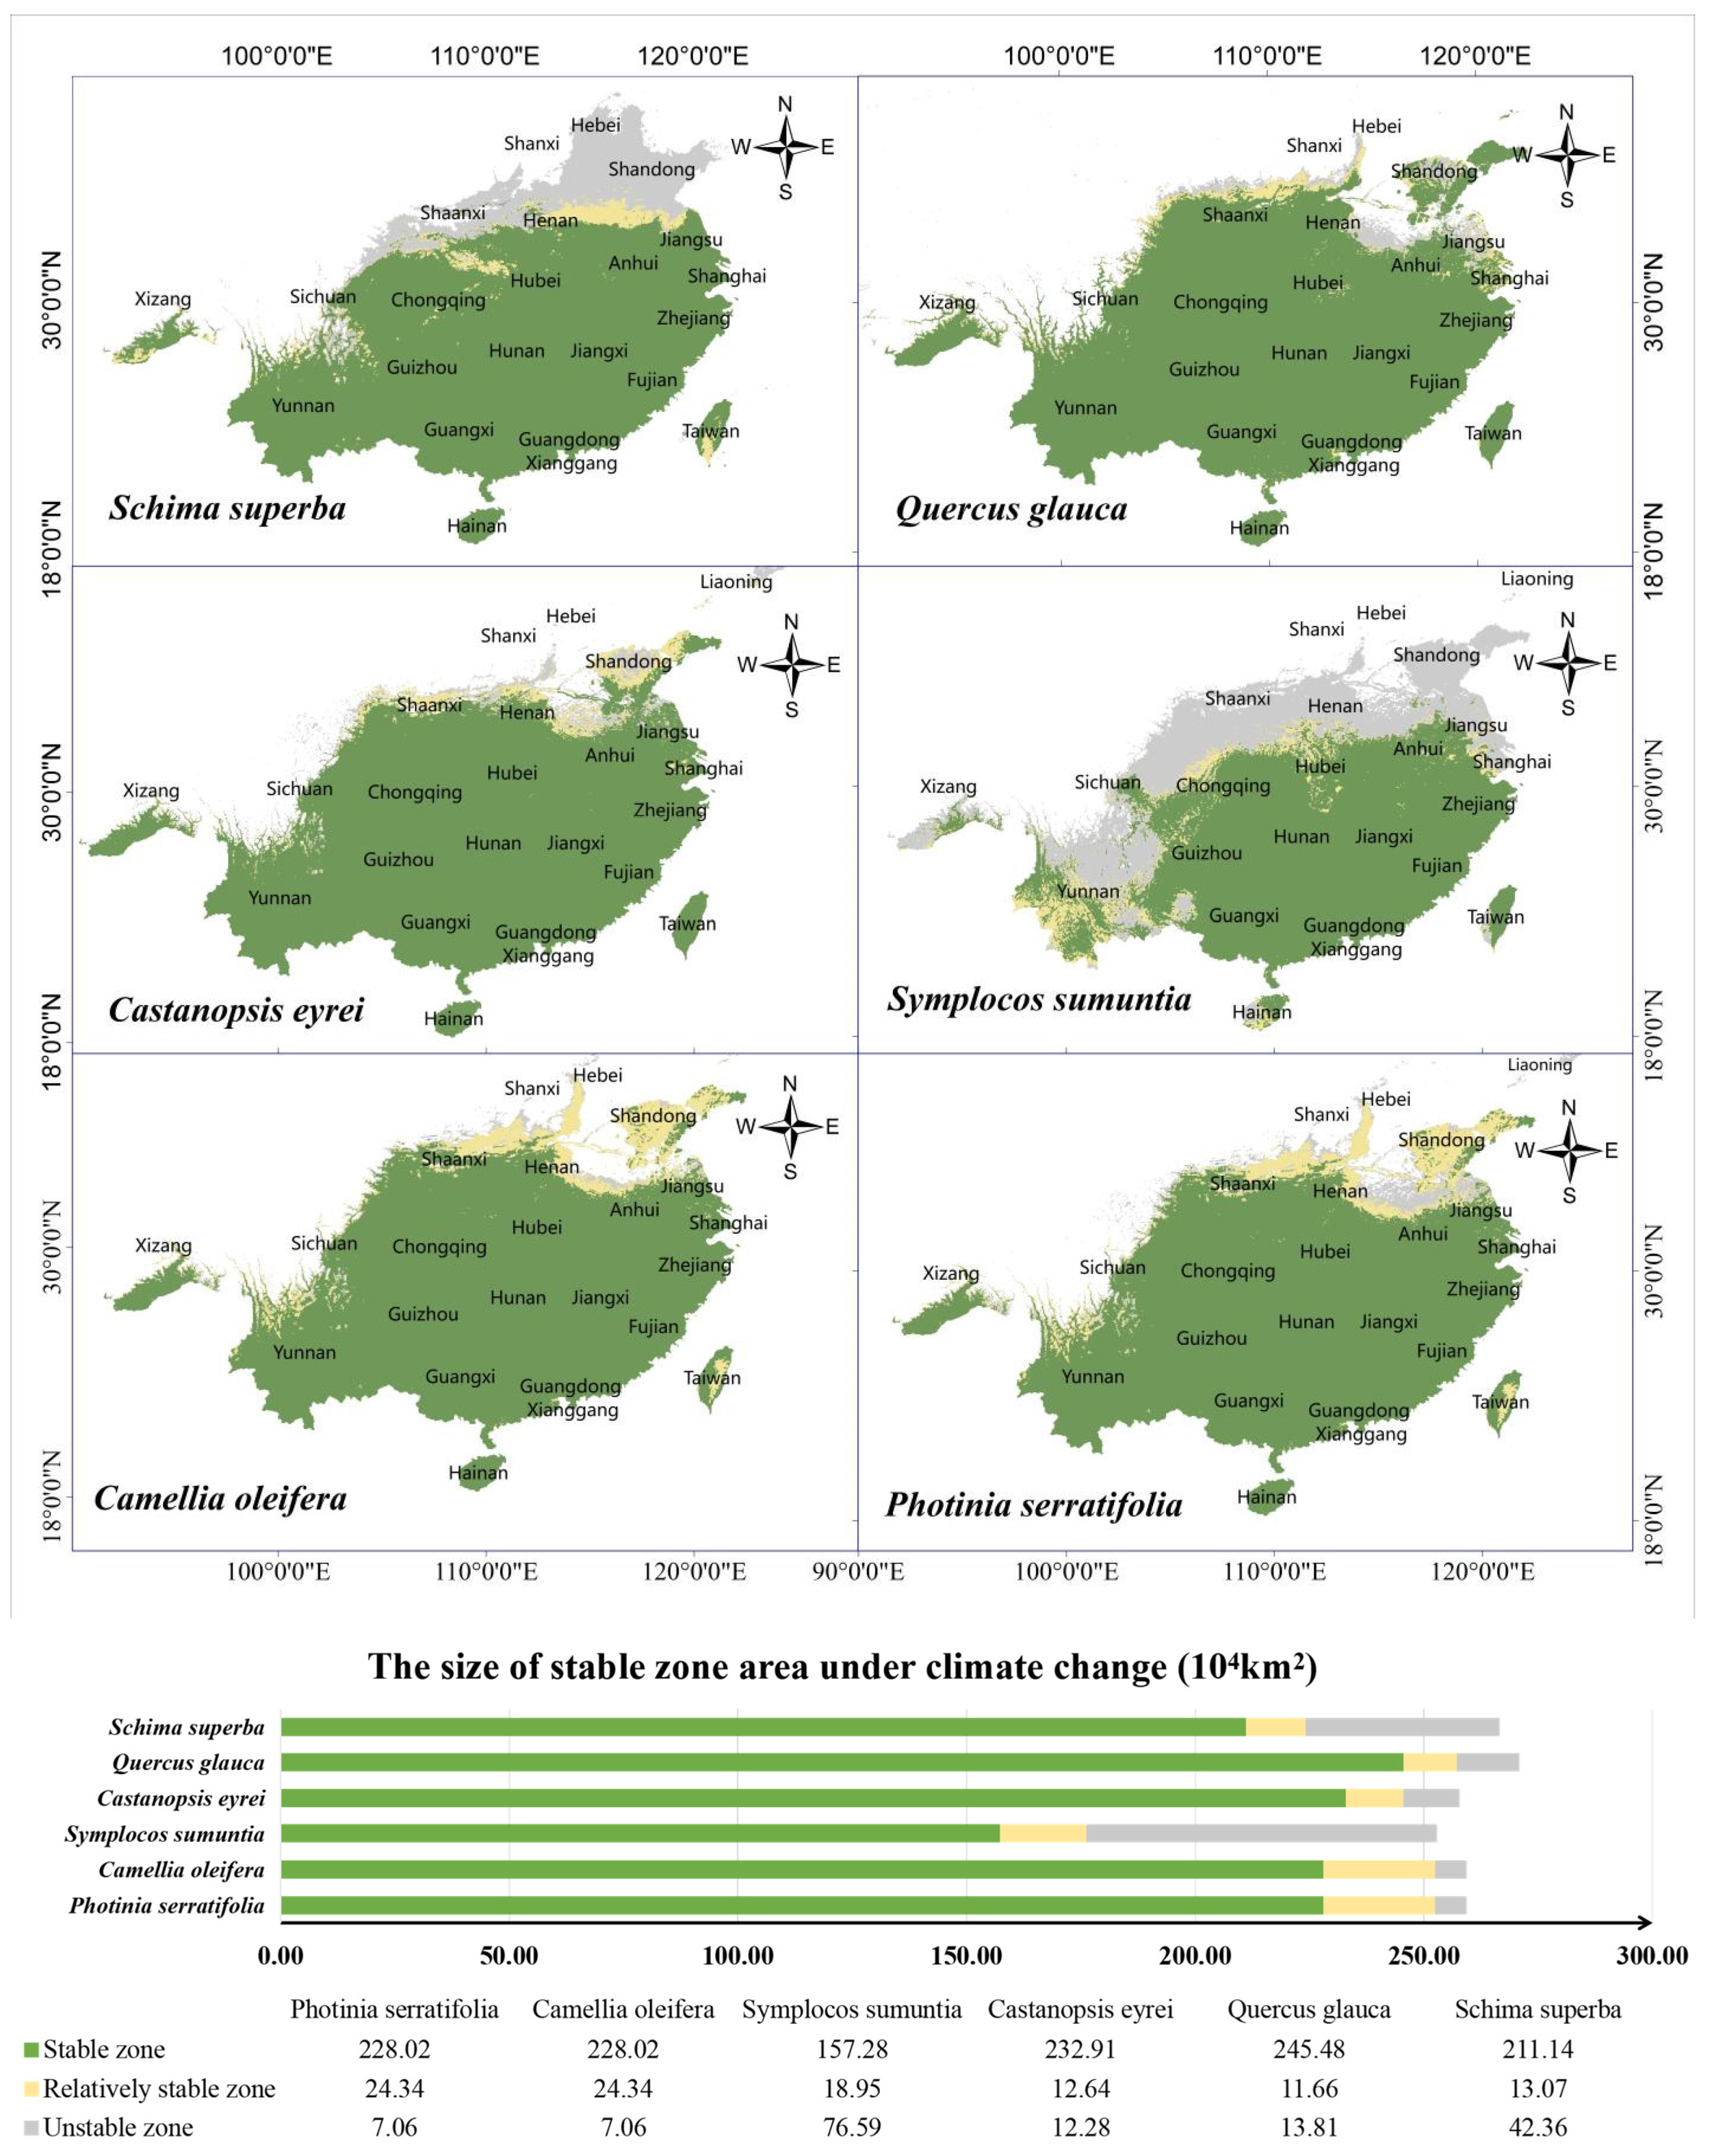
3.7. Stable and Suitable Distribution of Tree Species under Climate Change

As shown in Figure 10, when examining the distribution of stable and suitable areas of each tree species under climate change, it was found that, by 2090, the potentially suitable area of Photonia serratifolia will be the largest, and the stability of the suitable area will be the highest, while the distribution of the suitable area of Symplocos sumuntia will be the most unstable, with the unstable area accounting for one-third of its total suitable area. Guizhou, Hunan, Jiangxi, Fujian, Guangdong, and Guangxi have maintained excellent stability in the distribution and changes in the six ecological fire prevention forest species. Chongqing, Hubei, Anhui, and Zhejiang have good stability, while most suitable areas in Yunnan, Sichuan, Shaanxi, Henan, Jiangsu, Shandong, Hebei, Taiwan, and Hainan show an unstable state.

4. Discussion

This study used the R-based ENMeval optimization package to optimize the regulation frequency doubling and feature combination of the model. The area under the ROC curve (AUC) values of the optimized model were all greater than 0.9, indicating that the prediction accuracy of the model had reached an excellent level.
According to the sixth assessment report (AR6) released by the United Nations Intergovernmental Panel on Climate Change (IPCC) (titled “Climate Change 2021: Natural Science Foundations”), it is estimated that—in the coming decades—climate change in all regions will intensify, with global average temperatures rising by 1.5 °C. There will also be an increase in polar climate, an extension of the warm season, and a shortening of the cold season [40,41]. Climate change directly or indirectly affects biodiversity [42,43], resulting in significant changes in the horizontal and vertical distribution of species. In this study, the distribution of tree species was mainly influenced by annual mean temperature, mean diurnal range, isothermality, maximum temperature of the warmest month, minimum temperature of the coldest month, annual precipitation, precipitation of the driest month, and precipitation of the warmest quarter. In the future, with a gradual increase in greenhouse gases and the intensification of extreme climates, the range of climate factors that affect the distribution of tree species may also change [44].
The main climate variables that affect the distribution of Schima superba are annual mean temperature, precipitation of the driest month, and mean diurnal range difference between day and night. This is consistent with Ni Jian’s conclusion in 1996 that Schima superba adapts to a warm and rainy climate and is widely distributed in the subtropical regions of China [45]. Over time, the suitable growth areas of Schima superba have gradually expanded northward; by 2090, the total area of the suitable growth area will have increased by 19.41% compared to the historical period. The centroid of its suitable habitat will have moved northward from Suining County, Shaoyang City, Hunan Province (110.34° E, 26.77° N), to the Mayang Miao Autonomous Prefecture, Huaihua City (109.94° E, 27.90° N). The distribution of suitable habitats for Quercus glauca is greatly affected by water and heat [46]. Under the trend of global warming, its potential suitable habitat area will increase by 6.80% by 2090, and its centroid will move from Fenghuang County (109.54° E, 28.12° N) in western Hunan Province to Yuanling County (110.44° E, 28.80° N) in the northeast direction of Huaihua City. The distribution and trend of Quercus glauca under future climate change scenarios, as simulated by Cao Mingchang et al. using generalized models and classification regression trees in 2005, are basically consistent [47]. Castanopsis eyrei has a certain medicinal value [48], and the bark has good fire resistance [49]. Under the influence of climate change, the total suitable area for growing alum will decrease slightly from the historical period to 2050. By 2090, the suitable area for growing Castanopsis eyrei will have only increased by 2.34%. According to Jing Mengdan et al., the suitable living environment for Castanopsis eyrei has not changed for the better or worse with future temperature increases, which is basically consistent with the results of this experiment [50]. Because the response of Castanopsis eyrei to precipitation is more significant [51], its centroid will have undergone significant changes, moving from Zhongfang County (109.99° E, 27.45° N) in Huaihua City to Zunyi City (107.96° E, 28.50° N) in Guizhou Province, and then to Fenghuang County in Xiangxi (109.45° E, 28.01° N). Symplocaceae often grows in a warm and humid climate environment, preferring light and shade, with strong adaptability to temperature, high-temperature resistance, and strong cold resistance [52]. Because of its strong adaptability, in terms of climate change, the high-suitability growth areas for Symplocos sumuntia will have decreased compared to the historical period, but the total area of suitable growth areas will have increased by 51.05% compared to the historical period, mainly reflected in the moderate-suitability growth areas. The centroid of Symplocos sumuntia will move northwest due to climate change, spanning approximately 314.2 km from Dong’an County (111.45° E, 26.82° N) in Yongzhou City to Xiushan (108.85° E, 28.52° N) in Chongqing City. The research results show that the lowest temperature in the coldest month has a significant impact on the distribution of camellia oleifera, which is consistent with the findings of Hu Juanjuan et al. that Camellia oleifera has a lower resistance to low temperatures during climate change [53]. By the 2090 period, the suitable growth area of Camellia oleifera will have an expanding trend, with a total suitable growth area of approximately 2.5585 million km2, an increase of 10.41% compared to the total suitable growth area in the historical period. Furthermore, its centroid will change within Hunan Province, moving southwest from Anhua County (110.92° E, 27.79° N) in Yiyang City to Zhongfang County (110.20° E, 27.58° N) in Huaihua City. Photinia serratifolia has good water resistance [54], as well as average heat and cold resistance [55]. Its potential habitat area during the historical period was sufficient to reach 3.0092 million km2, accounting for about one-third of the total area of the country. Due to climate change, its habitat has experienced a trend of reduction, with the largest reduction seen between the historical period and 2050, a reduction of 7.25%.
By 2090, the stable growth areas of these six typical subtropical ecological fire-resistant tree species will mainly be concentrated in Guizhou, Hunan, Jiangxi provinces, and non-coastal areas of Fujian, Guangdong, and Guangxi. However, the following regions will be in an unstable state: the southwestern Yunnan and Sichuan regions, Shaanxi, Henan, and Shandong; Hebei regions north of the Qinling Huaihe River; and coastal Jiangsu, Taiwan, and Hainan regions. This is mainly due to climate sensitivity; Wu Hao et al. conducted a study on the sensitivity of climate change in China, indicating that climate change is evident in high-latitude, tropical, and subtropical regions, with the north and southwest being more sensitive. In addition, coastal areas are more sensitive due to the impact of strong precipitation caused by monsoons and typhoons [56].

5. Conclusions

This study used the MaxEnt model optimized by ENMeval to simulate the potential relationships between six typical fire-resistant forest species, environmental variables in subtropical China, and the potential distribution of tree species during the historical period. The AUC values of the optimized model are all higher than 0.9, indicating the optimal prediction results. The climate variables that have the greatest impact on the suitable habitat of Schima superba were the annual mean temperature, the precipitation of the driest month, and the mean diurnal range. Quercus glauca was mainly influenced by the minimum temperature of the coldest month and the precipitation of the warmest quarter. Castanopsis eyrei was mainly influenced by the precipitation of the driest month and the annual precipitation. The distribution of suitable growth areas for Symplocos sumuntia is mainly influenced by the precipitation of the driest month. The distribution of Camellia oleifera was influenced by the minimum temperature of the coldest month. The potential habitat distribution of Photinia serratifolia was greatly influenced by annual precipitation. Until 2090, the expansion degree of the suitable growth area will be Symplocos sumuntia (51.05%) > Schima superba (19.41%) > Camellia oleifera (10.14%) > Quercus glauca (6.80%) > Castanopsis eyrei (2.34%) > Photinia serratifolia (−6.97%). The centroid of Schima superba will migrate northward. Quercus glauca will migrate northeast. The suitable areas for the migration of Symplocos sumuntia and Castanopsis eyrei will move in a northwest direction, with repeated changes in alum migration, as well as with the largest migration span for Castanopsis eyrei. In addition, Camellia oleifera will move southwest. The centroid of Photinia serratifolia will migrate to the southeast. The six fire-resistant tree species in this study were noted to have excellent stability in Guizhou, Hunan, Jiangxi, Fujian, Guangdong, and Guangxi.
In the current study, only the bioclimate variable data under the SSP245 scenario in the BBC-CSM2-MR climate model were used for the prediction of future suitable habitats. When considering the complexity of climate change in the future, scenario models can be added in later experiments to obtain simulation results under multiple scenarios so as to improve the research results on suitable habitats.

Funding

This research was funded by [Jianjun Li] grant number 2022YFD2200505 and 2022JJ31000.

Acknowledgments

I am grateful to the following individuals for their professional knowledge and assistance in various aspects of our research, as well as for their assistance in writing the manuscript. Qiu provided guidance on the structure and language of the paper. Wu provided his professional knowledge in algorithms and programming languages. Chen has made significant contributions to the conceptualization. Li made critical revisions to the paper based on important academic content. Here, I would like to once again express my gratitude to them.

Conflicts of Interest

The authors declare no conflict of interest.

References

  1. Curran, T.J.; Perry GL, W.; Wyse, S.V.; Alam, M.A. Managing fire and biodiversity in the wildland-urban interface: A role for green firebreaks. Fire 2017, 1, 3. [Google Scholar] [CrossRef]
  2. Si, L.; Shu, L.; Wang, M.; Zhao, F. Review on the Difference of Fireproof Efficiency of Biological Fire-resistance Forest Belt. Terr. Ecosyst. Conserv. 2022, 2, 53–59. [Google Scholar]
  3. Platt, K.; Jackman, E.R. The Cheatgrass Problem in Oregon; Federal Cooperative Extension Service, Oregon State College: Corvallis, OR, USA, 1946. [Google Scholar]
  4. Shu, L.; Tian, X.; Li, H. Research progress on fire resistant forest belts. For. Sci. 1999, 35, 80–85. [Google Scholar]
  5. Ryu, S.R.; Choi, H.T.; Lim, J.H.; Lee, I.-K.; Ahn, Y.-S. Post-fire restoration plan for sustainable forest management in South Korea. Forests 2017, 8, 188. [Google Scholar] [CrossRef]
  6. Xiong, D.; Xiaoming, L.; Ximing, Z.; Wanhui, Y.; Forezki, A.; Runge, M. Studies on gas exchange of Tamarix ramosissima Labd. Acta Ecol. Sin. 2003, 23, 180–187. [Google Scholar]
  7. Cui, X.; Alam, M.A.; Perry, G.L.; Paterson, A.M.; Wyse, S.V.; Curran, T.J. Green firebreaks as a management tool for wildfires: Lessons from China. J. Environ. Manag. 2019, 233, 329–336. [Google Scholar] [CrossRef]
  8. Deng, Y. Characteristics and Prevention and Control Strategies of Forest Fires in Zijin County. Low Carbon World 2022, 12, 187–189. [Google Scholar]
  9. Lai, G. Exploration on the Management and Benefits of Oil Tea Fireproof Forest Belt Tending in Sanming Mountain Area. J. Green Sci. Technol. 2017, 147–148. [Google Scholar]
  10. Xia, C.; Wang, C. Analysis on biological fire prevention project in Greater Khingan forest area. For. Fire Prev. 2004, 24–25. [Google Scholar]
  11. Ou, T.-H.; Qian, W.-H. Vegetation variations along the monsoon boundary zone in East Asia. Chin. J. Geophys. 2006, 49, 627–636. [Google Scholar] [CrossRef]
  12. Tian, X.; Shu, L. The application and research of fire break forest belts. World For. Res. 2000, 13, 20–26. [Google Scholar]
  13. Gu, W.; Lu, Z.; Huang, C.; Li, Y.; Guan, Y. Screening study of fire resistant tree species in Jianshui County, Yunnan Province of southwestern China. J. Beijing For. Univ. 2020, 42, 49–60. [Google Scholar]
  14. Zeng, S.-P.; Liu, F.-L.; Zhao, M.-F.; Ai, Y.; Chen, X.-W. Age-and organ-related variances in fire resistance traits of typical tree species in subtropical China. Ying Yong Sheng Tai Xue Bao J. Appl. Ecol. 2020, 31, 1063–1072. [Google Scholar]
  15. Wang, X.; Liu, G.; Xiao, T. Suitability Characteristics of Camellia oleifera Growth under Climate Change Scenarios. Trop. Geogr. 2020, 40, 868–880. [Google Scholar]
  16. Liu, X.-T.; Yuan, Q.; Ni, J. Research advances in modelling plant species distribution in China. Chin. J. Plant Ecol. 2019, 43, 273–283. [Google Scholar] [CrossRef]
  17. Pearson, R.G.; Raxworthy, C.J.; Nakamura, M.; Peterson, A.T. Predicting species distributions from small numbers of occurrence records: A test case using cryptic geckos in Madagascar. J. Biogeogr. 2007, 34, 102–117. [Google Scholar] [CrossRef]
  18. Zhang, J.; Zhang, Y.; Liu, L.; Nie, Y. Predicting Potential Distribution of Tibetan Spruce (Picea smithiana) in Qomolangma (Mount Everest) National Nature Preserve Using Maximum Entropy Niche-based Model. Chin. Geogr. Sci. 2011, 21, 417–426. [Google Scholar] [CrossRef]
  19. Miao, J.; Wang, Y.; Wang, L.; Xu, X. Prediction of potential geographical distribution pattern change for Castanopsis sclerophylla on MaxEnt. J. Nanjing Fore. Univ. 2021, 45, 193–198. [Google Scholar]
  20. Halvorsen, R. A strict maximum likelihood explanation of MaxEnt, and some implications for distribution modelling. Sommerfeltia 2013, 36, 1–132. [Google Scholar] [CrossRef]
  21. Muscarella, R.; Galante, P.J.; Soley-Guardia, M.; Boria, R.A.; Kass, J.M.; Uriarte, M.; Anderson, R.P. ENM eval: An R package for conducting spatially independent evaluations and estimating optimal model complexity for Maxent ecological niche models. Methods Ecol. Evol. 2014, 5, 1198–1205. [Google Scholar] [CrossRef]
  22. Zhang, S.-H.; Bai, H.-Y.; Qi, G.-Z.; Liang, J. Changes of climate zone boundary of the Qinling Mountains from 1960 to 2019. J. Nat. Resour. 2021, 36, 2491–2506. [Google Scholar] [CrossRef]
  23. Yan, X.; MacKinnon, J.; Li, D. Study on biogeographical divisions of China. Biodivers. Conserv. 2004, 13, 1391–1417. [Google Scholar]
  24. Du, L.; Wu, Z.; Wu, Q.; Guo, L.; Dong, X.; Lin, S. Temporal and Spatial Correlation Between Forest Loss and Forest Fire in the Ecological Region of Southern China. J. Southwest For. Univ. 2022, 42, 138–147. [Google Scholar]
  25. Tan, J.; Huang, A.; Shi, X.; Zhang, Y.; Zhang, Y.; Cao, L.; Wu, Y. Evaluating the Performance of BCC-CSM2-MR Model in Simulating the Land Surface Processes in China. Plateau Meteorol. 2022, 41, 1335–1347. [Google Scholar]
  26. Phillips, S.J.; Dudík, M.; Schapire, R.E. A maximum entropy approach to species distribution modeling. In Proceedings of the Twenty-First International Conference on Machine Learning, Banff, AB, Canada, 4–8 July 2004. [Google Scholar]
  27. Phillips, S.J.; Anderson, R.P.; Schapire, R.E. Maximum entropy modeling of species geographic distributions. Ecol. Model. 2006, 190, 231–259. [Google Scholar] [CrossRef]
  28. Elith, J.; Phillips, S.J.; Hastie, T.; Dudík, M.; Chee, Y.E.; Yates, C.J. A statistical explanation of MaxEnt for ecologists. Divers. Distrib. 2011, 17, 43–57. [Google Scholar] [CrossRef]
  29. Phillips, S.J.; Dudík, M. Modeling of species distributions with Maxent: New extensions and a comprehensive evaluation. Ecography 2008, 31, 161–175. [Google Scholar] [CrossRef]
  30. Kumar, P. Assessment of impact of climate change on Rhododendrons in Sikkim Himalayas using Maxent modelling: Limitations and challenges. Biodivers. Conserv. 2012, 21, 1251–1266. [Google Scholar] [CrossRef]
  31. Zhao, G.; Cui, X.; Sun, J.; Li, T.; Wang, Q.; Ye, X.; Fan, B. Analysis of the distribution pattern of Chinese Ziziphus jujuba under climate change based on optimized biomod2 and MaxEnt models. Ecol. Ind. 2021, 132, 108256. [Google Scholar] [CrossRef]
  32. Syfert, M.M.; Smith, M.J.; Coomes, D.A. The effects of sampling bias and model complexity on the predictive performance of MaxEnt species distribution models. PLoS ONE 2013, 8, e55158. [Google Scholar] [CrossRef]
  33. Kumar, S.; Stohlgren, T.J. Maxent modeling for predicting suitable habitat for threatened and endangered tree Canacomyrica monticola in New Caledonia. J. Ecol. Nat. Environ. 2009, 1, 94–98. [Google Scholar]
  34. Wang, Y.; Xie, B.; Wan, F.; Xiao, Q.; Dai, L. Application of ROC curve analysis in evaluating performance of alien species’ potential distribution models. Biodivers. Sci. 2007, 15, 365–372. [Google Scholar]
  35. Bradley, A.P. The use of the area under the ROC curve in the evaluation of machine learning algorithms. Pattern Recognit. 1997, 30, 1145–1159. [Google Scholar] [CrossRef]
  36. Liu, B.; Gao, X.; Zheng, K.; Ma, J.; Jiao, Z.; Xiao, J.; Wang, H. The potential distribution and dynamics of important vectors Culex pipiens pallens and Culex pipiens quinquefasciatus in China under climate change scenarios: An ecological niche modelling approach. Pest Manag. Sci. 2020, 76, 3096–3107. [Google Scholar] [CrossRef] [PubMed]
  37. Pulliam, H.R. On the relationship between niche and distribution. Ecol. Lett. 2000, 3, 349–361. [Google Scholar] [CrossRef]
  38. Bowers, A.J.; Zhou, X. Receiver operating characteristic (ROC) area under the curve (AUC): A diagnostic measure for evaluating the accuracy of predictors of education outcomes. J. Educ. Stud. Placed Risk 2019, 24, 20–46. [Google Scholar] [CrossRef]
  39. Carrington, A.M.; Manuel, D.G.; Fieguth, P.W.; Ramsay, T.; Osmani, V.; Wernly, B.; Bennett, C.; Hawken, S.; McInnes, M.; Magwood, O. Deep ROC analysis and AUC as balanced average accuracy to improve model selection, understanding and interpretation. arXiv 2021, arXiv:2103.11357. [Google Scholar]
  40. Arias, P.; Bellouin, N.; Coppola, E.; Jones, G.; Krinner, J.; Marotzke, V.; Naik, M.D.; Palmer, G.-K.; Plattner, J.; Rogelj, M.; et al. Climate Change 2021: The Physical Science Basis. In Contribution of Working Group I to the Sixth Assessment Report of the Intergovernmental Panel on Climate Change; Technical Summary; Cambridge University Press: Cambridge, UK, 2021. [Google Scholar]
  41. Shaohong, W.; Qingchen, C.; Jiangbo, G.; Liu, L.; Feng, A.; Deng, H.; Zuo, L.; Liu, W. Identification of regional pattern of climate change risk in China under different global warming targets. J. Geogr. Sci. 2023, 33, 429–448. [Google Scholar]
  42. Brooker, R.; Young, J.C.; Watt, A.D. Climate change and biodiversity: Impacts and policy development challenges–a European case study. Int. J. Biodivers. Sci. Manag. 2007, 3, 12–30. [Google Scholar] [CrossRef]
  43. Hays, G.C.; Richardson, A.J.; Robinson, C. Climate change and marine plankton. Trends Ecol. Evol. 2005, 20, 337–344. [Google Scholar] [CrossRef]
  44. Sun, S.; Zhang, Y.; Huang, D.; Wang, H.; Cao, Q.; Fan, P.; Yang, N.; Zheng, P.; Wang, R. The effect of climate change on the richness distribution pattern of oaks (Quercus L.) in China. Sci. Total Environ. 2020, 744, 140786. [Google Scholar] [CrossRef] [PubMed]
  45. Jian, N. Relationship between geographical distribution of Schima superba, its forest and climate in China. J. Plant Resour. Environ. 1996, 5, 28–34. [Google Scholar]
  46. Ouyang, Z.Y.; Li, Z.H.; Ouyang, S.L.; Chen, Y.; Zhou, Z.; Wu, J. Prediction of the potential distribution of Cyclobalanopsis gilva in China based on the Maxent and ArcGIS model. J. Central South Univ. For. Technol. 2023, 43, 19–26. [Google Scholar]
  47. Cao, M.C.; Zhou, G.S.; Weng, E.S. Application and comparison of generalized models and classification and regression tree in simulating tree species distribution. Acta Ecol. Sin. 2005, 25, 2031–2040. [Google Scholar]
  48. Pan, L.; Yang, T.; Liao, N.; Tong, X.; He, L.; Liu, B. Medicinal Value and Biological Prospect Prediction of Symplocos. J. Anhui Agric. Sci. 2018, 46, 8–11. [Google Scholar]
  49. Wen, K.; Ouyang, Y. Study on bark fire resistance of 11 evergreen broadleaved tree species. South China For. Sci. 2018, 46, 50–53. [Google Scholar]
  50. Jing, M.; Zhu, L.; Cherubini, P.; Yuan, D.; Li, Z.; Wang, X.; Liu, S. Responses of radial growth of Pinus massoniana and Castanopsis eyrei to climate change at different elevations in south China. Ecol. Ind. 2022, 145, 109602. [Google Scholar] [CrossRef]
  51. Su, X.; Chen, S.; Tong, J. The preliminary study of the correlation between the distribution of main tree species and the climate factors in Fujian Province. J. Fujian Coll. For. 2001, 21, 371–375. [Google Scholar]
  52. Pan, X.; Chi, H.; Lin, H.; Du, H.; Huang, S.; Jin, K.; Lu, L.; Han, S. Preliminary report on the introduction experiment of angular alum in coastal areas of Wenzhou. J. Green Sci. Technol. 2019, 45–49. [Google Scholar]
  53. Hu, J.; Wu, W.; Cao, Z.; Wen, J.; Shu, Q.; Fu, S. Morphological, physiological and biochemical responses of Camellia oleifera to low-temperature stress. Pak. J. Bot. 2016, 48, 899–905. [Google Scholar]
  54. Liang, H.-H.; Chen, S.; Zhao, B.; Zhong, Y.-T.; Ma, W.-J.; Li, Y. A Comparative Study on Inundation Tolerance of 7 hrub Seedling under Waterlogging Stress. J. Northwest For. Univ. 2020, 35, 61–67. [Google Scholar]
  55. Wang, Q.; Yu, W.; Li, Y.; Wang, H.; Sun, J. Comprehensive evaluation of cold tolerance on 6 evergreen broad—Left tree specifications. J. Shandong For. Sci. Technol. 2016, 46, 14–19+6. [Google Scholar]
  56. Wu, H.; Hou, W.; Qian, Z.-H.; Hu, J.-G. The research on the sensitivity of climate change in China in recent 50 years based on composite index. Acta Phys. Sin. 2012, 61, 149205. [Google Scholar] [CrossRef]
Figure 1. Flow chart of the MaxEnt prediction experiment.
Forests 14 01897 g001
Figure 2. Distribution points of various tree species after screening.
Forests 14 01897 g002
Figure 3. Thermodynamic diagram for correlation analysis of ecological environment variables.
Forests 14 01897 g003
Figure 4. Area under the ROC curve (AUC) value of the model.
Forests 14 01897 g004
Figure 5. Response curve of ecological environment variables.
Forests 14 01897 g005
Figure 6. Distribution of suitable growing areas for various tree species in the historical period.
Forests 14 01897 g006
Figure 7. Suitable growth area of tree species at different stages.
Forests 14 01897 g007
Figure 8. Changes in the centroid of suitable growth areas for various tree species.
Forests 14 01897 g008
Figure 9. Distribution of suitable growing areas for various tree species in the future.
Forests 14 01897 g009aForests 14 01897 g009b
Figure 10. Stable distribution areas of tree species under climate change.
Forests 14 01897 g010
Table 1. Ecological environment variables.
CodeEnvironmental FactorUnit
Bio_1Annual Mean Temperature°C
Bio_2Mean Diurnal Range°C
Bio_3Isothermality%
Bio_4Temperature Seasonality°C
Bio_5Max. Temperature of Warmest Month°C
Bio_6Min. Temperature of Coldest Month°C
Bio_7Temperature Annual Range°C
Bio_8Mean Temperature of Wettest Quarter°C
Bio_9Mean Temperature of Driest Quarter°C
Bio_10Mean Temperature of Warmest Quarter°C
Bio_11Mean Temperature of Coldest Quarter°C
Bio_12Annual Precipitationmm
Bio_13Precipitation of Wettest Monthmm
Bio_14Precipitation of Driest Monthmm
Bio_15Precipitation Seasonality%
Bio_16Precipitation of Wettest Quartermm
Bio_17Precipitation of Driest Quartermm
Bio_18Precipitation of Warmest Quartermm
Bio_19Precipitation of Coldest Quartermm
Dem m
Aspect °
Slope °
Table 2. Parameter combinations.
FCsRM
L0.511.522.533.54
LQ0.511.522.533.54
H0.511.522.533.54
LQH0.511.522.533.54
LQHP0.511.522.533.54
LQHPT0.511.522.533.54
Table 3. Ecological environment variables after screening of various tree species.
Tree SpeciesEcological Environment Variables
Schima superbaBio_1, Bio_2, Bio_3, Bio_5, Bio_7, Bio_14, Bio_18, Aspect, Slope
Quercus glaucaBio_5, Bio_6, Bio_7, Bio_8, Bio_12, Bio_18, Aspect, Slope
Castanopsis eyreiBio_2, Bio_4, Bio_6, Bio_12, Bio_14, Aspect, Slope
Symplocos sumuntiaBio_2, Bio_3, Bio_5, Bio_8, Bio_14, Bio_15, Aspect, Slope, dem
Camellia oleiferaBio_2, Bio_4, Bio_5, Bio_6, Bio_8, Bio_14, Bio_18, Aspect, Slope
Photinia serratifoliaBio_3, Bio_12, Bio_18, Aspect, Slope
Table 4. Model evaluation indicators under different parameter settings.
Tree SpeciesTypeFCRMDelta AICcOR10
Schima superbaOptimumLQ100.14
DefaultLQHPT155.550.21
Quercus glaucaOptimumLQHP1.500.14
DefaultLQHPT128.070.27
Castanopsis eyreiOptimumLQH200.18
DefaultLQHPT130.430.23
Symplocos sumuntiaOptimumLQH1.500.21
DefaultLQHPT166.560.28
Camellia oleiferaOptimumLQHPT200.19
DefaultLQHPT147.100.24
Photinia serratifoliaOptimumLQHP200.40
DefaultLQHPT125.990.54
Table 5. Percentage contribution and permutation importance of ecological environment variables.
Tree SpeciesVariablePCPI
Schima superbaBio_159.82.5
Bio_1416.13
Bio_212.53.8
Quercus glaucaBio_666.833.4
Bio_1813.80.2
Slope7.26.3
Castanopsis eyreiBio_1457.93.6
Bio_1220.73.6
Bio_67.767.4
Symplocos sumuntiaBio_1473.439.5
Bio_59.36
Bio_65.747.9
Camellia oleiferaBio_668.459.7
Bio_147.81
Bio_55.63.1
Photinia serratifoliaBio_1282.389.5
Bio_37.73
Slope4.42.1
Table 6. Potential suitable habitat area and changes in tree species in different periods.
Tree SpeciesHistoric PeriodHistoric Period to 20502050Future 2050 to 20902090Historic Period to 2090
Area ChangeChange AmplitudeArea ChangeChange AmplitudeArea ChangeChange Amplitude
Schima superba223.06−6.70−3.00%216.3749.9923.10%266.3643.2919.41%
Quercus glauca250.927.903.15%258.829.173.54%267.9917.076.80%
Castanopsis eyrei246.26−3.75−1.52%242.519.513.92%252.025.762.34%
Symplocos sumuntia166.843.001.80%169.8582.1748.38%252.0285.1751.05%
Camellia oleifera232.2923.4410.09%255.730.120.05%255.8523.5610.14%
Photinia serratifolia300.92−21.81−7.25%279.110.840.30%279.95−20.97−6.97%
Disclaimer/Publisher’s Note: The statements, opinions and data contained in all publications are solely those of the individual author(s) and contributor(s) and not of MDPI and/or the editor(s). MDPI and/or the editor(s) disclaim responsibility for any injury to people or property resulting from any ideas, methods, instructions or products referred to in the content.

