Article

Simulation of Thinning by Integrating Tree Competition and Species Biodiversity for Target Tree-Based Management of Secondary Forests

1
Research Institute of Forest Resource Information Techniques, Chinese Academy of Forestry, Beijing 100091, China
2
Key Laboratory of Forest Management and Growth Modelling, National Forestry and Grassland Administration, Beijing 100091, China
3
Department of Geography and Environmental Resources, Southern Illinois University Carbondale, Carbondale, IL 62901, USA
4
Institute of Forestry, Tribhuvan University, Kathmandu 44600, Nepal
*
Author to whom correspondence should be addressed.
Forests 2023, 14(9), 1896; https://doi.org/10.3390/f14091896
Submission received: 21 June 2023 / Revised: 9 September 2023 / Accepted: 16 September 2023 / Published: 18 September 2023
(This article belongs to the Special Issue Structure Diversity and Productivity of Mixed Forests)

Abstract

:
This study presents auxiliary support techniques for tree selection strategies based on the spatial structure indices and three competition indices in secondary forests, and discusses the importance of tree competition in forest management. The spatial structure parameter in the structured management is used as a quantitative index—the uniform angle index and three competition indices are used in the design of the algorithm for selective thinning for secondary forest. Based on the target tree-based management principles, simulation of selective thinning was carried out using GIS and C# programming languages. Data for this study were collected from experimental sample plots at Jilin Wangqing Forestry Bureau in China. The simulation results strongly support the use of auxiliary technology for scientifically selecting trees for thinning, avoiding the subjectivity of the traditional manual selection. Selection is largely based on the uniform angle index and competition index. Hegyi’s competition index and its improved version used in the algorithm provided almost identical simulation results, i.e., thinning intensities suggested by these indices for the first sample plot are 21.8% and 21.5%, respectively, and for the second plot are 21.3% and 21.1%, respectively. Thus, one of these competition indices can be used to select trees for thinning. The comprehensive competition index (CCI, a combination of an improved version of Hegyi’s competition index with tree species mingling) can avoid the selection of individual trees with high mingling and help maintain the tree species diversity. CCI suggests thinning intensities of 18.3% and 18.4% for the first and second sample plots, respectively. Presented methods and results may provide auxiliary supports for scientific thinning and help promote the application of information technology in forest management.

1. Introduction

Target trees refer to a number of dominant trees with major ecological, economic, and cultural values in near-natural forest management [1], which is a core basis of near-natural forest management. The term “crop tree release” was first coined by Trimble in 1971 [2], which involves the early release of trees from the potential competition of neighboring trees. The commonality between target trees and future crop trees (FCTs) is that both are provided with more growing space through the removal of crown competition caused by neighboring trees. Abetz and Klädtke conducted a study on target tree-based management and analyzed the criteria for selecting target trees, determining stand density, and identifying selective thinning measures [3]. When the competition starts impacting target trees, target tree-based tending operation needs to be applied, which involves classifying trees into target trees, special target trees, interference trees or competitor trees, and normal trees [1]. Target trees are first harvested after long-term preservation of a forest stand to reach a target diameter. The target tree selection should consider tree species, species dominance, stem and crown shape, tree health and vitality, etc. The special target trees are aimed at increasing species mixture, which maintains the diversified stand structure or rich biodiversity. Competitor trees substantially affect the target tree growth; therefore, they need to be removed and utilized as per the management plan. All the other trees in the sample plot are considered normal trees. During the entire management process of the target trees, it is necessary to continuously gather growth information on the target trees and provide them with regular nurturing [1,4]. The target tree-based management is mainly featured by marking and tending each tree, followed by thinning to achieve the growth of the largest trees with the potential for maximum forest productivity and balanced ecological functions. Researchers have conducted some studies that have substantially improved the methods of the target tree-based management (crop tree release), where algorithms developed can describe the impact of competition and stand density, especially on mixed forests [5,6]. Thus, the target tree-based management is considered an ecologically friendly and precise forest management technique.
Secondary forests may originate through the natural regeneration after human and natural interference, resulting in inherent structural changes, and changes in species composition and ecosystem functioning with respect to those of the primary forests [7]. The changes can diminish biodiversity, stand stability, and resilience [8]. Generally, secondary forests might have lower productivity compared to primary forests. Elsewhere in the world, over the past five decades, increased human interference has led to the destruction of primary forests, which have been replaced by secondary forests [9,10]. Half of the existing secondary forests may have resulted from direct human interference since the 20th century. Due to the destruction of primary forests worldwide and continuous human interference, secondary forests have garnered considerable attention from researchers worldwide [7,9]. Therefore, secondary forests need to be scientifically managed for their sustainability and high productivity through the development of appropriate management strategies, such as making optimal thinning plans. In recent years, researchers have extensively studied secondary forests based on stand structure, function, role in the forest ecosystem, and management approaches [8,9,10,11]. However, it could be more challenging because of their relatively complex structure and composition, as well as the degradation of secondary forests. Until today, many problems have not been solved in the management of these forests, including scientific selection of trees for thinning.
Gadow and Hui introduced characteristics of forest spatial structure and diversity in 2001 [12]. Afterwards, they conducted extensive research on forest spatial structure and forest management and proposed the structured-based forest management approach, mainly based on the spatial relationship of the four nearest neighbor trees [12,13,14,15]. This approach not only precisely describes the spatial structure of forests, but also quantifies relationships between forest structure, competition, and tree species diversity through the use of some spatial structure indices (Uniform angle index, Mingling index, and Neighborhood comparison index). Moreover, structured forest management helps managers to formulate tree-based management measures and guidelines that could be useful for adjustment toward the optimal forest distribution [14,15]. The spatial structure of a stand is an important basis for studying trees’ potential growth resources (light, water, and nutrients) and competitive interaction between trees determines the growing environment and tree species diversity [15]. Dong et al. conducted quantitative forest management research based on forest spatial structure with neighborhood-based indices [16,17]. Their results demonstrated that commonly used neighborhood-based structural indices could be employed to help control the spatial layout of potential harvestable trees and contribute to the stability and health of forests. Therefore, analysis of the spatial structure of forest stands has become important in forest management strategies worldwide, including in China.
Tree competition refers to the ability of trees to obtain the space and resources for growth within the given environmental limitations [18,19,20], and this significantly affects tree allometry. Competition can be quantified in terms of different indices, such as relative competition index (CI) and absolute CI or distance-independent and distance-dependent CIs. Relative CI reflects the dominance of individuals in a stand rather than the actual impact of competition, because trees’ growing space is not considered [21,22,23]. Absolute CI reveals an actual competition impact of adjacent trees on the target trees. Distance-independent CI is based on the stand-level variables and dimension of a target tree related to stand average or stand maximum value, while distance-dependent CI is based on the influence zone of the adjacent trees, which is expressed as a function of tree size and inter-tree distances [24]. Hegyi’s index is a universal example of the distance-dependent CI [25]. Other CIs consist of point density index [26], area overlap index [27], those based on tree size and inter-tree distance, and those based on shading or light interception [22,28]. Hui et al. [29] proposed a CI based on an intersection angle, which precisely describes the over-shading and lateral extrusion from competitor trees, and this CI can directly reflect the relative competition impact of trees in a stand. The CI based on an intersection angle could have a stronger correlation with tree size than Hegyi’s CI [25]. However, the modified version of Hegyi’s CI, which introduces the topographic factors, can significantly improve the accuracy of the models [30].
The traditional management models, which are based on selective thinning, have primarily focused on maximizing net income or net present value [31,32] and have rarely considered stand structure as an optimizing objective. According to the principle of structure determining function, maintaining the robust forest structure through optimization may provide a balanced forest ecosystem functioning in the condition of whether the forest is spatially structured or not [33]. Hu et al. [34] employed the parameters describing spatial structure for exploring optimal forest management, and their results showed that primary forests have optimal spatial structure, which is a direction for forest management. The essence of optimal forest management is to maintain a balanced stand structure, enhance biodiversity, and increase forest ecosystem stability. Tang et al. [35] used the spatial structure as an objective function and the non-spatial structure as a constraint for thinning optimization. Chen et al. [36] simulated thinning based on the optimization of the spatial structure of masson pine and broad-leaved mixed stands and provided an idea of determining selective thinning. However, this study did not consider the inter-tree competition impact. Song [37] utilized the weighted Voronoi diagram to determine the structural units of the target trees in the natural secondary forests in Northeast China, in which space around a target tree was divided into four quadrants and designed as a thinning scheme that would remove four interfering trees. The studies conducted so far have advanced forest tending [34,35,36,37], but tree location and competitive interaction among the trees are largely ignored. Consequently, a robust approach to tree selection (e.g., automatic tree selection) for thinning is lacking.
Secondary forests account for nearly half of the national forests in China [7,9] and are widely distributed covering an area of 46.2%, especially in northeast China, which has a vast proportion (about 37%) of the natural forests. Northeast China is the main timber-producing region and would maintain a balanced ecological functioning. However, as these natural forests have been clear-cut during the past five decades, the area has been dominated by natural secondary forests with relatively low productivity and inappropriate stand structures. Thus, secondary forests need effective management measures, such as precision management involving intensive management, also known as target tree-based management, which can restore forest structures and improve the productive potential of a forest stand [13,38].
This article presents methods and models that will be useful for the scientific management of the natural secondary forests in Northeast China. The methods use parameters to quantify spatial stand structure through consideration of two sample plots and trees therein to be selected for thinning based on the competition. Various IT tools (e.g., GIS and C programming) are used to analyze data. This study will be one of the fundamental bases for further investigation on selective thinning and tending operations for secondary forests in line with the existing near-natural forest management principles.

2. Materials and Methods

2.1. Study Area

The study area is located in the state-owned Jin-Gou-Lin forest farm of Wangqing county, Jilin province of northeast China, with the longitude and latitude range varying from 130°5′ to 130°20′ E and from 43°17′ to 43°25′ N, respectively (Figure 1). The area belongs to the Xueling branch of the Laoyeling Mountains within the Changbai Mountains in the eastern mountainous area of Jilin Province. The study area is sloppy, which ranges from 5° to 35°. The average annual temperature is 3.9 °C and the average annual precipitation is 650 mm with the major precipitation received in May to September. The study area spans an elevation range from 300 to 1200 m, and the soil consists of mainly gray-brown soil, characterized as basalt mid-low mountain ash soil, with an average thickness of 40 cm. The vegetation belongs to the flora of the Changbai Mountains.

2.2. Data

This study used a data set acquired from two 100 × 100 m sample plots in the secondary natural mixed forests in Jin-Gou-Lin forest farm (Figure 1). Sample plots were established in 2013. The sample plots were located at altitudes of 740 to 760 m and had different slopes. Tree species present in the sample plots are various conifer species, such as Abies nephrolepis Tiegh., Larix olonsis Henry, Picea jezoensis Mast., Pinus koraiensis Sieb. and other Fraxinus mandshurica Rupr., Betula platyphylla Suk, Tilia tuan Szysz., Acer mandshushuricum, Betula platyphylla Suk, and Ulums propinqua L. Within each sample plot, trees were measured for diameter at breast height (DBH) and total height (H) and recorded the sample plot center coordinates, elevation, slope, aspect, and slope position. Each sample plot was divided into 10 m × 10 m sub-plots (Figure 2), which were numbered using two digits with the first number indicating a column and the second indicating a row. The position of each tree was recorded in the sub-plots and the parameters related to the target tree-based management were obtained, including the type of trees (Z: target trees, S: special target trees, B: interference trees or competitive trees, and N: normal trees). A target tree should have higher vitality and a good stem form without any damage; special target trees represent reserved trees with special purposes, such as mother trees and trees with special meaning; interference trees or competitive trees are the trees that compete or interfere with target trees; normal trees do not belong to the trees mentioned above [1]. The summarized information of the sample plots and individual trees is given in Table 1.

2.3. Methods

2.3.1. Spatial Structure Index

Forest structure includes non-spatial and spatial structures; forest density, tree species composition, diameter distribution, and tree species diversity are the non-spatial structures of forests. The spatial structure reflects the spatial location and distribution pattern of trees in a stand and spatial arrangement of tree attributes, implying the spatial relationships between tree species, tree size, tree distribution, and so on [12,34]. Forest management is based on the principle of structure-determining functions. This often involves the spatial structure of four nearest trees to a reference tree; the information of which is required to develop the near-natural forest management plan. The quantitative expressions of spatial structure, which we have applied in our study, are uniform angle index ( W ), tree species mingling ( M ), and neighborhood comparison ( U ). W represents the spatial distribution of trees (Equation (1)), which includes random distribution, clumped distribution, and regular distribution; M describes the species variety in the vicinity of a given reference tree (Equation (2)); and U describes relative dominance growth of a stand or trees (Equation (3)) [12,15,39]. Each of the indices is briefly described in the following paragraphs.
W i = 1 n j = 1 n z i j
where W i is uniform angle index of reference tree i and describes the uniformity of the adjacent trees around the reference tree i; n is the number of adjacent trees for a reference tree i, n = 4 to be consistent with recent work [12]; and z i j is a discrete variable. Angle represents the minimum angle of any two adjacent trees j that are closest to each other. When the angle between adjacent tree j and reference tree i is less than a given standard α 0 (=72°), z i j = 1 and otherwise z i j = 0.
M i = 1 n j = 1 n v i j
where M i is the mingling of reference tree i , and v i j is a discrete variable. When a reference tree and adjacent tree are not the same species, v i j = 1 and otherwise v i j = 0.
U i = 1 n j = 1 n k i j
where U i is a neighborhood comparison of reference tree i , and k i j is a discrete variable. When DBH, H, and crown width of the adjacent tree are smaller than those of reference tree i , k i j = 0 and otherwise k i j = 1. The smaller the value of U i , the larger would be the reference tree than the adjacent trees.

2.3.2. Tree Competition Indices

We computed Hegyi’s CI [25], which is the ratio of a competing tree DBH to the product of a target tree DBH and the distance between the target tree and the competitor tree (Equation (4)).
CI = j = 1 N D j D i × L i j
where CI is competition index, D i is DBH of a target tree i , D j is DBH of a competitor tree j , and L i j is Euclidean distance between the target tree i and competitor tree j .
Hegyi’s CI measures the degree of tree competitive interactions among the trees, assuming that competition exists due to the horizontal structure (e.g., DBH size), but it ignores the vertical structure or impact of tree height on the competition. In fact, given the same DBH and inter-tree distance, taller trees could be obviously more effective competitors than shorter trees. Thus, this necessitates defining CI in a 3D space. Zhang et al. [40] proposed a CI that includes tree canopy, and Long et al. [30] improved Hegyi’s CI by adjusting the DBH of competitor tree j to indirectly account for the impact of tree height from competitors on the target tree. However, all the existing CIs do not directly include tree heights, because tree heights are difficult to measure in the field. In this study, in order to accurately capture the impact of competitors on the target tree, we proposed the CI that accounts for not only horizontal competition but also vertical competition by introducing tree height (Equation (5)). We have termed this as an improved Hegyi’s CI (CII).
C I I = j = 1 N D j D i × L i j × H j H i
where CII is an improved Hegyi’s CI, H i is the height of target tree i , and H j is the height of competitor tree j .
As secondary forest often consists of multiple tree species, a comprehensive CI that takes into account both the tree competition and degree of tree species mixture needs to be determined, in which the weight of each species is determined and included. A mixture of tree species would increase the species diversity and stability of the forest ecosystem. Among various mixture proportions evaluated, a 60% weight given to the mingling of tree species provided more satisfactory results, which was supported by the expert experience. We have termed this comprehensive CI as ZCI (Equation (6)).
ZCI = M × 60 % + CII × 40 %
where ZCI is the comprehensive CI. Both M and CII need to be normalized. The selection of trees was carried out based on the spatial structure index W (uniform angle index), M (species mingling), U (neighborhood comparison), and each of the CIs including Hegyi’s CI, CII, and ZCI.
Data preprocessing involves a few steps. Firstly, a five-meter buffer belt was set around each sample plot and trees located in the buffer zone were assumed as adjacent trees and all other trees were assumed as reference trees [41]. Secondly, the spatial structural units of trees in the core area were determined. Thirdly, the spatial structure indices were estimated using “Winkelmass V2.0” software, which is commonly used for the analysis of such indices in China. Then, competition indices were calculated. Finally, the results of all the above calculations were stored in the database, which was accessed for the operation of the algorithm described below.

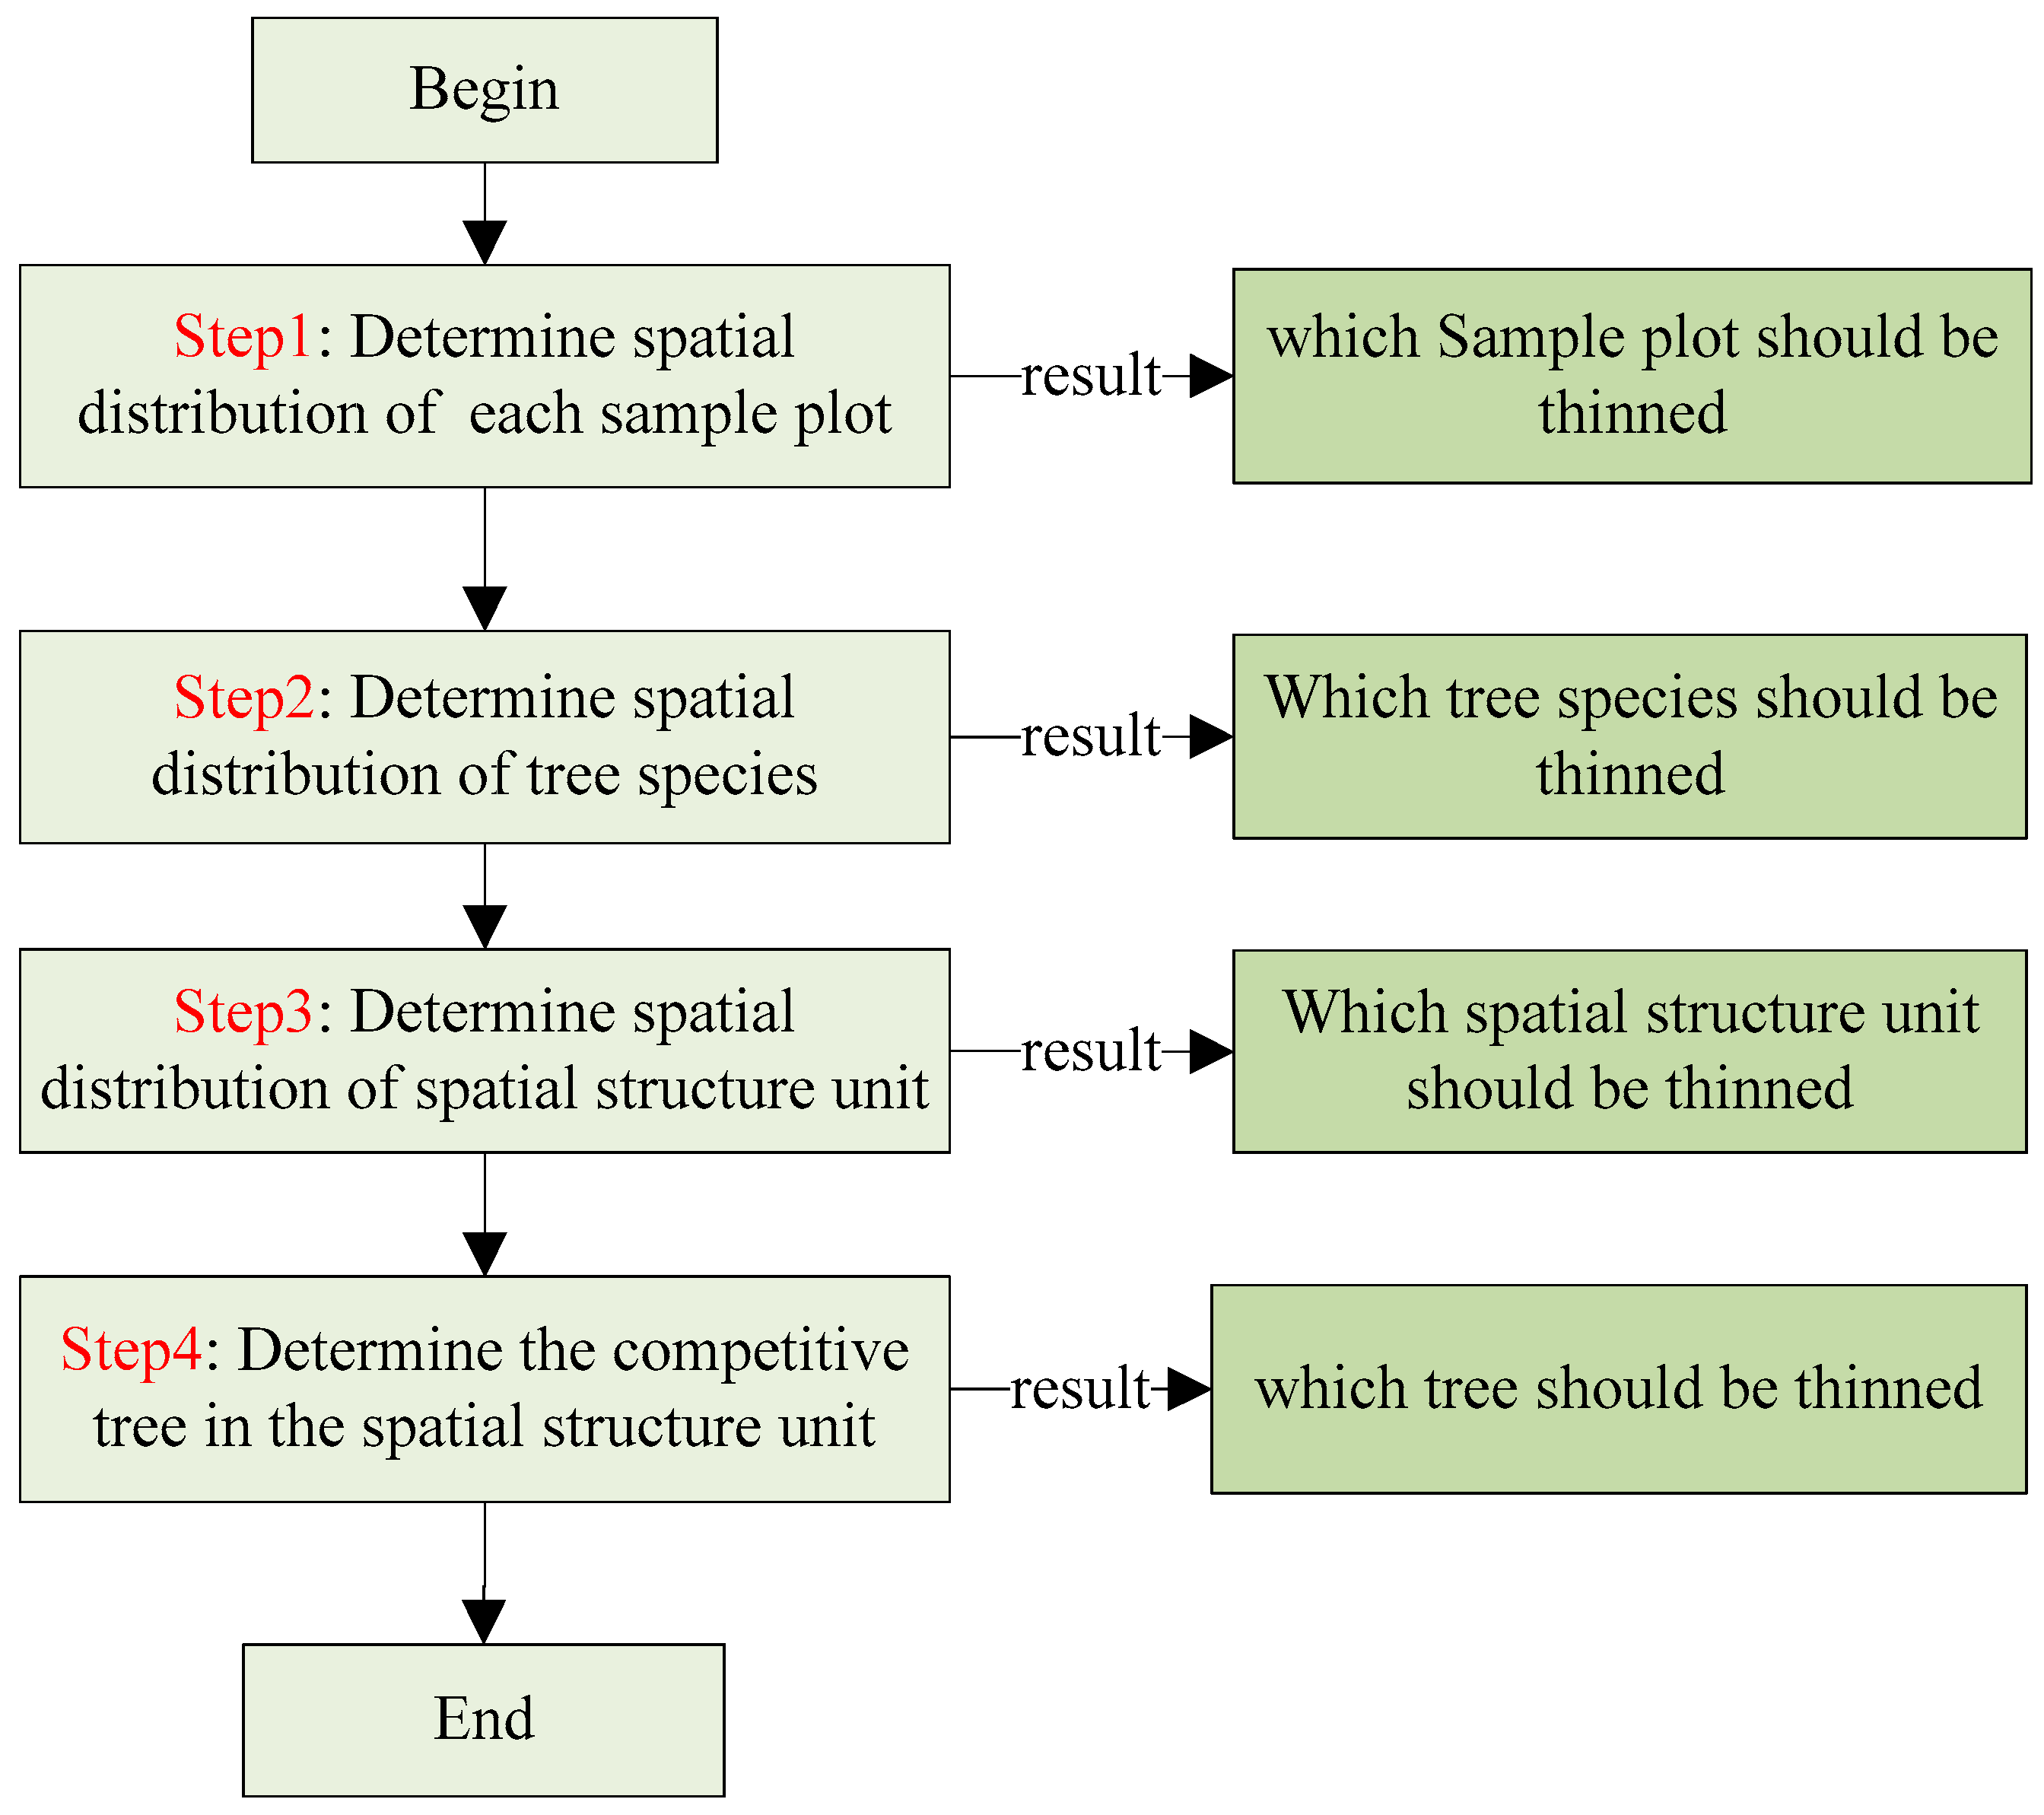
2.3.3. Algorithm Design for Selective Thinning
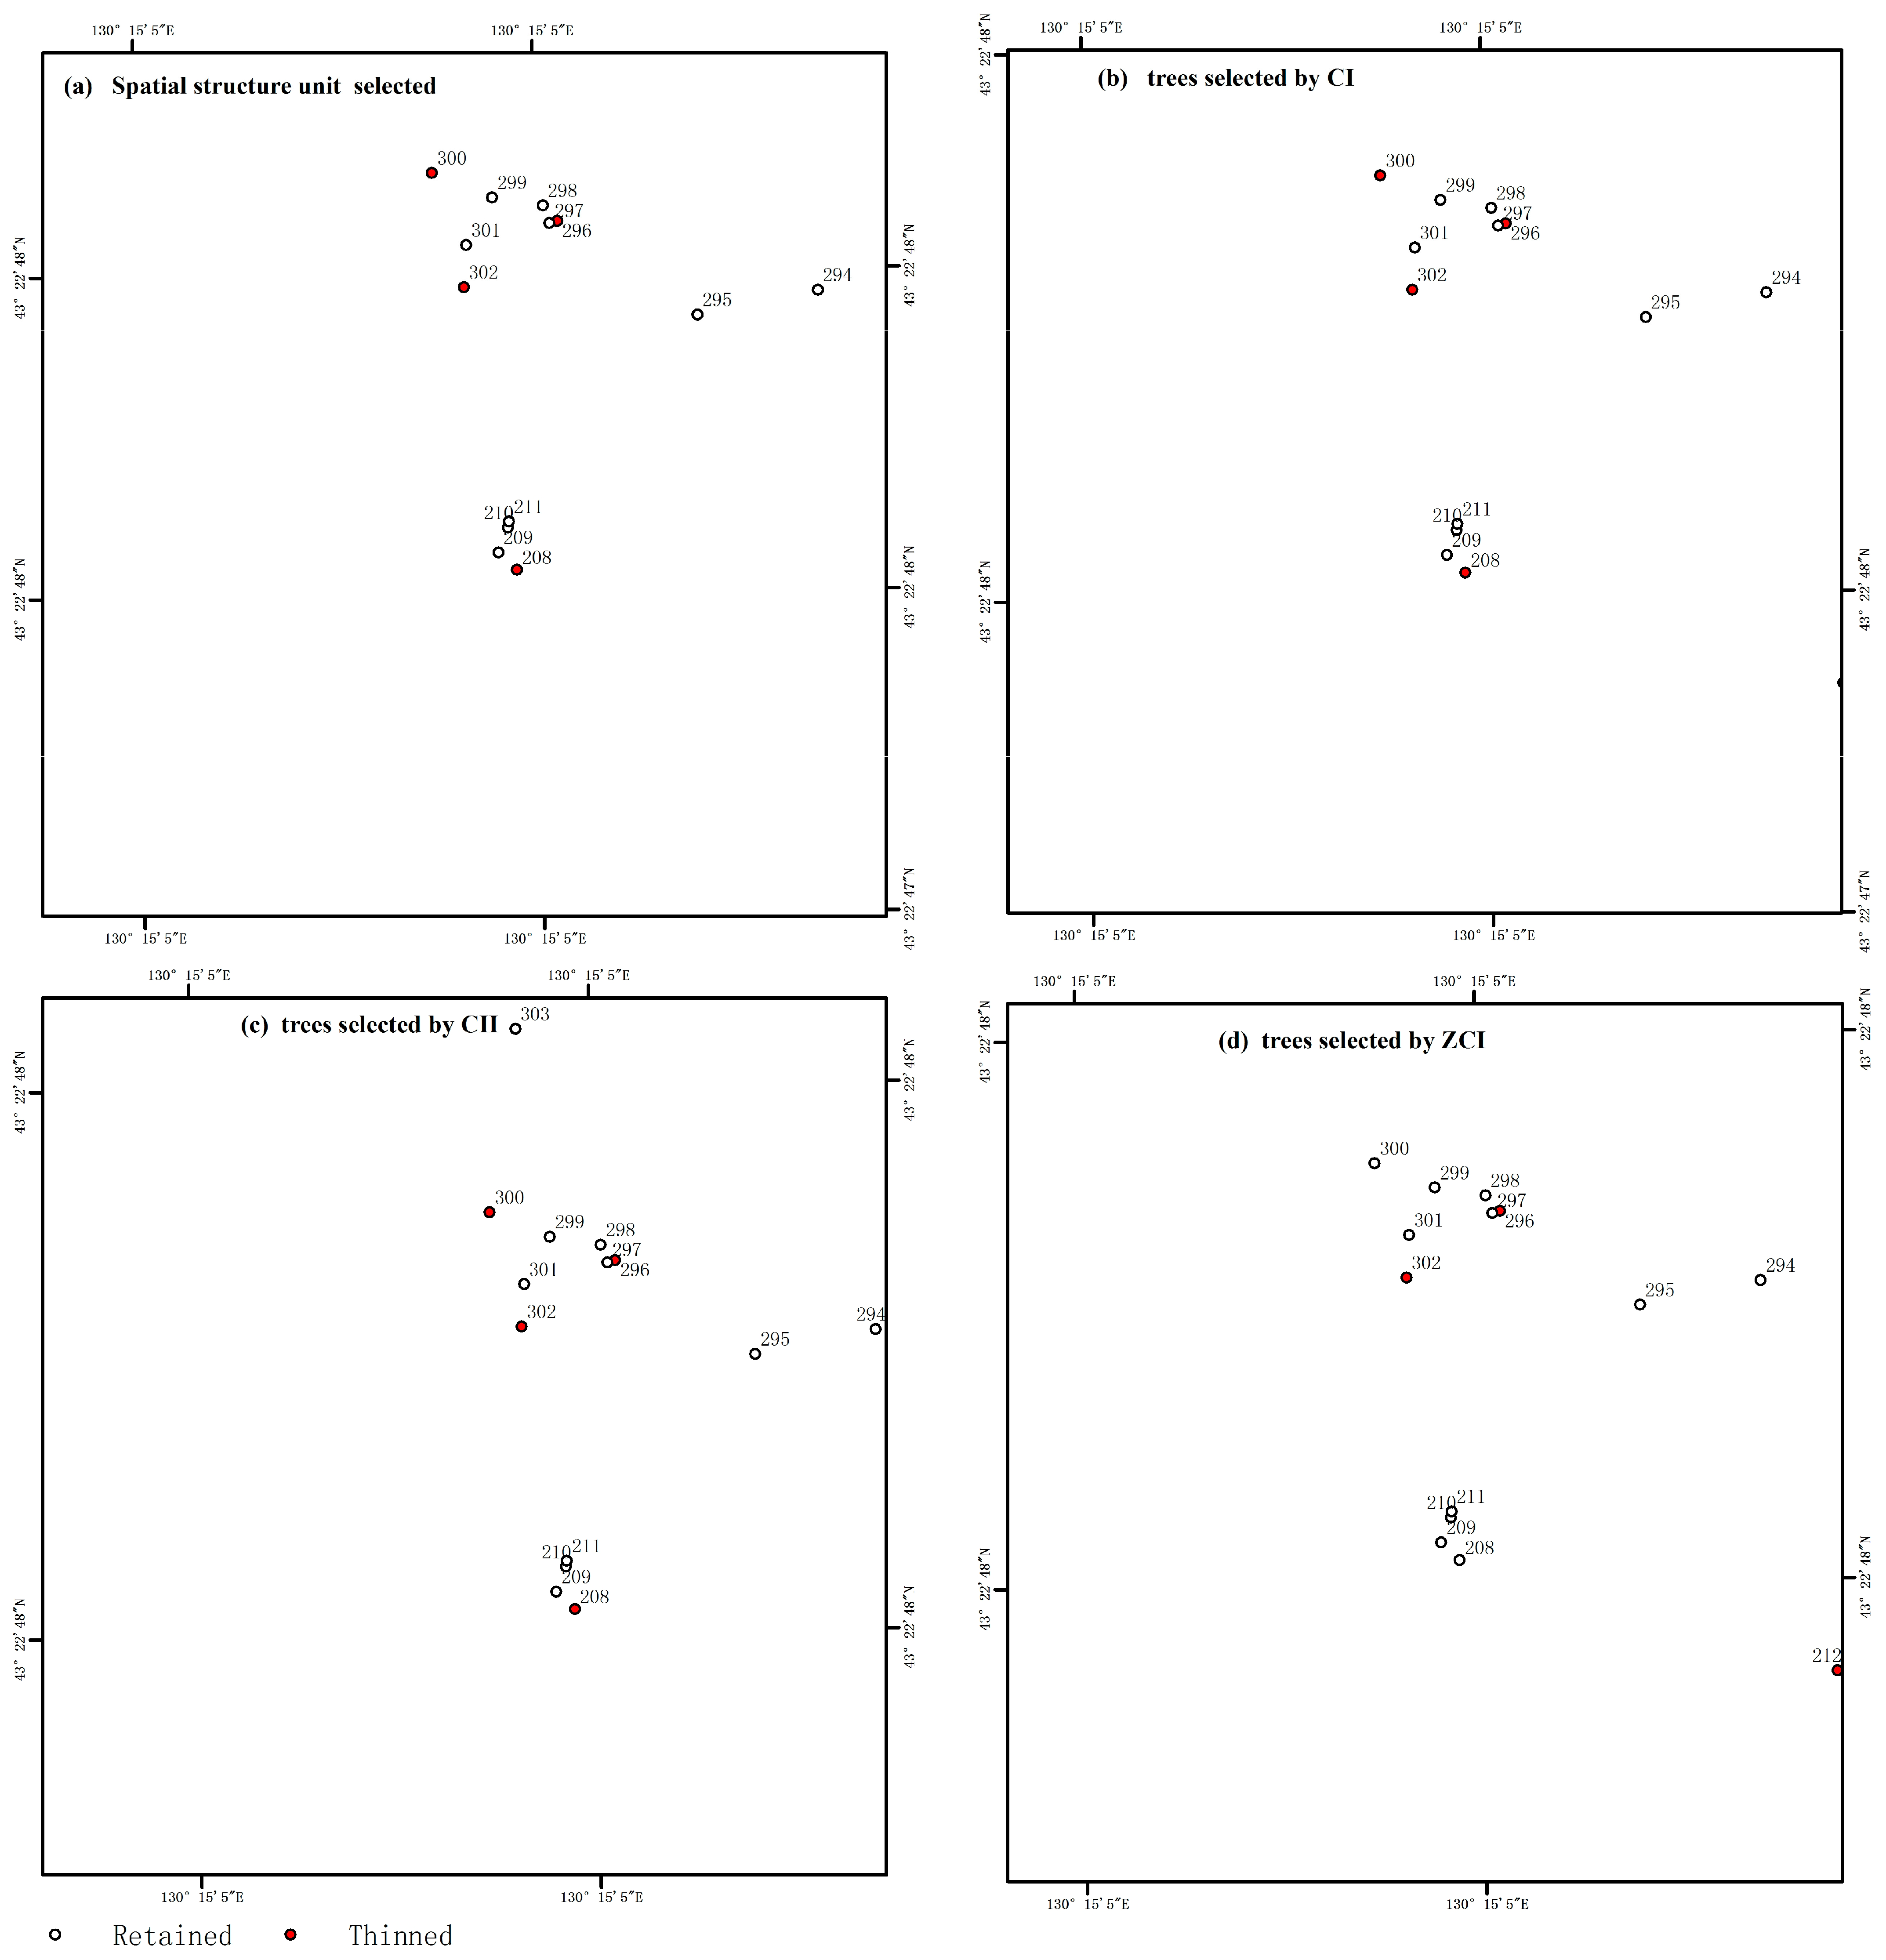
The selective thinning process includes four crucial steps (Figure 3), which are related to sample plots, tree species, spatial structural units, and individual trees. The first step deals with the identification of sample plots, where thinning would be carried out. This step would assess whether thinning is based on the spatial structure index and competition index. According to the related studies [12,15,35], we used the uniform angle index to measure the spatial distribution of trees. According to these and other studies [38,39], if the range of the uniform angle index is 0.475–0.517, the stand spatial structure is considered to have a random distribution. If the value of the uniform angle index is >0.517, the stand spatial structure has a clumped distribution. The larger the uniform angle index, the more clustered the trees in a stand will be. The uniform angle index of <0.475 indicates a regular distribution. The smaller the uniform angle index, the more even the distribution would be. When there are randomly distributed trees in a stand, thinning is not required; however, if needed, selective thinning could be applied. The second step involves determining the spatial distribution of tree species within a sample plot based on the uniform angle indices (0.475–0.517) for their random distribution. Similarly, the third step assesses the spatial distribution of stand structure units using the uniform angle index. The fourth step involves the decisions made for selecting trees in each spatial structure unit using CIs.
After the spatial structural unit is determined, the target trees are selected for thinning. In this study, trees were classified into target trees (Z), special target trees (S), normal trees (N), and competition trees (B) during fieldwork. If a reference tree was marked as Z or S, this should be retained. Among four competitor trees, the tree with the strongest competition against a target tree was identified for thinning according to competition indices ( CI , CII , ZCI ). If a reference tree was marked as N, the tree with the weakest competition against a reference tree was identified for thinning according to neighborhood comparison ( U ) . If a reference tree was marked as B, it was identified for thinning.
In order to enable the automatic selection of trees, the above-mentioned process was designed (Figure 4) and was programmed using Microsoft NET Framework 4.0 as a development platform, C Sharp as a programming language, and Access 7.0 as a database. Moreover, ArcEngine10.0 and Personal GeoDataBase were used for spatial data processing.
The entire thinning algorithm consists of four loops (Figure 4). The first loop identifies a sample plot where thinning could be carried out as shown in Figure 4A. The second loop identifies tree species to be included in thinning in the sample plot identified (Figure 4B). The third loop identifies the spatial structure unit to be used for thinning based on the selected tree species (Figure 4C). The last loop finds which tree should be thinned in the selected spatial structural unit, and this loop selects the trees based on different CIs (Equations (4)–(6)).

3. Results

We used two typical sample plots YLK-1 and YLK-2 to evaluate the algorithm of selective thinning. Out of a total of 732 trees in the YLK-1 plot, 573 trees were in the core area of the plot (Table 2), where only 158 trees were selected for thinning and other tending operations. Different competition indices selected the different number of trees for thinning on this sample plot (Table 2). The Hegyi CI (CI) selected 125 trees whereas the improved Hegyi CI (CII) selected 123 trees, and the comprehensive competition index (ZCI) selected 105 trees. The corresponding thinning intensities by three CIs were 21.8%, 21.5%, and 18.3%, respectively; the uniform angle index before thinning was 0.558 and the uniform angle indices after thinning were 0.478, 0.478, and 0.492, respectively; tree species mingling before thinning was 0.7381 and tree species mingling indices after thinning were 0.7460, 0.7461, and 0.7462, respectively. Similarly, out of 913 trees in the YLK-2 plot, 751 trees were found in its core area and a total of 217 trees were selected to be thinned. CI selected 160 trees, CII selected 158 trees, and ZCI selected 138 trees; the corresponding thinning intensities of the three CIs were 21.3%, 21.1%, and 18.4%, respectively; the corresponding uniform angle index before thinning was 0.570 and uniform angle indices after thinning were 0.495, 0.496, and 0.506, respectively; tree species mingling before thinning was 0.7334 and tree species mingling indices after thinning were 0.7398, 0.7394, and 0.7399, respectively.
The maps of selective thinning for two sample plots using CI, CII, and ZCI are shown in Figure 5 and Figure 6.
The number of trees to be thinned using ZCI was smaller than that by CI and CII (Figure 7).

4. Discussion

Based on the uniform angle index (Equation (1)) of the spatial structure and according to three competition indices between the adjacent trees (Equations (4)–(6)), this study identified trees to be thinned in the secondary forests by applying C sharp programming and GIS technique. Based on the analysis of three competition indices (Equations (4)–(6)), results were almost identical (Table 2) and possible reasons are described in the forthcoming paragraphs.
According to three different competition indices in YLK-1, the number of trees selected for thinning decreased (Table 2, Figure 5), where Hegyi’s original CI selected the highest number of trees followed by Hegyi’s improved index (CII) and comprehensive index (ZCI); however, numbers of the selected trees are only slightly different. This is mainly because, with the given target tree, the CIs of the neighboring competition trees were only slightly different. This implies that adding tree heights of the competitor trees into the Hegyi CI has only a small effect on selective thinning.
It can be seen from Table 2 that the spatial distribution of both the YLK-1 and YLK-2 plots showed a clumped distribution before thinning; however, their spatial distribution shifted to random distribution after thinning, all indicating light thinning. After thinning, the tree species mingling in both YLK-1 and YLK-2 plots increased, with ZCI showing slightly higher mingling values than CI and CII, but the change was not significant. This may be the reason for the low quality of secondary forest stands, characterized by complex spatial patterns of tree distributions.
It can be seen from Figure 7 that considering No. 208 as a reference tree, the spatial structural unit was a selective thinning unit; however, CI and CII selected No. 208 as a tree to be thinned, and ZCI selected this tree as a retained tree. After the field verification, No. 208 tree was a reserve tree (Tilia tuan Szysz) and there were 23 reserve trees in a whole YLK-1 plot. If reserved, it can increase the mingling of reference trees or the mingling of stand tree species. Similarly, there were 18 trees of Acer mandshuricum, which should be reserved according to ZCI. This is due to the fact that adding the diversity of tree species into a competition index substantially changes CI values, and species diversity is taken into account in the selection of trees for thinning. Due to consideration of species diversity, some trees need to be preserved even though they were shown to be thinned based on other criteria or indices evaluated. A similar description can be applied to sample plot YLK-2 (Table 2 and Figure 6).
There is a possibility that selective thinning may be determined by filtering the uniform angle index of trees, so the influence of a competition index on selective thinning is also limited. Three different competition indices evaluated in our study had almost identical results. This may be because each spatial structure unit has only five trees according to structure-based management, whereby forest structure is based on only four nearest neighbor trees [14,39]. The uniform angle index for reference trees only identifies five values, which are 0.00, 0.25, 0.50, 0.75, and 1.00. However, the evaluation standard, such as whether the value of the angular scale lies between 0.475 and 0.517 [38], is to say whether the spatial distribution pattern of trees in a stand would be randomly distributed. It shows from another perspective that the uniform angle index for selective thinning is >0.517 or <0.475. After filtering out the unqualified trees, there would be fewer trees to be chosen. In other words, five trees that comprise the spatial structural unit may only retain one or two trees after filtering by uniform angle index. Three competition indices had little influence on the selective thinning.
The number of trees to be thinned in sample plots YLK-1 and YLK-2 is almost identical based on the values of (CI and CII). We only need to know whether the competition indices are relatively larger or smaller, but not the precise values. If we need to consider how much is larger or smaller with regard to CIs (CI and CII) when selecting trees for thinning, the results may be different. Since the estimated values of CI and CII differ, the specific comparison results about how much is larger or smaller would also vary. The number of trees selected by ZCI slightly decreased compared with those based on the CI and CII. This may be due to the higher mingling of tree species that were preserved based on the diversified tree species. We will continue making the in-depth analysis of various indices required for selective thinning in future studies.
We assumed that stand density, which is substantially related to competition, could be somehow described by competition indices that we have considered in our study. With this assumption in mind, we did not include other measures that would describe stand density more effectively, in our study. This might be our study limitation even though the tree-level competition indices were included in our thinning algorithm. The forest used in our study is a secondary forest established in 2013 [37], which is mainly characterized by complex structure and low quality; therefore, it may require some structural adjustments. The focus of our study is to solve the problem of accurately selecting trees for thinning to achieve quantitative management in secondary forests. The assumption here is that by improving forest structure through some objective rules (e.g., thinning algorithm) incorporating spatial structure index and spatially explicit competition indices, we can effectively reduce the stand density or reduce competition among the trees that remain after thinning. Thus, the application of our algorithm has the potential to significantly promote tree growth. Our algorithm ensures that thinning intensity would not exceed the forest tending regulations (GB/T 15781-2015) [42]. In our future research, especially, with regard to tending and thinning in plantation forests, it can be considered to add some stand density measures that can better describe stand density, in order to more accurately select thinning trees.
Although this study provides an algorithm for selective thinning in the secondary forests and reduces the possibility of subjective selection, their implementations need to be taken into consideration based on the actual situation in the field. We did not simulate the spatial forest structure or predict the future forest status by combining forest growth models after thinning; stand density was not considered in this study. These issues will be considered in future.
It is necessary to obtain the spatial location of each tree to calculate the spatial structure index, especially the uniform angle index, which is time-consuming and laborious. This would also have a difficulty in practical application. However, with advancements in information technology, forestry data collection equipment, such as the application of the unmanned aerial vehicle for tree location data acquisition, can make this easier in the future. When there is a need to determine the spatial distribution pattern of primary forests, our methods and algorithm may be useful. Consideration of the management objectives, native tree species and endangered tree species, ecological suitability of tree species, etc. would be important while employing a structure-based management approach.
This study has a number of limitations, as this study did not consider stand density and site quality, environmental influences, such as land slope, especially stand conditions, such as isolated trees, overlapping areas of crowns or roots, etc. Furthermore, our approach uses rules to schedule trees for thinning and does not specifically optimize a system, and we did not validate the results through a comparison with an optimal solution to the problem. Our approach was rule-based and heuristic in nature. In our future study, most of these issues will be properly addressed, which may provide more useful results.

5. Conclusions

This study provides an algorithm for scheduling the thinning in secondary forests located in Northeast China. The study presents auxiliary support techniques for the scientific selection of individual trees, which avoid the subjectivity of traditional manual tree selection for thinning. This study provides a robust algorithm that is suitable for the precise management of secondary forests. The tree selection strategy used in this study is based on the spatial structure indices (uniform angle index, mingling, and neighborhood comparison), along with three competition indices. The algorithm developed in this study was implemented for selective thinning: firstly, a sample plot needs to be identified; secondly, tree species need to be identified; thirdly, spatial structure units need to be identified; and lastly, individual trees need to be identified for thinning. This study combines target tree-based management with structure-based forest management and provides a novel idea of the methods required for precision management and quality improvement of the secondary forests. Our algorithm may be applicable to the near-natural management of plantation forests.

Author Contributions

Methodology, L.P. and L.F.; formal analysis, L.P. and L.F.; investigation, J.L. and L.P.; data curation, L.P.; writing—original draft, L.P. and G.W.; writing—review and editing, L.P., R.P.S., G.W. and X.T.; visualization, L.P.; supervision, L.P. All authors have read and agreed to the published version of the manuscript.

Funding

This research was funded by the National Key Research and Development Program of China (2022YFD2201005 and 2017YFC0504106) and the National Natural Science Foundation of China (32271878).

Acknowledgments

We would like to thank all people who contributed to the forest plot survey for this study and two anonymous reviewers for helpful comments on earlier versions of this manuscript.

Conflicts of Interest

The authors declare no conflict of interest.

References

  1. Lu, Y.C. The Theory and Practice of Near-Natural Forest Management; Science Press: Beijing, China, 2006. [Google Scholar]
  2. Trimble, G.R., Jr. Early Crop-Tree Release in Even-Aged Stands of Appalachian Hardwoods; Res. Pap. NE-203; U.S. Department of Agriculture, Forest Service, Northeastern Forest Experiment Station: Upper Darby, PA, USA, 1971; 13p.
  3. Abetz, P.; Klädtke, J. The target tree management system. Eur. J. For. Res. 2002, 121, 73–82. [Google Scholar] [CrossRef]
  4. Lu, Y.C.; Lei, X.D.; Hong, L.X.; Ning, J.K.; Liu, X.Z.; Meng, J.H. A preliminary study on planning technical model for close-to-nature forest management. J. Southwest For. Univ. 2010, 30, 1–5. [Google Scholar] [CrossRef]
  5. Thomas, M.S. Crop tree release improves competitiveness of northern red oak growing in association with black cherry. North. J. Appl. For. 2006, 23, 77–82. [Google Scholar] [CrossRef]
  6. Wang, Y.X.; Zhang, S.G.; Lu, Y.C.; Meng, J.H.; Zeng, J. Initial effects of crop trees growth after crop tree release on Pinus massoniana plantation. Sci. Silvae Sin. 2014, 50, 67–73. [Google Scholar]
  7. Zhu, J.J.; Liu, S.R. Conception of secondary forest and its relation to ecological disturbance degree. Chin. J. Ecol. 2007, 26, 1085–1093. [Google Scholar]
  8. Wang, X.C.; Wang, J.Y.; Jiang, Z.P. Studies on the secondary forest management techniques in the Xiaolongshan Mountain in Gansu Province. J. Northwest For. Univ. 2008, 23, 142–146. [Google Scholar]
  9. Zeng, S.Q.; Xiao, H.S.; Liu, F.L.; Lv, Y.; She, J.Y. Study on Management Techniques of Secondary Forests: Schima Superba Gardn.et Champ and Castanopsis sclerophylla (Lindl.) Schott; China Forestry Publishing House: Beijing, China, 2015. [Google Scholar]
  10. Brearley, F.Q.; Prajadinata, S.; Kidd, P.S.; Proctor, J. Structure and floristics of an old secondary rain forest in Central Kalimantan, Indonesia, and a comparison with adjacent primary forest. For. Ecol. Manag. 2004, 195, 385–397. [Google Scholar] [CrossRef]
  11. Zhu, J.J.; Li, X.F.; Liu, Z.G.; Cao, W.; Gonda, Y.; Matsuzaki, T. Factors affecting the snow/wind induced damage of a montane secondary forest in northeastern China. Silva Fenn. 2006, 40, 37–51. [Google Scholar] [CrossRef]
  12. Von Gadow, K.; Hui, G.Y. Characterizing forest spatial structure and diversity. In Sustainable Forestry in Temperate; Björk, L., Ed.; University of Lund: Lund, Sweden, 2001; pp. 20–30. [Google Scholar]
  13. Hui, G.Y.; Hu, Y.B.; Zhao, Z.H. Research progress of structure-based forest management. For. Res. 2018, 31, 85–93. [Google Scholar] [CrossRef]
  14. Hui, G.Y.; Gadow, K.V. Principles of Structure-Based Forest Management; China Forestry Publishing House: Beijing, China, 2016. [Google Scholar]
  15. Hui, G.Y.; Gadow, K.V.; Hu, Y.B.; Xu, H. Structure-Based Forest Management; China Forestry Publishing House: Beijing, China, 2007. [Google Scholar]
  16. Dong, L.B.; Wei, H.Y.; Liu, Z.G. Optimizing forest spatial structure with neighborhood-based indices: Four case studies from Northeast China. Forests 2020, 11, 413. [Google Scholar] [CrossRef]
  17. Dong, L.B.; Bettinger, P.; Liu, Z.G. Optimizing neighborhood-based stand spatial structure: Four cases of boreal forests. For. Ecol. Manag. 2022, 506, 119965. [Google Scholar] [CrossRef]
  18. Ledermann, T. Evaluating the performance of semi-distance-independent competition indices in predicting the basal area growth of individual trees. Can. J. For. Res. 2010, 40, 796–805. [Google Scholar] [CrossRef]
  19. Peet, R.K.; Christensen, N.L. Competition and tree death. BioScience 1987, 37, 586–595. [Google Scholar] [CrossRef]
  20. Pickett, S.T.A.; Carson, W.P. Ecology: Individuals, populations and communities. Brittonia 1987, 39, 407–408. [Google Scholar] [CrossRef]
  21. Alder, D. A distance-independent tree model for exotic conifer plantations in East of Africa. For. Sci. 1979, 25, 59–71. [Google Scholar] [CrossRef]
  22. Daniels, R.F.; Burkhart, H.E.; Clason, T.R. A comparison of competition measures for predicting growth of loblolly pine trees. Can. J. For. Res. 1986, 16, 1230–1237. [Google Scholar] [CrossRef]
  23. Tomé, M.; Burkhart, H.E. Distance-dependent competition measures for predicting growth of individual trees. For. Sci. 1989, 35, 816–831. [Google Scholar]
  24. Burkhart, H.E.; Tomé, M. Indices of individual-tree competition. In Modeling Forest Trees and Stands; Springer: Dordrecht, The Netherlands, 2012; pp. 201–232. [Google Scholar]
  25. Hegyi, F. A simulation model for managing jack-pine stands. In Growth Models for Tree and Stand Simulation; Fries, J., Ed.; Royal College of Forestry: Stockholm, Sweden, 1974; pp. 74–90. [Google Scholar]
  26. Spurr, S.H. A measure of point density. For. Sci. 1962, 8, 85–96. [Google Scholar] [CrossRef]
  27. Opie, J.E. Predictability of individual tree growth using various definitions of competing basal area. For. Sci. 1968, 14, 314–323. [Google Scholar] [CrossRef]
  28. Daniels, R.F. Simple competition indices and their correlation with annual loblolly-pine tree growth. For. Sci. 1976, 22, 454–456. [Google Scholar] [CrossRef]
  29. Hui, G.Y.; Hu, Y.B.; Zhao, Z.H.; Shi, Y.; Liu, W.Z. A forest competition index based on intersection angle. Sci. Silvae Sin. 2013, 49, 68–73. [Google Scholar] [CrossRef]
  30. Long, S.S.; Zeng, S.Q.; Liu, F.L.; Wang, G.X. Influence of slope, aspect and competition index on the height-diameter relationship of Cyclobalanopsis glauca trees for improving prediction of height in mixed forests. Silva Fenn. 2020, 54, 10242. [Google Scholar] [CrossRef]
  31. Hof, J.; Bevers, M. Optimizing forest stand management with natural regeneration and single-tree choice variables. For. Res. 2000, 46, 168–175. [Google Scholar] [CrossRef]
  32. Buongiorno, J.; Peyron, J.L.; Houllier, F.; Bruciamacchie, M. Growth and management of mixed-species, uneven-Aged forests in the French Jura: Implications for economic returns and tree diversity. For. Res. 1995, 41, 397–429. [Google Scholar] [CrossRef]
  33. Yang, C.S.; Shao, G.Y.; Liu, W.M.; Zhang, J.C. System Theory Information Theory Cybernetics; China Radio and Television Press: Beijing, China, 1987; pp. 23–24. [Google Scholar]
  34. Hu, Y.B.; Hui, G.Y. A discussion on forest management method optimizing forest spatial structure. For. Res. 2006, 19, 1–8. [Google Scholar] [CrossRef]
  35. Tang, M.P.; Tang, S.Z.; Lei, X.D.; Li, X.F. Study on spatial structure optimizing model of stand selection cutting. Sci. Silvae Sin. 2004, 40, 25–31. [Google Scholar] [CrossRef]
  36. Chen, C.X.; Liu, J.; Yu, K.Y.; Ge, Y.Q. Simulated cutting for the mixed forest of Pinus massoniana and broad-leaved tree species based on optimized spatial structure. J. Southwest For. Univ. 2010, 30, 29–32. [Google Scholar] [CrossRef]
  37. Song, Y.F. Individual Tree Growth Models and Competitors Harvesting Simulation for Target Tree-Oriented Management; Chinese Academy of Forestry: Beijing, China, 2015. [Google Scholar]
  38. Zhang, H.R.; Tang, S.Z. Research on Sustainable Management Technology of Natural Forests in Northeast China; China Forestry Publishing House: Beijing, China, 2011. [Google Scholar]
  39. Hui, G.Y.; Li, L.; Zhao, Z.H.; Dang, P.X. Analysis method of forest spatial distribution layout. Acta Ecol. Sin. 2007, 27, 4717–4728. [Google Scholar] [CrossRef]
  40. Zhang, Y.C.; Zhang, H.Q.; Chen, Y.F.; Li, Y.L.; Ma, L.Y. Study of tree competition index based on crown feature. For. Res. 2016, 29, 80–84. [Google Scholar] [CrossRef]
  41. Zhou, H.M.; Hui, G.Y.; Zhao, Z.H.; Hu, Y.B. Treatment methods of plot boundary trees in spatial forest sructure analysis. Sci. Silvae Sin. 2009, 45, 1–5. [Google Scholar] [CrossRef]
  42. GB/T 15781-2015; Regulations for forest tending. Standardization Administration of China: Beijing, China, 2015.
Figure 1. Location of the study area consisting of the Jin-Gou-Lin forest farm in Wangqing County, Jilin Province of northeast China (upper left and right), and spatial distribution of the permanent sample plots and individual trees (lower left and right).
Forests 14 01896 g001
Figure 2. Sample plot and subplots. A: sample plot center, sample plot size: 100 m × 100 m, subplot size: 10 m × 10 m, 00: subplot ID and stands for column 0 and row 0, “90” stands for column 9 and row 0, “99” stands for column 9 and row 9, and “09” stands for column 0 and row 9.
Forests 14 01896 g002
Figure 3. The process for selecting trees for thinning. Step 1: how to select the sample plot, where thinning would be carried out, step 2: how to select tree species, step 3: how to select the spatial structure unit, and step 4: how to select competitor trees.
Forests 14 01896 g003
Figure 4. The flow chart of a thinning algorithm design, in which (A) is about selecting sample plots, where thinning could be carried out, (B) is about selecting tree species to be included in thinning, (C) is about selecting spatial structure unit to be used in thinning, and (D) is about selecting individual trees to be thinned.
Forests 14 01896 g004
Figure 5. The results for thinning in sample plot YLK-1 as selected by Hegyi competition index (CI), improved Hegyi CI (CII), and comprehensive competition index (ZCI): (a) spatial structural unit of the sample plot; (b) trees selected by CI; (c) trees selected by CII; and (d) trees selected by ZCI.
Forests 14 01896 g005
Figure 6. The results for thinning in sample plot YLK-2 as selected by Hegyi competition index (CI), improved Hegyi CI (CII), and comprehensive competition index (ZCI): (a) spatial structural unit of the sample plot; (b) trees selected by CI; (c) trees selected by CII; and (d) trees selected by ZCI.
Forests 14 01896 g006
Figure 7. The results for sample plot YLK-1, which was used for thinning and selected by Hegyi competition index (CI), improved Hegyi CI (CII), and comprehensive competition index (ZCI): (a) spatial structural unit of a sample plot; (b) trees selected by CI; (c) trees selected by CII; and (d) trees selected by ZCI.
Forests 14 01896 g007
Table 1. The information of tree variables of two sample plots (DBH: diameter at breast height; σ: standard deviation value; Ts: Tilia tuan Szyszyl.; An: Abies nephrolepis Tiegh.; Lo: Larix olgonsis Henry; Pj: Picea jezoensis Mast.; Pk: Pinus koraiensis Sieb.; Bc: Betula costata Trautv; Am: Acer mandshushuricum; Bp: Betula platyphylla Suk; Up: Ulmus propinqua L.; Pl: Populus L.; Fm: Fraxinus mandshurica Rupr.; Amm: Acer mandshurica Maxim).
Sample PlotAltitude
(m)
Canopy DensityNumber of TreesMean DBH/σ (cm)Mean Tree Height/σ
(m)
Tree Species
Composition
Number
of Trees
Mean DBH
(cm)
Mean Tree Height
(m)
YLK-17420.5973215.58/8.8115.39/7.12Ts12111.6810.92
An12013.0512.07
Lo9222.2322.82
Pj6813.9812.12
Pk5917.6613.65
Bc5517.0517.58
Am419.229.35
Bp2117.1019.84
Up1315.2513.21
Pl416.8820.18
Fm319.4322.93
Amm320.8716.20
others1328.119.24
YLK-27520.6691314.74/9.06114.85/7.83Ts15810.0410.41
An1398.778.38
Am1327.108.43
Lo10221.6222.81
Bc7713.4917.35
Pk5719.9514.88
Pj5715.1913.63
Up1912.3011.11
Pl1824.4525.09
Bp1021.8722.24
others1447.329.08
Table 2. The results of selective thinning for sample plots YLK-1 and YLK-2 (N#1: total number of trees in a sample plot; N#2: number of trees in the core area of a sample plot; N#3: number of thinning trees to be thinned in the core area; Intensity: intensity of trees to be thinned (thinning intensity); W : Uniform angle index before and after selective thinning with different competition indices; M : tree species mingling before and after selective thinning with different competition indices).
PlotN#1N#2N#3MetricsCICIIZCI
YLK-1732573158Number of trees125123105
Intensity21.8%21.5%18.3
W 0.4780.4780.492
0.558
M 0.74600.74610.7462
0.7381
YLK-2913751217Number of trees160158138
Intensity21.3%21.1%18.4%
W 0.4950.4960.506
0.570
M 0.73980.73940.7399
0.7334
Disclaimer/Publisher’s Note: The statements, opinions and data contained in all publications are solely those of the individual author(s) and contributor(s) and not of MDPI and/or the editor(s). MDPI and/or the editor(s) disclaim responsibility for any injury to people or property resulting from any ideas, methods, instructions or products referred to in the content.

